Attached files
| file | filename |
|---|---|
| 8-K - 8-K - CF BANKSHARES INC. | cfbk-20200527x8k.htm |
Exhibit 99
Central Federal Corporation Annual Stockholders Meeting Wednesday May 27, 2020 Columbus Cleveland Cincinnati Fairlawn Columbiana County
FORWARD LOOKING STATEMENTS Comments made in this presentation include “forward-looking statements” within the meaning of the Private Securities Litigation Reform Act of 1995 and are made in good faith by us. Forward-looking statements include, but are not limited to:(1)projections of revenues, income or loss, earnings or loss per common share, capital structure and other financial items;(2)plans and objectives of the management or Boards of Directors of Central Federal Corporation(the “Holding Company”)or CFBank, National Association(“CFBank”);(3)statements regarding future events, actions or economic performance; and(4)statements of assumptions underlying such statements. Words such as "estimate,""strategy,""may,""believe,""anticipate,""expect,""predict,""will,""intend,""plan,""targeted,"and the negative of these terms, or similar expressions, are intended to identify forward-looking statements, but are not the exclusive means of identifying such statements. Various risks and uncertainties may cause actual results to differ materially from those indicated by our forward-looking statements. For factors that could cause actual results to differ from our forward-looking statements, please refer to the “Risk Factors” in the Company’s Annual Report on Form 10-K, Quarterly Reports on Form 10-Q and other reports filed with the SEC.
COVID 19 IMPACT While it is still too soon to know, the impact of COVID-19 on CFBank will depend upon many factors, including the speed of economic recovery and the individual characteristics of each borrower/guarantor. Our CFBank Credit and Risk Management teams are very diligent evaluating and targeting customers most likely to need additional help. As of April 30, 2020, we had received payment deferral requests from 45 Commercial clients totaling approximately $86.7 million (or approximately 10.65% of our total Commercial Loan Portfolio) and 45 Consumer clients totaling approximately $13.4 million (or approximately 8.78% of our total Consumer Loan Portfolio).Our Credit Quality was strong prior to COVID-19. Our business model and focus has always been targeting strong borrowers both Business borrowers and Mortgage borrowers alike. Our expectation is that we will be provisioning additional amounts going forward to be determined based upon our ongoing evaluations and assessments of the impact of COVID-19 upon our borrowing customers. We are well capitalized, with a $7 million allowance for loan and lease losses and zero net charge-offs for 6 consecutive years (thru 2019). We also have cushion of additional capital available from our Holding Company’s cash and its line of credit that we can draw upon if needed
Mortgage Lending Current Status: During the first quarter of 2020, there was a meaningful negative impact on our earnings due to disruptions in the market for residential mortgages. Subsequent to March 31, 2020, we have seen encouraging signs of market stabilization, although future trends and results remain difficult to predict in these uncertain times. Interest Margins & Earnings: Rate cuts along with low rates and a flat yield curve create a more challenging operating environment. We are aggressively repricing deposits; along with focusing on Fee income, including the generation of Fee income from Loan SWAPs, SBA Lending and other business products, Treasury Management services and Mortgage Lending. We have demonstrated good traction and results in these Fee income areas. For example, our Non-Interest Income was up 103% during Q1 2020 vs Q1 2019. PPP Lending Fee Income: We expect our PPP lending income to give us a meaningful earnings lift for 2020. Income is recognized based upon the term of the loans, which is initially 2 years, however, we expect the PPP loan forgiveness provisions will result in shortening of these initial loan terms. Also, through our active participation in this program we became acquainted with a number of “new to us” businesses which we believe and expect to translate into additional new deposit and business opportunities. As of May 15, 2020, we had originated approximately 550 PPP Loans in Ohio totaling approximately $129 million.
BUSINESS OPPORTUNITIES Moving forward Low risk business opportunities targeted include SBA and Main Street Lending programs along with Home Mortgage Lending and Cash Management products & services.
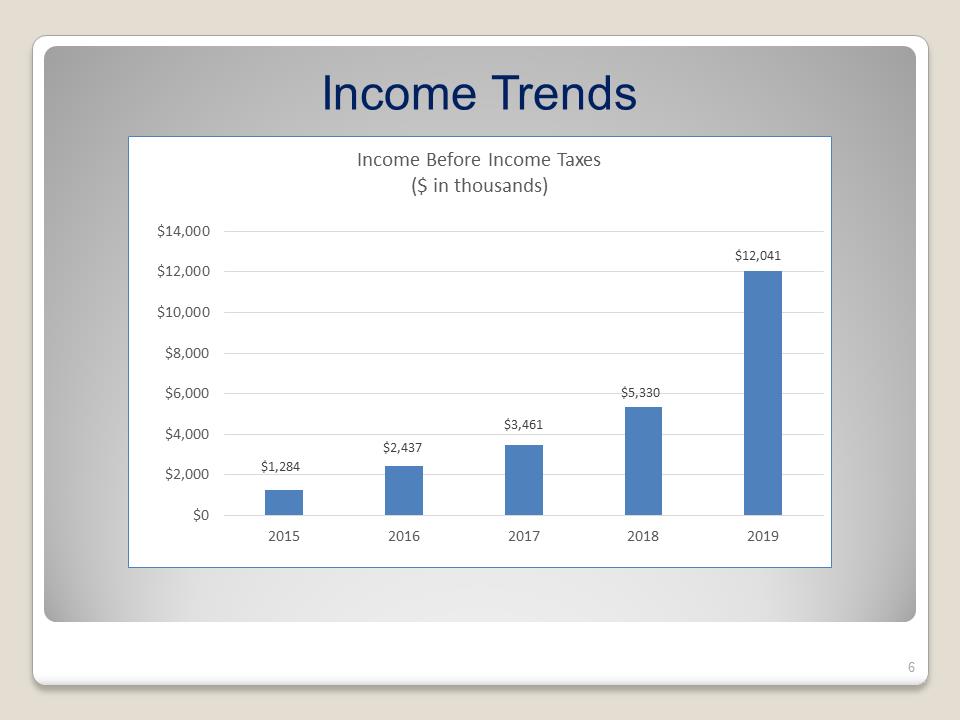
Income Trends Income Before Income Taxes ($ in thousands) $1,284 $2,437 $3,461 $5,330 $12,041 $0 $2,000 $4,000 $6,000 $8,000 $10,000 $12,000 $14,000 2015 2016 2017 2018 2019
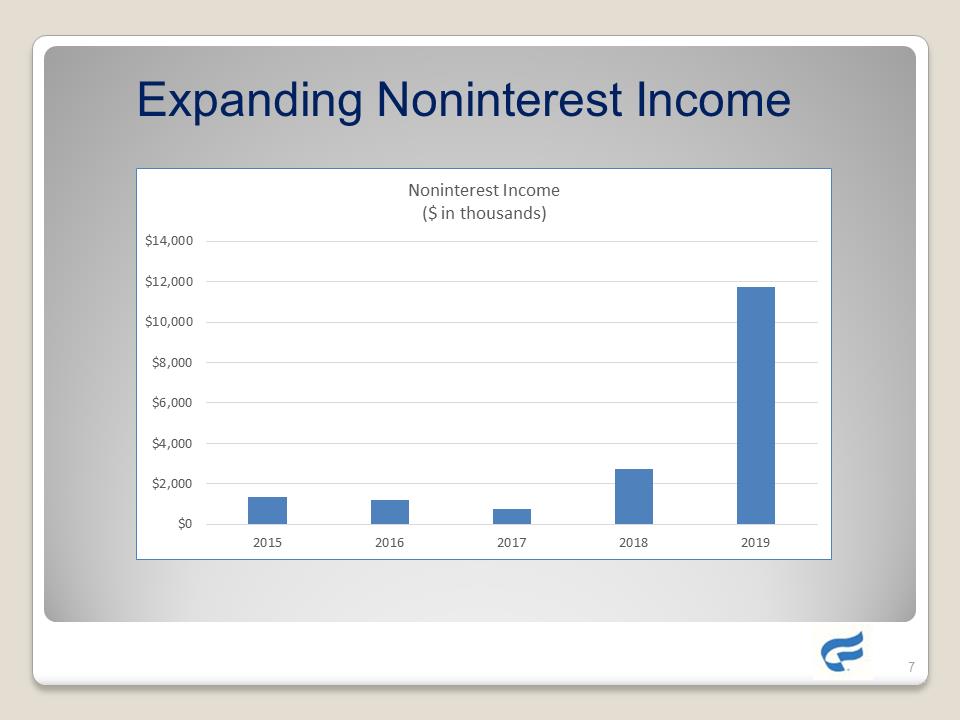
Expanding Noninterest Income Noninterest Income ($ in thousands) $0 $2,000 $4,000 $6,000 $8,000 $10,000 $12,000 $14,000 2015 2016 2017 2018 2019
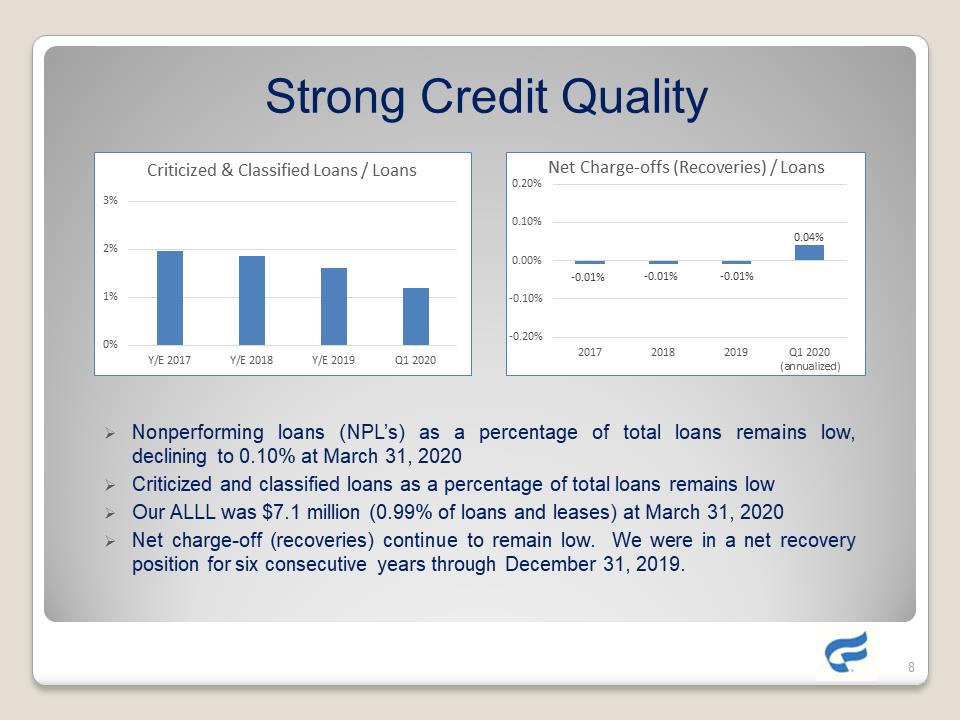
Strong Credit Quality 0% 1% 2% 3% Y/E 2017 Y/E 2018 Y/E 2019 Q1 2020 Criticized & Classified Loans / Loans Net Charge-offs (Recoveries) / Loans -0.01% -0.01% -0.01% 0.04% -0.20% -0.10% 0.00% 0.10% 0.20% 2017 2018 2019 Q1 2020(annualized) Nonperforming loans (NPL’s) as a percentage of total loans remains low, declining to 0.10% at March 31, 2020 Criticized and classified loans as a percentage of total loans remains low Our ALLL was $7.1 million (0.99% of loans and leases) at March 31, 2020 Net charge-off (recoveries) continue to remain low. We were in a net recovery position for six consecutive years through December 31, 2019.
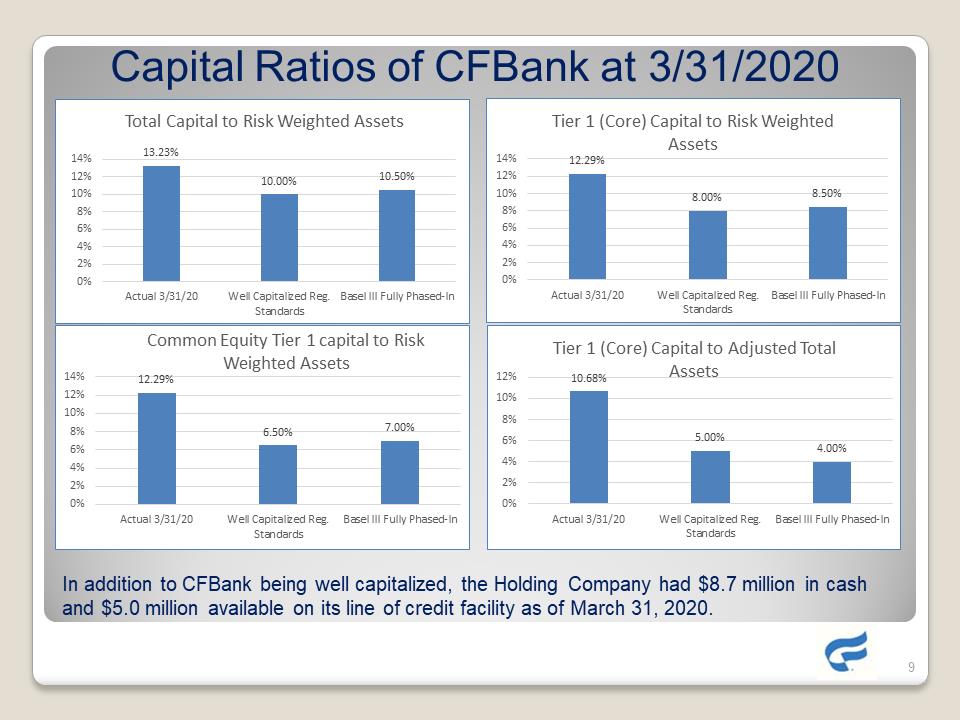
In addition to CFBank being well capitalized, the Holding Company had $8.7 million in cash and $5.0 million available on its line of credit facility as of March 31, 2020.13.23% 10.00% 10.50% 0% 2% 4% 6% 8% 10% 12% 14% Actual 3/31/20, Well Capitalized Reg.Standards Basel III Fully Phased-In Total Capital to Risk Weighted Assets 12.29% 8.00% 8.50% 0% 2% 4% 6% 8% 10% 12% 14% Actual 3/31/20 Well Capitalized Reg.Standards Basel III Fully Phased-In Tier 1 (Core) Capital to Risk Weighted Assets 12.29% 6.50% 7.00% 0% 2% 4% 6% 8% 10% 12% 14% Actual 3/31/20 Well Capitalized Reg. Standards Basel III Fully Phased-In Common Equity Tier 1 capital to Risk Weighted Assets 10.68% 5.00% 4.00% 0% 2% 4% 6% 8% 10% 12% Actual 3/31/20 Well Capitalized Reg.Standards Basel III Fully Phased-In Tier 1 (Core) Capital to Adjusted Total Assets
1st Quarter 2020 Highlights Net Income Increased by 19% vs. 1st Qtr.2019 to $2.0 million Book Value per common share increased $0.45 to $12.85 per share during the quarter Noninterest income increased by 103% vs 1stQtr. 2019 Assets topped $900 million at March 31, 2020