Attached files
| file | filename |
|---|---|
| EX-23.1 - EX-23.1 - Warner Music Group Corp. | d833365dex231.htm |
| EX-10.40 - EX-10.40 - Warner Music Group Corp. | d833365dex1040.htm |
| EX-10.2 - EX-10.2 - Warner Music Group Corp. | d833365dex102.htm |
| EX-10.1 - EX-10.1 - Warner Music Group Corp. | d833365dex101.htm |
| EX-5.1 - EX-5.1 - Warner Music Group Corp. | d833365dex51.htm |
| EX-4.1 - EX-4.1 - Warner Music Group Corp. | d833365dex41.htm |
| EX-3.5 - EX-3.5 - Warner Music Group Corp. | d833365dex35.htm |
| EX-3.4 - EX-3.4 - Warner Music Group Corp. | d833365dex34.htm |
| EX-1.1 - EX-1.1 - Warner Music Group Corp. | d833365dex11.htm |
Table of Contents
As filed with the Securities and Exchange Commission on May 26, 2020
Registration No. 333-236298
UNITED STATES
SECURITIES AND EXCHANGE COMMISSION
WASHINGTON, D.C. 20549
AMENDMENT NO. 2 TO
FORM S-1
REGISTRATION STATEMENT
UNDER THE
SECURITIES ACT OF 1933
Warner Music Group Corp.
(Exact Name of Registrant as Specified in its Charter)
| Delaware | 7900 | 13-4271875 | ||
| (State or Other Jurisdiction of Incorporation or Organization) |
(Primary Standard Industrial Classification Code Number) |
(I.R.S. Employer Identification Number) |
1633 Broadway
New York, New York 10019
(212) 275-2000
(Address, including zip code, and telephone number, including area code, of registrant’s principal executive offices)
Paul M. Robinson, Esq.
Executive Vice President and General Counsel and Secretary
Trent N. Tappe, Esq.
Senior Vice President, Deputy General Counsel and Chief Compliance Officer
1633 Broadway
New York, New York 10019
(212) 275-2000
(Name, address, including zip code, and telephone number, including area code, of agent for service)
Copies to:
| Matthew E. Kaplan, Esq. Eric T. Juergens, Esq. Debevoise & Plimpton LLP 919 Third Avenue New York, New York 10022 (212) 909-6000 |
Michael Kaplan, Esq. Derek Dostal, Esq. Davis
Polk & Wardwell LLP |
Approximate date of commencement of proposed sale of the securities to the public: As soon as practicable after this registration statement becomes effective.
If any of the securities being registered on this Form are to be offered on a delayed or continuous basis pursuant to Rule 415 under the Securities Act of 1933, check the following box. ☐
If this Form is filed to register additional securities for an offering pursuant to Rule 462(b) under the Securities Act, please check the following box and list the Securities Act registration statement number of the earlier effective registration statement for the same offering. ☐
If this Form is a post-effective amendment filed pursuant to Rule 462(c) under the Securities Act, check the following box and list the Securities Act registration statement number of the earlier effective registration statement for the same offering. ☐
If this Form is a post-effective amendment filed pursuant to Rule 462(d) under the Securities Act, check the following box and list the Securities Act registration statement number of the earlier effective registration statement for the same offering. ☐
Indicate by check mark whether the registrant is a large accelerated filer, an accelerated filer, a non-accelerated filer, smaller reporting company, or an emerging growth company. See the definitions of “large accelerated filer,” “accelerated filer,” “smaller reporting company,” and “emerging growth company” in Rule 12b-2 of the Exchange Act.
| Large accelerated filer | ☐ | Accelerated filer ☐ | ||
| Non-accelerated filer | ☒ | Smaller reporting company ☐ | ||
| Emerging growth company ☐ | ||||
If an emerging growth company, indicate by check mark if the registrant has elected not to use the extended transition period for complying with any new or revised financial accounting standards provided pursuant to Section 7(a)(2)(B) of the Securities Act. ☐
CALCULATION OF REGISTRATION FEE
|
| ||||||||
| Title of Each Class of Securities to be Registered |
Amount to be |
Proposed Offering Price Per Share |
Proposed Offering Price(1)(2) |
Amount of Registration Fee(3) | ||||
| Class A common stock, par value $0.001 per share |
80,500,000 | $26.00 | $2,093,000,000 | $271,671.40 | ||||
|
| ||||||||
|
| ||||||||
| (1) | Includes shares/offering price of shares that may be sold upon exercise of the underwriters’ option to purchase additional shares. |
| (2) | This amount represents the proposed maximum aggregate offering price of the securities registered hereunder. These figures are estimated solely for the purpose of calculating the amount of the registration fee pursuant to Rule 457(a) under the Securities Act of 1933, as amended. |
| (3) | The registrant previously paid $12,980 of this amount. |
The registrant hereby amends this registration statement on such date or dates as may be necessary to delay its effective date until the registrant shall file a further amendment which specifically states that this registration statement shall thereafter become effective in accordance with Section 8(a) of the Securities Act of 1933 or until the registration statement shall become effective on such date as the U.S. Securities and Exchange Commission, acting pursuant to said Section 8(a), may determine.
Table of Contents
The information in this preliminary prospectus is not complete and may be changed. The selling stockholders may not sell these securities until the U.S. Securities and Exchange Commission declares our registration statement effective. This preliminary prospectus is not an offer to sell these securities and it is not soliciting offers to buy these securities in any state or jurisdiction where the offer or sale is not permitted.
SUBJECT TO COMPLETION, DATED MAY 26, 2020
70,000,000 Shares

Warner Music Group Corp.
Class A Common Stock
This is the initial public offering of shares of Class A common stock of Warner Music Group Corp.
The selling stockholders identified in this prospectus are offering 70,000,000 shares of Class A common stock in this offering. We will not receive any of the proceeds from the sale of the shares being sold by the selling stockholders in this offering, including any shares they may sell pursuant to the underwriters’ option to purchase additional Class A common stock.
Upon completion of this offering, we will have two classes of common stock, Class A common stock and Class B common stock. Each share of Class A common stock is entitled to one vote per share. Each share of Class B common stock is entitled to 20 votes per share. Holders of our Class A common stock and Class B common stock vote together as a single class on all matters, except as otherwise set forth in this prospectus or as required by applicable law. Each outstanding share of Class B common stock will convert automatically into one share of Class A common stock upon any transfer, except for certain exceptions and permitted transfers described in our amended and restated certificate of incorporation. The Class B common stock, which is held by Access Industries, LLC and certain of its affiliates, will represent approximately 99.2% of the total combined voting power of our outstanding common stock following this offering (or approximately 99.1% of the total combined voting power of our outstanding common stock if the underwriters exercise in full their option to purchase additional shares of our Class A common stock).
Prior to this offering, there has been no public market for our Class A common stock. We have been approved to list our Class A common stock on The Nasdaq Stock Market LLC (“Nasdaq”), under the symbol “WMG”.
We anticipate that the initial public offering price will be between $23.00 and $26.00 per share.
After the completion of this offering, we will be a “controlled company” within the meaning of the corporate governance standards of Nasdaq.
Investing in our Class A common stock involves risks. See “Risk Factors” beginning on page 23 of this prospectus to read about factors you should consider before buying shares of our Class A common stock.
| Per Share | Total | |||||||
| Initial public offering price |
$ | $ | ||||||
| Underwriting discounts and commissions (1) |
$ | $ | ||||||
| Proceeds, before expenses, to the selling stockholders |
$ | $ | ||||||
| (1) | We have agreed to reimburse the underwriters for certain expenses in connection with this offering. See “Underwriting.” |
The underwriters also may purchase up to 10,500,000 additional shares from the selling stockholders at the initial offering price less the underwriting discounts and commissions, within 30 days from the date of this prospectus.
Neither the U.S. Securities and Exchange Commission nor any state securities commission has approved or disapproved the securities described herein or determined if this prospectus is truthful or complete. Any representation to the contrary is a criminal offense.
The underwriters expect to deliver the shares to purchasers on or about , 2020.
| Morgan Stanley | Credit Suisse | Goldman Sachs & Co. LLC | BofA Securities | Citigroup | J.P. Morgan |
| Barclays | Evercore ISI | Guggenheim Securities | Macquarie Capital | Nomura | RBC Capital Markets | |||||
| SunTrust Robinson Humphrey | CIBC Capital Markets | HSBC | SOCIETE GENERALE | LionTree | The Raine Group | |||||
| AmeriVet Securities | Bancroft Capital | Blaylock Van, LLC | C.L. King & Associates |
Loop Capital Markets | ||||
| Roberts & Ryan | Ramirez & Co., Inc. | Siebert Williams Shank | Telsey Advisory Group |
Tigress Financial Partners | ||||
Prospectus dated , 2020
Table of Contents

Warner Records wea Sire RHINO REPRISE RECORDS ROADRUNNER Parlophone nonesuch fueled by ramen Elektra music group big Beat atlantic asylum ada
Table of Contents
| i | ||||
| 1 | ||||
| 23 | ||||
| Special Note Regarding Forward-Looking Statements and Information |
47 | |||
| 50 | ||||
| 51 | ||||
| 52 | ||||
| 54 | ||||
| 56 | ||||
| Management’s Discussion and Analysis of Financial Condition and Results of Operations |
57 | |||
| 109 | ||||
| 127 | ||||
| 137 | ||||
| 158 | ||||
| 161 | ||||
| 167 | ||||
| 176 | ||||
| Material U.S. Federal Tax Considerations For Non-U.S. Holders |
178 | |||
| 182 | ||||
| 191 | ||||
| 191 | ||||
| 191 | ||||
| F-1 |
We have not, and the selling stockholders and the underwriters have not, authorized anyone to provide you with information different from, or in addition to, that contained in this prospectus and any related free writing prospectus. We, the selling stockholders and the underwriters take no responsibility for, and can provide no assurances as to the reliability of, any information that others may give you. This prospectus is an offer to sell only the shares offered hereby, but only under circumstances and in jurisdictions where it is lawful to do so. The information contained in this prospectus is only accurate as of the date of this prospectus, regardless of the time of delivery of this prospectus and any sale of shares of our common stock.
We use the following capitalized terms in this prospectus:
| • | “A&R” means Artists and Repertoire, which is the department at a recorded music company or a music publishing company that is responsible for talent scouting and overseeing the artistic development of recording artists and songwriters. |
| • | “Access” means Access Industries, LLC, a Delaware limited liability company, and its affiliates, certain of which are our controlling stockholders. |
| • | “Acquisition Corp.” means WMG Acquisition Corp., a Delaware corporation, and a direct wholly owned subsidiary of Holdings. |
| • | “common stock” means our Class A common stock and our Class B common stock, collectively. |
| • | “constant currency” refers to information that compares financial metrics between periods as if exchange rates had remained constant period over period. See “Management’s Discussion and Analysis of Financial Condition and Results of Operations—Key Operating Measures—Constant Currency.” |
i
Table of Contents
| • | “Holdings” means WMG Holdings Corp., a Delaware corporation, and a direct wholly owned subsidiary of WMG. |
| • | “Merger” means the merger, dated July 20, 2011, of Airplanes Merger Sub, Inc. with and into WMG with WMG surviving as an indirect wholly owned subsidiary of Access, pursuant to the Agreement and Plan of Merger dated as of May 6, 2011, by and among WMG, AI Entertainment Holdings LLC (formerly Airplanes Music LLC), an affiliate of Access, and Airplanes Merger Sub, Inc. |
| • | “Revolving Credit Agreement” means the revolving credit agreement, dated as of January 31, 2018, as amended or supplemented, among Acquisition Corp., Credit Suisse AG, as administrative agent, and the other financial institutions and lenders from time to time party thereto. |
| • | “Secured Notes” means, collectively, the 5.000% Senior Secured Notes due 2023 (the “5.000% Secured Notes”), the 4.125% Senior Secured Notes due 2024 (the “4.125% Secured Notes”), the 4.875% Senior Secured Notes due 2024 (the “4.875% Secured Notes”) and the 3.625% Senior Secured Notes due 2026 (the “3.625% Secured Notes”). |
| • | “Secured Notes Indenture” means the Indenture, dated as of November 1, 2012 (the “Senior Secured Base Indenture”), among Acquisition Corp., the guarantors party thereto, Credit Suisse AG, as Notes Authorized Agent and Collateral Agent, and Wells Fargo Bank, National Association, as trustee (the “Trustee”), as supplemented by the Fifth Supplemental Indenture, dated as of July 27, 2016 (the “5.000% Supplemental Indenture”), as supplemented by the Sixth Supplemental Indenture, dated as of October 18, 2016 (the “4.875% Supplemental Indenture”), as supplemented by the Seventh Supplemental Indenture, dated as of October 18, 2016 (the “4.125% Supplemental Indenture”), as supplemented by the Eighth Supplemental Indenture, dated as of October 9, 2018 (the “3.625% Supplemental Indenture”), and as supplemented by the Ninth Supplemental Indenture, dated as of April 30, 2019 (the “Additional 3.625% Supplemental Indenture”), in each case, among Acquisition Corp., the guarantors party thereto and the Trustee. |
| • | “selling stockholders” means (i) Altep 2012 L.P., WMG Management Holdings, LLC, AI Entertainment Holdings LLC and AI Entertainment Management, LLC (together, the “Firm Selling Stockholders”) and (ii)(a) one or more series of Blavatnik Family Foundation LLC (“BFFLLC”), to the extent that one or more such series receives a contribution of shares of Class B common stock in connection with this offering from Access Industries, LLC and is authorized by its member(s) to sell shares of Class A common stock in this offering, (b) CT/FT Holdings LLC, Blavatnik July 2019-13 Investment Trust and Alex Blavatnik, to the extent that such stockholders decide to sell shares of Class A common stock in this offering (such shares, together with the shares of Class A common stock in clause (ii)(a), “Contingent Sale Shares”) and (c)(1) either or both of Access Industries, LLC and AI Entertainment Holdings LLC, to the extent any series of BFFLLC does not receive a contribution of shares of Class B common stock from Access Industries, LLC or any series of BFFLLC does not sell all of its Contingent Sale Shares and (2) AI Entertainment Holdings LLC, to the extent that any stockholder named in clause (ii)(b) does not sell all of its Contingent Sale Shares. |
| • | “Senior Credit Facilities” means the Senior Term Loan Facility (as defined in “Management’s Discussion and Analysis of Financial Condition and Results of Operations—Financial Condition and Liquidity—Liquidity—Senior Term Loan Facility”) together with the Revolving Credit Facility (as defined in “Management’s Discussion and Analysis of Financial Condition and Results of Operations—Financial Condition and Liquidity—Liquidity—Revolving Credit Facility”). |
| • | “Senior Notes Indenture” means the Indenture, dated as of April 9, 2014 (the “Senior Notes Base Indenture”), among Acquisition Corp., the guarantors party thereto and the Trustee, as supplemented by the Fifth Supplemental Indenture thereto, dated as of March 14, 2018 (the “Senior Notes Supplemental Indenture”), among Acquisition Corp., the guarantors party thereto and the Trustee. |
| • | “Senior Term Loan Credit Agreement” means the credit agreement, dated November 1, 2012, as amended or supplemented, among Acquisition Corp., Credit Suisse AG, as administrative agent and collateral agent, and the other financial institutions and lenders from time to time party thereto. |
ii
Table of Contents
| • | “Warner Music Group” or “WMG” means Warner Music Group Corp., a Delaware corporation, without its consolidated subsidiaries. |
| • | “we,” “us,” “our” and the “Company” mean Warner Music Group Corp. and its consolidated subsidiaries, unless the context refers only to Warner Music Group Corp. as a corporate entity. |
MARKET AND INDUSTRY DATA
This prospectus includes estimates regarding market and industry data and forecasts, including industry size, share of industry sales, industry position, growth rates and penetration rates, which are based on publicly available information, industry publications and surveys, reports from government agencies, reports by market research firms and our own estimates based on our management’s knowledge of, and experience in, the music entertainment industry and market segments in which we compete. Third-party industry publications and forecasts generally state that the information contained therein has been obtained from sources generally believed to be reliable. The third-party industry sources referenced in this prospectus include, among others, the International Federation of the Phonographic Industry (“IFPI”), Nielsen, Music & Copyright, MIDiA and Billboard. Our estimates involve risks and uncertainties and are subject to change based on various factors, including those discussed under the captions “Risk Factors,” “Special Note Regarding Forward-Looking Statements and Information” and “Management’s Discussion and Analysis of Financial Condition and Results of Operations.”
SERVICE MARKS, TRADEMARKS AND TRADE NAMES
We own various service marks, trademarks and trade names, such as Asylum, Atlantic, Elektra, EMP, Parlophone, Reprise, Rhino, Sire, SPINNIN’ RECORDS, Warner Chappell and WEA, and license various service marks, trademarks and trade names, such as WARNER, WARNER MUSIC, WARNER RECORDS and the “W” logo, that we deem particularly important to our business. This prospectus also contains trademarks, service marks and trade names of other companies which are the property of their respective owners. We do not intend our use or display of such names or marks to imply relationships with, or endorsements of us by, any other company.
PRESENTATION OF FINANCIAL INFORMATION
We have made rounding adjustments to some of the figures included in this prospectus. Accordingly, numerical figures shown as totals in some tables may not be an arithmetic aggregation of the figures that precede them. Unless otherwise indicated, all references to “U.S. dollars,” “dollars,” “U.S. $” and “$” in this prospectus are to the lawful currency of the United States of America.
In this prospectus, we present certain financial measures that are not calculated in accordance with accounting principles generally accepted in the United States of America (“U.S. GAAP”), such measures referred to herein as “non-U.S. GAAP”. You should review the reconciliation and accompanying disclosures carefully in connection with your consideration of such non-U.S. GAAP measures and note that the way in which we calculate these measures may not be comparable to similarly titled measures employed by other companies.
iii
Table of Contents
The following summary highlights selected information contained in this prospectus. Because this is only a summary, it does not contain all of the information you should consider before investing in our Class A common stock. You should carefully read the entire prospectus, including the sections entitled “Risk Factors” and “Management’s Discussion and Analysis of Financial Condition and Results of Operations,” as well as our annual and interim financial statements included elsewhere in this prospectus, before making an investment decision. For the definitions of certain capitalized terms used in this prospectus, please refer to “Certain Important Terms.”
Our Company
We are one of the world’s leading music entertainment companies. Our renowned family of iconic record labels, including Atlantic Records, Warner Records, Elektra Records and Parlophone Records, is home to many of the world’s most popular and influential recording artists. In addition, Warner Chappell Music, our global music publishing business, boasts an extraordinary catalog that includes timeless standards and contemporary hits, representing works by over 80,000 songwriters and composers, with a global collection of more than 1.4 million musical compositions. Our entrepreneurial spirit and passion for music has driven our recording artist and songwriter focused innovation for decades.
Our Recorded Music business, home to superstar recording artists such as Ed Sheeran, Bruno Mars and Cardi B, generated $3.840 billion of revenue in fiscal 2019, representing 86% of total revenues. Our Music Publishing business, which includes esteemed songwriters such as Twenty One Pilots, Lizzo and Katy Perry, generated $643 million of revenue in fiscal 2019, representing 14% of total revenues. We benefit from the scale of our global platform and our local focus.
Today, global music entertainment companies such as ours are more important and relevant than ever. The traditional barriers to widespread distribution of music have been erased. The tools to make and distribute music are at every musician’s fingertips, and today’s technology makes it possible for music to travel around the world in an instant. This has resulted in music being ubiquitous and accessible at all times. Against this industry backdrop, the volume of music being released on digital platforms is making it harder for recording artists and songwriters to get noticed. We cut through the noise by identifying, signing, developing and marketing extraordinary talent. Our global A&R experience and marketing strategies are critical ingredients for recording artists or songwriters who want to build long-term global careers. We believe that the music, not the technology, delights fans and drives the business forward.
Our commercial innovation is crucial to maintaining our momentum. We have championed new business models and empowered established players, while protecting and enhancing the value of music. We were the first major music entertainment company to strike landmark deals with important companies such as Apple, YouTube and Tencent Music Entertainment Group, as well as with pure-play music technology companies such as MixCloud, SoundCloud and Audiomack. We adapted to streaming faster than other major music entertainment companies and, in 2016, were the first such company to report that streaming was the largest source of our recorded music revenue. Looking into the future, we believe the universe of opportunities will continue to expand, including through the proliferation of new devices such as smart speakers and the monetization of music on social media and other platforms. We believe advancements in technology will continue to drive consumer engagement and shape a growing and vibrant music entertainment ecosystem.
We have achieved growth and profitability at scale. For the fiscal years ended September 30, 2019, September 30, 2018 and September 30, 2017, we generated $4.5 billion, $4.0 billion and $3.6 billion in revenue, respectively, representing year-over-year growth of 12% and 12%, respectively. For the fiscal years ended
1
Table of Contents
September 30, 2019, September 30, 2018 and September 30, 2017, we reported net income of $258 million, $312 million and $149 million, respectively. For the fiscal years ended September 30, 2019, September 30, 2018 and September 30, 2017, our Adjusted EBITDA was $737 million, $1,033 million (which includes a pre-tax net gain of $389 million related to the sale of Spotify shares acquired in the ordinary course of business) and $604 million, respectively. Adjusted EBITDA is a non-U.S. GAAP measure. For a discussion of Adjusted EBITDA and a reconciliation to the most closely comparable U.S. GAAP measure, see “Summary Historical Consolidated Financial Data.”
Our History
The Company today consists of individual companies that are among the most respected and iconic in the music industry, with a history that dates back to the establishment of Chappell & Co. in 1811 and Parlophone in 1896.
The Company began to take shape in 1967 when Warner-Seven Arts, the parent company of Warner Records (formerly known as Warner Bros. Records) acquired Atlantic Records, which discovered artists such as Led Zeppelin and Aretha Franklin. In 1969, Kinney National Company acquired Warner-Seven Arts, and in 1970, Kinney Services (which was later spun off into Warner Communications) acquired Elektra Records, which was renowned for artists such as The Doors and Judy Collins. In order to harness their collective strength and capabilities, in 1971, Warner Bros., Elektra and Atlantic Records formed a groundbreaking U.S. distribution network commonly known as WEA Corp., or simply WEA, which now stretches across the world.
Throughout this time, the Company’s music publishing division, Warner Bros. Music, built a strong presence. In 1987, the purchase of Chappell & Co. created Warner Chappell Music, one of the industry’s major music publishing forces with a storied history that today connects Ludwig van Beethoven, George Gershwin, Madonna and Lizzo.
The parent company that had grown to become Time Warner completed the sale of the Company to a consortium of private equity investors in 2004, in the process creating the world’s largest independent music company. The Company was taken public the following year, and in 2011, Access acquired the Company.
Since acquiring the Company, Access has focused on revenue growth and increasing operating margins and cash flow combined with financial discipline. Looking past more than a decade of music entertainment industry transitions, Access and the Company foresaw the opportunities that streaming presented for music. Over the last eight years, Access has consistently backed the Company’s bold expansion strategies through organic A&R as well as acquisitions. These strategies include investing more heavily in recording artists and songwriters, growing the Company’s global reach, augmenting its streaming expertise, overhauling its systems and technological infrastructure, and diversifying into other music-based revenue streams.
The purchase of Parlophone Label Group (“PLG”) in 2013 strengthened the Company’s presence in core European territories, with recording artists as diverse as Coldplay, David Bowie, David Guetta and Tinie Tempah. That acquisition was followed by other investments that further strengthened the Company’s footprint in established and emerging markets. Other milestones include the Company’s acquisitions of direct-to-audience businesses such as entertainment specialty e-tailer EMP (as defined in “Management’s Discussion and Analysis of Financial Condition and Results of Operations—Factors Affecting Results of Operations and Comparability—Acquisition of EMP”), live music application Songkick and youth culture platform UPROXX.
Our Industry and Market Opportunity
The music entertainment industry is large, global and vibrant. The recorded music and music publishing industries are growing, driven by consumer and demographic trends in the digital consumption of music.
2
Table of Contents
Consumer Trends and Demographics
Consumers today engage with music in more ways than ever. According to IFPI, global consumers spent 18 hours listening to music each week in 2019. Demographic trends and smartphone penetration have been key factors in driving growth in consumer engagement. Younger consumers typically are early adopters of new technologies, including music-enabled devices. According to Nielsen, in 2019, 58% of teens in the United States between the ages of 13 and 17 and 45% of millennials in the United States between the ages of 18 and 34 used their smartphones to listen to music on a weekly basis, as compared to a 40% average for all U.S. consumers. Furthermore, in 2019, U.S. teens and millennials listened to an average of 32.6 and 29.7 hours of music each week, respectively, above the 26.9 hours for all U.S. consumers.
Members of older demographic groups are also increasing their music engagement. According to an IFPI survey of 19 leading geographic markets in 2019, 54% of 35- to 64-year-olds used a streaming service to listen to music in the past month, representing an increase from 46% in 2018, which was the highest rate of growth for use of streaming services across all age groups.
Music permeates our culture across age groups, as evidenced by the footprint that music has across social media. According to the Recording Industry Association of America (“RIAA”), as of September 2019, 7 out of the top 10 most followed accounts on Twitter belong to musicians, and according to YouTube, the majority of videos that have achieved more than one billion lifetime views as well as the top 10 most watched videos of all time, belong to musicians.
Recorded Music
The recorded music industry generated $20.2 billion in global revenue in 2019 and has consistently grown since 2015, according to IFPI. IFPI measures the recorded music industry based on four revenue categories: digital (including streaming), physical, synchronization and performance rights. Digital is the largest, generating $12.9 billion of revenue in 2019, representing 64% of global recorded music revenue. Within digital, streaming generated approximately 88% of revenue, or $11.4 billion, with the remainder of digital revenue coming from other formats such as downloads. Overall, digital grew by 18% in 2019, with streaming increasing by 24%.
Physical represented approximately 22% of global recorded music revenue in 2019, with growth in formats such as vinyl partially offsetting declines in CD sales. Performance rights revenue represents the use of recorded music by broadcasters and public venues, and represented approximately 13% of global recorded music revenue in 2019. Synchronization revenue is generated from the use of recorded music in advertising, film, video games and television content, and represented 2% of global recorded music revenue in 2019. According to IFPI, global recorded music revenue has grown at a 9% CAGR since 2015.
We believe the following secular trends will continue to drive growth in the recorded music industry:
Streaming Still in Early Stages of Global Adoption and Penetration
According to IFPI, global paid music streaming subscribers totaled 341 million at the end of 2019. While this represents an increase of 34% from 255 million in 2018, it still represents less than 11% of the 3.2 billion smartphone users globally, according to Statista. It also represents a small fraction of the user bases for large, globally scaled digital services such as Facebook, which reported 2.6 billion monthly users across its services as of April 2020, and YouTube, which reported over two billion unique monthly users as of May 2020. On-demand streaming (both audio and video) reached 1.15 trillion streams in the United States in 2019, according to Nielsen, and this growth is expected to continue. According to Statista, as of March 16, 2020, 12% of adults (calculated across four demographic cohorts—Generation Z, Millennials, Generation X and Baby Boomers) reported that they are likely to spend more on music streaming due to the COVID-19 pandemic.
3
Table of Contents
The potential of global paid streaming subscriber growth is demonstrated by the penetration rates in early adopter markets. Approximately 30% of the population in Sweden, where Spotify was founded, was estimated to be paid music subscribers in 2018, according to MIDiA. This compares to approximately 25% and 16% for established markets such as the United States and Germany, respectively. Moreover, paid digital music subscribers in Japan, the world’s second-largest recorded music market in 2018 according to IFPI, still only represented approximately 7% of the population, according to MIDiA. There also remains substantial opportunity in emerging markets, such as Brazil and India, where smartphone penetration is low compared to developed markets. For example, according to Statista, smartphone penetration for Brazil and India as of September 2019 was 46% and 25%, respectively, compared to 79% in the United States.
China, in particular, represents a substantial growth market for the recorded music industry. According to IFPI, paid streaming models are at an early stage in China, with an estimated 33 million paid subscribers in 2018, representing only 2% of China’s population of over 1.4 billion. Despite its substantial population, China was the world’s seventh-largest music market in 2019, having only broken into the top 10 in 2017.
Opportunities for Improved Streaming Pricing
In addition to paid subscriber growth, we believe that, over time, streaming revenues will increase due to pricing increases as the broader market further develops. Streaming services are already at the early stages of experimenting with price increases. For example, in 2018, Spotify increased monthly prices for its service in Norway. In addition, in 2019, Amazon launched Amazon Music HD, a high-quality audio streaming offering that is available to customers at a premium price in the United States. We believe the value proposition that streaming provides to consumers supports premium product initiatives.
Technology Enables Innovation and Presents Additional Opportunities
Technological innovation has helped facilitate the penetration of music listening across locations, including homes, offices and cars, as well as across devices, including smartphones, tablets, wearables, digital dashboards, gaming consoles and smart speakers. These technologies represent advancements that are deepening listener engagement and driving further growth in music consumption.
Device Innovation. According to Nielsen, as of August 2019, U.S. consumers listened to music across an average of 4.1 devices per week. We believe that the use of multiple devices is expanding listening hours by bringing music into more moments of consumers’ lives, and the different uses these devices enable are also broadening the base of music to which consumers are exposed. The music that consumers listen to during a commute may be different than the music they listen to while they exercise, and different still than the music they play through a smart speaker while cooking a meal. Smart speakers enable consumers to access music more readily by using their voices. According to PwC, smart speaker ownership is expected to increase at a 38% CAGR from 2018 through 2023, to 440 million devices globally in 2023. The adoption of smart speakers in the United States has been strong, and according to Nielsen, 31% of music listeners today own smart speakers. Smart speakers are fueling further growth in streaming, by converting more casual listeners into paid subscribers, drawn in by music as a critical application for these devices. According to Nielsen, 61% of U.S. consumers who use a smart speaker weekly to listen to music currently pay for a subscription as well.
Format and Monetization Model Innovation. Short-form music and music-based video content has grown rapidly, driven by the growth of global social video applications such as TikTok, which features 15-second videos often set to music. TikTok has reportedly been downloaded more than one billion times since its launch in 2017 and has a global reach of 500 million users, according to Nielsen. Such applications have the potential for mass adoption, illustrating the opportunity for additional platforms of scale to be created to the benefit of the music entertainment industry. These platforms enable incremental consumption of music appealing to varied, and
4
Table of Contents
often younger, audiences. From a recording artist’s perspective, these platforms have the potential to rewrite the path to stardom. For example, our recording artist, Fitz & the Tantrums, an American band, rose to international fame in 2018 as their song “HandClap” went viral in Asia on TikTok. Fitz & the Tantrums quickly topped the international music charts in South Korea and surpassed one billion streams in China. Short-form music and music-based video content have also become increasingly popular on social media platforms such as Facebook and Instagram, further illustrating the growing number of potential pathways through which recording artists may gain consumer exposure.
Music Publishing
According to Music & Copyright, the music publishing industry generated $5.6 billion in global revenue in 2019, representing an approximate 2% increase from $5.5 billion in 2018 (following an increase in global music publishing revenues of 11% from 2017 to 2018). Music publishing involves the acquisition of rights to, and the licensing of, musical compositions (as opposed to sound recordings) from songwriters, composers or other rightsholders. Music publishing revenues are derived from four main royalty sources: mechanical, performance, synchronization and digital. In 2019, digital, which accounted for approximately 42% of global revenue, represented the largest and fastest-growing component of industry revenues, while performance, which accounted for approximately 30%, represented the second-largest component of industry revenues. Synchronization accounted for approximately 19% of global revenue in 2019. Mechanical revenues from traditional physical music formats (e.g., CDs, DVDs, downloads), which accounted for approximately 8% of global revenue in 2019, have continued to fall while digital revenues have grown to offset this decline.
Positive Regulatory Trends
The music industry has benefitted from positive regulatory developments in recent years, which are expected to lead to increased revenues for the music entertainment industry in the coming years. These include the 2018 U.S. Music Modernization Act (“MMA”), the 2018 SDARS III and Phonorecords III Copyright Royalty Board (“CRB”) proceedings and the 2019 European Union (“E.U.”) Copyright Directive. See “Business—Our Industry and Market Opportunity—Positive Regulatory Trends” for additional information.
Our Competitive Strengths
Well-Positioned to Benefit from Growth in the Global Music Market Driven by Streaming. The music entertainment industry has undergone a transformation in the consumption and monetization of content towards streaming over the last five years. According to IFPI, from 2015 through 2019, global recorded music revenue grew at a CAGR of 9%, with streaming revenue growing at a CAGR of 42% and increasing as a percentage of global recorded music revenue from 19% to 56% over the same period. By comparison, from fiscal year 2015 to fiscal year 2019, our recorded music streaming revenue grew at a CAGR of 37% and increased as a percentage of our total recorded music revenues from 24% to 55%. We believe our innovation-focused operating strategy with an emphasis on genres that over-index on streaming platforms (e.g., hip-hop and pop) has consistently allowed our digital revenue growth to outpace the market, highlighted by our becoming the first major music entertainment company to report that our streaming revenue was the largest source of recorded music revenue in 2016.
The growth of streaming services has not only improved the discoverability and personalization of music, but has also increased consumer willingness to pay for seamless convenience and access. We believe consumer adoption of paid streaming services still has significant potential for growth. For example, according to MIDiA, in 2018, approximately 30% of the population in Sweden, an early adopter market, was paid music subscribers. This illustrates the opportunity to drive long-term growth by increasing penetration of paid subscriptions throughout the world, including important markets such as the United States, Japan, Germany, the United Kingdom and France, where paid subscriber levels are lower. Our catalog and roster of recording artists and songwriters, including our strengths in hip-hop and pop music, position us to benefit as streaming continues to
5
Table of Contents
grow. We also believe our diversified catalog of evergreen music amassed over many decades will prove advantageous as demographics evolve from younger early adopters to a wider demographic mix and as digital music services target broader audiences.
Established Presence in Growing International Markets, Including China. We believe we will benefit from the growth in international markets due to our local A&R focus, as well as our local and global marketing and distribution infrastructure that includes a network of subsidiaries, affiliates, and non-affiliated licensees and sub-publishers in more than 70 countries. We are developing local talent to achieve regional, national and international success. We have expanded our global footprint over time by acquiring independent recorded music and music publishing businesses, catalogs and recording artist and songwriter rosters in China, Indonesia, Poland, Russia and South Africa, among other markets. In addition, we have increased organic investment in heavily populated emerging markets by, for example, launching Warner Music Middle East, our recorded music affiliate covering 17 markets across the Middle East and North Africa with a total population of 380 million people. We have also strengthened our Warner Music Asia executive team with new appointments and promotions. According to IFPI in 2018, recorded music industry revenues in Asia and Australasia grew 12% year-over-year. Over the same period and on a constant-currency basis, we grew revenues in Asia and Australasia by 21%, again outpacing the industry.
With every region around the world at different stages in transitioning to digital formats, we believe establishing creative hubs by opening new regional offices and partnering with local players will achieve our objective of building local expertise while delivering maximum global impact for our recording artists and songwriters. For example, we recently invested in one of Nigeria’s leading music entertainment companies, Chocolate City, and music from this influential independent company’s recording artists and songwriters will join our repertoire and receive the support of our wide-ranging global expertise, including distribution and artist services.
Differentiated Platform of Scale with Top Industry Position. With over $4 billion in annual revenues, over half of which are generated outside of the United States, we believe our platform is differentiated by the scale, reach and broad appeal of our music. Our collection of owned and controlled recordings and musical compositions, spanning a large variety of genres and geographies over many decades, cannot be replicated. As one of three major music entertainment companies, our industry position remains strong and poised for continued growth. As reported in Music & Copyright, our global recorded music market share has increased approximately 6% from 2011 to 2019, growing from 15.1% to 16.0%. In addition, according to Nielsen, Atlantic Records was the No. 1 record label on the Billboard 200 in the United States in 2017, 2018 and 2019.
Star-Making, Culture-Defining Core Capabilities. For decades, our A&R strategy of identifying and nurturing recording artists and songwriters with the talents to be successful has yielded an extensive catalog of iconic music across a wide breadth of musical genres and marquee brands all over the world. Our marketing and promotion departments provide a comprehensive suite of solutions that are specifically tailored to each of our recording artists and carefully coordinated to create the greatest sales momentum for new and catalog releases alike. The development of our vibrant roster of recording artists has been informed by our significant experience in being able to adapt to changes in consumer trends and sentiment over time. Our creative instincts yield custom strategies for each and every one of our recording artists, including, for example:
| • | Cardi B, whose first Atlantic Records single “Bodak Yellow” was a break-out hit that has been certified nine times Platinum in the United States by the RIAA; |
| • | Twenty One Pilots, whose rise to stardom accelerated with the release of their second Fueled by Ramen studio album, Blurryface; and |
| • | Portugal. The Man, which celebrated its first entry on the Billboard Hot 100 chart after the release of their eighth studio album, Woodstock, featuring the track “Feel It Still.” |
6
Table of Contents
In addition, Warner Chappell Music boasts a diversified catalog of timeless classics together with an ever-growing group of contemporary songwriters who are actively contributing to today’s top hits. We believe our longstanding reputation and relationships in the creative community, as well as our historical success in talent development and management, will continue to attract new recording artists and songwriters with staying power and market potential through the strength and scale of our proprietary capabilities.
Strong Financial Profile with Robust Growth, Operating Leverage and Free Cash Flow Generation. For fiscal year 2017 through fiscal year 2019, we have grown as-reported revenues at a CAGR of 12%, and on a constant-currency basis, at a CAGR of 10%, driven by secular tailwinds, organic reinvestment in A&R and strategic acquisitions. For our fiscal year 2019, our business generated net income and Adjusted EBITDA of $258 million and $737 million, respectively, implying an Adjusted EBITDA margin of approximately 16%. We have an efficient business model as demonstrated by our high Free Cash Flow conversion of Adjusted EBITDA. In fiscal year 2019, we generated $24 million of Free Cash Flow (after taking into account $183 million related to the acquisition of EMP). We believe our financial profile provides a strong foundation for our continued growth.
Experienced Leadership Team and Committed Strategic Investor. Our management team has successfully designed and implemented our business strategy, delivering strong financial results, releasing an increasing flow of new music and establishing a dynamic culture of innovation. At the same time, our management team has driven an increase in operating margins and cash flow through an improved revenue mix to higher-margin digital platforms and overhead cost management, while maintaining financial flexibility to both organically invest in the business and pursue strategic acquisitions to diversify our revenue mix. Our Recorded Music and Music Publishing businesses are led by entrepreneurial and creative individuals with extensive experience in discovering and developing recording artists and songwriters and managing their creative output on a global scale. In addition, we have benefited, and expect to continue to benefit, from our acquisition by Access in July 2011, which has provided us with strategic direction, M&A and capital markets expertise and planning support to help us take full advantage of the ongoing transition in the music entertainment industry.
Expertise in Strategic Acquisitions and Investments That Extend Our Capabilities. Since 2011 when Access became our controlling shareholder, we have completed more than 15 strategic acquisitions. The acquisition of PLG in 2013 significantly strengthened our worldwide roster, global footprint and executive talent, particularly in Europe. In addition, we have made several smaller strategic acquisitions aimed at expanding our artist services capabilities in our Recorded Music business, including EMP, one of Europe’s leading specialty music and entertainment merchandise e-tailers; Sodatone, a premier A&R insight tool; UPROXX, the youth culture and video production powerhouse; Spinnin’ Records, one of the world’s leading independent electronic music companies; and Songkick’s concert discovery application. These transactions showcase the growing breadth of our platform across the music entertainment ecosystem and have increased our direct access to fans of our recording artists and songwriters. In addition to our commercial arrangements with digital music services, we opportunistically invest in some of those services as well as other companies in our industry, including minority equity stakes in Deezer, a French digital music service in which Access owns a controlling equity interest, and Tencent Music Entertainment Group, the leading online music entertainment platform in China. Acquiring and investing in businesses that are highly complementary to our existing portfolio further enables us to potentially derive incremental and new revenue streams from different business models in new markets.
Our Growth Strategies
Attract, Develop and Retain Established and Emerging Recording Artists and Songwriters. A critical component of our global strategy is to produce an increasing flow of new music by finding, developing and retaining recording artists and songwriters who achieve long-term success. Since 2011, our annual new releases have grown significantly and our catalog of musical compositions has increased to over 1.4 million. We expect to
7
Table of Contents
enhance the value of our assets by continuing to attract and develop new recording artists and songwriters with staying power and market potential. Our A&R teams seek to sign talented recording artists and songwriters who will generate meaningful revenues and increase the enduring value of our catalog. We have also made meaningful investments in technology to further expand our A&R capabilities in a rapidly changing music environment. In 2018, we acquired Sodatone, an advanced A&R tool that uses streaming, social and touring data to help track early predictors of success. When combined with the strength of our current ability to identify creative talent, we expect this to further enhance our ability to scout and sign breakthrough recording artists and songwriters. In addition, we anticipate that investment in or commercial relationships with technology companies will enable us to tailor our marketing efforts for established recording artists and songwriters by gaining valuable insight into consumer reactions to new releases. We regularly evaluate our recording artist and songwriter rosters to ensure that we remain focused on developing the most promising and profitable talent and are committed to maintaining financial discipline in the negotiation of our agreements with recording artists and songwriters.
Focus on Growth Markets to Position Us to Realize Upside from Incremental Penetration of Streaming. While the rapid growth of streaming has already transformed the music entertainment industry, streaming is still in relatively early stages, as significant opportunity remains in both developed markets and markets largely untapped by the adoption of paid streaming subscriptions. Some of our largest markets, such as the United States, Germany, United Kingdom and France, still lag Nordic countries in penetration of paid subscriptions and have room for future growth. In these markets, we will continue to increase our output of new releases and use data to more effectively target our marketing efforts. Less mature markets, such as China and Brazil, have large populations with relatively high smartphone penetration, and we are well placed to benefit from streaming tailwinds over the next several years with our local presence and extensive catalog.
Expand Global Presence with Investment in Local Music in Nascent Markets. We recognize that music is inherently local in nature, shaped by people and culture. According to IFPI, in 2018, at least seven of the top-selling singles in Brazil, India, Italy and South Korea were performed by or featured local artists. Similarly, in 2018, at least seven of the top-selling albums in France, Germany, Spain and Turkey were performed by or featured local artists. One of our vital business functions is to help our recording artists and songwriters solve the complexities associated with a fragmented, global market of mixed musical tastes. We have found that investment in local music provides the best opportunity to understand these nuances, and we have made it a strategic priority to seek out investment opportunities in emerging markets. For example, we opened an office in the Middle East and North Africa region to prepare for the forecasted rise in smartphone penetration and projected uptake in digital music. These investments are made with the purpose of increasing our understanding of local market dynamics and popularizing our current roster of recording artists and songwriters around the world. The impact of this local focus is demonstrated by increased revenues. For example, in fiscal year 2019, on a constant-currency basis, our revenues grew by 11% in the United States and Canada, 17% in Latin America, 25% in Asia and Australasia, and 26% in Europe and the rest of the world.
Embrace Commercial Innovation with New Digital Distributors and Partners. We believe the growth of digital formats will continue to create new and powerful ways to distribute and monetize our music. We were the first major music company to strike landmark deals with important companies such as Apple, YouTube, Peloton and Tencent Music Entertainment Group, as well as with pure-play music technology companies such as MixCloud, SoundCloud and Audiomack. We believe that the continued development of new digital channels for the consumption of music and increasing access to digital music services present significant promise and opportunity for the music entertainment industry. We are also focused on investing in emerging music technologies, demonstrated by our launch of WMG Boost, a seed-stage investment fund for start-ups in the music entertainment industry and through partnerships with entrepreneurial incubators such as TechStars. We intend to continue to extend our technological reach by executing deals with new partners and developing optimal business models that will enable us to monetize our music across various platforms, services and devices. We also intend to continue to support and invest in emerging technologies, including artificial intelligence, artificial reality,
8
Table of Contents
virtual reality, high-resolution audio, mobile messaging and other technologies to continue to build new revenue streams and position ourselves for long-term growth.
Pursue Acquisitions to Enhance Asset Portfolio and Long-Term Growth. We have successfully completed a number of strategic acquisitions, particularly in our Recorded Music business. Strengthening and expanding our global footprint provides us with insights on markets in which we can immediately capitalize on favorable industry trends, as evidenced by our acquisition of PLG in 2013. We also build upon our core competencies with additive and ancillary capabilities. For example, our acquisition of UPROXX, one of the most influential media brands for youth culture, not only provides a platform for short-form music and music-based video content production to market and promote our recording artists, but also includes sales capabilities to monetize advertising inventory on digital audio and video platforms. We plan to continue selectively pursuing acquisition opportunities while maintaining financial discipline to further improve our growth trajectory and drive operating efficiencies with increased free cash flow generation. With respect to our Music Publishing business, we have the opportunity to generate significant value by acquiring other music publishers and extracting cost savings (as acquired catalogs can be administered with little incremental cost), as well as by increasing revenues through more aggressive monetization efforts. We will also continue to evaluate opportunities to add to our catalog or acquire or make investments in companies engaged in businesses that we believe will help to advance our strategies.
Our Recording Artist and Songwriter Value Proposition
Over the last five years, we have outperformed in a highly competitive market. For example, from January 2017 through April 2020, our owned and distributed labels have received more U.S. Gold and Platinum certifications from the RIAA for debut albums than those of any other company. Our success is a function of attracting exceptional talent and helping them build long and lucrative careers. In an environment where music entertainment companies often fiercely compete to sign recording artists and songwriters, our ability to differentiate our core capabilities is crucial. We are constantly strengthening our skill sets, as well as evolving and expanding the comprehensive suite of services we provide. Our goal is not to be the biggest music entertainment company, but the best.
In the digital world, consumers have more than 50 million tracks at their fingertips, growing at a rate of approximately 40,000 songs per day. The sheer volume of music being released on digital music services is making it harder for recording artists and songwriters to stand out and get noticed. At the same time, music that is fresh and original is currently what resonates most strongly on digital music services. We believe our Recorded Music and Music Publishing businesses remain not just relevant, but essential to the booming music entertainment economy. Our proven ability to cut through the noise is more necessary and valuable than ever.
Below is an overview of the many creative and commercial services we provide our recording artists and songwriters. Our interests are aligned with theirs. By creating value for our recording artists and songwriters, we create value for ourselves. That philosophy is behind our current momentum, and we believe it will continue to propel our business into the future.
Welcoming Talent
We offer recording artists and songwriters numerous pathways into our ecosystem. Whether it is an up-and-coming songwriter making music in his or her bedroom, a breakout superstar recording artist selling out stadiums or an icon looking to curate a legacy, we offer the necessary support and resources.
We are not just searching for immediate hits. We scout and sign talent with the market potential for longevity and lasting impact. As a result, we are investing in more new music every year without losing our
9
Table of Contents
commitment to each recording artist and songwriter. It is that focus, patience and passion that has built and sustained the reputation that perpetuates our cycle of success.
Creative Partnership
Our A&R executives both champion and challenge the talent they sign, empowering them to realize their visions and evolve over time. Our longstanding relationships within the creative community also provide our recording artists and songwriters with a wide network of collaborators, which is a vital part of helping them to realize their best work. We provide the investment that gives our recording artists and songwriters the requisite time and space to experiment and flourish. This includes access to a multitude of songwriters’ rooms and recording studios around the globe with more to come.
Marketing and Promotional Firepower
We are experts in the art of amplification, with proven specialties in every aspect of marketing and promotion. From every meaningful digital music service and social media network to radio, press, film, television and retail, we are plugged into the most influential people and platforms for music entertainment. At the same time, by combining our collective experience with billions of transactions each and every week, we gather the insights needed to make meaningful commercial decisions grounded in data-based discipline. Most importantly, we quickly adapt to changes in how music is consumed to maximize the opportunities for our recording artists and songwriters. For example, we quickly honed our expertise in securing placement on playlists and other valuable positioning on digital music services.
Global Reach and Local Expertise
As of September 30, 2019, we employed approximately 5,400 persons around the world. This means we can build local fan bases for international recording artists and songwriters, as well as supply the network to deliver worldwide fame. Our local strength fuels our global impact and vice versa. We employ a global priority system to provide as many recording artists as possible a genuine shot at success. Our approach combines a deep understanding of local cultures, with a close-knit, nimble team that is in constant communication around the world.
A Broad Universe of Opportunity
Albums, singles, videos and songs are still the primary drivers for our business. But as the demand for music has grown, music has been woven into the fabric of our daily lives in new and increasingly sophisticated ways. It is our job to help our recording artists and songwriters capitalize on this expanding universe.
In our Recorded Music business, beyond digital and physical revenue streams, we provide a wide array of artist services, including merchandise, e-commerce, VIP ticketing and fan clubs. In our Music Publishing business, we take an active role in expanding the consumption of music, through performance, digital, mechanical, synchronization and, the original music publishing revenue stream, sheet music. Last year, we launched a creative services team that is tasked with finding innovative ways to revitalize catalogs and create new possibilities for our songwriters.
In 2017, we launched a film and television unit and subsequently acquired additional video production capabilities in order to offer greater storytelling possibilities for our recording artists and songwriters.
The centralization of our technology capabilities and data insights has resulted in increased transparency of our royalty reporting to our recording artists and songwriters. We defend and protect our recording artists’ and songwriters’ creative output by remaining vigilant in the collection of different types of royalties around the world and defending against illegitimate and illegal uses of our owned and controlled copyrights.
10
Table of Contents
Representative Sample of Recording Artists and Songwriters
Our Recorded Music business includes music from:
| • | Global superstars such as Ed Sheeran, Bruno Mars, Michael Bublé, Cardi B, Kelly Clarkson, Coldplay, David Guetta, Dua Lipa, Neil Young, Prince, Pink Floyd, David Bowie, Phil Collins, Fleetwood Mac, Tom Petty and The Smiths. |
| • | Next-generation talent including A Boogie wit da Hoodie, Charli XCX, Lizzo and Bebe Rexha. |
| • | International stars such as Anitta, Aya Nakamura, TWICE, Christopher, Udo Lindenberg and Laura Pausini. |
Our Music Publishing business includes musical compositions by:
| • | Superstars such as Stormzy, Twenty One Pilots, Green Day, Katy Perry, George Michael, Chris Stapleton, Damon Albarn, Dave Mustaine and Kacey Musgraves. |
| • | International talent such as Jonathan Lee, Tia Ray, Manuel Medrano, Melendi, Bausa, Shy’m, Tove Lo and Jack & Coke. |
| • | Songwriting icons like Brody Brown, Liz Rose, Justin Tranter, busbee, The-Dream, Dr. Dre, Stephen Sondheim, George & Ira Gershwin and Gamble & Huff. |
Recent Developments
During the one month ended April 30, 2020, we experienced a 12% increase in Recorded Music streaming revenue, our largest and fastest-growing source of revenue, despite the impact of COVID-19 on digital advertising markets. For the one month ended April 30, 2020, Recorded Music streaming revenue was estimated to be $183 million compared to $168 million (or $163 million on a constant-currency basis) for the one month ended April 30, 2019. We also experienced an increase in Music Publishing digital revenue during this period. For the one month ended April 30, 2020, Music Publishing digital revenue was estimated to be $22 million compared to $19 million (or $18 million on a constant-currency basis) for the one month ended April 30, 2019. Total digital revenue increased in the one month ended April 30, 2020 driven by increases in Recorded Music paid streaming revenue and Music Publishing digital revenue, offset by a decrease in Recorded Music ad-supported revenue resulting from the impact of COVID-19 and download revenue due to the continued shift to streaming services. Despite the economic impacts associated with the COVID-19 pandemic, total digital revenue is estimated to have grown 10% year-over-year to $216 million for the one month ended April 30, 2020 compared to $203 million (or $196 million on a constant-currency basis) for the one month ended April 30, 2019. On a constant-currency basis, estimated total digital revenue grew $20 million and represented 73% of total revenue for the one month ended April 30, 2020 compared to 60% for the one month ended April 30, 2019. Our digital revenue trends are consistent with certain published market trends.
For the one month ended April 30, 2020, estimated total revenue was $295 million compared to $335 million (or $329 million on a constant-currency basis) for the one month ended April 30, 2019. On a constant currency basis, this represents a decrease of $34 million, or 10% year-over-year. An increase in total digital revenue, including gains in Recorded Music paid streaming revenue and Music Publishing digital revenue, in April 2020 compared to April 2019 was more than offset by decreases in revenue from artist services and expanded-rights, ad-supported digital and physical revenue in Recorded Music and synchronization revenue in Music Publishing. As the impact of the COVID-19 pandemic subsides, we expect these revenue sources to largely recover. Digital revenue is among our highest margin revenue while some of the revenue sources that have been negatively impacted by the economic effects of the pandemic, such as artist services and physical, are intrinsically lower margin. As a result, we expect the impact on OIBDA of decreased revenue from these sources
11
Table of Contents
to be less than the impact on revenue. We are also taking additional steps to offset the impact of COVID-19 on OIBDA by controlling discretionary spending, initiating cost reduction programs and allocating our resources to areas where they will be most impactful.
For a discussion of the financial impact of the COVID-19 pandemic on our business for the six months ended March 31, 2020, see “Management’s Discussion and Analysis of Financial Condition and Results of Operations—Business Overview—Factors Affecting Results of Operations and Comparability—COVID-19 Pandemic.” For additional information on the specific risks we face from COVID-19 and the potential future adverse impact that the COVID-19 pandemic and associated government responses could have on our results of operations, cash flows and financial condition, see “Risk Factors—Risks Related to Our Business—Our results of operations, cash flows and financial condition are expected to be adversely impacted by the coronavirus pandemic.”
Cautionary Statement Regarding Estimated Results
The estimated financial information for the Company for the one month ended April 30, 2020 is preliminary, unaudited and subject to completion. This information reflects management’s current views and may change as a result of management’s review of results and other factors, including a wide variety of significant business, economic and competitive risks and uncertainties. Such preliminary financial information is subject to the finalization and closing of the accounting books and records of the Company (which have yet to be performed) and should not be viewed as a substitute for full quarterly financial statements prepared in accordance with U.S. GAAP. The Company cautions you that the estimated financial information for the one month ended April 30, 2020 is not a guarantee of future performance or outcomes and actual results may differ materially from those described above. Factors that could cause actual results to differ from those described above are set forth in “Risk Factors” and “Special Note Regarding Forward-Looking Statements and Information.” The Company assumes no obligation to update any forward-looking statement as a result of new information, future events or other factors. You should read this information together with “Management’s Discussion and Analysis of Financial Condition and Results of Operations” and the Company’s audited historical consolidated financial statements appearing elsewhere in this prospectus. No independent registered public accounting firms have audited, reviewed or compiled, examined or performed any procedures with respect to these preliminary results, nor have they expressed any opinion or any other form of assurance on the preliminary results.
The Company maintains a 52-53 week fiscal year ending on the last Friday in each reporting period. Quarters within the fiscal year include 13-week periods, unless a fiscal year includes a 53rd week, in which case the fourth quarter of the fiscal year will be a 14-week period. The one month ended April 30, 2020 consists of four weeks, and therefore, it represents less than one-third of the Company’s fiscal quarter that will end June 30, 2020.
The unaudited preliminary financial information is presented for informational purposes only and does not purport to represent the Company’s financial condition or results of operations for any future date or period. As a result, prospective investors should exercise caution in relying on this information and should not draw any inferences from this information regarding financial or operating data not provided.
Our Controlling Stockholder and Our Status as a Controlled Company
Access Industries is a privately-held industrial group with long-term holdings worldwide. Founded in 1986 by British-American industrialist and philanthropist Len Blavatnik, Access identifies new strategic investment opportunities and invests in both emerging and established industries to create transformative companies and generate significant growth over time. Headquartered in the United States, Access owns strategic and diversified investments around the world in various key sectors including media and telecommunications, natural resources and chemicals, venture capital, real estate and biotechnology.
12
Table of Contents
In the technology, media and entertainment (“TME”) sector, Access has created a media platform for the 21st century built on investments in disruptive technologies, content platforms and production companies. In addition to Warner Music Group, Access’s TME holdings include DAZN, the leading digital sports content streaming company, Deezer, the high-resolution online music streaming service with 14 million active monthly users, Access Entertainment, which invests in premium-quality television, film and theater, and other transformational companies.
Following the completion of this offering, Access will hold an aggregate of 440,000,000 shares of our Class B common stock, representing approximately 99.2% of the total combined voting power of our outstanding common stock (or an aggregate of 429,500,000 shares of our Class B common stock, representing approximately 99.1% of the total combined voting power of our outstanding common stock if the underwriters exercise in full their option to purchase additional shares of our Class A common stock from the selling stockholders) and approximately 86.3% of the economic interest (or approximately 84.2% of the economic interest if the underwriters exercise in full their option to purchase additional shares of our Class A common stock from the selling stockholders). Accordingly, Access will have the ability to control the outcome of matters submitted to our stockholders for approval, including the election of our directors and the approval of any change in control transaction. We believe that this voting structure aligns our interests in creating stockholder value.
Because Access will control a majority of the total combined voting power of our outstanding common stock, we will be a “controlled company” under the corporate governance rules for Nasdaq-listed companies. Therefore, we may elect not to comply with certain corporate governance standards, such as the requirement that our board of directors have a compensation committee and nominating and corporate governance committee composed entirely of independent directors. Following the completion of this offering, we intend to take advantage of these exemptions.
Our Corporate Information
Warner Music Group Corp. is a Delaware corporation. Our principal executive offices are located at 1633 Broadway, New York, New York 10019, and our telephone number is (212) 275-2000. Our website is www.wmg.com. Information on, or accessible through, our website or any other website is not incorporated by reference herein and does not constitute a part of this prospectus.
Summary Risk Factors
Our business is subject to a number of risks, including risks that may prevent us from achieving our business objectives or may adversely affect our business, financial condition, results of operations, cash flows and prospects that you should consider before making a decision to invest in our Class A common stock. These risks are discussed more fully in “Risk Factors” in this prospectus. These risks include, but are not limited to, the following:
| • | our results of operations, cash flows and financial condition are expected to be adversely impacted by the coronavirus pandemic; |
| • | our ability to identify, sign and retain recording artists and songwriters and the existence or absence of superstar releases; |
| • | the ability to further develop a successful business model applicable to a digital environment and to enter into artist services and expanded-rights deals with recording artists in order to broaden our revenue streams in growing segments of the music entertainment business; |
| • | the popular demand for particular recording artists or songwriters and music and the timely delivery to us of music by major recording artists or songwriters; |
13
Table of Contents
| • | the diversity and quality of our recording artists, songwriters and releases; |
| • | slower growth in streaming adoption and revenue; |
| • | our dependence on a limited number of digital music services for the online distribution and marketing of our music and their ability to significantly influence the pricing structure for online music stores; |
| • | risks associated with our non-U.S. operations, including limited legal protections of our intellectual property rights and restrictions on the repatriation of capital; |
| • | the impact of heightened and intensive competition in the recorded music and music publishing industries and our inability to execute our business strategy; |
| • | threats to our business associated with digital piracy, including organized industrial piracy; |
| • | a potential loss of catalog if it is determined that recording artists have a right to recapture U.S. rights in their recordings under the U.S. Copyright Act; |
| • | our substantial leverage; and |
| • | holders of our Class A common stock will have limited or no ability to influence corporate matters due to the dual class structure of our common stock and the existing ownership of Class B common stock by Access, which has the effect of concentrating voting control with Access for the foreseeable future. |
14
Table of Contents
THE OFFERING
| Class A common stock offered by the selling stockholders |
70,000,000 shares. |
| Option to purchase additional shares of Class A common stock offered by the selling stockholders |
The underwriters have a 30-day option to purchase up to an additional 10,500,000 shares of Class A common stock from the selling stockholders at the initial public offering price, less underwriting discounts and commissions. |
| Class A common stock to be outstanding after this offering |
70,000,000 shares (or 80,500,000 if the underwriters exercise in full their option to purchase additional shares of our common stock). |
| Class B common stock to be outstanding after this offering |
440,000,000 shares (or 429,500,000 if the underwriters exercise in full their option to purchase additional shares of our common stock). |
| Total Class A common stock and Class B common stock to be outstanding after this offering |
510,000,000 shares. |
| Use of proceeds |
We will not receive any proceeds from the sale of Class A common stock by the selling stockholders in this offering. |
| Voting rights |
Upon completion of this offering, we will have two classes of voting common stock, Class A common stock and Class B common stock. Each share of Class A common stock is entitled to one vote per share and each share of Class B common stock is entitled to 20 votes per share. |
| Holders of Class A common stock and Class B common stock vote together as a single class on all matters (including the election of directors) submitted to a vote of stockholders, unless otherwise required by law or specified in our amended and restated certificate of incorporation. Upon the completion of this offering, Access, which will be the holder of all of the outstanding shares of Class B common stock, will collectively hold approximately 99.2% of the total combined voting power of our outstanding common stock (or approximately 99.1% of the total combined voting power of our outstanding common stock if the underwriters exercise in full their option to purchase additional shares of our common stock). As a result, the holders of the outstanding shares of Class B common stock will have the ability to control the outcome of matters submitted to our stockholders for approval, including the election of our directors and the approval of any change in control transaction. See “Description of Capital Stock—Common Stock—Voting Rights.” |
| Conversion and related rights |
Our Class A common stock is not convertible into any other class of shares. |
15
Table of Contents
| Our Class B common stock is convertible into shares of our Class A common stock on a one-for-one basis at the option of the holder. In addition, each share of Class B common stock will convert automatically into one share of Class A common stock (i) upon any transfer of such share, except for certain permitted transfers described in our amended and restated certificate of incorporation and (ii) on the first business day after the date on which the outstanding shares of Class B common stock constitutes less than 10% of the aggregate number of shares of common stock then outstanding, as determined by our board of directors. See “Description of Capital Stock—Common Stock—Conversion, Exchange and Transferability” for more information. |
| Dividend policy |
The Company intends to institute a regular quarterly dividend to holders of our Class A common stock and Class B common stock whereby we intend to pay quarterly cash dividends of $0.12 per share. We expect to pay the first dividend under this policy in September 2020. The declaration of each dividend will be at the discretion of our board of directors and will depend on our financial condition, earnings, liquidity and capital requirements, level of indebtedness, contractual restrictions with respect to payment of dividends, restrictions imposed by Delaware law, general business conditions and any other factors that our board of directors deems relevant in making such a determination. Therefore, there can be no assurance that we will pay any dividends to holders of our common stock, or as to the amount of any such dividends. See “Dividend Policy.” |
| Stock exchange symbol |
“WMG”. |
The number of shares of our common stock to be outstanding immediately following this offering is based on no shares of Class A common stock and 510,000,000 shares of Class B common stock outstanding as of May 15, 2020, respectively, and excludes 40,654,090 shares of Class A common stock reserved for future issuance following this offering under our equity plans (of which 31,169,099 shares are potentially issuable over the 10-year period from the date of adoption of the Omnibus Incentive Plan to be adopted in connection with this offering, see “Executive Compensation—Compensation Discussion and Analysis—Changes to Executive Compensation in Connection with the Offering—Omnibus Incentive Plan”).
Unless otherwise indicated, all information in this prospectus:
| • | gives effect to amendments to our amended and restated certificate of incorporation and amended and restated by-laws to be adopted prior to the consummation of this offering; |
| • | gives effect to the conversion of shares of Class B common stock held by the selling stockholders into an equivalent number of shares of Class A common stock upon the sale by the selling stockholders of such shares in this offering; |
| • | gives effect to the reclassification of 1,068.638852275820 shares of our common stock existing prior to February 28, 2020 into shares of Class B common stock and the concurrent 477,242.614671815-for-1 stock split on our Class B common stock effected on February 28, 2020 resulting in 510,000,000 outstanding shares of Class B common stock; |
| • | assumes no exercise by the underwriters of their option to purchase additional shares of Class A common stock from the selling stockholders; |
16
Table of Contents
| • | assumes that the initial public offering price of our Class A common stock will be $24.50 per share (which is the midpoint of the price range set forth on the cover page of this prospectus); and |
| • | does not reflect shares of Class A common stock potentially issuable in respect of deferred equity unit grants under our Senior Management Free Cash Flow Plan (the “Plan”). See “Executive Compensation—Long-Term Equity Incentives—Warner Music Group Corp. Senior Management Free Cash Flow Plan” for additional information on the Plan. |
17
Table of Contents
SUMMARY HISTORICAL CONSOLIDATED FINANCIAL DATA
The financial data for the fiscal years ended September 30, 2019, September 30, 2018 and September 30, 2017, and as of September 30, 2019 and September 30, 2018 have been derived from the Company’s audited financial statements included elsewhere in this prospectus. The financial data for the six months ended March 31, 2020 and 2019, and as of March 31, 2020 have been derived from the unaudited financial statements included elsewhere in this prospectus. The financial data as of March 31, 2019 have been derived from unaudited financial statements not included in this prospectus. This summary financial data should be read in conjunction with “Management’s Discussion and Analysis of Financial Condition and Results of Operations” and the annual and interim financial statements included elsewhere in this prospectus. Historical results are not indicative of future operating results and results from interim periods are not indicative of full year results. The following consolidated statement of operations and consolidated balance sheet data have been prepared in conformity with accounting principles generally accepted in the United States of America (“U.S. GAAP”).
| Six Months Ended March 31, |
Fiscal Year Ended September 30, | |||||||||||||||||||
| (in millions) | 2020 | 2019 | 2019 | 2018 | 2017 | |||||||||||||||
| Statement of Operations Data: |
||||||||||||||||||||
| Revenues |
$ | 2,327 | $ | 2,293 | $ | 4,475 | $ | 4,005 | $ | 3,576 | ||||||||||
| Interest expense, net |
(66 | ) | (72 | ) | (142 | ) | (138 | ) | (149 | ) | ||||||||||
| Net income |
48 | 153 | 258 | 312 | 149 | |||||||||||||||
| Less: Income attributable to noncontrolling interest |
(2 | ) | — | (2 | ) | (5 | ) | (6 | ) | |||||||||||
| Net income attributable to the Company. |
46 | 153 | 256 | 307 | 143 | |||||||||||||||
| Balance Sheet Data (at period end): |
||||||||||||||||||||
| Cash and equivalents |
$ | 484 | $ | 470 | $ | 619 | $ | 514 | $ | 647 | ||||||||||
| Total assets |
6,124 | 5,902 | 6,017 | 5,344 | 5,718 | |||||||||||||||
| Total debt (including current portion of long-term debt) |
2,983 | 2,990 | 2,974 | 2,819 | 2,811 | |||||||||||||||
| Total equity (deficit) |
(285 | ) | (120 | ) | (269 | ) | (320 | ) | 308 | |||||||||||
| Cash Flow Data: |
||||||||||||||||||||
| Cash flows provided by (used in): |
||||||||||||||||||||
| Operating activities |
$ | 164 | $ | 99 | $ | 400 | $ | 425 | $ | 535 | ||||||||||
| Investing activities |
(51 | ) | (293 | ) | (376 | ) | 405 | (126 | ) | |||||||||||
| Financing activities |
(245 | ) | 151 | 88 | (955 | ) | (128 | ) | ||||||||||||
| Depreciation & amortization |
132 | 137 | 269 | 261 | 251 | |||||||||||||||
| Capital expenditures |
(28 | ) | (59 | ) | (104 | ) | (74 | ) | (44 | ) | ||||||||||
| (in millions, except share and per share |
Six Months Ended March 31, | Fiscal Year Ended September 30, | ||||||||||||||||||
| 2020 | 2019 | 2019 | 2018 | 2017 | ||||||||||||||||
| Earnings Per Share: |
||||||||||||||||||||
| Earnings per share—common stock |
||||||||||||||||||||
| Basic and Diluted |
$ | 0.09 | $ | 0.30 | $ | 0.51 | $ | 0.61 | $ | 0.29 | ||||||||||
| Weighted average common shares outstanding |
501,991,944 | 501,991,944 | 501,991,944 | 502,630,835 | 503,392,885 | |||||||||||||||
18
Table of Contents
| Six Months Ended March 31, |
Fiscal Year Ended September 30, | |||||||||||||||||||
| (in millions) | 2020 | 2019 | 2019 | 2018 | 2017 | |||||||||||||||
| Business Segment Data: |
||||||||||||||||||||
| Recorded Music |
||||||||||||||||||||
| Revenues |
$ | 1,991 | $ | 1,974 | $ | 3,840 | $ | 3,360 | $ | 3,020 | ||||||||||
| Operating income |
227 | 297 | 439 | 307 | 283 | |||||||||||||||
| OIBDA |
317 | 391 | 623 | 480 | 451 | |||||||||||||||
| Music Publishing |
||||||||||||||||||||
| Revenues |
339 | 323 | $ | 643 | $ | 653 | $ | 572 | ||||||||||||
| Operating income |
44 | 49 | 92 | 84 | 81 | |||||||||||||||
| OIBDA |
81 | 86 | 166 | 159 | 152 | |||||||||||||||
| Corporate expenses and eliminations |
||||||||||||||||||||
| Revenues |
(3 | ) | (4 | ) | $ | (8 | ) | $ | (8 | ) | $ | (16 | ) | |||||||
| Operating loss |
(155 | ) | (77 | ) | (175 | ) | (174 | ) | (142 | ) | ||||||||||
| OIBDA |
(150 | ) | (71 | ) | (164 | ) | (161 | ) | (130 | ) | ||||||||||
| Total |
||||||||||||||||||||
| Revenues |
2,327 | 2,293 | $ | 4,475 | $ | 4,005 | $ | 3,576 | ||||||||||||
| Operating income |
116 | 269 | 356 | 217 | 222 | |||||||||||||||
| OIBDA (1) |
248 | 406 | 625 | 478 | 473 | |||||||||||||||
| Six Months Ended March 31, |
Fiscal Year Ended September 30, | |||||||||||||||||||
| (in millions) | 2020 | 2019 | 2019 | 2018 | 2017 | |||||||||||||||
| Other Financial Data: |
||||||||||||||||||||
| OIBDA (1) |
$ | 248 | $ | 406 | $ | 625 | $ | 478 | $ | 473 | ||||||||||
| Free Cash Flow (2) |
$ | 113 | $ | (194 | ) | $ | 24 | $ | 830 | $ | 409 | |||||||||
| Twelve Months Ended March 31, |
Fiscal Year Ended September 30, | |||||||||||||||||||
| 2020 | 2019 | 2019 | 2018 | 2017 | ||||||||||||||||
| Adjusted EBITDA (3) |
$ | 755 | $ | 1,097 | $ | 737 | $ | 1,033 | $ | 604 | ||||||||||
| (1) | We evaluate our operating performance based on several factors, including our primary financial measure which is operating income (loss) before non-cash depreciation of tangible assets and non-cash amortization of intangible assets (which we refer to as “OIBDA”). We consider OIBDA to be an important indicator of the operational strengths and performance of our businesses, and believe the presentation of OIBDA helps improve the ability to understand our operating performance and evaluate our performance in comparison to comparable periods. |
However, a limitation of the use of OIBDA as a performance measure is that it does not reflect the periodic costs of certain capitalized tangible and intangible assets used in generating revenue in our businesses. Accordingly, OIBDA should be considered in addition to, not as a substitute for, operating income (loss), net income (loss) and other measures of financial performance reported in accordance with U.S. GAAP.
19
Table of Contents
The following is a reconciliation of operating income (loss) from continuing operations to OIBDA and further provides the components from operating income (loss) from continuing operations to net income (loss) for the periods presented:
| For the Six Months Ended March 31, |
Fiscal Year Ended September 30, | |||||||||||||||||||
| (in millions) | 2020 | 2019 | 2019 | 2018 | 2017 | |||||||||||||||
| Net income attributable to the Company |
$ | 46 | $ | 153 | $ | 256 | $ | 307 | $ | 143 | ||||||||||
| Income attributable to noncontrolling interest |
2 | — | 2 | 5 | 6 | |||||||||||||||
|
|
|
|
|
|
|
|
|
|
|
|||||||||||
| Net income |
48 | 153 | 258 | 312 | 149 | |||||||||||||||
| Income tax expense (benefit) |
(7 | ) | 98 | 9 | 130 | (151 | ) | |||||||||||||
|
|
|
|
|
|
|
|
|
|
|
|||||||||||
| Income (loss) before income taxes |
41 | 251 | 267 | 442 | (2 | ) | ||||||||||||||
| Other (income) expense, net |
9 | (57 | ) | (60 | ) | (394 | ) | 40 | ||||||||||||
| Interest expense, net |
66 | 72 | 142 | 138 | 149 | |||||||||||||||
| Loss on extinguishment of debt |
— | 3 | 7 | 31 | 35 | |||||||||||||||
|
|
|
|
|
|
|
|
|
|
|
|||||||||||
| Operating income |
116 | 269 | 356 | 217 | 222 | |||||||||||||||
| Amortization expense |
94 | 109 | 208 | 206 | 201 | |||||||||||||||
| Depreciation expense |
38 | 28 | 61 | 55 | 50 | |||||||||||||||
|
|
|
|
|
|
|
|
|
|
|
|||||||||||
| OIBDA |
$ | 248 | $ | 406 | $ | 625 | $ | 478 | $ | 473 | ||||||||||
| (2) | Free Cash Flow reflects our net cash provided by operating activities less capital expenditures and cash paid or received for investments. We use Free Cash Flow, among other measures, to evaluate our operating performance. Management believes Free Cash Flow provides investors with an important perspective on the cash available to fund our debt service requirements, ongoing working capital requirements, capital expenditure requirements, strategic acquisitions and investments, and any dividends, prepayments of debt or repurchases or retirement of our outstanding debt or notes in open market purchases, privately negotiated purchases or otherwise. As a result, Free Cash Flow is a significant measure of our ability to generate long-term value. It is useful for investors to know whether this ability is being enhanced or degraded as a result of our operating performance. We believe the presentation of Free Cash Flow is relevant and useful for investors because it allows investors to view performance in a manner similar to the method management uses. |
The following is a reconciliation of net cash provided by operating activities to Free Cash Flow for the periods presented:
| Six Months Ended March 31, |
Fiscal Year Ended September 30, | |||||||||||||||||||
| (in millions) | 2020 | 2019 | 2019 | 2018 | 2017 | |||||||||||||||
| (unaudited) | ||||||||||||||||||||
| Net cash provided by operating activities |
$ | 164 | $ | 99 | $ | 400 | $ | 425 | $ | 535 | ||||||||||
| Capital expenditures (a) |
(28 | ) | (59 | ) | (104 | ) | (74 | ) | (44 | ) | ||||||||||
| Net cash received (paid) for investments (b) |
(23 | ) | (234 | ) | (272 | ) | 479 | (82 | ) | |||||||||||
| Free Cash Flow |
$ | 113 | $ | (194 | ) | $ | 24 | $ | 830 | $ | 409 | |||||||||
|
|
|
|
|
|
|
|
|
|
|
|||||||||||
| (a) | Fiscal years 2019 and 2018 include Los Angeles headquarters construction expenditures of $45 million and $28 million, respectively. |
| (b) | Reflects acquisition of music publishing rights and music catalogs, net, investments and acquisitions of businesses, net and proceeds from the sale of investments including, in the first fiscal quarter of 2019 and fiscal year 2019, the $183 million used to fund the acquisition of EMP, which was entirely debt financed, and in fiscal year 2018, the cash impact of the net gain of $389 million related to the sale of the Spotify shares. |
20
Table of Contents
| (3) | Adjusted EBITDA is equivalent to “EBITDA” as defined in our Revolving Credit Facility and substantially similar to “Consolidated EBITDA” as defined under our indentures and “EBITDA” as defined under our Senior Term Loan Facility, respectively. Adjusted EBITDA differs from the term “EBITDA” as it is commonly used. The definition of Adjusted EBITDA, in addition to adjusting net income to exclude interest expense, income taxes, and depreciation and amortization, also adjusts net income by excluding items or expenses such as, among other items, (1) the amount of any restructuring charges or reserves, (2) any non-cash charges (including any impairment charges), (3) any net loss resulting from hedging currency exchange risks, (4) the amount of management, monitoring, consulting and advisory fees paid to Access under the Management Agreement or otherwise, (5) business optimization expenses (including consolidation initiatives, severance costs and other costs relating to initiatives aimed at profitability improvement), (6) transaction expenses, (7) equity-based compensation expense and (8) certain extraordinary, unusual or non-recurring items. It also includes adjustments for the pro forma impact of certain projected cost savings, operating expense reductions and synergies and any quality of earnings analysis prepared by independent certified public accountants in connection with an acquisition, merger, consolidation or other investment. Adjusted EBITDA is a key measure used by our management to understand and evaluate our operating performance, generate future operating plans and make strategic decisions regarding the allocation of capital. See “Management’s Discussion and Analysis of Financial Condition and Results of Operations—Financial Condition and Liquidity—Covenant Compliance.” |
Adjusted EBITDA has limitations as an analytical tool, and you should not consider it in isolation or as a substitute for analysis of our results as reported under U.S. GAAP. Some of those limitations include: (1) it does not reflect the periodic costs of certain capitalized tangible and intangible assets used in generating revenue for our business, (2) it does not reflect the significant interest expense or cash requirements necessary to service interest or principal payments on our indebtedness and (3) it does not reflect every cash expenditure, future requirements for capital expenditures or contractual commitments. In particular, this measure adds back certain non-cash, extraordinary, unusual or non-recurring charges that are deducted in calculating net income; however, these are expenses that may recur, vary greatly and are difficult to predict. In addition, Adjusted EBITDA is not the same as net income or cash flow provided by operating activities as those terms are defined by U.S. GAAP and does not necessarily indicate whether cash flows will be sufficient to fund cash needs. Further, Adjusted EBITDA is calculated for the most recent four fiscal quarters. As a result, the measure can be disproportionately affected by a particularly strong or weak quarter, and it may not be comparable to the measure as calculated for any subsequent four-quarter period or any complete fiscal year. Accordingly, Adjusted EBITDA should be considered in addition to, not as a substitute for, net income (loss) and other measures of financial performance reported in accordance with U.S. GAAP.
21
Table of Contents
The following is a reconciliation of net income, which is the most directly comparable measure calculated in accordance with U.S. GAAP, to Adjusted EBITDA for each of the periods presented:
| Twelve Months Ended March 31, |
Fiscal Year Ended September 30, | |||||||||||||||||||
| (in millions) | 2020 | 2019 | 2019 | 2018 | 2017 | |||||||||||||||
| Net income |
$ | 153 | $ | 462 | $ | 258 | $ | 312 | $ | 149 | ||||||||||
| Income tax expense (benefit) |
(97 | ) | 158 | 9 | 130 | (151 | ) | |||||||||||||
| Interest expense, net |
137 | 138 | 142 | 138 | 149 | |||||||||||||||
| Depreciation and amortization |
264 | 264 | 269 | 261 | 251 | |||||||||||||||
| Loss on extinguishment of debt (a) |
4 | 9 | 7 | 31 | 35 | |||||||||||||||
| Net gain on divestitures of business and asset dispositions and sale of securities (b) |
(2 | ) | (8 | ) | (4 | ) | (6 | ) | (4 | ) | ||||||||||
| Restructuring costs (c) |
25 | 45 | 27 | 66 | 14 | |||||||||||||||
| Net hedging gains and foreign exchange gains (d) |
(18 | ) | (44 | ) | (38 | ) | (7 | ) | 22 | |||||||||||
| Management fees (e) |
11 | 17 | 11 | 16 | 9 | |||||||||||||||
| Transaction costs (f) |
4 | 3 | 3 | — | 3 | |||||||||||||||
| Business optimization expenses (g) |
37 | 18 | 22 | 21 | 15 | |||||||||||||||
| Equity-based compensation expense (h) |
196 | 50 | 49 | 62 | 70 | |||||||||||||||
| Other non-cash charges (i) |
39 | (30 | ) | (19 | ) | — | 19 | |||||||||||||
| Pro forma impact of specified transactions and other cost-savings initiatives (j) |
2 | 15 | 1 | 9 | 23 | |||||||||||||||
|
|
|
|
|
|
|
|
|
|
|
|||||||||||
| Adjusted EBITDA (k) |
$ | 755 | $ | 1,097 | $ | 737 | $ | 1,033 | $ | 604 | ||||||||||
| (a) | Reflects net loss incurred on the early extinguishment of our debt incurred as part of (i) the May 2019 redemption of the remaining 5.625% Secured Notes, (ii) the June 2018 and December 2017 Senior Term Loan Credit Agreement Amendments (as defined in “Management’s Discussion and Analysis of Financial Condition and Results of Operations”), (iii) the October 2018 partial redemption of 4.125% Secured Notes, (iv) the October 2018 open market purchase of our 4.875% Senior Secured Notes and (v) the November 2018 partial redemption of 5.625% Secured Notes. |
| (b) | Reflects net gain on divestitures of business and asset dispositions and the sale of investment securities. |
| (c) | Reflects severance costs and other restructuring-related expenses. |
| (d) | Reflects net gains or losses from hedging activities and unrealized net gains due to foreign exchange on our Euro denominated debt and intercompany transactions. |
| (e) | Reflects management fees paid to Access, including an annual fee and related expenses. Pursuant to the Company’s and Holdings’ management agreement with Access, the annual fee is equal to the greater of a base amount of approximately $9 million and 1.5% of Adjusted EBITDA. The management agreement under which the Company incurs such fees will terminate in accordance with its terms upon consummation of this offering. See “Certain Relationships and Related Party Transactions—Transactions with Access Affiliates—Management Agreement” for additional information. |
| (f) | Reflects mainly integration, transaction and other nonrecurring costs, which includes qualifying costs associated with this offering for the twelve months ended March 31, 2020. |
| (g) | Reflects primarily costs associated with information technology systems updates and U.S. shared services relocation and other transformation initiatives. |
| (h) | Reflects non-cash equity-based compensation expense related to the Warner Music Group Corp. Senior Management Free Cash Flow Plan. |
| (i) | Reflects cash payments related to previous non-cash charges, including but not limited to costs associated with our Los Angeles office consolidation (i.e., reversal of add-backs from lease terminations), unrealized losses (gains) on the mark-to-market of an equity method investment and losses on cost method investments. |
| (j) | Reflects pro forma impact of specified transactions and reasonably identifiable and factually supportable savings resulting from our U.S. shared services relocation and other transformation and cost-savings initiatives from actions taken or expected to be taken no later than 18 months after the end of such period. |
| (k) | The twelve months ended March 31, 2019 and fiscal year 2018 include a net gain of $389 million, pre-tax, related to the sale of Spotify shares acquired in the ordinary course of business. |
22
Table of Contents
Investing in our Class A common stock involves a high degree of risk. You should consider and read carefully all of the risks and uncertainties described below, as well as other information contained in this prospectus, including our annual and interim financial statements, before making an investment decision. The risks described below are not the only ones facing us. The occurrence of any of the following risks or additional risks and uncertainties not presently known to us or that we currently believe to be immaterial could materially and adversely affect our business, financial position, results of operations or cash flows. In any such case, the trading price of our Class A common stock could decline, and you may lose all or part of your investment. This prospectus also contains forward-looking statements and estimates that involve risks and uncertainties. Our actual results could differ materially from those anticipated in the forward-looking statements as a result of specific factors, including the risks and uncertainties described below.
Risks Related to Our Business
Our results of operations, cash flows and financial condition are expected to be adversely impacted by the coronavirus pandemic.
In January 2020, a new strain of coronavirus, COVID-19, was identified in Wuhan, China. On March 11, 2020, the World Health Organization declared a pandemic. The pandemic has had and will have an adverse effect on our results of operations, cash flows and financial condition.
While physical revenue streams—physical revenue in our Recorded Music business and mechanical revenue in our Music Publishing business—have declined significantly over the last decade, the virus outbreak has resulted in declines in our physical revenue streams related to disruptions in manufacturing and physical supply chains, the mandated closure of physical retailers, the requirement that people stay in their homes and our decisions to delay the release of new recordings from artists with a more physical consumer base.
The requirement that people stay in their homes has negatively affected our business in other ways. It has ended live concert tours, adversely impacting our concert promotion business and our sale of tour merchandise. It has made it more difficult for artists to engage in marketing efforts around the release of their new recordings which, in some cases, has led to our decisions to delay the release of those recordings. It has delayed the release of new recordings by impeding the types of collaboration among artists, songwriters, producers, musicians, engineers and studios which are necessary for the delivery of those recordings. The cessation in the production of motion pictures and television programs has negatively affected licensing revenue in our Recorded Music business and synchronization revenue in our Music Publishing business.
It has been widely reported that advertisers have reduced their advertising spend as a result of the COVID-19 pandemic. We expect this will result in a corresponding decline in licensing revenue and ad-supported digital revenue in our Recorded Music business and synchronization, performance and ad-supported digital revenue in our Music Publishing business.
The severity and the duration of the pandemic is difficult to predict but it is expected that the pandemic will materially and adversely affect the global economy, creating risk around the timing and collectability of our accounts receivable and leading to a decline in consumer discretionary spending which, in turn, could have a negative impact on our results of operations, cash flows and financial condition. To the extent the COVID-19 pandemic adversely affects our business, results of operations, cash flows or financial condition, it may also have the effect of heightening other risks described in this section.
Given the uncertainty around the extent and timing of the potential future spread or mitigation of the virus and around the imposition or relaxation of protective measures, we cannot at this time reasonably estimate the impact to our future results of operations, cash flows and financial condition.
23
Table of Contents
We may be unable to compete successfully in the highly competitive markets in which we operate, and we may suffer reduced profits as a result.
The industries in which we operate are highly competitive, have experienced ongoing consolidation among major music entertainment companies and are driven by consumer preferences that are rapidly changing. Additionally, they require substantial human and capital resources. We compete with other recorded music companies and music publishing companies to identify and sign new recording artists and songwriters with the potential to achieve long-term success and to enter into and renew agreements with established recording artists and songwriters. In addition, our competitors may from time to time increase the amounts they spend to discover, or to market and promote, recording artists and songwriters or reduce the prices of their music in an effort to expand market share. We may lose business if we are unable to sign successful recording artists or songwriters or to match the prices of the music offered by our competitors. Our Recorded Music business competes not only with other recorded music companies, but also with recording artists who may choose to distribute their own works (which has become more practicable as music is distributed online rather than physically) and companies in other industries (such as Spotify) that may choose to sign direct deals with recording artists or recorded music companies. Our Music Publishing business competes not only with other music publishing companies, but also with songwriters who publish their own works and companies in other industries that may choose to sign direct deals with songwriters or music publishing companies. Our Recorded Music business is to a large extent dependent on technological developments, including access to and selection and viability of new technologies, and is subject to potential pressure from competitors as a result of their technological developments. For example, our Recorded Music business may be further adversely affected by technological developments that facilitate the piracy of music, such as Internet peer-to-peer file sharing, by an inability to enforce our intellectual property rights in digital environments and by a failure to further develop successful business models applicable to a digital environment. The Recorded Music business also faces competition from other forms of entertainment and leisure activities, such as cable and satellite television, motion pictures and video games in physical and digital formats.
Our prospects and financial results may be adversely affected if we fail to identify, sign and retain recording artists and songwriters and by the existence or absence of superstar releases.
We are dependent on identifying, signing and retaining recording artists with long-term potential, whose debut music is well received on release, whose subsequent music is anticipated by consumers and whose music will continue to generate sales as part of our catalog for years to come. The competition among record companies for such talent is intense. Competition among record companies to sell and otherwise market and promote music is also intense. We are also dependent on signing and retaining songwriters who will write the hit songs of today and the classics of tomorrow. Our competitive position is dependent on our continuing ability to attract and develop recording artists and songwriters whose work can achieve a high degree of public acceptance and who can timely deliver their music to us. Our financial results may be adversely affected if we are unable to identify, sign and retain such recording artists and songwriters under terms that are economically attractive to us. Our financial results may also be affected by the existence or absence of superstar recording artist releases during a particular period. Some music entertainment industry observers believe that the number of superstar recording acts with long-term appeal, both in terms of catalog sales and future releases, has declined in recent years. Additionally, our financial results are generally affected by the appeal of our recorded music and music publishing catalogs to consumers.
If streaming adoption or revenues grows less rapidly or levels off, our prospects and our results of operations may be adversely affected.
Streaming revenues are important because they have offset declines in downloads and physical sales and represent a growing area of our Recorded Music business. According to IFPI, streaming revenues, which includes revenues from ad-supported and subscription services, accounted for approximately 88% of digital revenues in 2019, up approximately 5% year-over-year. There can be no assurance that this growth pattern will
24
Table of Contents
persist or that digital revenues will continue to grow at a rate sufficient to offset and exceed declines in downloads and physical sales. If growth in streaming revenues levels off or fails to grow as quickly as it has over the past several years, our Recorded Music business may experience reduced levels of revenues and operating income. Additionally, slower growth in streaming adoption or revenues is also likely to have a negative impact on our Music Publishing business, which generates a significant portion of its revenues from sales and other uses of recorded music.
We are substantially dependent on a limited number of digital music services for the online distribution and marketing of our music, and they are able to significantly influence the pricing structure for online music stores and may not correctly calculate royalties under license agreements.
We derive an increasing portion of our revenues from the licensing of music through digital distribution channels. We are currently dependent on a small number of leading digital music services. In fiscal year 2019, revenue earned under our license agreements with our top two digital music accounts, Apple and Spotify, accounted for approximately 27% of our total revenues. We have limited ability to increase our wholesale prices to digital music services as a small number of digital music services control much of the legitimate digital music business. If these services were to adopt a lower pricing model or if there were structural changes to other pricing models, we could receive substantially less for our music, which could cause a material reduction in our revenues, unless offset by a corresponding increase in the number of transactions. We currently enter into short-term license agreements with many digital music services and provide our music on an at-will basis to others. There can be no assurance that we will be able to renew or enter into new license agreements with any digital music service. The terms of these license agreements, including the royalty rates that we receive pursuant to them, may change as a result of changes in our bargaining power, changes in the industry, changes in the law, or for other reasons. Decreases in royalty rates, rates of revenue sharing or changes to other terms of these license agreements may materially impact our business, operating results and financial condition. Digital music services generally accept and make available all of the music that we deliver to them. However, if digital music services in the future decide to limit the types or amount of music they will accept from music entertainment companies like us, our revenues could be significantly reduced. See “Business—Recorded Music—Sales and Digital Distribution.”
We are also substantially dependent on a limited number of digital music services for the marketing of our music. A significant proportion of the music streamed on digital music services is from playlists curated by those services or generated from those services’ algorithms. If these services were to fail to include our music on playlists, change the position of our music on playlists or give us less marketing space, it could adversely affect our business, operating results and financial condition.
Under our license agreements and relevant statutes, we receive royalties from digital music services in order to stream or otherwise offer our music. The determination of the amount and timing of such payments is complex and subject to a number of variables, including the revenue generated, the type of music offered and the country in which it is sold, identification of the appropriate licensor, and the service tier on which music is made available. As a result, we may not be paid appropriately for our music. Failure to be accurately paid our royalties may adversely affect our business, operating results, and financial condition.
Our business operations in some foreign countries subject us to trends, developments or other events which may affect us adversely.
We are a global company with strong local presences, which have become increasingly important as the popularity of music originating from a country’s own language and culture has increased in recent years. Our mix of national and international recording artists and songwriters is designed to provide a significant degree of diversification. However, our music does not necessarily enjoy universal appeal and if it does not continue to appeal in various countries, our results of operations could be adversely impacted. As a result, our results can be
25
Table of Contents
affected not only by general industry trends, but also by trends, developments or other events in individual countries, including:
| • | limited legal protection and enforcement of intellectual property rights; |
| • | restrictions on the repatriation of capital; |
| • | fluctuations in interest and foreign exchange rates; |
| • | differences and unexpected changes in regulatory environment, including environmental, health and safety, local planning, zoning and labor laws, rules and regulations; |
| • | varying tax regimes which could adversely affect our results of operations or cash flows, including regulations relating to transfer pricing and withholding taxes on remittances and other payments by subsidiaries and joint ventures; |
| • | exposure to different legal standards and enforcement mechanisms and the associated cost of compliance; |
| • | difficulties in attracting and retaining qualified management and employees or rationalizing our workforce; |
| • | tariffs, duties, export controls and other trade barriers; |
| • | global economic and retail environment; |
| • | longer accounts receivable settlement cycles and difficulties in collecting accounts receivable; |
| • | recessionary trends, inflation and instability of the financial markets; |
| • | higher interest rates; and |
| • | political instability. |
We may not be able to insure or hedge against these risks, and we may not be able to ensure compliance with all of the applicable regulations without incurring additional costs, or at all. For example, our results of operations could be impacted by fluctuations of the U.S. dollar against most currencies. See “—Unfavorable currency exchange rate fluctuations could adversely affect our results of operations.” Furthermore, financing may not be available in countries with less than investment-grade sovereign credit ratings. As a result, it may be difficult to create or maintain profitable operations in various countries.
In addition, our results can be affected by trends, developments and other events in individual countries. There can be no assurance that in the future country-specific trends, developments or other events will not have a significant adverse effect on our business, results of operations or financial condition. Unfavorable conditions can depress revenues in any given market and prompt promotional or other actions that adversely affect our margins.
Unfavorable currency exchange rate fluctuations could adversely affect our results of operations.
As we continue to expand our international operations, we become increasingly exposed to the effects of fluctuations in currency exchange rates. The reporting currency for our financial statements is the U.S. dollar. We have substantial assets, liabilities, revenues and costs denominated in currencies other than U.S. dollars. To prepare our consolidated financial statements, we must translate those assets, liabilities, revenues and expenses into U.S. dollars at then-applicable exchange rates. Consequently, increases and decreases in the value of the U.S. dollar versus other currencies will affect the amount of these items in our consolidated financial statements, even if their value has not changed in their original currency. These translations could result in significant changes to our results of operations from period to period. Prior to intersegment eliminations, 56% of our revenues related to operations in foreign territories for the fiscal year ended September 30, 2019. From time to
26
Table of Contents
time, we enter into foreign exchange contracts to hedge the risk of unfavorable foreign currency exchange rate movements. During the current fiscal year, we have hedged a portion of our material foreign currency exposures related to royalty payments remitted between our foreign affiliates and our U.S. affiliates. However, these hedging strategies should not be expected to fully eliminate the foreign exchange rate risk to which we are exposed.
Our business may be adversely affected by competitive market conditions, and we may not be able to execute our business strategy.
We expect to increase revenues and cash flow through a business strategy which requires us, among other things, to continue to maximize the value of our music, to significantly reduce costs to maximize flexibility and adjust to new realities of the market, to continue to act to contain digital piracy and to diversify our revenue streams into growing segments of the music entertainment business by continuing to capitalize on digital distribution and emerging technologies, entering into expanded-rights deals with recording artists and by operating our artist services businesses.
Each of these initiatives requires sustained management focus, organization and coordination over significant periods of time. Each of these initiatives also requires success in building relationships with third parties and in anticipating and keeping up with technological developments and consumer preferences and may involve the implementation of new business models or distribution platforms. The results of our strategy and the success of our implementation of this strategy will not be known for some time in the future. If we are unable to implement our strategy successfully or properly react to changes in market conditions, our financial condition, results of operations and cash flows could be adversely affected.
Due to the nature of our business, our results of operations and cash flows and the trading price of our common stock may fluctuate significantly from period to period.
Our results of operations are affected by the amount and quality of music that we release, the number of releases that include musical compositions published by us, timing of release schedules and, more importantly, the consumer demand for these releases. We also make advance payments to recording artists and songwriters, which impact our results of operations and operating cash flows. The timing of releases and advance payments is largely based on business and other considerations and is made without regard to the impact of the timing of the release on our financial results. In addition, certain of our license agreements with digital music services contain minimum guarantees and/or require that we are paid minimum guarantee payments. Our results of operations and cash flows in any reporting period may be materially affected by the timing of releases and advance payments and minimum guarantees, which may result in significant fluctuations from period to period, which may have an adverse impact on the price of our Class A common stock.
Our results of operations in any reporting period may also be affected by the Plan, which pays annual bonuses to certain executives based on our free cash flow and offers participants the opportunity to share in appreciation of our common stock. The extent of the benefits awarded under the Plan is affected by our operating results and trading price of our common stock and, as such, to the extent that either or both fluctuates, the value of the award may increase or decrease materially, which could affect our cash flows and results of operations. In connection with this offering, we amended the Plan to provide that, following completion of the offering, Plan participants would no longer have the option to settle deferred amounts in cash or to be paid in cash for redemption of their vested interests in WMG Management Holdings, LLC (“Management LLC”). Instead, following the offering, all deferred interests under the Plan would be settled in or redeemed with shares of our common stock. We currently expect to incur an accounting-related non-cash charge for the quarterly reporting period ending June 30, 2020, which is the next reporting date on which we are required to measure our share-based compensation costs under the Plan, and we currently estimate such charge to be approximately $388 million (assuming the midpoint of the price range set forth on the cover of this prospectus). Our estimate of this Plan-related charge is preliminary and is subject to change due to numerous factors, including the price at which
27
Table of Contents
shares are ultimately sold in this offering. We may also incur non-cash charges in subsequent quarters during which the Plan is in effect. For more information on our accounting for share-based compensation, see “Management’s Discussion and Analysis of Financial Condition and Results of Operation—Critical Accounting Policies—Accounting for Share-Based Compensation.” For additional information on the Plan, see “Executive Compensation—Long-Term Equity Incentives—Warner Music Group Corp. Senior Management Free Cash Flow Plan.”
Our ability to operate effectively could be impaired if we fail to attract and retain our executive officers.
We compete with other music entertainment companies and other companies for top talent, including executive officers. Our success depends, in part, upon the continuing contributions of our executive officers, however, there is no guarantee that they will not leave. Only some of our executive officers have employment agreements. In fiscal year 2019, we did not have an employment agreement with our CEO. Our CEO and certain of our executive officers and members of management are participants in the Plan. The loss of the services of any of our executive officers or key members of management the failure to attract and retain other executive officers could have a material adverse effect on our business or our business prospects.
A significant portion of our revenues are subject to rate regulation either by government entities or by local third-party collecting societies throughout the world and rates on other income streams may be set by governmental proceedings, which may limit our profitability.
Mechanical royalties and performance royalties are two of the main sources of income to our Music Publishing business and mechanical royalties are a significant expense to our Recorded Music business. In the United States, mechanical royalty rates are set every five years pursuant to an administrative process under the U.S. Copyright Act, unless rates are determined through industry negotiations, and performance royalty rates are determined by negotiations with performing rights societies, the largest of which, ASCAP and BMI, are subject to a consent decree rate-setting process if negotiations are unsuccessful. In June 2019, the Antitrust Division of the Department of Justice opened a review of its consent decrees with ASCAP and BMI to determine whether the decrees should be maintained in their current form, modified or terminated. Outside the United States, mechanical and performance royalty rates are typically negotiated on an industry-wide basis. In most territories outside the United States, mechanical royalties are based on a percentage of wholesale prices for physical product and based on a percentage of consumer prices for digital formats. The mechanical and performance royalty rates set pursuant to such processes may adversely affect us by limiting our ability to increase the profitability of our Music Publishing business. If the mechanical and performance royalty rates are set too high it may also adversely affect us by limiting our ability to increase the profitability of our Recorded Music business. In addition, rates our Recorded Music business receives in the United States for webcasting and satellite radio are set every five years by an administrative process under the U.S. Copyright Act unless rates are determined through industry negotiations. It is important as revenues continue to shift from physical to diversified distribution channels that we receive fair value for all of the uses of our intellectual property as our business model now depends upon multiple revenue streams from multiple sources. The rates set for recorded music and music publishing income sources through collecting societies or legally prescribed rate-setting processes could have a material adverse impact on our business prospects.
Failure to obtain, maintain, protect and enforce our intellectual property rights could substantially harm our business, operating results and financial condition.
The success of our business depends on our ability to obtain, maintain, protect and enforce our trademarks, copyrights and other intellectual property rights. The measures that we take to obtain, maintain, protect and enforce our intellectual property rights, including, if necessary, litigation or proceedings before governmental authorities and administrative bodies, may be ineffective, expensive and time-consuming and, despite such measures, third parties may be able to obtain and use our intellectual property rights without our permission. Additionally, changes in law may be implemented, or changes in interpretation of such laws may occur, that may
28
Table of Contents
affect our ability to obtain, maintain, protect or enforce our intellectual property rights. Failure to obtain, maintain, protect or enforce our intellectual property rights could harm our brand or brand recognition and adversely affect our business, financial condition and results of operation.
We also in-license certain major trademarks from third parties, including the WARNER, WARNER MUSIC and WARNER RECORDS trademarks and the “W” logo, pursuant to a perpetual, royalty-free license agreement that may be terminated by the licensor under certain circumstances, including our material breach of the license agreement and certain events of insolvency. Upon any such termination, we may be required to either negotiate a new or reinstated agreement with less favorable terms or otherwise lose our rights to use the licensed trademarks, which may require us to change our corporate name and undergo other significant rebranding efforts. Any such rebranding efforts may be disruptive to our business operations, require us to incur significant expenses and have an adverse effect on our business, financial condition and results of operation.
Our involvement in intellectual property litigation could adversely affect our business.
Our business is highly dependent upon intellectual property, an area that has encountered increased litigation in recent years. If we are alleged to infringe, misappropriate or otherwise violate the intellectual property rights of a third party, any litigation to defend the claim could be costly and would divert the time and resources of management, regardless of the merits of the claim and whether the claim is settled out of court or determined in our favor. There can be no assurance that we would prevail in any such litigation. If we were to lose a litigation relating to intellectual property, we could be forced to pay monetary damages and to cease using certain intellectual property or technologies. Any of the foregoing may adversely affect our business.
Digital piracy continues to adversely impact our business.
A substantial portion of our revenue comes from the distribution of music which is potentially subject to unauthorized consumer copying and widespread digital dissemination without an economic return to us, including as a result of “stream-ripping.” In its Music Listening 2019 report, IFPI surveyed 34,000 Internet users to examine the ways in which music consumers aged 16 to 64 engage with recorded music across 21 countries. Of those surveyed, 23% used illegal stream-ripping services, the leading form of music piracy. Organized industrial piracy may also lead to decreased revenues. The impact of digital piracy on legitimate music revenues and subscriptions is hard to quantify, but we believe that illegal file sharing and other forms of unauthorized activity, including stream manipulation, have a substantial negative impact on music revenues. If we fail to obtain appropriate relief through the judicial process or the complete enforcement of judicial decisions issued in our favor (or if judicial decisions are not in our favor), if we are unsuccessful in our efforts to lobby governments to enact and enforce stronger legal penalties for copyright infringement or if we fail to develop effective means of protecting and enforcing our intellectual property (whether copyrights or other intellectual property rights such as patents, trademarks and trade secrets) or our music entertainment-related products or services, our results of operations, financial position and prospects may suffer.
An impairment in the carrying value of goodwill or other intangible and long-lived assets could negatively affect our operating results and equity.
As of March 31, 2020, we had $1.761 billion of goodwill and $151 million of indefinite-lived intangible assets. Financial Accounting Standards Board (“FASB”) Accounting Standards Codification (“ASC”) Topic 350, Intangibles—Goodwill and Other (“ASC 350”) requires that we test these assets for impairment annually (or more frequently should indications of impairment arise) by first assessing qualitative factors and then by quantitatively estimating the fair value of each of our reporting units (calculated using a discounted cash flow method) and comparing that value to the reporting units’ carrying value, if necessary. If the carrying value exceeds the fair value, there is a potential impairment and additional testing must be performed. In performing our annual tests and determining whether indications of impairment exist, we consider numerous factors including actual and projected operating results of each reporting unit, external market factors such as market
29
Table of Contents
prices for similar assets and trends in the music entertainment industry. We performed an annual assessment, at July 1, 2019, of the recoverability of our goodwill and indefinite-lived intangibles as of September 30, 2019, noting no instances of impairment. However, future events may occur that could adversely affect the estimated fair value of our reporting units. Such events may include, but are not limited to, strategic decisions made in response to changes in economic and competitive conditions and the impact of the economic environment on our operating results. Failure to achieve sufficient levels of cash flow at our reporting units could also result in impairment charges on goodwill and indefinite-lived intangible assets. If the value of the acquired goodwill or acquired indefinite-lived intangible assets is impaired, our operating results and shareholders’ equity could be adversely affected.
We also had $1.644 billion of definite-lived intangible assets as of March 31, 2020. FASB ASC Topic 360-10-35 (“ASC 360-10-35”) requires companies to review these assets for impairment whenever events or changes in circumstances indicate that the carrying amounts may not be recoverable. No such events or circumstances were identified during the fiscal year ended September 30, 2019. If similar events occur as enumerated above such that we believe indicators of impairment are present, we would test for recoverability by comparing the carrying value of the asset to the net undiscounted cash flows expected to be generated from the asset. If those net undiscounted cash flows do not exceed the carrying amount, we would perform the next step, which is to determine the fair value of the asset, which could result in an impairment charge. Any impairment charge recorded could negatively affect our operating results and shareholders’ equity.
We may not have full control and ability to direct the operations we conduct through joint ventures.
We currently have interests in a number of joint ventures and may in the future enter into further joint ventures as a means of conducting our business. In addition, we structure certain of our relationships with recording artists and songwriters as joint ventures. We may not be able to fully control the operations and the assets of our joint ventures, and we may not be able to make major decisions or may not be able to take timely actions with respect to our joint ventures unless our joint venture partners agree.
If we acquire, combine with or invest in other businesses, we will face risks inherent in such transactions.
We have in the past considered and will continue, from time to time, to consider, opportunistic strategic or transformative transactions, which could involve acquisitions, combinations or dispositions of businesses or assets, or strategic alliances or joint ventures with companies engaged in music entertainment, entertainment or other businesses. Any such combination could be material, be difficult to implement, disrupt our business or change our business profile, focus or strategy significantly.
Any future transaction could involve numerous risks, including:
| • | potential disruption of our ongoing business and distraction of management; |
| • | potential loss of recording artists or songwriters from our rosters; |
| • | difficulty integrating the acquired businesses or segregating assets to be disposed of; |
| • | exposure to unknown and/or contingent or other liabilities, including litigation arising in connection with the acquisition, disposition and/or against any businesses we may acquire; |
| • | reputational or other damages to our business as a result of a failure to consummate such a transaction for, among other reasons, failure to gain antitrust approval; and |
| • | changing our business profile in ways that could have unintended consequences. |
If we enter into significant transactions in the future, related accounting charges may affect our financial condition and results of operations, particularly in the case of any acquisitions. In addition, the financing of any significant acquisition may result in changes in our capital structure, including the incurrence of additional
30
Table of Contents
indebtedness, which may be substantial. Conversely, any material disposition could reduce our indebtedness or require the amendment or refinancing of our outstanding indebtedness or a portion thereof. We may not be successful in addressing these risks or any other problems encountered in connection with any strategic or transformative transactions. We cannot assure you that if we make any future acquisitions, investments, strategic alliances or joint ventures or enter into any business combination that they will be completed in a timely manner, or at all, that they will be structured or financed in a way that will enhance our creditworthiness or that they will meet our strategic objectives or otherwise be successful. We also may not be successful in implementing appropriate operational, financial and management systems and controls to achieve the benefits expected to result from these transactions. Failure to effectively manage any of these transactions could result in material increases in costs or reductions in expected revenues, or both. In addition, if any new business in which we invest or which we attempt to develop does not progress as planned, we may not recover the funds and resources we have expended and this could have a negative impact on our businesses or our company as a whole.
We have outsourced certain finance and accounting functions and may outsource other back-office functions, which will make us more dependent upon third parties.
In an effort to be more efficient and generate cost savings, we have outsourced certain finance and accounting functions. As a result, we rely on third parties to ensure that our needs are sufficiently met. This reliance subjects us to risks arising from the loss of control over processes, changes in pricing that may affect our operating results, and potentially, termination of provisions of these services by our suppliers. A failure of our service providers to perform services in a satisfactory manner may have a significant adverse effect on our business. We may outsource other back-office functions in the future, which would increase our reliance on third parties.
We have engaged in substantial restructuring activities in the past, and may need to implement further restructurings in the future and our restructuring efforts may not be successful or generate expected cost savings.
Our business is significantly impacted by ongoing changes in the music entertainment industry. In response, we actively seek to adapt our cost structure to the changing economics of the industry. For example, we have shifted and continue to shift resources from our physical sales channels to efforts focused on digital channels, emerging technologies and other new revenue streams, and we continue our efforts to reduce overhead and manage our variable and fixed-cost structure. In fiscal year 2018, we completed the creation of our new center of excellence for U.S. financial shared services in Nashville, Tennessee, which combined our U.S. transactional financial functions in one location. To establish the new center, we moved some of our U.S. departments to Nashville. In August 2019, we announced that we were beginning a financial transformation initiative to upgrade our information technology and finance infrastructure over the next two years, including related systems and processes. We expect to incur material costs in connection with this project, and there can be no assurance that we will be successful in upgrading our systems and processes effectively or on the timetable and at the costs contemplated, or that we will achieve the expected long-term cost savings.
We cannot be certain that we will not be required to implement further restructuring activities, make additions or other changes to our management or workforce based on other cost reduction measures or changes in the markets and industry in which we compete. Our inability to structure our operations based on evolving market conditions could impact our business. Restructuring activities can create unanticipated consequences and negative impacts on the business, and we cannot be sure that any ongoing or future restructuring efforts will be successful or generate expected cost savings.
31
Table of Contents
If we or our service providers do not maintain the security of information relating to our customers, employees and vendors and our music, security information breaches through cyber security attacks or otherwise could damage our reputation with customers, employees, vendors and artists, and we could incur substantial additional costs, become subject to litigation and our results of operations and financial condition could be adversely affected. Moreover, even if we or our service providers maintain such security, such breaches remain a possibility due to the fact that no data security system is immune from attacks or other incidents.
We receive certain personal information about our customers and potential customers, and we also receive personal information concerning our employees, artists and vendors. In addition, our online operations depend upon the secure transmission of confidential information over public networks. We maintain security measures with respect to such information, but despite these measures, are vulnerable to security breaches by computer hackers and others that attempt to penetrate the security measures that we have in place. A compromise of our security systems (through cyber-attacks, which are rapidly evolving and sophisticated, or otherwise) that results in personal information being obtained by unauthorized persons or other bad acts could adversely affect our reputation with our customers, potential customers, employees, artists and vendors, as well as our operations, results of operations, financial condition and liquidity, and could result in litigation against us or the imposition of governmental penalties. Unauthorized persons have also attempted to redirect payments to or from us. If any such attempt were successful, we could lose and fail to recover the redirected funds, which loss could be material. We may also be subject to cyber-attacks that target our music, including not-yet-released music. The theft and premature release of this music may adversely affect our reputation with current and potential artists and adversely impact our results of operations and financial condition. In addition, a security breach could require that we expend significant additional resources related to our information security systems and could result in a disruption of our operations.
We increasingly rely on third-party data storage providers, including cloud storage solution providers, resulting in less direct control over our data. Such third parties may also be vulnerable to security breaches and compromised security systems, which could adversely affect our business.
Evolving laws and regulations concerning data privacy may result in increased regulation and different industry standards, which could increase the costs of operations or limit our activities.
We engage in a wide array of online activities and are thus subject to a broad range of related laws and regulations including, for example, those relating to privacy, consumer protection, data retention and data protection, online behavioral advertising, geo-location tracking, text messaging, e-mail advertising, mobile advertising, content regulation, defamation, age verification, the protection of children online, social media and other Internet, mobile and online-related prohibitions and restrictions. The regulatory framework for privacy and data security issues worldwide has become increasingly burdensome and complex, and is likely to continue to be so for the foreseeable future. Practices regarding the collection, use, storage, transmission, security and disclosure of personal information by companies operating over the Internet and mobile platforms are receiving ever-increasing public and governmental scrutiny. The U.S. government, including Congress, the Federal Trade Commission and the Department of Commerce, has announced that it is reviewing the need for even greater regulation for the collection of information concerning consumer behavior on the Internet and mobile platforms, including regulation aimed at restricting certain targeted advertising practices, the use of location data and disclosures of privacy practices in the online and mobile environments, including with respect to online and mobile applications. State governments are engaged in similar legislative and regulatory activities. In addition, privacy and data security laws and regulations around the world are being implemented rapidly and evolving. These new and evolving laws (including the European Union General Data Protection Regulation effective on May 25, 2018 and the California Consumer Privacy Act effective on January 1, 2020) are likely to result in greater compliance burdens for companies with global operations. Globally, many government and consumer agencies have also called for new regulation and changes in industry practices with respect to information collected from consumers, electronic marketing and the use of third-party cookies, web beacons and similar technology for online behavioral advertising.
32
Table of Contents
The Federal Trade Commission adopted certain revisions to its rule promulgated pursuant to the Children’s Online Privacy Protection Act (“COPPA”), effective as of July 1, 2013, that may impose greater compliance burdens on us. COPPA imposes a number of obligations, such as obtaining verifiable parental permission on operators of websites, apps and other online services to the extent they collect certain information from children who are under 13 years of age. The changes broaden the applicability of COPPA, including by expanding the definition of “personal information” subject to the rule’s parental consent and other obligations.
Our business, including our ability to operate and expand internationally, could be adversely affected if laws or regulations are adopted, interpreted or implemented in a manner that is inconsistent with our current business practices and that require changes to these practices. Therefore, our business could be harmed by any significant change to applicable laws, regulations or industry practices regarding the collection, use or disclosure of customer data, or regarding the manner in which the express or implied consent of consumers for such collection, use and disclosure is obtained. Such changes may require us to modify our operations, possibly in a material manner, and may limit our ability to develop new products, services, mechanisms, platforms and features that make use of data regarding our customers and potential customers. Any actual or alleged violations of laws and regulations relating to privacy and data security, and any relevant claims, may expose us to potential liability, fines and may require us to expend significant resources in responding to and defending such allegations and claims, regardless of merit. Claims or allegations that we have violated laws and regulations relating to privacy and data security could also result in negative publicity and a loss of confidence in us.
The enactment of legislation limiting the terms by which an individual can be bound under a “personal services” contract could impair our ability to retain the services of key artists.
California Labor Code Section 2855 (“Section 2855”) limits the duration of time any individual can be bound under a contract for “personal services” to a maximum of seven years. In 1987, Subsection (b) was added, which provides a limited exception to Section 2855 for recording contracts, creating a damages remedy for record companies. Such legislation could result in certain of our existing contracts with artists being declared
unenforceable, or may restrict the terms under which we enter into contracts with artists in the future, either of
which could adversely affect our results of operations. There is no assurance that California will not introduce legislation in the future seeking to repeal Subsection (b). The repeal of Subsection (b) and/or the passage of legislation similar to Section 2855 by other states could materially adversely affect our results of operations and financial position.
We face a potential loss of catalog to the extent that our recording artists have a right to recapture rights in their recordings under the U.S. Copyright Act.
The U.S. Copyright Act provides authors (or their heirs) a right to terminate U.S. licenses or assignments of rights in their copyrighted works in certain circumstances. This right does not apply to works that are “works made for hire.” Since the enactment of the Sound Recordings Act of 1971, which first accorded federal copyright protection for sound recordings in the U.S., virtually all of our agreements with recording artists provide that such recording artists render services under a work-made-for-hire relationship. A termination right exists under the U.S. Copyright Act for U.S. rights in musical compositions that are not “works made for hire.” If any of our commercially available sound recordings were determined not to be “works made for hire,” then the recording artists (or their heirs) could have the right to terminate the U.S. federal copyright rights they granted to us, generally during a five-year period starting at the end of 35 years from the date of release of a recording under a post-1977 license or assignment (or, in the case of a pre-1978 grant in a pre-1978 recording, generally during a five-year period starting at the end of 56 years from the date of copyright). A termination of U.S. federal copyright rights could have an adverse effect on our Recorded Music business. From time to time, authors (or their heirs) have the opportunity to terminate our U.S. rights in musical compositions. We believe the effect of any potential terminations is already reflected in the financial results of our business.
33
Table of Contents
If our recording artists and songwriters are characterized as employees, we would be subject to employment and withholding liabilities.
Although we believe that the recording artists and songwriters with which we partner are properly characterized as independent contractors, tax or other regulatory authorities may in the future challenge our characterization of these relationships. We are aware of a number of judicial decisions and legislative proposals that could bring about major reforms in worker classification, including the California legislature’s recent passage of California Assembly Bill 5 (“AB 5”). AB 5 purports to codify a new test for determining worker classification that is widely viewed as expanding the scope of employee relationships and narrowing the scope of independent contractor relationships. Given AB 5’s recent passage, there is no guidance from the regulatory authorities charged with its enforcement, and there is a significant degree of uncertainty regarding its application. In addition, AB 5 has been the subject of widespread national discussion and it is possible that other jurisdictions may enact similar laws. If such regulatory authorities or state, federal or foreign courts were to determine that our recording artists and songwriters are employees, and not independent contractors, we would be required to withhold income taxes, to withhold and pay Social Security, Medicare and similar taxes and to pay unemployment and other related payroll taxes. We would also be liable for unpaid past taxes and subject to penalties. As a result, any determination that our recording artists and songwriters are our employees could have a material adverse effect on our business, financial condition and results of operations.
Fulfilling our obligations incident to being a public company will be expensive and time-consuming, and any delays or difficulties in satisfying these obligations could have a material adverse effect on our future results of operations and our stock price.
Following this offering, we will be subject to the reporting, accounting and corporate governance requirements applicable to issuers of listed equity, including the listing standards of Nasdaq and the Sarbanes-Oxley Act. The expenses associated with being a public company include increases in auditing, accounting and legal fees and expenses, investor relations expenses, increased directors’ fees and director and officer liability insurance costs, registrar and transfer agent fees and listing fees, as well as other expenses. Failure to comply with any of the public company requirements applicable to us following the offering could potentially subject us to sanctions or investigations by the U.S. Securities and Exchange Commission (the “SEC”) or other regulatory authorities.
Risks Related to Our Leverage
Our substantial leverage on a consolidated basis could adversely affect our ability to raise additional capital to fund our operations, limit our ability to react to changes in the economy or our industry and prevent us from meeting our obligations under our indebtedness.
We are highly leveraged. As of March 31, 2020, our total consolidated indebtedness, net of deferred financing costs, was $2.983 billion. In addition, we would have been able to borrow up to $167 million under our Revolving Credit Facility (as defined later in this prospectus) as of March 31, 2020 (after giving effect to approximately $13 million of letters of credit outstanding under our Revolving Credit Facility as of March 31, 2020).
Our high degree of leverage could have important consequences for our investors. For example, it may make it more difficult for us to make payments on our indebtedness; increase our vulnerability to general economic and industry conditions, including recessions and periods of significant inflation and financial market volatility; expose us to the risk of increased interest rates because any borrowings we make under the revolving portion of our Senior Credit Facilities will bear interest at variable rates; require us to use a substantial portion of our cash flow from operations to service our indebtedness, thereby reducing our ability to fund working capital, capital expenditures and other expenses; limit our ability to refinance existing indebtedness on favorable terms or at all or borrow additional funds in the future for, among other things, working capital, acquisitions or debt
34
Table of Contents
service requirements; limit our flexibility in planning for, or reacting to, changes in our business and the industries in which we operate; place us at a competitive disadvantage compared to competitors that have less indebtedness; and limit our ability to borrow additional funds that may be needed to operate and expand our business.
We and our subsidiaries may be able to incur substantial additional indebtedness in the future, subject to the restrictions contained in the indentures governing our outstanding notes as well as under the Senior Credit Facilities. If new indebtedness is added to our current debt levels, the related risks that we and our subsidiaries now face could intensify.
The indentures that govern our outstanding notes and the Senior Credit Facilities contain restrictive covenants that limit our ability to engage in activities that may be in our long-term best interests. Those covenants include restrictions on our ability to, among other things, incur more indebtedness, pay dividends, redeem stock or make other distributions, make investments, create liens, transfer or sell assets, merge or consolidate and enter into certain transactions with our affiliates. Our failure to comply with those covenants could result in an event of default, which, if not cured or waived, could result in the acceleration of all of our indebtedness. See also “—Our debt agreements contain restrictions that limit our flexibility in operating our business.” Any such event of default or acceleration could have an adverse effect on the trading price of our common stock.
As a holding company, WMG depends on the ability of its subsidiaries to transfer funds to it to meet its obligations.
WMG is a holding company for all of our operations and is a legal entity separate from its subsidiaries. Dividends and other distributions from WMG’s subsidiaries are the principal sources of funds available to WMG to pay corporate operating expenses, to pay stockholder dividends, to repurchase stock and to meet its other obligations. The inability to receive dividends from our subsidiaries could have a material adverse effect on our business, financial condition, liquidity or results of operations.
The subsidiaries of WMG have no obligation to pay amounts due on any liabilities of WMG or to make funds available to WMG for such payments. The ability of our subsidiaries to pay dividends or other distributions to WMG in the future will depend, among other things, on their earnings, tax considerations and covenants contained in any financing or other agreements, such as the covenants governing our current indebtedness which restrict the ability of Acquisition Corp. to pay dividends and make distributions. In addition, such payments may be limited as a result of claims against our subsidiaries by their creditors, including suppliers, vendors, lessors and employees.
If the ability of our subsidiaries to pay dividends or make other distributions or payments to WMG is materially restricted by cash needs, bankruptcy or insolvency, or is limited due to operating results or other factors, we may be required to raise cash through the incurrence of debt, the issuance of equity or the sale of assets. However, there is no assurance that we would be able to raise sufficient cash by these means. This could materially and adversely affect our ability to pay our obligations or pay dividends, which could have an adverse effect on the trading price of our common stock.
Acquisition Corp. may not be able to generate sufficient cash to service all of its indebtedness, and may be forced to take other actions to satisfy its obligations under its indebtedness, which may not be successful.
Acquisition Corp.’s ability to make scheduled payments on or to refinance its debt obligations depends on its financial condition and operating performance, which is subject to prevailing economic and competitive conditions and to certain financial, business and other factors beyond our control. Acquisition Corp. may not maintain a level of cash flow from operating activities sufficient to permit us to pay the principal, premium, if any, and interest on our indebtedness.
35
Table of Contents
Acquisition Corp. will rely on its subsidiaries to make payments on its borrowings. If these subsidiaries do not dividend funds to Acquisition Corp. in an amount sufficient to make such payments, if necessary in the future, Acquisition Corp. may default under the indentures or credit facilities governing its borrowings, which would result in all such borrowings becoming due and payable.
Our debt agreements contain restrictions that limit our flexibility in operating our business.
The indentures governing our outstanding notes contain various covenants that limit our ability to engage in specified types of transactions. These covenants limit our ability and the ability of our restricted subsidiaries to, among other things: incur additional debt or issue certain preferred shares; create liens on certain debt; pay dividends on or make distributions in respect of our capital stock or make investments or other restricted payments; sell certain assets; pay dividends to us (in the case of our restricted subsidiaries) or make certain other intercompany transfers; enter into certain transactions with our affiliates; and consolidate, merge, sell or otherwise dispose of all or substantially all of our assets.
In addition, the credit agreements governing the Senior Credit Facilities contain a number of covenants that limit our ability and the ability of our restricted subsidiaries to: pay dividends on, and redeem and purchase, equity interests; make other restricted payments; make prepayments on, redeem or repurchase certain debt; incur certain liens; make certain loans and investments; incur certain additional debt; enter into guarantees and hedging arrangements; enter into mergers, acquisitions and asset sales; enter into transactions with affiliates; change the business we and our subsidiaries conduct; pay dividends or make distributions; amend the terms of subordinated debt and unsecured bonds; and make certain capital expenditures.
Our ability to borrow additional amounts under the revolving portion of the Senior Credit Facilities depends upon satisfaction of these covenants. Events beyond our control can affect our ability to meet these covenants. In addition, under the credit agreement governing the revolving portion of the Senior Credit Facilities, a financial maintenance covenant is applicable if at the end of a quarter the outstanding amount of loans and letters of credit is in excess of $105 million.
Our failure to comply with obligations under the instruments governing our indebtedness may result in an event of default under such instruments. We cannot be certain that we will have funds available to remedy these defaults. A default, if not cured or waived, may permit acceleration of our indebtedness. If our indebtedness is accelerated, we cannot be certain that we will have sufficient funds available to pay the accelerated indebtedness or will have the ability to refinance the accelerated indebtedness on terms favorable to us or at all.
All of these restrictions could affect our ability to operate our business or may limit our ability to take advantage of potential business opportunities as they arise, and may have an adverse effect on the trading price of our common stock. We may, from time to time, refinance our existing indebtedness, which could result in the agreements governing any new indebtedness having fewer or less restrictive covenants, including removing or lessening restrictions on our ability to incur additional indebtedness or make restricted payments.
If our cash flows and capital resources are insufficient to fund our debt service obligations, we may be forced to reduce or delay investments in recording artists and songwriters, capital expenditures or dividends, or to sell assets, seek additional capital or restructure or refinance our indebtedness. These alternative measures may not be successful and may not permit us to meet our scheduled debt service obligations. In the absence of such operating results and resources, we could face substantial liquidity problems and might be required to dispose of material assets or operations to meet our debt service and other obligations. The indentures governing our outstanding notes restrict our ability to dispose of assets and use the proceeds from dispositions. We may not be able to consummate those dispositions or to obtain the proceeds which we could realize from them and these proceeds may not be adequate to meet any debt service obligations then due. While subject to certain restrictions in our debt agreements, if we were to pay dividends to our shareholders, the funds used to make such dividend payments would not be available to service our indebtedness.
36
Table of Contents
Despite our indebtedness levels, we may be able to incur substantially more indebtedness, which may increase the risks created by our substantial indebtedness.
We may be able to incur substantial additional indebtedness, including additional secured indebtedness, in the future. The indentures governing our outstanding notes and the credit agreements governing the Senior Credit Facilities will not fully prohibit us, Holdings or our subsidiaries from incurring additional indebtedness under certain circumstances. If we, Holdings or our subsidiaries are in compliance with certain incurrence ratios set forth in such indentures, we, Holdings or our subsidiaries may be able to incur substantial additional indebtedness, which may increase the risks created by our current substantial indebtedness.
Our ability to incur secured indebtedness is subject to compliance with certain secured leverage ratios that are calculated as of the date of incurrence. The amount of secured indebtedness that we are able to incur and the timing of any such incurrence under these ratios vary from time to time and are a function of several variables, including our outstanding indebtedness and our results of operations calculated as of specified dates or for certain periods.
To the extent that the terms of our current debt agreements would prevent us from incurring additional indebtedness, we may be able to obtain amendments to those agreements that would allow us to incur such additional indebtedness, and such additional indebtedness could be material.
A downgrade, suspension or withdrawal of the rating assigned by a rating agency to us could cause the liquidity or market value of our indebtedness to decline and our cost of capital to increase.
Any future lowering of our ratings may make it more difficult or more expensive for us to obtain additional debt financing. Therefore, although reductions in our debt ratings may not have an immediate impact on the cost of debt or our liquidity, they may impact the cost of debt and liquidity over the medium term and future access at a reasonable rate to the debt markets may be adversely impacted.
Risks Related to Our Controlling Stockholder
Following the completion of this offering, Access will continue to control us and may have conflicts of interest with other stockholders. Conflicts of interest may arise because affiliates of our controlling stockholder have continuing agreements and business relationships with us.
Upon completion of this offering, Access will hold approximately 99.2% of the total combined voting power of our outstanding common stock (or 99.1% of the total combined voting power if the underwriters exercise in full their option to purchase additional shares of Class A common stock from the selling stockholders), and 86.3% of the economic interest of our outstanding common stock (or 84.2% of the economic interest if the underwriters exercise in full their option to purchase additional shares of Class A common stock from the selling stockholders). As a result, and in addition to certain other rights granted to Access as disclosed elsewhere in this prospectus, Access will continue to be able to control the election of our directors, affect our legal and capital structure, change our management, determine our corporate and management policies and determine, without the consent of our other stockholders, the outcome of any corporate transaction or other matter submitted to our stockholders for approval, including potential mergers or acquisitions, asset sales and other significant corporate transactions. Access will also have sufficient voting power to amend our organizational documents. In addition, under the provisions of a stockholder agreement that we will enter into with Access prior to the consummation of this offering (the “Stockholder Agreement”), the relevant terms of which will govern the powers afforded the Company under our organizational documents, Access will have consent rights with respect to certain corporate and business activities that we may undertake, including during periods where Access holds less than a majority of the total combined voting power of our outstanding common stock. Specifically, the Stockholder Agreement will provide that, until the date on which Access ceases to hold at least 10% of our outstanding common stock, Access’s prior written consent will be required before we may take
37
Table of Contents
certain corporate and business actions, whether directly or indirectly through a subsidiary, including, among others, the following:
| • | any merger, consolidation or similar transaction (or any amendment to or termination of an agreement to enter into such a transaction) with or into any other person whether in a single transaction or a series of transactions, subject to certain specified exceptions; |
| • | any acquisition or disposition of securities, assets or liabilities, subject to certain specified exceptions; |
| • | any change in our authorized capital stock or the creation of any new class or series of our capital stock; |
| • | any issuance or acquisition of capital stock (including stock buy-backs, redemptions or other reductions of capital), or securities convertible into or exchangeable or exercisable for capital stock or equity-linked securities, subject to certain specified exceptions; |
| • | any issuance or acquisition of debt securities to or from a third party, subject to certain specified exceptions; and |
| • | any amendment (or approval or recommendation of any amendment) to our certificate of incorporation or by-laws. |
As a result of these consent rights, Access will maintain significant control over our corporate and business activities until such rights cease. For additional discussion of Access’s consent rights under the Stockholder Agreement, see “Certain Relationships and Related Party Transactions—Stockholder Agreement—Consent Rights.”
Additionally, until Access ceases to hold more than 50% of the total combined voting power of our outstanding common stock, pursuant to Section 141(a) of the General Corporation Law of the State of Delaware (“DGCL”), the Executive Committee will have all of the power and authority (including voting power) of our board of directors. The Executive Committee will have the authority to approve any actions of the Company, except for matters that must be approved by the Audit Committee of our board of directors (or both the Executive Committee and the Audit Committee), or by a committee or sub-committee qualified to grant equity to persons subject to Section 16 of the Securities Exchange Act of 1934, as amended (the “Exchange Act”) for purposes of exempting transactions pursuant to Section 16b-3 thereunder, or as required under Delaware law, SEC rules and Nasdaq rules. See “Management—Board Composition and Director Independence.”
Access also has the power to direct us to engage in strategic transactions, with or involving other companies in our industry, including acquisitions, combinations or dispositions, and the acquisition of certain assets that may become available for purchase, and any such transaction could be material. Any such transaction would carry the risks set forth above under “—If we acquire, combine with or invest in other businesses, we will face certain risks inherent in such transactions.”
Our amended and restated certificate of incorporation and our amended and restated by-laws will also include a number of provisions that may discourage, delay or prevent a change in our management or control for so long as Access owns specified percentages of our common stock. See “—Risks Related to Our Common Stock and This Offering—Anti-takeover provisions in our amended and restated certificate of incorporation and amended and restated by-laws and Delaware law could discourage, delay or prevent a change of control of our company and may affect the trading price of our Class A common stock.” These provisions not only could have a negative impact on the trading price of our Class A common stock, but could also allow Access to delay or prevent a corporate transaction of which the public stockholders approve.
Additionally, Access is in the business of making investments in companies and is actively seeking to acquire interests in businesses that operate in our industry and other industries and may compete, directly or indirectly, with us. Access may also pursue acquisition opportunities that may be complementary to our business,
38
Table of Contents
which could have the effect of making such acquisition opportunities unavailable to us. Access could elect to cause us to enter into business combinations or other transactions with any business or businesses in our industry that Access may acquire or control, or we could become part of a group of companies organized under the ultimate common control of Access that may be operated in a manner different from the manner in which we have historically operated. Any such business combination transaction could require that we or such group of companies incur additional indebtedness, and could also require us or any acquired business to make divestitures of assets necessary or desirable to obtain regulatory approval for such transaction. The amounts of such additional indebtedness, and the size of any such divestitures, could be material. Access may also from time to time purchase outstanding debt securities that we issued, and could also subsequently sell any such debt securities. Any such purchase or sale may affect the value of, trading price or liquidity of our debt securities. See “—Under our amended and restated certificate of incorporation, Access and its affiliates, and in some circumstances, any of our directors and officers who is also a director, officer, employee, stockholder, member or partner of Access and its affiliates, have no obligation to offer us corporate opportunities.”
Conflicts of interest may arise between our controlling stockholder and us. Affiliates of our controlling stockholder engage in transactions with us. Further, Access may, from time to time, acquire and hold interests in businesses that compete directly or indirectly with us, and they may either directly, or through affiliates, also maintain business relationships with companies that may directly compete with us. In general, Access or its affiliates could pursue business interests or exercise their voting power as stockholders in ways that are detrimental to us but beneficial to themselves or to other companies in which they invest or with whom they have a material relationship. In addition, a number of persons who currently are our directors and officers have been and remain otherwise affiliated with Access and, in some cases, such affiliations also involve financial interests. These relationships may create, or may create the appearance of, conflicts of interest when these directors and officers are faced with decisions that could have different implications for Access and us.
As a result of these relationships, the interests of Access may not coincide with our interests or the interests of the holders of our Class A common stock. So long as Access continues to control a significant amount of the total combined voting power of our outstanding common stock, Access will continue to be able to strongly influence or effectively control our decisions, including potential mergers or acquisitions, asset sales and other significant corporate transactions.
Under our amended and restated certificate of incorporation, Access and its affiliates, and in some circumstances, any of our directors and officers who is also a director, officer, employee, stockholder, member or partner of Access and its affiliates, have no obligation to offer us corporate opportunities.
The policies relating to corporate opportunities and transactions with Access and its affiliates to be set forth in our amended and restated certificate of incorporation, address potential conflicts of interest between the Company, on the one hand, and Access, its affiliates and its directors, officers, employees, stockholders, members or partners who are directors or officers of the Company, on the other hand. Our amended and restated certificate of incorporation will provide that we, on our behalf and on behalf of our subsidiaries, renounce any interest or expectancy in, or in being offered an opportunity to participate in, corporate opportunities, that are from time to time presented to Access or any of its affiliates, directors, officers, employees, stockholders, members or partners, even if the opportunity is one that we or our subsidiaries might reasonably be deemed to have pursued or had the ability or desire to pursue if granted the opportunity to do so. None of Access, its affiliates or any of its directors, officers, employees, stockholders, members or partners will generally be liable to us or any of our subsidiaries for breach of any fiduciary or other duty, as a director or otherwise, by reason of the fact that such person pursues, acquires or participates in such corporate opportunity, directs such corporate opportunity to another person or fails to present such corporate opportunity, or information regarding such corporate opportunity, to us or our subsidiaries unless, in the case of any such person who is a director or officer, such corporate opportunity is expressly offered to such director or officer in writing solely in his or her capacity as a director or officer. To the fullest extent permitted by law, by becoming a stockholder in our company, stockholders will be deemed to have notice of and consented to this provision of our amended and restated
39
Table of Contents
certificate of incorporation. Although these provisions are designed to resolve conflicts between us and Access and its affiliates fairly, conflicts may not be resolved in our favor or be resolved at all.
If Access sells a controlling interest in our company to a third party in a private transaction, you may not realize any change of control premium on shares of our Class A common stock and we may become subject to the control of a presently unknown third party.
Following the completion of this offering, Access will have the ability, should it choose to do so, to sell some or all of its shares of our common stock in a privately negotiated transaction. If such a transaction were to be sufficient in size, it could result in a change of control of the Company. The ability of Access to privately sell such shares of our common stock, with no requirement for a concurrent offer to be made to acquire all of the shares of our Class A common stock that will be publicly traded hereafter, could prevent you from realizing any change of control premium on your shares of our Class A common stock that may otherwise accrue to Access upon its private sale of our common stock. Additionally, if Access privately sells a significant equity interest in us, we may become subject to the control of a presently unknown third party. Such third party may have conflicts of interest with the interests of other stockholders.
Risks Related to Our Common Stock and This Offering
The dual class structure of our common stock and the existing ownership of Class B common stock by Access have the effect of concentrating voting control with Access for the foreseeable future, which will limit or preclude your ability to influence corporate matters.
Our Class A common stock, which is the stock being offered in this offering, has one vote per share, and our Class B common stock has 20 votes per share. Given the greater number of votes per share attributed to our Class B common stock, Access, who is our only Class B stockholder, will hold approximately 99.2% of total combined voting power of our outstanding common stock following the completion of this offering (or approximately 99.1% of the total combined voting power of our outstanding common stock if the underwriters exercise in full their option to purchase additional shares of our Class A common stock). As a result of our dual class ownership structure, Access will be able to exert a significant degree of influence or actual control over our management and affairs and over matters requiring stockholder approval, including the election of directors, mergers or acquisitions, asset sales and other significant corporate transactions. Further, Access will own shares representing approximately 86.3% of the economic interest of our outstanding common stock following this offering (or approximately 84.2% of the economic interest of our outstanding common stock if the underwriters exercise in full their option to purchase additional shares of our Class A common stock). Because of the 20-to-1 voting ratio between the Class B common stock and Class A common stock, the holders of Class B common stock collectively will continue to control a majority of the total combined voting power of our outstanding common stock and therefore be able to control all matters submitted to our stockholders for approval, so long as the outstanding shares of Class B common stock represent at least approximately 10% of the total number of outstanding shares of common stock. This concentrated control will limit your ability to influence corporate matters for the foreseeable future. For example, Access will be able to control elections of directors, amendments of our certificate of incorporation or by-laws, increases to the number of shares available for issuance under our equity incentive plans or adoption of new equity incentive plans and approval of any merger or sale of assets for the foreseeable future. This control may materially adversely affect the market price of our Class A common stock.
Additionally, the holders of our Class B common stock may cause us to make strategic decisions or pursue acquisitions that could involve risks to you or may not be aligned with your interests. The holders of our Class B common stock will also be entitled to a separate vote in the event we seek to amend our certificate of incorporation.
40
Table of Contents
The difference in the voting rights of our Class A common stock and Class B common stock may harm the value and liquidity of our Class A common stock.
The difference in the voting rights of our Class A common stock and Class B common stock could harm the value of our Class A common stock to the extent that any investor or potential future purchaser of our Class A common stock ascribes value to the right of holders of our Class B common stock to 20 votes per share of Class B common stock. The existence of two classes of common stock could also result in less liquidity for our Class A common stock than if there were only one class of our common stock.
Our dual class structure may depress the trading price of our Class A common stock.
Our dual class structure may result in a lower or more volatile market price of our Class A common stock or in adverse publicity or other adverse consequences. For example, certain index providers have announced restrictions on including companies with dual or multiple class share structures in certain of their indexes. S&P Dow Jones and FTSE Russell have announced changes to their eligibility criteria for inclusion of shares of public companies on certain indices, including the S&P 500. These changes exclude companies with multiple classes of shares of common stock from being added to these indices. In addition, several stockholder advisory firms have announced their opposition to the use of dual or multiple class structures. As a result, the dual class structure of our common stock may prevent the inclusion of our Class A common stock in these indices and may cause stockholder advisory firms to publish negative commentary about our corporate governance practices or otherwise seek to cause us to change our capital structure. Any such exclusion from indices could result in a less active trading market for our Class A common stock. Any actions or publications by stockholder advisory firms critical of our corporate governance practices or capital structure could also adversely affect the value of our Class A common stock.
Future sales of shares by existing stockholders could cause our stock price to decline.
Sales of substantial amounts of our Class A common stock in the public market following this offering, or the perception that these sales could occur, could cause the market price of our Class A common stock to decline. These sales, or the possibility that these sales may occur, also might make it more difficult for us to sell equity securities in the future at a time and at a price that we deem appropriate.
Based on shares outstanding as of May 15, 2020, upon the completion of this offering, we will have 70,000,000 outstanding shares of Class A common stock and 440,000,000 outstanding shares of Class B common stock. All of the shares sold pursuant to this offering will be immediately tradable without restriction under the Securities Act of 1933, as amended, or the “Securities Act,” except for any shares held by “affiliates,” as that term is defined in Rule 144 under the Securities Act, or “Rule 144.”
The remaining shares of Class B common stock outstanding as of May 15, 2020 will be restricted securities within the meaning of Rule 144, but will be eligible for resale subject, in certain cases, to applicable volume, manner of sale, holding period and other limitations of Rule 144 or pursuant to an exception from registration under Rule 701 under the Securities Act, or “Rule 701,” subject to the terms of the lock-up agreements described below.
Upon the completion of this offering, we intend to file one or more registration statements on Form S-8 under the Securities Act to register the shares of Class A common stock to be issued under our equity compensation plans, including the Plan, and, as a result, all shares of Class A common stock acquired upon settlement of deferred equity units granted under the Plan will also be freely tradable under the Securities Act, subject to the terms of the lock-up agreements, unless purchased by our affiliates. In addition, 31,169,099 shares of our Class A common stock are reserved for future issuances under the Omnibus Incentive Plan to be adopted in connection with this offering over the 10-year period from the date of adoption.
In connection with this offering, we, the selling stockholders, all of our directors and executive officers and the holders of all of our outstanding stock have entered into lock-up agreements under which, subject to certain
41
Table of Contents
exceptions, we and they have agreed not to sell, transfer or dispose of or hedge, directly or indirectly, any shares of our Class A common stock or any securities convertible into or exercisable or exchangeable for shares of our Class A common stock for a period of 180 days after the date of this prospectus, except with the prior written consent of Morgan Stanley & Co. LLC. Following the expiration of this 180-day lock-up period, approximately 440,000,000 shares of our Class A common stock (assuming conversion of all shares of Class B common stock into shares of Class A common stock) will be eligible for future sale, subject to the applicable volume, manner of sale, holding period and other limitations of Rule 144 or pursuant to an exception from registration under Rule 701. As resale restrictions end, the market price of our Class A common stock could decline if Access sells its shares or is perceived by the market as intending to sell them. Morgan Stanley & Co. LLC may, in its sole discretion and at any time, release all or any portion of the securities subject to lock-up agreements entered into in connection with this offering. Furthermore, subject to the expiration or waiver of the lock-up agreements, Access will have the right to require us to register shares of common stock for resale in some circumstances pursuant to a registration rights agreement we will enter into with Access.
In the future, we may issue additional shares of Class A common stock, Class B common stock or other equity or debt securities convertible into or exercisable or exchangeable for shares of our Class A common stock in connection with a financing, strategic investment, litigation settlement or employee arrangement or otherwise. Any of these issuances could result in substantial dilution to our existing stockholders and could cause the trading price of our Class A common stock to decline.
Our Class A common stock has no prior public market, and the market price of our Class A common stock may be volatile and could decline after this offering.
Prior to this offering, there has been no public market for our Class A common stock, and an active market for our Class A common stock may not develop or be sustained after this offering. We have been approved to list our Class A common stock on Nasdaq. We and the selling stockholders negotiated the initial public offering price per share with the representatives of the underwriters and, therefore, that price may not be indicative of the market price of our Class A common stock after this offering. We cannot assure you that an active public market for our Class A common stock will develop after this offering or, if one does develop, that it will be sustained. In the absence of an active public trading market, you may not be able to sell your shares. An inactive market may also impair our ability to raise capital to continue to fund operations by selling shares and may impair our ability to make strategic investments by using our shares as consideration. In addition, the market price of our Class A common stock may fluctuate significantly. Among the factors that could affect our stock price are:
| • | industry or general market conditions; |
| • | domestic and international economic factors unrelated to our performance; |
| • | changes in our customers’ preferences; |
| • | changes in law or regulation; |
| • | lawsuits, enforcement actions and other claims by third parties or governmental authorities; |
| • | adverse publicity related to us or another industry participant; |
| • | actual or anticipated fluctuations in our operating results; |
| • | changes in securities analysts’ estimates of our financial performance or lack of research coverage and reports by industry analysts; |
| • | action by institutional stockholders or other large stockholders (including Access), including future sales of our Class A common stock; |
| • | failure to meet any guidance given by us or any change in any guidance given by us, or changes by us in our guidance practices; |
| • | speculation in the press or investment community; |
42
Table of Contents
| • | investor perception of us and our industry; |
| • | changes in market valuations or earnings of similar companies; |
| • | announcements by us or our competitors of significant contracts, acquisitions, dispositions or strategic partnerships; |
| • | war, terrorist acts, epidemic disease and pandemics, including COVID-19; |
| • | any future sales of our Class A common stock or other securities; |
| • | additions or departures of key personnel; and |
| • | misconduct or other improper actions of our employees. |
In particular, we cannot assure you that you will be able to resell your shares at or above the initial public offering price. Stock markets have experienced extreme volatility in recent years that has been unrelated to the operating performance of particular companies. These broad market fluctuations may adversely affect the trading price of our Class A common stock. In the past, following periods of volatility in the market price of a company’s securities, class action litigation has often been instituted against the affected company. Any litigation of this type brought against us could result in substantial costs and a diversion of our management’s attention and resources, which could materially and adversely affect our business, consolidated results of operations, liquidity or financial condition.
Purchasers in this offering will experience immediate and substantial dilution in the book value of their investment.
The initial public offering price of our Class A common stock is substantially higher than the net tangible book value per share of our Class A common stock outstanding prior to this offering. Therefore, if you purchase our Class A common stock in this offering, you will incur an immediate substantial dilution of $32.03 in net tangible book value per share from the price you paid (calculated based on the assumed initial public offering price of $24.50 per share, which represents the midpoint of the estimated offering price range set forth on the cover of this prospectus). For additional information about the dilution that you will experience immediately upon completion of this offering, see “Dilution.”
If securities or industry analysts do not publish research or publish misleading or unfavorable research about our business, our stock price and trading volume could decline.
The trading market for our Class A common stock will depend in part on the research and reports that securities or industry analysts publish about us or our business. We do not currently have, and may never obtain, research coverage for our Class A common stock. If there is no research coverage of our Class A common stock, the trading price for our common stock may be negatively impacted. In the event we obtain research coverage for our Class A common stock, if one or more of the analysts downgrades our stock or publishes misleading or unfavorable research about our business, our stock price would likely decline. If one or more of the analysts ceases coverage of our Class A common stock or fails to publish reports on us regularly, demand for our Class A common stock could decrease, which could cause our Class A common stock price or trading volume to decline.
Future offerings of debt or equity securities which would rank senior to our common stock may adversely affect the market price of our Class A common stock.
If, in the future, we decide to issue debt or equity securities that rank senior to our Class A common stock, it is likely that such securities will be governed by an indenture or other instrument containing covenants restricting our operating flexibility. Additionally, any convertible or exchangeable securities that we issue in the future may have rights, preferences and privileges more favorable than those of our Class A common stock and may result in dilution to owners of our Class A common stock. We and, indirectly, our stockholders, will bear the cost of
43
Table of Contents
issuing and servicing such securities. Because our decision to issue debt or equity securities in any future offering will depend on market conditions and other factors beyond our control, we cannot predict or estimate the amount, timing or nature of our future offerings. Thus, holders of our Class A common stock will bear the risk of our future offerings reducing the market price of our Class A common stock and diluting the value of their stock holdings in us.
Anti-takeover provisions in our amended and restated certificate of incorporation and amended and restated by-laws and Delaware law could discourage, delay or prevent a change of control of our company and may affect the trading price of our Class A common stock.
Our amended and restated certificate of incorporation and our amended and restated by-laws include a number of provisions that may discourage, delay or prevent a change in our management or control over us that stockholders may consider favorable. For example, prior to the consummation of this offering, our amended and restated certificate of incorporation and amended and restated by-laws will collectively:
| • | authorize two classes of common stock with disparate voting power, the Class A common stock that will be offered and sold pursuant to this prospectus and the Class B common stock that will provide the holders thereof with the ability to control the outcome of matters requiring stockholder approval, even if such holders own significantly less than a majority of the shares of our outstanding common stock; |
| • | permit different treatment of our Class A common stock and Class B common stock in a change of control transaction if approved by a majority of the voting power of our outstanding Class A common stock and a majority of the voting power of our outstanding Class B common stock, voting separately; |
| • | authorize the issuance of “blank check” preferred stock that could be issued by our board of directors to thwart a takeover attempt; |
| • | provide that vacancies on our Board, including vacancies resulting from an enlargement of our Board, may be filled only by a majority vote of directors then in office once Access ceases to beneficially own more than 50% of the total combined voting power of the outstanding shares of our common stock; |
| • | prohibit stockholders from calling special meetings of stockholders if Access ceases to beneficially own more than 50% of the total combined voting power of the outstanding shares of our common stock; |
| • | prohibit stockholder action by written consent, thereby requiring all actions to be taken at a meeting of the stockholders, if Access ceases to beneficially own more than 50% of the total combined voting power of the outstanding shares of our common stock; |
| • | establish advance notice requirements for nominations of candidates for election as directors or to bring other business before an annual meeting of our stockholders; |
| • | require the approval of holders of at least 66 2/3% of the total combined voting power of the outstanding shares of our common stock to amend our amended and restated by-laws and certain provisions of our amended and restated certificate of incorporation if Access ceases to beneficially own more than 50% of the total combined voting power of the outstanding shares of our common stock; and |
| • | subject us to Section 203 of the DGCL, which limits the ability of stockholders holding shares representing more than 15% of the voting power of our outstanding voting stock from engaging in certain business combinations with us, once Access no longer owns at least 5% of the total combined voting power of our outstanding common stock. |
These provisions may prevent our stockholders from receiving the benefit from any premium to the market price of our Class A common stock offered by a bidder in a takeover context. Even in the absence of a takeover attempt, the existence of these provisions may adversely affect the prevailing market price of our Class A common stock if the provisions are viewed as discouraging takeover attempts in the future.
44
Table of Contents
Our amended and restated certificate of incorporation and amended and restated by-laws may also make it difficult for stockholders to replace or remove our management. Furthermore, the existence of the foregoing provisions, as well as the significant amount of common stock that Access will own and voting power that Access will hold following this offering, could limit the price that investors might be willing to pay in the future for shares of our Class A common stock. These provisions may facilitate management and board entrenchment that may delay, deter, render more difficult or prevent a change in our control, which may not be in the best interests of our stockholders.
We will be a “controlled company” within the meaning of Nasdaq rules and, as a result, we will qualify for, and intend to rely on, exemptions from certain corporate governance requirements. You will not have the same protections afforded to stockholders of companies that are subject to such requirements.
After the consummation of this offering, Access will hold approximately 99.2% of the total combined voting power of our outstanding common stock (or approximately 99.1% if the underwriters exercise in full their option to purchase additional shares from the selling stockholders). Accordingly, we will qualify as a “controlled company” within the meaning of Nasdaq corporate governance standards. Under Nasdaq rules, a company of which more than 50% of the voting power is held by an individual, group or another company is a “controlled company” and may elect not to comply with certain Nasdaq corporate governance standards, including:
| • | the requirement that a majority of the members of our board of directors be independent directors; |
| • | the requirement that our nominating and corporate governance committee be composed entirely of independent directors with a written charter addressing the committee’s purpose and responsibilities; |
| • | the requirement that we have a compensation committee that is composed entirely of independent directors with a written charter addressing the committee’s purpose and responsibilities; and |
| • | the requirement for an annual performance evaluation of the nominating and corporate governance and compensation committees. |
Following this offering, we intend to use these exemptions. As a result, we will not have a majority of independent directors, our compensation and our nominating and corporate governance committees will not consist entirely of independent directors and such committees may not be subject to annual performance evaluations. Additionally, we are only required to have all independent audit committee members within one year from the date of listing. Consequently, you will not have the same protections afforded to stockholders of companies that are subject to all of Nasdaq corporate governance rules and requirements. Our status as a controlled company could make our Class A common stock less attractive to some investors or otherwise harm our stock price.
Our amended and restated certificate of incorporation will include provisions limiting the personal liability of our directors for breaches of fiduciary duty under the DGCL.
Our amended and restated certificate of incorporation will contain provisions permitted under the action asserting a claim arising under the DGCL relating to the liability of directors. These provisions will eliminate a director’s personal liability to the fullest extent permitted by the DGCL for monetary damages resulting from a breach of fiduciary duty, except in circumstances involving:
| • | any breach of the director’s duty of loyalty; |
| • | acts or omissions not in good faith or which involve intentional misconduct or a knowing violation of the law; |
| • | Section 174 of the DGCL (unlawful dividends); or |
| • | any transaction from which the director derives an improper personal benefit. |
45
Table of Contents
The principal effect of the limitation on liability provision is that a stockholder will be unable to prosecute an action for monetary damages against a director unless the stockholder can demonstrate a basis for liability for which indemnification is not available under the DGCL. These provisions, however, should not limit or eliminate our rights or any stockholder’s rights to seek non-monetary relief, such as an injunction or rescission, in the event of a breach of a director’s fiduciary duty. These provisions will not alter a director’s liability under federal securities laws. The inclusion of this provision in our amended and restated certificate of incorporation may discourage or deter stockholders or management from bringing a lawsuit against directors for a breach of their fiduciary duties, even though such an action, if successful, might otherwise have benefited us and our stockholders.
Our amended and restated certificate of incorporation will designate the Court of Chancery of the State of Delaware as the sole and exclusive forum for certain litigation that may be initiated by our stockholders, which could limit our stockholders’ ability to obtain a favorable judicial forum for disputes with us or our directors, officers or stockholders.
Our amended and restated certificate of incorporation will provide that, unless we consent in writing to the selection of an alternative forum, the Court of Chancery of the State of Delaware will, to the fullest extent permitted by law, be the sole and exclusive forum for (i) any derivative action or proceeding brought on our behalf, (ii) any action asserting a claim of breach of a fiduciary duty owed to us or our stockholders by any of our directors, officers, other employees, agents or stockholders, (iii) any action asserting a claim arising out of or under the DGCL, or as to which the DGCL confers jurisdiction on the Court of Chancery of the State of Delaware (including, without limitation, any action asserting a claim arising out of or pursuant to our amended and restated certificate of incorporation or our amended and restated by-laws) or (iv) any action asserting a claim that is governed by the internal affairs doctrine, in each case subject to such Court of Chancery of the State of Delaware having personal jurisdiction over the indispensable parties named as defendants. However, claims subject to exclusive jurisdiction in the federal courts, such as suits brought to enforce a duty or liability created by the Securities Act, the Exchange Act, or the rules and regulations thereunder, need not be brought in the Court of Chancery of the State of Delaware. By becoming a stockholder in our company, you will be deemed to have notice of and have consented to the provisions of our amended and restated certificate of incorporation related to choice of forum. The choice of forum provision in our amended and restated certificate of incorporation may limit our stockholders’ ability to obtain a favorable judicial forum for disputes with us or any of our directors, officers, other employees, agents or stockholders, which may discourage lawsuits with respect to such claims. Additionally, a court could determine that the exclusive forum provision is unenforceable, and our stockholders will not be deemed to have waived our compliance with the federal securities laws and the rules and regulations thereunder. If a court were to find these provisions of our amended and restated certificate of incorporation inapplicable to, or unenforceable in respect of, one or more of the specified types of actions or proceedings, we may incur additional costs associated with resolving such matters in other jurisdictions, which could adversely affect our business, financial condition, or results of operations.
46
Table of Contents
SPECIAL NOTE REGARDING FORWARD-LOOKING STATEMENTS AND INFORMATION
This prospectus contains forward-looking statements and cautionary statements within the meaning of the Private Securities Litigation Reform Act of 1995. Some of the forward-looking statements can be identified by the use of forward-looking terms such as “believes,” “expects,” “may,” “will,” “shall,” “should,” “would,” “could,” “seeks,” “aims,” “projects,” “is optimistic,” “intends,” “plans,” “estimates,” “anticipates” or other comparable terms or the negative thereof. Forward-looking statements include, without limitation, all matters that are not historical facts. They appear in a number of places throughout this prospectus and include, without limitation, our ability to compete in the highly competitive markets in which we operate, statements regarding our ability to develop talent and attract future talent, our ability to reduce future capital expenditures, our ability to monetize our music, including through new distribution channels and formats to capitalize on the growth areas of the music entertainment industry, our ability to effectively deploy our capital, the development of digital music and the effect of digital distribution channels on our business, including whether we will be able to achieve higher margins from digital sales, the success of strategic actions we are taking to accelerate our transformation as we redefine our role in the music entertainment industry, the effectiveness of our ongoing efforts to reduce overhead expenditures and manage our variable and fixed cost structure and our ability to generate expected cost savings from such efforts, our success in limiting piracy, the growth of the music entertainment industry and the effect of our and the industry’s efforts to combat piracy on the industry, our intention to pay dividends or repurchase or retire our outstanding debt or notes in open market purchases, privately or otherwise, the impact on us of potential strategic transactions, our ability to fund our future capital needs and the effect of litigation on us.
Forward-looking statements are subject to known and unknown risks and uncertainties, many of which may be beyond our control. We caution you that forward-looking statements are not guarantees of future performance or outcomes and that actual performance and outcomes, including, without limitation, our actual results of operations, financial condition and liquidity, and the development of the market in which we operate, may differ materially from those made in or suggested by the forward-looking statements contained in this prospectus. In addition, even if our results of operations, financial condition and cash flows, and the development of the market in which we operate, are consistent with the forward-looking statements contained in this prospectus, those results or developments may not be indicative of results or developments in subsequent periods. New factors emerge from time to time that may cause our business not to develop as we expect, and it is not possible for us to predict all of them. Factors that could cause actual results and outcomes to differ from those reflected in forward-looking statements include, without limitation:
| • | risks related to the effects of natural or man-made disasters, including pandemics such as COVID-19; |
| • | our ability to identify, sign and retain recording artists and songwriters and the existence or absence of superstar releases; |
| • | our inability to compete successfully in the highly competitive markets in which we operate; |
| • | the ability to further develop a successful business model applicable to a digital environment and to enter into artist services and expanded-rights deals with recording artists in order to broaden our revenue streams in growing segments of the music entertainment business; |
| • | the popular demand for particular recording artists and/or songwriters and music and the timely delivery to us of music by major recording artists and/or songwriters; |
| • | the diversity and quality of our recording artists, songwriters and releases; |
| • | slower growth in streaming adoption and revenue; |
| • | our dependence on a limited number of digital music services for the online distribution and marketing of our music and their ability to significantly influence the pricing structure for online music stores; |
| • | trends, developments or other events in some foreign countries in which we operate; |
| • | risks associated with our non-U.S. operations, including limited legal protections of our intellectual property rights and restrictions on the repatriation of capital; |
47
Table of Contents
| • | unfavorable currency exchange rate fluctuations; |
| • | the impact of heightened and intensive competition in the recorded music and music publishing industries and our inability to execute our business strategy; |
| • | significant fluctuations in our operations, cash flows and the trading price of our common stock from period to period; |
| • | our failure to attract and retain our executive officers and other key personnel; |
| • | a significant portion of our revenues are subject to rate regulation either by government entities or by local third-party collecting societies throughout the world and rates on other income streams may be set by governmental proceedings, which may limit our profitability; |
| • | risks associated with obtaining, maintaining, protecting and enforcing our intellectual property rights; |
| • | our involvement in intellectual property litigation; |
| • | threats to our business associated with digital piracy, including organized industrial piracy; |
| • | an impairment in the carrying value of goodwill or other intangible and long-lived assets; |
| • | our failure to have full control and ability to direct the operations we conduct through joint ventures; |
| • | the impact of, and risks inherent in, acquisitions or other business combinations; |
| • | risks inherent to our outsourcing certain finance and accounting functions; |
| • | the fact that we have engaged in substantial restructuring activities in the past, and may need to implement further restructurings in the future and our restructuring efforts may not be successful or generate expected cost savings; |
| • | our ability to maintain the security of information relating to our customers, employees and vendors and our music; |
| • | risks related to evolving laws and regulations concerning data privacy which might result in increased regulation and different industry standards; |
| • | legislation limiting the terms by which an individual can be bound under a “personal services” contract; |
| • | a potential loss of catalog if it is determined that recording artists have a right to recapture U.S. rights in their recordings under the U.S. Copyright Act; |
| • | potential employment and withholding liabilities if our recording artists and songwriters are characterized as employees; |
| • | any delays and difficulties in satisfying obligations incident to being a public company; |
| • | the impact of our substantial leverage on our ability to raise additional capital to fund our operations, on our ability to react to changes in the economy or our industry and on our ability to meet our obligations under our indebtedness; |
| • | the ability to generate sufficient cash to service all of our indebtedness, and the risk that we may be forced to take other actions to satisfy our obligations under our indebtedness, which may not be successful; |
| • | the fact that our debt agreements contain restrictions that limit our flexibility in operating our business; |
| • | the significant amount of cash required to service our indebtedness and the ability to generate cash or refinance indebtedness as it becomes due depends on many factors, some of which are beyond our control; |
48
Table of Contents
| • | our indebtedness levels, and the fact that we may be able to incur substantially more indebtedness, which may increase the risks created by our substantial indebtedness; |
| • | risks of downgrade, suspension or withdrawal of the rating assigned by a rating agency to us could impact our cost of capital; |
| • | the dual class structure of our common stock and Access’s existing ownership of our Class B common stock have the effect of concentrating over our management and affairs and over matters requiring stockholder approval with Access; |
| • | risks related to our Senior Management Free Cash Flow Plan following the consummation of this offering; and |
| • | risks related to other factors discussed under “Risk Factors” of this prospects. |
You should read this prospectus completely and with the understanding that actual future results may be materially different from expectations. All forward-looking statements made in this prospectus are qualified by these cautionary statements. These forward-looking statements are made only as of the date of this prospectus, and we do not undertake any obligation, other than as may be required by law, to update or revise any forward-looking or cautionary statements to reflect changes in assumptions, the occurrence of events, unanticipated or otherwise, and changes in future operating results over time or otherwise.
Other risks, uncertainties and factors, including those discussed under “Risk Factors,” could cause our actual results to differ materially from those projected in any forward-looking statements we make. Readers should read carefully the factors described in “Risk Factors” to better understand the risks and uncertainties inherent in our business and underlying any forward-looking statements.
49
Table of Contents
We will not receive any proceeds from the sale of Class A common stock by the selling stockholders in this offering (including any proceeds from the sale of shares of Class A common stock that such selling stockholders may sell pursuant to the underwriters’ option to purchase additional Class A common stock). The selling stockholders will receive all of the proceeds from the sale of shares of our Class A common stock by such selling stockholders.
50
Table of Contents
Dividend Policy
The Company intends to institute a regular quarterly dividend to holders of our Class A common stock and Class B common stock whereby we intend to pay quarterly cash dividends of $0.12 per share. We expect to pay the first dividend under this policy in September 2020. The declaration of each dividend will continue to be at the discretion of our board of directors and will depend on our financial condition, earnings, liquidity and capital requirements, level of indebtedness, contractual restrictions with respect to payment of dividends, restrictions imposed by Delaware law, general business conditions and any other factors that our board of directors deems relevant in making such a determination. Therefore, there can be no assurance that we will pay any dividends to holders of our common stock, or as to the amount of any such dividends.
WMG is a holding company for all of our operations and is a legal entity separate from its subsidiaries. All of WMG’s business operations are conducted through our subsidiaries. Dividends and other distributions from WMG’s subsidiaries are the principal sources of funds available to WMG to pay corporate operating expenses, to pay stockholder dividends, to repurchase stock and to meet its other obligations. The agreements to which our subsidiaries are party, including the Secured Notes Indenture, the Senior Notes Indenture, the Revolving Credit Agreement and the Senior Term Loan Credit Agreement, each contain certain provisions that restrict the payment of dividends, subject to certain exceptions. Generally, the Secured Notes Indenture, the Senior Notes Indenture, the Revolving Credit Facility and the Senior Term Loan Credit Agreement permit our subsidiaries to pay dividends and make certain other restricted payments (i) only if, at the time of the restricted payment and after giving pro form effect thereto, Acquisition Corp. would have been able to incur at least $1.00 of additional indebtedness and remain in compliance with the fixed charge coverage ratio of 2.00 to 1.00 and (ii) the aggregate amount of dividends distributed over a specified reference period does not exceed 50% of Acquisition Corp.’s net income calculated over the same reference period, subject to certain other limitations and basket exceptions. We believe that these agreements will permit our subsidiaries to distribute funds to us in an amount sufficient to permit us to pay our currently intended dividends. For more details, see “Management’s Discussion and Analysis of Financial Condition and Results of Operations—Financial Condition and Liquidity—Liquidity” and “Risk Factors—Risks Related to Our Leverage—As a holding company, WMG depends on the ability of its subsidiaries to transfer funds to it to meet its obligations.”
Delaware law requires that dividends be paid only out of “surplus,” which is defined as the fair market value of our net assets, minus our stated capital; or out of the current or the immediately preceding year’s earnings.
On March 25, 2020, the Company’s board of directors declared a cash dividend of $37.5 million which was paid to stockholders on April 17, 2020 and recorded as an accrual as of March 31, 2020. On December 16, 2019, the Company’s board of directors declared a cash dividend of $37.5 million which was paid to stockholders on January 17, 2020. On September 23, 2019, the Company’s board of directors declared a cash dividend of $206.25 million which was paid to stockholders on October 4, 2019. For fiscal year 2019, the Company paid an aggregate of $93.75 million in cash dividends to stockholders. For fiscal year 2018, the Company paid an aggregate of $925 million in cash dividends to stockholders, which reflected proceeds from the sale of Spotify shares acquired in the ordinary course of business. For fiscal year 2017, the Company paid an aggregate of $84 million in cash dividends to stockholders. For a discussion of our dividend history see “Management’s Discussion and Analysis of Financial Condition and Results of Operations—Financial Condition and Liquidity—Dividends.”
51
Table of Contents
The following table sets forth our cash and equivalents and capitalization on a consolidated basis and on a pro forma basis as of March 31, 2020 to reflect:
| • | the amendment and restatement of our certificate of incorporation in connection with this offering; and |
| • | the payment of a regular quarterly dividend of $37.5 million to our existing stockholders on April 17, 2020, as well as the payment of certain costs, fees and expenses in connection with this offering. |
The selling stockholders are selling all of the shares of Class A common stock in this offering. We will not receive any of the proceeds from the sale of shares of Class A common stock by the selling stockholders, including any proceeds from the sale of shares of Class A common stock that such selling stockholders may sell pursuant to the underwriters’ option to purchase additional Class A common stock.
You should read this table in conjunction with “Selected Historical Consolidated Financial Data,” “Management’s Discussion and Analysis of Financial Condition and Results of Operations” and our annual and interim financial statements included elsewhere in this prospectus.
| Actual | Pro Forma | |||||||
| As of March 31, 2020 |
As of March 31, 2020 |
|||||||
| (in millions) | ||||||||
| Cash and equivalents |
$ | 484 | $ | 381 | ||||
|
|
|
|
|
|||||
| Debt (a) |
||||||||
| Revolving Credit Facility (b) |
— | — | ||||||
| Senior Term Loan Facility due 2023 (c) |
1,315 | 1,315 | ||||||
| 5.000% Senior Secured Notes due 2023 (d) |
298 | 298 | ||||||
| 4.125% Senior Secured Notes due 2024 (e) |
339 | 339 | ||||||
| 4.875% Senior Secured Notes due 2024 (f) |
218 | 218 | ||||||
| 3.625% Senior Secured Notes due 2026 (g) |
492 | 492 | ||||||
| 5.500% Senior Notes due 2026 (h) |
321 | 321 | ||||||
|
|
|
|
|
|||||
| Total debt (i) |
$ | 2,983 | $ | 2,983 | ||||
|
|
|
|
|
|||||
| Equity |
||||||||
| Class A common stock, $0.001 par value per share; (i) Actual: 1,000,000,000 shares authorized, 0 shares issued and outstanding and (ii) Pro Forma: 1,000,000,000 shares authorized, 70,000,000 shares issued and outstanding |
— | — | ||||||
| Class B common stock, $0.001 par value per share; (i) Actual: 1,000,000,000 shares authorized, 510,000,000 shares issued and outstanding and (ii) Pro Forma: 1,000,000,000 shares authorized, 440,000,000 shares issued and outstanding |
1 | 1 | ||||||
| Additional paid-in capital |
1,127 | 1,127 | ||||||
| Accumulated deficit |
(1,166 | ) | (1,269 | ) | ||||
| Accumulated other comprehensive loss, net |
(268 | ) | (268 | ) | ||||
|
|
|
|
|
|||||
| Total Warner Music Group Corp. deficit |
$ | (306 | ) | $ | (409 | ) | ||
|
|
|
|
|
|||||
| Noncontrolling interest |
21 | 21 | ||||||
|
|
|
|
|
|||||
| Total deficit |
$ | (285 | ) | $ | (388 | ) | ||
|
|
|
|
|
|||||
| Total capitalization |
$ | 2,698 | $ | 2,595 | ||||
|
|
|
|
|
|||||
| (a) | Acquisition Corp. is the borrower or issuer of all of the Company’s long-term debt. |
52
Table of Contents
| (b) | Reflects $180 million of commitments under the Revolving Credit Facility, less letters of credit outstanding of approximately $13 million at March 31, 2020. There were no loans outstanding under the Revolving Credit Facility at May 15, 2020. On April 3, 2020, Acquisition Corp. entered into an amendment to the Revolving Credit Facility which, among other things, increased the commitments under the Revolving Credit Facility from an aggregate principal amount of $180 million to an aggregate principal amount of $300 million. |
| (c) | Principal amount of $1.326 billion at March 31, 2020 less unamortized discount of $3 million and unamortized deferred financing costs of $8 million at March 31, 2020. |
| (d) | Principal amount of $300 million less unamortized deferred financing costs of $2 million at March 31, 2020. |
| (e) | Face amount of €311 million at March 31, 2020. Above amounts represent the dollar equivalent of such note at March 31, 2020. Principal amount of $342 million less unamortized deferred financing costs of $3 million at March 31, 2020. |
| (f) | Principal amount of $220 million less unamortized deferred financing costs of $2 million at March 31, 2020. |
| (g) | Face amount of €445 million at March 31, 2020. Above amounts represent the dollar equivalent of such note at March 31, 2020. Principal amount of $491 million at March 31, 2020, an additional issuance premium of $7 million, less unamortized deferred financing costs of $6 million at March 31, 2020. |
| (h) | Principal amount of $325 million less unamortized deferred financing costs of $4 million at March 31, 2020. |
| (i) | Principal amount of debt of $3.004 billion, an additional issuance premium of $7 million, less unamortized discount of $3 million and unamortized deferred financing costs of $25 million at March 31, 2020. |
53
Table of Contents
If you invest in our Class A common stock in this offering, your ownership interest will be diluted to the extent of the difference between the initial public offering price per share of our Class A common stock and the net tangible book value per share of our currently outstanding common stock. Net tangible book value dilution per share to new investors means that the per share offering price of the Class A common stock exceeds the book value per share attributable to the shares of currently outstanding common stock held by existing stockholders.
Our net tangible book value (deficit) as of March 31, 2020 was $(7.53). Net tangible book value per share before the offering has been determined by dividing net tangible book value (total book value of tangible assets less total liabilities) by the number of shares of common stock outstanding as of March 31, 2020.
We will not receive any proceeds from the sale of our Class A common stock offered by the selling stockholders in this offering. Consequently, this offering will not result in any change to our net tangible book value per share, prior to giving effect to the payment of estimated fees and expenses in connection with this offering. Purchasing shares of common stock in this offering will result in net tangible book value dilution to new investors of $32.03 per share. The following table illustrates this per share dilution to new investors:
| Per Share | ||||
| Assumed initial public offering price per share |
$ | 24.50 | ||
| Net tangible book value (deficit) per share as of March 31, 2020 |
$ | (7.53) | ||
| Dilution in net tangible book value per share to new investors |
$ | 32.03 | ||
|
|
|
|||
The following table sets forth, as of March 31, 2020, the total number of shares of common stock owned by existing stockholders and to be owned by new investors, the total consideration paid and the average price per share paid by our existing stockholders (without giving effect to any dividends paid to the existing stockholders from time to time) and to be paid by new investors purchasing shares of Class A common stock in this offering. The calculation below is based on the midpoint of the price range set forth on the cover of this prospectus of $24.50 per share, before deducting the underwriting discounts and commissions and estimated offering expenses payable by us.
| Shares Purchased | Total Consideration | Average Price Per Share |
||||||||||||||||||
| Number | Percent | Amount | Percent | |||||||||||||||||
| Existing stockholders |
440,000,000 | 86.3 | % | $ | 974,000,000 | 36.2 | % | $ | 2.21 | |||||||||||
| New investors |
70,000,000 | 13.7 | 1,715,000,000 | 63.8 | 24.50 | |||||||||||||||
|
|
|
|
|
|
|
|
|
|
|
|||||||||||
| Total |
510,000,000 | 100.0 | % | $ | 2,689,000,000 | 100.0 | % | $ | 5.27 | |||||||||||
|
|
|
|
|
|
|
|||||||||||||||
After giving effect to the sale of shares of Class A common stock in this offering, new investors will hold 70,000,000 shares, or 13.7% of the total number of shares of common stock after this offering and existing stockholders will hold 86.3% of the total shares of common stock outstanding. If the underwriters exercise in full their option to purchase additional shares, the number of shares of Class A common stock held by new investors will increase to 80,500,000, or 15.8% of the total number of shares of common stock after this offering, and the percentage of shares held by existing stockholders will decrease to 84.2% of the total shares of common stock outstanding.
In addition, we may choose to raise capital due to market conditions or strategic considerations even if we believe we have sufficient funds for our current or future operating plans. To the extent that capital is raised through the sale of equity or convertible debt securities, the issuance of such securities could result in further dilution to our stockholders.
54
Table of Contents
The information discussed above is illustrative only and will adjust based on the actual public offering price and other terms of this offering determined at pricing. The number of shares of our Class A common stock outstanding immediately following this offering is based on no shares of our Class A common stock outstanding as of May 15, 2020. This number excludes 40,654,090 shares of our Class A common stock reserved for issuance under equity incentive plans of which 31,169,099 shares are potentially issuable over the 10-year period from the date of adoption of the Omnibus Incentive Plan to be adopted in connection with this offering.
55
Table of Contents
SELECTED HISTORICAL CONSOLIDATED FINANCIAL DATA
The following selected financial data have been derived from the Company’s audited and unaudited consolidated financial statements. The financial data for the fiscal years ended September 30, 2019, September 30, 2018 and September 30, 2017, and as of September 30, 2019 and September 30, 2018 have been derived from the Company’s audited financial statements included elsewhere in this prospectus. The financial data for the six months ended March 31, 2020 and 2019, and as of March 31, 2020 have been derived from the Company’s unaudited financial statements included elsewhere in this prospectus. The financial data for the fiscal years ended September 30, 2016 and September 30, 2015, and as of September 30, 2017, September 30, 2016 and September 30, 2015 have been derived from audited financial statements not included in this prospectus. The financial data as of March 31, 2019 have been derived from unaudited financial statements not included in this prospectus. This selected financial data should be read in conjunction with “Management’s Discussion and Analysis of Financial Condition and Results of Operations” and the annual and interim financial statements included elsewhere in this prospectus. Historical results are not indicative of future operating results and results from interim periods are not indicative of full year results. The following consolidated statement of operations and consolidated balance sheet data have been prepared in conformity with U.S. GAAP.
| Six Months Ended March 31, |
Fiscal Year Ended September 30, | |||||||||||||||||||||||||||
| (in millions) | 2020 | 2019 | 2019 | 2018 | 2017 | 2016 | 2015 | |||||||||||||||||||||
| Statement of Operations Data: |
||||||||||||||||||||||||||||
| Revenues |
$ | 2,327 | $ | 2,293 | $ | 4,475 | $ | 4,005 | $ | 3,576 | $ | 3,246 | $ | 2,966 | ||||||||||||||
| Interest expense, net |
(66 | ) | (72 | ) | (142 | ) | (138 | ) | (149 | ) | (173 | ) | (181 | ) | ||||||||||||||
| Net income (loss) |
48 | 153 | 258 | 312 | 149 | 30 | (88 | ) | ||||||||||||||||||||
| Less: Income (loss) attributable to noncontrolling interest |
(2 | ) | — | (2 | ) | (5 | ) | (6 | ) | (5 | ) | (3 | ) | |||||||||||||||
| Net income (loss) attributable to the Company. |
46 | 153 | 256 | 307 | 143 | 25 | (91 | ) | ||||||||||||||||||||
| Balance Sheet Data (at period end): |
||||||||||||||||||||||||||||
| Cash and equivalents |
$ | 484 | $ | 470 | $ | 619 | $ | 514 | $ | 647 | $ | 359 | $ | 246 | ||||||||||||||
| Total assets |
6,124 | 5,902 | 6,017 | 5,344 | 5,718 | 5,335 | 5,574 | |||||||||||||||||||||
| Total debt (including current portion of long-term debt) |
2,983 | 2,990 | 2,974 | 2,819 | 2,811 | 2,778 | 2,947 | |||||||||||||||||||||
| Total equity (deficit) |
(285 | ) | (120 | ) | (269 | ) | (320 | ) | 308 | 210 | 239 | |||||||||||||||||
| Cash Flow Data: |
||||||||||||||||||||||||||||
| Cash flows provided by (used in): |
||||||||||||||||||||||||||||
| Operating activities |
$ | 164 | $ | 99 | $ | 400 | $ | 425 | $ | 535 | $ | 342 | $ | 222 | ||||||||||||||
| Investing activities |
(51 | ) | (293 | ) | (376 | ) | 405 | (126 | ) | (8 | ) | (95 | ) | |||||||||||||||
| Financing activities |
(245 | ) | 151 | 88 | (955 | ) | (128 | ) | (216 | ) | (19 | ) | ||||||||||||||||
| Depreciation & amortization |
132 | 137 | 269 | 261 | 251 | 293 | 309 | |||||||||||||||||||||
| Capital expenditures |
(28 | ) | (59 | ) | (104 | ) | (74 | ) | (44 | ) | (42 | ) | (63 | ) | ||||||||||||||
| Six Months Ended March 31, |
Fiscal Year Ended September 30, | |||||||||||||||||||||||||||
| (in millions, except share and per share amounts) | 2020 | 2019 | 2019 | 2018 | 2017 | 2016 | 2015 | |||||||||||||||||||||
| Earnings/(Loss) Per Share: |
||||||||||||||||||||||||||||
| Earnings/(Loss) per share—common stock |
||||||||||||||||||||||||||||
| Basic and Diluted |
$0.09 | $0.30 | $0.51 | $0.61 | $0.29 | $0.05 | $(0.18 | ) | ||||||||||||||||||||
| Weighted average common shares outstanding |
501,991,944 | 501,991,944 | 501,991,944 | 502,630,835 | 503,392,885 | 503,392,885 | 503,392,885 | |||||||||||||||||||||
| Dividends Per Share: |
||||||||||||||||||||||||||||
| Dividends per share—common stock |
||||||||||||||||||||||||||||
| Basic and Diluted |
$0.15 | $0.12 | $0.59 | $1.84 | $0.17 | $ — | $ — | |||||||||||||||||||||
56
Table of Contents
MANAGEMENT’S DISCUSSION AND ANALYSIS OF FINANCIAL CONDITION
AND RESULTS OF OPERATIONS
The following discussion and analysis of our financial condition and results of operations should be read in conjunction with “Selected Historical Consolidated Financial Data,” “Unaudited Pro Forma Financial Information” and our annual and interim financial statements included elsewhere in this prospectus. In addition to historical data, this discussion contains forward-looking statements about our business, operations and financial performance based on current expectations that involve risks, uncertainties and assumptions. Actual results may differ materially from those discussed in the forward-looking statements as a result of various factors. Factors that could or do contribute to these differences include those factors discussed below and elsewhere in this prospectus, particularly under the captions “Risk Factors” and “Special Note Regarding Forward-Looking Statements and Information.”
BUSINESS OVERVIEW
We are one of the world’s leading music entertainment companies. Our renowned family of iconic record labels, including Atlantic Records, Warner Records, Elektra Records and Parlophone Records, is home to many of the most popular and influential recording artists. In addition, Warner Chappell Music, our global music publishing business, boasts an extraordinary catalog that includes timeless standards and contemporary hits, representing works by over 80,000 songwriters and composers, with a global collection of more than 1.4 million musical compositions. We classify our business interests into two fundamental operations: Recorded Music and Music Publishing. A brief description of each of those operations is presented below.
Components of Our Operating Results
Recorded Music Operations
Our Recorded Music business primarily consists of the discovery and development of recording artists and the related marketing, promotion, distribution, sale and licensing of music created by such recording artists. We play an integral role in virtually all aspects of the recorded music value chain from discovering and developing talent to producing, distributing and selling music to marketing and promoting recording artists and their music.
In the United States, our Recorded Music business is conducted principally through our major record labels—Atlantic Records and Warner Records. In October 2018, we launched Elektra Music Group in the United States as a standalone label group, which comprises the Elektra, Fueled by Ramen and Roadrunner labels. Our Recorded Music business also includes Rhino Entertainment, a division that specializes in marketing our recorded music catalog through compilations, reissuances of previously released music and video titles and releasing previously unreleased material from our vault. We also conduct our Recorded Music business through a collection of additional record labels including Asylum, Big Beat, Canvasback, East West, Erato, FFRR, Nonesuch, Parlophone, Reprise, Sire, Spinnin’ Records, Warner Classics and Warner Music Nashville.
Outside the United States, our Recorded Music business is conducted in more than 70 countries through various subsidiaries, affiliates and non-affiliated licensees. Internationally, we engage in the same activities as in the United States: discovering and signing artists and distributing, selling, marketing and promoting their music. In most cases, we also market, promote, distribute and sell the music of those recording artists for whom our domestic record labels have international rights. In certain smaller markets, we license the right to distribute and sell our music to non-affiliated third-party record labels.
Our Recorded Music business’ distribution operations include Warner-Elektra-Atlantic Corporation (“WEA Corp.”), which markets, distributes and sells music and video products to retailers and wholesale distributors; Alternative Distribution Alliance (“ADA”), which markets, distributes and sells the products of independent labels to retail and wholesale distributors; and various distribution centers and ventures operated internationally.
57
Table of Contents
In addition to our music being sold in physical retail outlets, our music is also sold in physical form to online physical retailers, such as Amazon.com, barnesandnoble.com and bestbuy.com, and distributed in digital form to an expanded universe of digital partners, including streaming services such as those of Amazon, Apple, Deezer, SoundCloud, Spotify, Tencent Music Entertainment Group and YouTube, radio services such as iHeart Radio and SiriusXM and download services.
We have integrated the marketing of digital content into all aspects of our business, including A&R and distribution. Our business development executives work closely with A&R departments to ensure that while music is being produced, digital assets are also created with all distribution channels in mind, including streaming services, social networking sites, online portals and music-centered destinations. We also work side-by-side with our online and mobile partners to test new concepts. We believe existing and new digital businesses will be a significant source of growth and will provide new opportunities to successfully monetize our assets and create new revenue streams. The proportion of digital revenues attributable to each distribution channel varies by region and proportions may change as the introduction of new technologies continues. As one of the world’s largest music entertainment companies, we believe we are well positioned to take advantage of growth in digital distribution and emerging technologies to maximize the value of our assets.
We have diversified our revenues beyond our traditional businesses by entering into expanded-rights deals with recording artists in order to partner with such artists in other aspects of their careers. Under these agreements, we provide services to and participate in recording artists’ activities outside the traditional recorded music business such as touring, merchandising and sponsorships. We have built and acquired artist services capabilities and platforms for marketing and distributing this broader set of music-related rights and participating more widely in the monetization of the artist brands we help create. We believe that entering into expanded-rights deals and enhancing our artist services capabilities in areas such as merchandising, VIP ticketing, fan clubs, concert promotion and management has permitted us to diversify revenue streams and capitalize on other revenue opportunities. This provides for improved long-term relationships with our recording artists and allows us to more effectively connect recording artists and fans.
Recorded Music revenues are derived from four main sources:
| • | Digital: the rightsholder receives revenues with respect to streaming and download services; |
| • | Physical: the rightsholder receives revenues with respect to sales of physical products such as vinyl, CDs and DVDs; |
| • | Artist services and expanded-rights: the rightsholder receives revenues with respect to our artist services businesses and our participation in expanded rights associated with our recording artists, including sponsorship, fan clubs, artist websites, merchandising, touring, concert promotion, ticketing and artist and brand management; and |
| • | Licensing: the rightsholder receives royalties or fees for the right to use sound recordings in combination with visual images such as in films or television programs, television commercials and video games; the rightsholder also receives royalties if sound recordings are performed publicly through broadcast of music on television, radio and cable, and in public spaces such as shops, workplaces, restaurants, bars and clubs. |
The principal costs associated with our Recorded Music business are as follows:
| • | A&R costs: the costs associated with (i) paying royalties to recording artists, producers, songwriters, other copyright holders and trade unions; (ii) signing and developing recording artists; and (iii) creating master recordings in the studio; |
| • | Product costs: the costs to manufacture, package and distribute products to wholesale and retail distribution outlets, the royalty costs associated with distributing products of independent labels to wholesale and retail distribution outlets, as well as the costs related to our artist services business; |
58
Table of Contents
| • | Selling and marketing expenses: the costs associated with the promotion and marketing of recording artists and music, including costs to produce music videos for promotional purposes and artist tour support; and |
| • | General and administrative expenses: the costs associated with general overhead and other administrative expenses. |
Music Publishing Operations
While Recorded Music is focused on marketing, promoting, distributing and licensing a particular recording of a musical composition, Music Publishing is an intellectual property business focused on generating revenue from uses of the musical composition itself. In return for promoting, placing, marketing and administering the creative output of a songwriter, or engaging in those activities for other rightsholders, our Music Publishing business garners a share of the revenues generated from use of the musical compositions.
The operations of our Music Publishing business are conducted principally through Warner Chappell Music, our global music publishing company headquartered in Los Angeles, with operations in over 70 countries through various subsidiaries, affiliates, and non-affiliated licensees and sub-publishers. We own or control rights to more than 1.4 million musical compositions, including numerous pop hits, American standards, folk songs and motion picture and theatrical compositions. Assembled over decades, our award-winning catalog includes over 80,000 songwriters and composers and a diverse range of genres including pop, rock, jazz, classical, country, R&B, hip-hop, rap, reggae, Latin, folk, blues, symphonic, soul, Broadway, techno, alternative and gospel. Warner Chappell Music also administers the music and soundtracks of several third-party television and film producers and studios. We have an extensive production music catalog collectively branded as Warner Chappell Production Music.
Music Publishing revenues are derived from five main sources:
| • | Performance: the rightsholder receives revenues if the musical composition is performed publicly through broadcast of music on television, radio and cable, live performance at a concert or other venue (e.g., arena concerts and nightclubs), and performance of music in staged theatrical productions; |
| • | Digital: the rightsholder receives revenues with respect to musical compositions embodied in recordings distributed in streaming services, download services and other digital music services; |
| • | Mechanical: the rightsholder receives revenues with respect to musical compositions embodied in recordings sold in any physical format or configuration such as vinyl, CDs and DVDs; |
| • | Synchronization: the rightsholder receives revenues for the right to use the musical composition in combination with visual images such as in films or television programs, television commercials and video games as well as from other uses such as in toys or novelty items and merchandise; and |
| • | Other: the rightsholder receives revenues for use in sheet music and other uses. |
The principal costs associated with our Music Publishing business are as follows:
| • | A&R costs: the costs associated with (i) paying royalties to songwriters, co-publishers and other copyright holders in connection with income generated from the uses of their works and (ii) signing and developing songwriters; and |
| • | Selling and marketing, general overhead and other administrative expenses: the costs associated with selling and marketing, general overhead and other administrative expenses. |
Factors Affecting Results of Operations and Comparability
COVID-19 Pandemic
In January 2020, a new strain of coronavirus, COVID-19, was identified in Wuhan, China. On March 11, 2020, the World Health Organization declared a global pandemic. The global pandemic and governmental
59
Table of Contents
responses thereto have disrupted physical and manufacturing supply chains and required the closures of physical retailers, resulting in declines in our physical revenue streams. Additionally, the requirement that people stay in their homes has impacted our business in other ways, such as, making it impossible to hold live concert tours, adversely impacting our concert promotion business and the sale of merchandise, delaying the release of new recordings and disrupting the production and release of motion pictures and television programs, which has negatively affected licensing revenue in our Recorded Music business and synchronization revenue in our Music Publishing business. Our results of operations, cash flows and financial condition at and for the six months ended March 31, 2020 were adversely affected by the global pandemic. In addition to the impact resulting from the business disruption, the Company recognized one-time charges of $13 million impacting OIBDA and a total of $18 million impacting net income for the six months ended March 31, 2020. On the other hand, we believe the disruption from the COVID-19 pandemic may accelerate growth of other revenue streams such as fitness and interactive gaming (including augmented reality and virtual reality).
Senior Management Free Cash Flow Plan
Our results of operations can be adversely affected by the Plan, which pays annual bonuses to certain executives based on our free cash flow and offers participants the opportunity to share in appreciation of the value of our common stock. The extent of the benefits awarded under the Plan is affected by our operating results and the valuation or trading price of our common stock and, as such, to the extent that either or both fluctuates, the value of the award may increase or decrease materially, which could affect our cash flows and results of operations. We incurred charges associated with the Plan of $167 million and $22 million for the six months ended March 31, 2020 and March 31, 2019, respectively, based on the estimated value of the Company at the end of such period.
Acquisition of EMP
On October 10, 2018, we acquired E.M.P. Merchandising Handelsgesellschaft mbH, a limited liability company under the laws of Germany, and its subsidiaries, all of the share capital of MIG Merchandising Investment GmbH, a limited liability company under the laws of Germany, and its subsidiaries, and certain shares of Large Popmarchandising BVBA, a limited liability company under the laws of Belgium (together, “EMP”). EMP is a specialty retailer of merchandise for many popular artists along with other forms of entertainment such as movies and television.
Adoption of New Revenue Recognition Standard
In May 2014, the FASB issued guidance codified in ASC 606, Revenue from Contracts with Customers (“ASC 606”), which replaces the guidance in former ASC 605, Revenue Recognition and ASC 928-605, Entertainment—Music. The adoption of ASC 606 resulted in a change in the timing of revenue recognition in our Music Publishing business as well as international broadcast rights within our Recorded Music business. Under the new revenue recognition rules, revenue is recorded based on best estimates available in the period of sale or usage whereas revenue was previously recorded when cash was received for both the licensing of music publishing rights and international recorded music broadcast fees. Additionally, for certain licenses where the consideration is fixed and the intellectual property being licensed is static, revenue is recognized at the point in time when control of the licensed content is transferred to the customer. See “Critical Accounting Policies.”
Acquisition of Spinnin’ Records
On September 7, 2017, we acquired Spinnin’ Records, one of the world’s most successful and important dance and electronic music companies. Based in the Netherlands, over the past two decades the label signed and nurtured a fantastic roster of pioneering recording artists and built prominent music publishing and artist management businesses.
60
Table of Contents
Sale of Non-Core Assets
During the fiscal year ended September 30, 2017, we completed the divestiture of certain assets related to the acquisition in July 2013 (the “PLG Acquisition”) of PLG. The cash received for these sales was $73 million. The net gain recognized for these sales was $6 million.
Other Business Models to Drive Incremental Revenue
Artist Services and Expanded-Rights Deals
As the recorded music industry has continued to transition to a business model through which the majority of revenues are generated from streaming, for many years we have signed recording artists to expanded-rights deals. Under our expanded-rights deals, we also participate in the recording artist’s revenue streams, in addition to recorded music sales, such as touring, merchandising and sponsorships. In addition to signing recording artists to expanded-rights deals, we have continued to make strategic investments to expand our Recorded Music business and open up new opportunities for our recording artists. Artist services and expanded-rights recorded music revenue, which includes revenue from expanded-rights deals as well as revenue from our artist services business, represented approximately 13% of our total revenues for the six months ended March 31, 2020 and approximately 14%, 10% and 11% of our total revenues for the fiscal years ended September 30, 2019, September 30, 2018 and September 30, 2017, respectively. Artist services and expanded-rights revenue will fluctuate from period to period depending upon recording artists’ touring schedules, among other things. Margins for the various artist services and expanded-rights revenue streams can vary significantly as well. The overall impact on margins will, therefore, depend on the composition of the various revenue streams in any particular period. For instance, participation in revenue from touring under our expanded-rights deals typically flows straight through to operating income with little associated cost. Revenue from some of our artist services businesses such as management and revenue from participation in touring and sponsorships under our expanded-rights deals are all high margin, while revenue under our expanded-rights deals and revenue from some of our artist services businesses such as merchandising tend to be lower margin than our traditional revenue streams in our Recorded Music business.
Management Agreement
The Company and Holdings are party to a management agreement with Access (the “Management Agreement”), pursuant to which Access provides the Company and its subsidiaries with financial, investment banking, management, advisory and other services. Pursuant to the Management Agreement, the Company pays to Access an annual fee equal to the greater of (i) a base amount, which is the sum of (x) $6 million and (y) 1.5% of the aggregate amount of Acquired EBITDA (as defined in the Management Agreement) and was approximately $9 million for the fiscal year ended September 30, 2019, and (ii) 1.5% of the EBITDA (as defined in the indenture governing the redeemed WMG Holdings Corp. 13.75% Senior Notes due 2019) of the Company for the applicable fiscal year, plus expenses. The fee is paid quarterly based on the base amount, with a true-up payment in the fourth quarter for any excess of the annual fee above the base amount. The Company and Holdings agreed to indemnify Access and certain of its affiliates against all liabilities arising out of performance of the Management Agreement.
Such costs incurred by the Company were approximately $11 million, $16 million and $9 million for the fiscal years ended September 30, 2019, September 30, 2018 and September 30, 2017, respectively. The fiscal year ended September 30, 2019 included the annual base fee of $9 million and an increase of $2 million calculated pursuant to the Management Agreement. The fiscal year ended September 30, 2018 included the annual base fee of $9 million and an increase of $7 million calculated pursuant to the Management Agreement.
The Management Agreement will terminate in accordance with its terms upon consummation of this offering, and the Company will pay all fees expenses due and payable thereunder following such termination in accordance with the terms of the Management Agreement, including a termination fee and a fee for transaction services in an estimated aggregate amount of approximately $60 million.
61
Table of Contents
Key Operating Measures
In addition to our results presented in accordance with U.S. GAAP, we report on both a consolidated and segment basis OIBDA and revenue on a constant-currency basis, each of which is a measure that is not determined in accordance with U.S. GAAP. Management believes that the use of these non-U.S. GAAP financial measures, together with relevant U.S. GAAP measures, provides a better understanding of our results of operations and the underlying profitability drivers and trends of our business. These measures should be considered supplementary to our results that are presented in accordance with U.S. GAAP and should not be viewed as a substitute for the U.S. GAAP measures. Other companies may use similarly titled non-U.S. GAAP financial measures that are calculated differently from the way we calculate such measures. Consequently, our non-U.S. GAAP financial measures may not be comparable to similar measures used by other companies.
OIBDA
We evaluate our operating performance based on several factors, including our primary financial measure of operating income (loss) before non-cash depreciation of tangible assets and non-cash amortization of intangible assets (“OIBDA”). We consider OIBDA to be an important indicator of the operational strengths and performance of our businesses. However, a limitation of the use of OIBDA as a performance measure is that it does not reflect the periodic costs of certain capitalized tangible and intangible assets used in generating revenues in our businesses and other non-operating income (loss). Accordingly, OIBDA should be considered in addition to, not as a substitute for, operating income (loss), net income (loss) attributable to Warner Music Group Corp. and other measures of financial performance reported in accordance with U.S. GAAP. In addition, our definition of OIBDA may differ from similarly titled measures used by other companies. A reconciliation of consolidated OIBDA to operating income (loss) and net income (loss) attributable to Warner Music Group Corp. is provided in “—Results of Operations.”
Constant Currency
As exchange rates are an important factor in understanding period to period comparisons, we believe the presentation of revenue on a constant-currency basis in addition to reported results helps improve the ability to understand our operating results and evaluate our performance in comparison to prior periods. Constant-currency information compares revenue between periods as if exchange rates had remained constant period over period. We use revenue on a constant-currency basis as one measure to evaluate our performance. We calculate constant currency by calculating prior-year revenue using current-year foreign currency exchange rates. We generally refer to such amounts calculated on a constant-currency basis as “excluding the impact of foreign currency exchange rates.” This revenue should be considered in addition to, not as a substitute for, revenue reported in accordance with U.S. GAAP. Revenue on a constant-currency basis, as we present it, may not be comparable to similarly titled measures used by other companies and are not a measure of performance presented in accordance with U.S. GAAP.
62
Table of Contents
RESULTS OF OPERATIONS
Six Months Ended March 31, 2020 Compared with Six Months Ended March 31, 2019
Consolidated Results
Revenues
Our revenues were composed of the following amounts (in millions):
| For the Six Months Ended March 31, |
2020 vs. 2019 | |||||||||||||||
| 2020 | 2019 | $ Change | % Change | |||||||||||||
| Revenue by Type |
||||||||||||||||
| Digital |
$ | 1,259 | $ | 1,160 | $ | 99 | 9 | % | ||||||||
| Physical |
278 | 361 | (83 | ) | -23 | % | ||||||||||
|
|
|
|
|
|
|
|||||||||||
| Total Digital and Physical |
1,537 | 1,521 | 16 | 1 | % | |||||||||||
| Artist services and expanded-rights |
303 | 300 | 3 | 1 | % | |||||||||||
| Licensing |
151 | 153 | (2 | ) | -1 | % | ||||||||||
|
|
|
|
|
|
|
|||||||||||
| Total Recorded Music |
1,991 | 1,974 | 17 | 1 | % | |||||||||||
| Performance |
87 | 99 | (12 | ) | -12 | % | ||||||||||
| Digital |
147 | 130 | 17 | 13 | % | |||||||||||
| Mechanical |
30 | 28 | 2 | 7 | % | |||||||||||
| Synchronization |
70 | 60 | 10 | 17 | % | |||||||||||
| Other |
5 | 6 | (1 | ) | -17 | % | ||||||||||
|
|
|
|
|
|
|
|||||||||||
| Total Music Publishing |
339 | 323 | 16 | 5 | % | |||||||||||
| Intersegment eliminations |
(3 | ) | (4 | ) | 1 | -25 | % | |||||||||
|
|
|
|
|
|
|
|||||||||||
| Total Revenues |
$ | 2,327 | $ | 2,293 | $ | 34 | 1 | % | ||||||||
|
|
|
|
|
|
|
|||||||||||
| Revenue by Geographical Location |
||||||||||||||||
| U.S. Recorded Music |
$ | 833 | $ | 841 | $ | (8 | ) | -1 | % | |||||||
| U.S. Music Publishing |
168 | 148 | 20 | 14 | % | |||||||||||
|
|
|
|
|
|
|
|||||||||||
| Total U.S. |
1,001 | 989 | 12 | 1 | % | |||||||||||
| International Recorded Music |
1,158 | 1,133 | 25 | 2 | % | |||||||||||
| International Music Publishing |
171 | 175 | (4 | ) | -2 | % | ||||||||||
|
|
|
|
|
|
|
|||||||||||
| Total International |
1,329 | 1,308 | 21 | 2 | % | |||||||||||
| Intersegment eliminations |
(3 | ) | (4 | ) | 1 | -25 | % | |||||||||
|
|
|
|
|
|
|
|||||||||||
| Total Revenues |
$ | 2,327 | $ | 2,293 | $ | 34 | 1 | % | ||||||||
|
|
|
|
|
|
|
|||||||||||
Total Revenues
Total revenues increased by $34 million, or 1%, to $2,327 million for the six months ended March 31, 2020 from $2,293 million for the six months ended March 31, 2019. The increase includes $28 million of unfavorable currency exchange fluctuations. Prior to intersegment eliminations, Recorded Music and Music Publishing revenues represented 85% and 15% of total revenues for the six months ended March 31, 2020, respectively, and 86% and 14% of total revenues for the six months ended March 31, 2019, respectively. Prior to intersegment eliminations, U.S. and international revenues represented 43% and 57% of total revenue for both the six months ended March 31, 2020 and March 31, 2019, respectively.
Total digital revenues after intersegment eliminations increased by $117 million, or 9%, to $1,405 million for the six months ended March 31, 2020 from $1,288 million for the six months ended March 31, 2019. Total
63
Table of Contents
digital revenues represented 60% and 56% of consolidated revenues for the six months ended March 31, 2020 and March 31, 2019, respectively. Prior to intersegment eliminations, total digital revenues for the six months ended March 31, 2020 were comprised of U.S. revenues of $731 million and international revenues of $675 million, or 52% and 48% of total digital revenues, respectively. Prior to intersegment eliminations, total digital revenues for the six months ended March 31, 2019 were comprised of U.S. revenues of $685 million and international revenues of $605 million, or 53% and 47% of total digital revenues, respectively.
Recorded Music revenues increased by $17 million, or 1%, to $1,991 million for the six months ended March 31, 2020 from $1,974 million for the six months ended March 31, 2019. The increase includes $22 million of unfavorable currency exchange fluctuations. U.S. Recorded Music revenues were $833 million and $841 million, or 42% and 43%, of consolidated Recorded Music revenues for the six months ended March 31, 2020 and March 31, 2019, respectively. International Recorded Music revenues were $1,158 million and $1,133 million, or 58% and 57%, of consolidated Recorded Music revenues for the six months ended March 31, 2020 and March 31, 2019, respectively.
The overall increase in Recorded Music revenue was driven by increases in digital revenue and artist services and expanded-rights revenue, partially offset by decreases in physical revenue and licensing revenue. Digital revenue increased by $99 million as a result of the continued growth in streaming services and strength of releases, which included new releases from Roddy Ricch and YoungBoy Never Broke Again as well as carryover success from Ed Sheeran, Tones and I, and Lizzo. Revenue from streaming services grew by $136 million to $1,175 million for the six months ended March 31, 2020 from $1,039 million for the six months ended March 31, 2019. Digital revenue growth was partially offset by digital download and other digital declines of $37 million to $84 million for the six months ended March 31, 2020 from $121 million for the six months ended March 31, 2019 due to the continued shift to streaming services. Artist services and expanded-rights revenue increased by $3 million primarily due to higher advertising revenues and timing of tours in France, partially offset by the impact of COVID-19, which resulted in tour postponements and decreased merchandising revenues. Physical revenue decreased by $83 million primarily due to the continued shift from physical revenue to digital revenue, timing of releases and prior-year success of Johnny Hallyday. Licensing revenue decreased by $2 million primarily related to unfavorable foreign exchange rates.
Music Publishing revenues increased by $16 million, or 5%, to $339 million for the six months ended March 31, 2020 from $323 million for the six months ended March 31, 2019. U.S. Music Publishing revenues were $168 million and $148 million, or 50% and 46%, of consolidated Music Publishing revenues for the six months ended March 31, 2020 and March 31, 2019, respectively. International Music Publishing revenues were $171 million and $175 million, or 50% and 54%, of Music Publishing revenues for the six months ended March 31, 2020 and March 31, 2019, respectively.
The overall increase in Music Publishing revenue was mainly driven by increases in digital revenue of $17 million and synchronization revenue of $10 million, partially offset by decreases in performance revenue of $12 million. The increase in digital revenue is primarily due to increases in streaming revenue driven by the continued growth in streaming services. The increase in synchronization revenue is attributable to higher TV and commercial income. The decline in performance revenue is driven by timing of distributions and the impact of COVID-19.
Revenue by Geographical Location
U.S. revenue increased by $12 million, or 1%, to $1,001 million for the six months ended March 31, 2020 from $989 million for the six months ended March 31, 2019. U.S. Recorded Music revenue decreased by $8 million, or 1%. The primary driver was the decrease in U.S. Recorded Music physical revenue, which decreased by $35 million driven by general market decline and timing of releases. Partially offsetting this decrease was an increase of U.S. Recorded Music digital revenue for $29 million driven by the continued growth in streaming services. Streaming revenue increased by $49 million, partially offset by $20 million of digital
64
Table of Contents
download and other digital declines. U.S. Music Publishing revenue increased by $20 million to $168 million for the six months ended March 31, 2020 from $148 million for the six months ended March 31, 2019. This was primarily driven by the increase in U.S. Music Publishing of $17 million in digital revenue due to the continued growth in streaming services and the increase in synchronization revenue of $5 million due to higher TV and commercial income, partially offset by decreases in performance revenue of $1 million.
International revenue increased by $21 million, or 2%, to $1,329 million for the six months ended March 31, 2020 from $1,308 million for the six months ended March 31, 2019. Excluding the unfavorable impact of foreign currency exchange rates, International revenue increased by $49 million or 4%. International Recorded Music revenue increased by $25 million primarily due to increases in digital revenue of $70 million and artist services and expanded-rights revenue of $12 million, partially offset by decreases in physical revenue of $48 million and licensing revenue of $9 million. The increase in International Recorded Music digital revenue was due to continued growth in streaming services internationally, partially offset by a decline in digital downloads. International Recorded Music artist services and expanded-rights revenue increased by $12 million due to higher merchandising revenues and timing of tours in France, partially offset by the impact of COVID-19, which resulted in tour postponements. International Recorded Music physical revenue decreased by $48 million due to the continued shift from physical revenue to digital revenue, timing of releases and the prior-year physical success of Johnny Hallyday. International Recorded Music licensing revenue decreased by $9 million primarily related to unfavorable foreign currency exchange rates and higher broadcast fees in the prior year. International Music Publishing revenue decreased by $4 million, or 2%, to $171 million for the six months ended March 31, 2020 from $175 million for the six months ended March 31, 2019. This was primarily driven by decreases in performance revenue of $11 million due to timing of distribution and the impact of COVID-19, partially offset by increases in synchronization revenue of $5 million due to higher TV and commercial income and mechanical revenue of $2 million.
Our cost of revenues was composed of the following amounts (in millions):
| For the Six Months Ended March 31, |
2020 vs. 2019 | |||||||||||||||
| 2020 | 2019 | $ Change | % Change | |||||||||||||
| Artist and repertoire costs |
$ | 771 | $ | 773 | $ | (2 | ) | — | % | |||||||
| Product costs |
429 | 412 | 17 | 4 | % | |||||||||||
|
|
|
|
|
|
|
|||||||||||
| Total cost of revenues |
$ | 1,200 | $ | 1,185 | $ | 15 | 1 | % | ||||||||
|
|
|
|
|
|
|
|||||||||||
Artist and repertoire costs decreased by $2 million, to $771 million for the six months ended March 31, 2020 from $773 million for the six months ended March 31, 2019. Artist and repertoire costs as a percentage of revenue decreased to 33% for the six months ended March 31, 2020 from 34% for the six months ended March 31, 2019. Decreases in artist and repertoire costs relate to lower artist-related costs, including a decrease in spending resulting from the impact of COVID-19.
Product costs increased by $17 million, to $429 million for the six months ended March 31, 2020 from $412 million for the six months ended March 31, 2019. Product costs as a percentage of revenue remained constant at 18% for the six months ended March 31, 2020 and March 31, 2019.
65
Table of Contents
Selling, general and administrative expenses
Our selling, general and administrative expenses were composed of the following amounts (in millions):
| For the Six Months Ended March 31, |
2020 vs. 2019 | |||||||||||||||
| 2020 | 2019 | $ Change | % Change | |||||||||||||
| General and administrative expense (1) |
$ | 523 | $ | 351 | $ | 172 | 49 | % | ||||||||
| Selling and marketing expense |
339 | 317 | 22 | 7 | % | |||||||||||
| Distribution expense |
55 | 62 | (7 | ) | -11 | % | ||||||||||
|
|
|
|
|
|
|
|||||||||||
| Total selling, general and administrative expense |
$ | 917 | $ | 730 | $ | 187 | 26 | % | ||||||||
|
|
|
|
|
|
|
|||||||||||
| (1) | Includes depreciation expense of $38 million and $28 million for the six months ended March 31, 2020 and March 31, 2019, respectively. |
Total selling, general and administrative expense increased by $187 million, or 26%, to $917 million for the six months ended March 31, 2020 from $730 million for the six months ended March 31, 2019. Expressed as a percentage of revenue, selling, general and administrative expense increased to 39% for the six months ended March 31, 2020 from 32% for the six months ended March 31, 2019. This is primarily due to the increased expense associated with our Senior Management Free Cash Flow Plan of $145 million and a one-time charge within depreciation expense of $10 million. Excluding the expense associated with our Senior Management Free Cash Flow Plan and one-time charge within depreciation expense, selling, general and administrative expense as a percentage of revenue increased to 32% for the six months ended March 31, 2020 from 31% for the six months ended March 31, 2019.
General and administrative expense increased by $172 million, or 49%, to $523 million for the six months ended March 31, 2020 from $351 million for the six months ended March 31, 2019. The increase in general and administrative expense was mainly due to higher expense associated with our Senior Management Free Cash Flow Plan of $145 million, a one-time charge within depreciation expense of $10 million, increases in legal and consulting costs related to the proposed IPO, increases in bad debt provisions of $3 million associated with COVID-19 related physical distribution business disruptions and costs associated with transformation initiatives of $17 million. Expressed as a percentage of revenue, general and administrative expense increased to 23% for the six months ended March 31, 2020 from 15% for the six months ended March 31, 2019. Excluding the expense associated with our Senior Management Free Cash Flow Plan and the one-time charge within depreciation expense, general and administrative expense as a percentage of revenue increased to 15% for the six months ended March 31, 2020 from 14% for the six months ended March 31, 2019 due to the factors described above.
Selling and marketing expense increased by $22 million, or 7%, to $339 million for the six months ended March 31, 2020 from $317 million for the six months ended March 31, 2019. The increase in selling and marketing expense was primarily due to increased variable marketing expense on higher revenue and increased spending on new releases and developing artists. Expressed as a percentage of revenue, selling and marketing expense increased to 15% for the six months ended March 31, 2020 from 14% for the six months ended March 31, 2019 due to the factors described above.
Distribution expense was $55 million for the six months ended March 31, 2020 and $62 million for the six months ended March 31, 2019. Expressed as a percentage of revenue, distribution expense decreased to 2% for the six months ended March 31, 2020 from 3% for the six months ended March 31, 2019. The decrease in distribution costs is due to revenue mix.
66
Table of Contents
Reconciliation of Net Income Attributable to Warner Music Group Corp. and Operating Income to Consolidated OIBDA
As previously described, we use OIBDA as our primary measure of financial performance. The following table reconciles operating income to OIBDA, and further provides the components from net income attributable to Warner Music Group Corp. to operating income for purposes of the discussion that follows (in millions):
| For the Six Months Ended March 31, |
2020 vs. 2019 | |||||||||||||||
| 2020 | 2019 | $ Change | % Change | |||||||||||||
| Net income attributable to Warner Music Group Corp. |
$ | 46 | $ | 153 | $ | (107 | ) | -70 | % | |||||||
| Income attributable to noncontrolling interest |
2 | — | 2 | — | % | |||||||||||
|
|
|
|
|
|
|
|||||||||||
| Net income |
48 | 153 | (105 | ) | -69 | % | ||||||||||
| Income tax (benefit) expense |
(7 | ) | 98 | (105 | ) | — | % | |||||||||
|
|
|
|
|
|
|
|||||||||||
| Income before income taxes |
41 | 251 | (210 | ) | -84 | % | ||||||||||
| Other expense (income) |
9 | (57 | ) | 66 | — | % | ||||||||||
| Interest expense, net |
66 | 72 | (6 | ) | -8 | % | ||||||||||
| Loss on extinguishment of debt |
— | 3 | (3 | ) | -100 | % | ||||||||||
|
|
|
|
|
|
|
|||||||||||
| Operating income |
116 | 269 | (153 | ) | -57 | % | ||||||||||
| Amortization expense |
94 | 109 | (15 | ) | -14 | % | ||||||||||
| Depreciation expense |
38 | 28 | 10 | 36 | % | |||||||||||
|
|
|
|
|
|
|
|||||||||||
| OIBDA |
$ | 248 | $ | 406 | $ | (158 | ) | -39 | % | |||||||
|
|
|
|
|
|
|
|||||||||||
OIBDA
OIBDA decreased by $158 million, or 39%, to $248 million for the six months ended March 31, 2020 as compared to $406 million for the six months ended March 31, 2019 as a result of higher selling, general and administrative expenses. Expressed as a percentage of total revenue, OIBDA margin decreased to 11% for the six months ended March 31, 2020 from 18% for the six months ended March 31, 2019. Excluding the expense associated with our Senior Management Free Cash Flow Plan, as a percentage of total revenue, OIBDA margin decreased to 18% for the six months ended March 31, 2020 from 19% for the six months ended March 31, 2019 due to the factors previously discussed.
Amortization expense
Our amortization expense decreased by $15 million, or 14%, to $94 million for the six months ended March 31, 2020 from $109 million for the six months ended March 31, 2019. The decrease is primarily due to certain intangible assets becoming fully amortized.
Operating income
Our operating income decreased by $153 million to $116 million for the six months ended March 31, 2020 from $269 million for the six months ended March 31, 2019. The decrease in operating income was due to the factors that led to the decrease in OIBDA.
Loss on extinguishment of debt
There was no loss on extinguishment of debt for the six months ended March 31, 2020. We recorded a loss on extinguishment of debt in the amount of $3 million for the six months ended March 31, 2019, which represents the unamortized deferred financing costs related to the partial redemption of the 4.125% Senior Secured Notes and 5.625% Senior Secured Notes, and the open market purchases of the 4.875% Senior Secured Notes.
67
Table of Contents
Interest expense, net
Our interest expense, net, decreased to $66 million for the six months ended March 31, 2020 from $72 million for the six months ended March 31, 2019 due to a decline in LIBOR rates as well as lower interest rates resulting from the redemption of the 5.625% Senior Secured Notes and issuance of the 3.625% Senior Secured Notes.
Other expense (income), net
Other expense (income), net, for the six months ended March 31, 2020 primarily includes unrealized losses of $10 million on the mark-to-market of an equity method investment, the loss on our Euro-denominated debt of $6 million and $5 million relating to a loss on investments, partially offset by currency exchange gains on our intercompany loans of $12 million. This compares to an unrealized gain of $30 million on the mark-to-market of an equity method investment and $6 million unrealized gains on hedging activity and foreign currency gains on our Euro-denominated debt of $20 million for the six months ended March 31, 2019.
Income tax (benefit) expense
Our income tax expense decreased by $105 million to a tax benefit of $7 million for the six months ended March 31, 2020 from $98 million of a tax expense for the six months ended March 31, 2019. The change of $105 million in income tax expense primarily relates to lower pre-tax income and the release of a valuation allowance on foreign tax credits of $33 million during the six months ended March 31, 2020.
Net Income
Net income decreased by $105 million to $48 million for the six months ended March 31, 2020 from net income of $153 million for the six months ended March 31, 2019 as a result of the factors described above.
Noncontrolling interest
There was $2 million of income attributable to noncontrolling interest for the six months ended March 31, 2020 and no income attributable to noncontrolling interest for the six months ended March 31, 2019.
Business Segment Results
Revenue, operating income (loss) and OIBDA by business segment were as follows (in millions):
| For the Six Months Ended March 31, |
2020 vs. 2019 | |||||||||||||||
| 2020 | 2019 | $ Change | % Change | |||||||||||||
| Recorded Music |
||||||||||||||||
| Revenues |
$ | 1,991 | $ | 1,974 | $ | 17 | 1 | % | ||||||||
| Operating income |
227 | 297 | (70 | ) | -24 | % | ||||||||||
| OIBDA |
317 | 391 | (74 | ) | -19 | % | ||||||||||
| Music Publishing |
||||||||||||||||
| Revenues |
339 | 323 | 16 | 5 | % | |||||||||||
| Operating income |
44 | 49 | (5 | ) | -10 | % | ||||||||||
| OIBDA |
81 | 86 | (5 | ) | -6 | % | ||||||||||
| Corporate expenses and eliminations |
||||||||||||||||
| Revenue eliminations |
(3 | ) | (4 | ) | 1 | -25 | % | |||||||||
| Operating loss |
(155 | ) | (77 | ) | (78 | ) | — | % | ||||||||
| OIBDA loss |
(150 | ) | (71 | ) | (79 | ) | — | % | ||||||||
| Total |
||||||||||||||||
| Revenues |
2,327 | 2,293 | 34 | 1 | % | |||||||||||
| Operating income |
116 | 269 | (153 | ) | -57 | % | ||||||||||
| OIBDA |
248 | 406 | (158 | ) | -39 | % | ||||||||||
68
Table of Contents
Recorded Music
Revenues
Recorded Music revenue increased by $17 million, or 1%, to $1,991 million for the six months ended March 31, 2020 from $1,974 million for the six months ended March 31, 2019. U.S. Recorded Music revenues were $833 million and $841 million, or 42% and 43%, of consolidated Recorded Music revenues for the six months ended March 31, 2020 and March 31, 2019, respectively. International Recorded Music revenues were $1,158 million and $1,133 million, or 58% and 57%, of consolidated Recorded Music revenues for the six months ended March 31, 2020 and March 31, 2019, respectively.
The overall increase in Recorded Music revenue was mainly driven by streaming revenue growth, partially offset by decreases in physical revenue as described in the “Total Revenues” and “Revenue by Geographical Location” sections above.
Cost of revenues
Recorded Music cost of revenues was composed of the following amounts (in millions)
| For the Six Months Ended March 31, |
2020 vs. 2019 | |||||||||||||||
| 2020 | 2019 | $ Change | % Change | |||||||||||||
| Artist and repertoire costs |
$ | 558 | $ | 575 | $ | (17 | ) | -3 | % | |||||||
| Product costs |
429 | 412 | 17 | 4 | % | |||||||||||
|
|
|
|
|
|
|
|||||||||||
| Total cost of revenues |
$ | 987 | $ | 987 | $ | — | — | % | ||||||||
|
|
|
|
|
|
|
|||||||||||
Recorded Music cost of revenues remained flat at $987 million for both the six months ended March 31, 2020 and March 31, 2019. Expressed as a percentage of Recorded Music revenue, Recorded Music artist and repertoire costs decreased to 28% for the six months ended March 31, 2020 from 29% for the six months ended March 31, 2019. The decrease is primarily attributable to lower artist-related costs, including a decrease in spending resulting from the impact of COVID-19. Expressed as a percentage of Recorded Music revenue, Recorded Music product costs increased to 22% for the six months ended March 31, 2020 from 21% for the six months ended March 31, 2019. The increase in product costs relates to revenue mix and impact of costs associated with tours in France.
Selling, general and administrative expense
Recorded Music selling, general and administrative expenses were composed of the following amounts (in millions):
| For the Six Months Ended March 31, |
2020 vs. 2019 | |||||||||||||||
| 2020 | 2019 | $ Change | % Change | |||||||||||||
| General and administrative expense (1) |
$ | 332 | $ | 243 | $ | 89 | 37 | % | ||||||||
| Selling and marketing expense |
331 | 310 | 21 | 7 | % | |||||||||||
| Distribution expense |
55 | 62 | (7 | ) | -11 | % | ||||||||||
|
|
|
|
|
|
|
|||||||||||
| Total selling, general and administrative expense |
$ | 718 | $ | 615 | $ | 103 | 17 | % | ||||||||
|
|
|
|
|
|
|
|||||||||||
| (1) | Includes depreciation expense of $31 million and $19 million for the six months ended March 31, 2020 and March 31, 2019, respectively. |
Recorded Music selling, general and administrative expense increased by $103 million, or 17%, to $718 million for the six months ended March 31, 2020 from $615 million for the six months ended March 31,
69
Table of Contents
2019. The increase in general and administrative expense was primarily due to higher expense associated with our Senior Management Free Cash Flow Plan of $88 million and a one-time charge within depreciation expense of $10 million, increases in bad debt provisions of $3 million associated with COVID-19 related physical distribution business disruptions partially offset by employee-related expenses. The increase in selling and marketing expense was primarily due to increased variable marketing expense on higher revenue in the quarter and increased spending on new releases and developing artists. The decrease in distribution expense was primarily due to revenue mix. Expressed as a percentage of Recorded Music revenue, Recorded Music selling, general and administrative expense increased to 36% for the six months ended March 31, 2020 from 31% for the six months ended March 31, 2019. Excluding the expense associated with our Senior Management Free Cash Flow Plan and the one-time charge within depreciation expense, selling, general and administrative expense as a percentage of Recorded Music revenue remained flat at 30% for both the six months ended March 31, 2020 and March 31, 2019.
Operating income and OIBDA
Recorded Music OIBDA included the following amounts (in millions):
| For the Six Months Ended March 31, |
2020 vs. 2019 | |||||||||||||||
| 2020 | 2019 | $ Change | % Change | |||||||||||||
| Operating income |
$ | 227 | $ | 297 | $ | (70 | ) | -24 | % | |||||||
| Depreciation and amortization |
90 | 94 | (4 | ) | -4 | % | ||||||||||
|
|
|
|
|
|
|
|||||||||||
| OIBDA |
$ | 317 | $ | 391 | $ | (74 | ) | -19 | % | |||||||
|
|
|
|
|
|
|
|||||||||||
Recorded Music OIBDA decreased by $74 million, or 19%, to $317 million for the six months ended March 31, 2020 from $391 million for the six months ended March 31, 2019 as a result of higher general and administrative expenses. Expressed as a percentage of Recorded Music revenue, Recorded Music OIBDA margin decreased to 16% for the six months ended March 31, 2020 from 20% for the six months ended March 31, 2019. Excluding the expense associated with our Senior Management Free Cash Flow Plan, OIBDA, as a percentage of Recorded Music revenue, remained constant at 21% for both the six months ended March 31, 2020 and March 31, 2019.
Recorded Music operating income decreased by $70 million to $227 million for the six months ended March 31, 2020 from $297 million for the six months ended March 31, 2019 due to factors within the Recorded Music OIBDA decrease noted above. Excluding the expense associated with our Senior Management Free Cash Flow Plan and the one-time charge within depreciation expense, Recorded Music operating income increased $28 million due to higher revenues and lower amortization expense within the quarter.
Music Publishing
Revenues
Music Publishing revenues increased by $16 million, or 5%, to $339 million for the six months ended March 31, 2020 from $323 million for the six months ended March 31, 2019. U.S. Music Publishing revenues were $168 million and $148 million, or 50% and 46%, of consolidated Music Publishing revenues for the six months ended March 31, 2020 and March 31, 2019, respectively. International Music Publishing revenues were $171 million and $175 million, or 50% and 54%, of consolidated Music Publishing revenues for the six months ended March 31, 2020 and March 31, 2019, respectively.
The overall increase in Music Publishing revenue was mainly driven by streaming revenue growth and higher synchronization, partially offset by lower performance revenues as described in the “Total Revenues” and “Revenue by Geographical Location” sections above.
70
Table of Contents
Cost of revenues
Music Publishing cost of revenues were composed of the following amounts (in millions):
| For the Six Months Ended March 31, |
2020 vs. 2019 | |||||||||||||||
| 2020 | 2019 | $ Change | % Change | |||||||||||||
| Artist and repertoire costs |
$ | 216 | $ | 202 | $ | 14 | 7 | % | ||||||||
|
|
|
|
|
|
|
|||||||||||
| Total cost of revenues |
$ | 216 | $ | 202 | $ | 14 | 7 | % | ||||||||
|
|
|
|
|
|
|
|||||||||||
Music Publishing cost of revenues increased by $14 million, or 7%, to $216 million for the six months ended March 31, 2020 from $202 million for the six months ended March 31, 2019. Expressed as a percentage of Music Publishing revenue, Music Publishing cost of revenues increased to 64% for the six months ended March 31, 2020 from 63% for the six months ended March 31, 2019, primarily due to revenue mix and timing of artist and repertoire investments.
Selling, general and administrative expense
Music Publishing selling, general and administrative expenses were comprised of the following amounts (in millions):
| For the Six Months Ended March 31, |
2020 vs. 2019 | |||||||||||||||
| 2020 | 2019 | $ Change | % Change | |||||||||||||
| General and administrative expense (1) |
$ | 43 | $ | 37 | $ | 6 | 16 | % | ||||||||
| Selling and marketing expense |
1 | 1 | — | — | % | |||||||||||
|
|
|
|
|
|
|
|||||||||||
| Total selling, general and administrative expense |
$ | 44 | $ | 38 | $ | 6 | 16 | % | ||||||||
|
|
|
|
|
|
|
|||||||||||
| (1) | Includes depreciation expense of $2 million and $3 million for the six months ended March 31, 2020 and March 31, 2019, respectively. |
Music Publishing selling, general and administrative expense increased to $44 million for the six months ended March 31, 2020 from $38 million for the six months ended March 31, 2019 due to higher employee-related and restructuring costs. Expressed as a percentage of Music Publishing revenue, Music Publishing selling, general and administrative expense increased to 13% for the six months ended March 31, 2020 from 12% for the six months ended March 31, 2019 due to factors described above.
Operating income and OIBDA
Music Publishing OIBDA included the following amounts (in millions):
| For the Six Months Ended March 31, |
2020 vs. 2019 | |||||||||||||||
| 2020 | 2019 | $ Change | % Change | |||||||||||||
| Operating income |
$ | 44 | $ | 49 | $ | (5 | ) | -10 | % | |||||||
| Depreciation and amortization |
37 | 37 | — | — | % | |||||||||||
|
|
|
|
|
|
|
|||||||||||
| OIBDA |
$ | 81 | $ | 86 | $ | (5 | ) | -6 | % | |||||||
|
|
|
|
|
|
|
|||||||||||
Music Publishing OIBDA decreased by $5 million, or 6%, to $81 million for the six months ended March 31, 2020 from $86 million for the six months ended March 31, 2019. Expressed as a percentage of Music Publishing revenue, Music Publishing OIBDA margin decreased to 24% for the six months ended March 31, 2020 from 27% for the six months ended March 31, 2019. The decrease was primarily due to higher artist and repertoire and general and administrative expenses.
71
Table of Contents
Music Publishing operating income decreased by $5 million to $44 million for the six months ended March 31, 2020 from $49 million operating income for the six months ended March 31, 2019 largely due to the factors that led to the decrease in Music Publishing OIBDA noted above.
Corporate Expenses and Eliminations
Our operating loss from corporate expenses and eliminations increased by $78 million to $155 million for the six months ended March 31, 2020 from $77 million for the six months ended March 31, 2019 which primarily relates to an increase of $57 million in variable compensation expense associated with our Senior Management Free Cash Flow Plan as well as higher corporate-related costs and costs related to transformation initiatives of $17 million.
Our OIBDA loss from corporate expenses and eliminations increased by $79 million to $150 million for the six months ended March 31, 2020 from $71 million for the six months ended March 31, 2019 due to the operating loss factors noted above.
Fiscal Year Ended September 30, 2019 Compared with Fiscal Year Ended September 30, 2018 and Fiscal Year Ended September 30, 2017
Consolidated Results
Revenues
The Company’s revenues were composed of the following amounts (in millions):
| For the Fiscal Year Ended September 30, |
2019 vs. 2018 | 2018 vs. 2017 | ||||||||||||||||||||||||||
| 2019 | 2018 | 2017 | $ Change | % Change | $ Change | % Change | ||||||||||||||||||||||
| Revenue by Type |
||||||||||||||||||||||||||||
| Digital |
$ | 2,343 | $ | 2,019 | $ | 1,692 | $ | 324 | 16 | % | $ | 327 | 19 | % | ||||||||||||||
| Physical |
559 | 630 | 667 | (71 | ) | -11 | % | (37 | ) | -6 | % | |||||||||||||||||
|
|
|
|
|
|
|
|
|
|
|
|||||||||||||||||||
| Total Physical and Digital |
2,902 | 2,649 | 2,359 | 253 | 10 | % | 290 | 12 | % | |||||||||||||||||||
| Artist services and expanded-rights |
629 | 389 | 385 | 240 | 62 | % | 4 | 1 | % | |||||||||||||||||||
| Licensing |
309 | 322 | 276 | (13 | ) | -4 | % | 46 | 17 | % | ||||||||||||||||||
|
|
|
|
|
|
|
|
|
|
|
|||||||||||||||||||
| Total Recorded Music |
3,840 | 3,360 | 3,020 | 480 | 14 | % | 340 | 11 | % | |||||||||||||||||||
| Performance |
183 | 212 | 197 | (29 | ) | -14 | % | 15 | 8 | % | ||||||||||||||||||
| Digital |
271 | 237 | 187 | 34 | 14 | % | 50 | 27 | % | |||||||||||||||||||
| Mechanical |
55 | 72 | 65 | (17 | ) | -24 | % | 7 | 11 | % | ||||||||||||||||||
| Synchronization |
120 | 119 | 112 | 1 | 1 | % | 7 | 6 | % | |||||||||||||||||||
| Other |
14 | 13 | 11 | 1 | 8 | % | 2 | 18 | % | |||||||||||||||||||
|
|
|
|
|
|
|
|
|
|
|
|||||||||||||||||||
| Total Music Publishing |
643 | 653 | 572 | (10 | ) | -2 | % | 81 | 14 | % | ||||||||||||||||||
| Intersegment eliminations |
(8 | ) | (8 | ) | (16 | ) | — | — | % | 8 | -50 | % | ||||||||||||||||
|
|
|
|
|
|
|
|
|
|
|
|||||||||||||||||||
| Total Revenues |
$ | 4,475 | $ | 4,005 | $ | 3,576 | $ | 470 | 12 | % | $ | 429 | 12 | % | ||||||||||||||
|
|
|
|
|
|
|
|
|
|
|
|||||||||||||||||||
| Revenue by Geographical Location |
||||||||||||||||||||||||||||
| U.S. Recorded Music |
$ | 1,656 | $ | 1,460 | $ | 1,329 | $ | 196 | 13 | % | $ | 131 | 10 | % | ||||||||||||||
| U.S. Music Publishing |
300 | 294 | 258 | 6 | 2 | % | 36 | 14 | % | |||||||||||||||||||
|
|
|
|
|
|
|
|
|
|
|
|||||||||||||||||||
| Total U.S. |
1,956 | 1,754 | 1,587 | 202 | 12 | % | 167 | 11 | % | |||||||||||||||||||
| International Recorded Music |
2,184 | 1,900 | 1,691 | 284 | 15 | % | 209 | 12 | % | |||||||||||||||||||
| International Music Publishing |
343 | 359 | 314 | (16 | ) | -4 | % | 45 | 14 | % | ||||||||||||||||||
|
|
|
|
|
|
|
|
|
|
|
|||||||||||||||||||
| Total International |
2,527 | 2,259 | 2,005 | 268 | 12 | % | 254 | 13 | % | |||||||||||||||||||
| Intersegment eliminations |
(8 | ) | (8 | ) | (16 | ) | — | — | % | 8 | -50 | % | ||||||||||||||||
|
|
|
|
|
|
|
|
|
|
|
|||||||||||||||||||
| Total Revenues |
$ | 4,475 | $ | 4,005 | $ | 3,576 | $ | 470 | 12 | % | $ | 429 | 12 | % | ||||||||||||||
|
|
|
|
|
|
|
|
|
|
|
|||||||||||||||||||
72
Table of Contents
Total Revenues
2019 vs. 2018
Total revenues increased by $470 million, or 12%, to $4,475 million for the fiscal year ended September 30, 2019 from $4,005 million for the fiscal year ended September 30, 2018, which includes an increase of $240 million, or 6%, due to the acquisition of EMP and $28 million, or 1%, due to the adoption of the new revenue recognition standard, ASC 606, in October 2018. Prior to intersegment eliminations, Recorded Music revenues represented 86% and 84% of total revenues for the fiscal years ended September 30, 2019 and September 30, 2018, respectively. Prior to intersegment eliminations, Music Publishing revenues represented 14% and 16% of total revenues for the fiscal years ended September 30, 2019 and September 30, 2018, respectively. Prior to intersegment eliminations, U.S. and international revenues represented 44% and 56% of total revenues for each of the fiscal years ended September 30, 2019 and September 30, 2018.
Total digital revenues after intersegment eliminations increased by $358 million, or 16%, to $2,610 million for the fiscal year ended September 30, 2019 from $2,252 million for the fiscal year ended September 30, 2018. Total digital revenues represented 58% and 56% of consolidated revenues for the fiscal years ended September 30, 2019 and September 30, 2018, respectively. Prior to intersegment eliminations, total digital revenues for the fiscal year ended September 30, 2019 were comprised of U.S. revenues of $1,382 million and international revenues of $1,232 million, or 53% and 47% of total digital revenues, respectively. Prior to intersegment eliminations, total digital revenues for the fiscal year ended September 30, 2018 were comprised of U.S. revenues of $1,169 million and international revenues of $1,087 million, or 52% and 48% of total digital revenues, respectively.
Recorded Music revenues increased by $480 million, or 14%, to $3,840 million for the fiscal year ended September 30, 2019 from $3,360 million for the fiscal year ended September 30, 2018. U.S. Recorded Music revenues were $1,656 million and $1,460 million, or 43% of consolidated Recorded Music revenues for each of the fiscal years ended September 30, 2019 and September 30, 2018. International Recorded Music revenues were $2,184 million and $1,900 million, or 57% of consolidated Recorded Music revenues for each of the fiscal years ended September 30, 2019 and September 30, 2018.
The overall increase in Recorded Music revenue was driven by increases in digital revenue and artist services and expanded-rights revenue, partially offset by decreases in physical revenue and licensing revenue. Digital revenue increased by $324 million as a result of the continued growth in streaming services and a strong release schedule including top seller Meek Mill and carryover success from Ed Sheeran, The Greatest Showman and Cardi B as well as the adoption of ASC 606. Revenue from streaming services grew by $396 million to $2,129 million for the fiscal year ended September 30, 2019 from $1,733 million for the fiscal year ended September 30, 2018. Digital revenue growth was partially offset by a decline in download and other digital revenues of $72 million to $214 million for the fiscal year ended September 30, 2019 from $286 million for the fiscal year ended September 30, 2018 due to the continued shift to streaming. Artist services and expanded-rights revenue increased by $240 million primarily due to a $240 million increase related to the acquisition of EMP, higher merchandising and advertising revenues and timing of larger tours in Japan, partially offset by $94 million related to the divestment of a concert promotion business in Italy and the unfavorable impact of foreign currency exchange rates of $11 million. Physical revenue decreased by $71 million primarily due to the unfavorable impact of foreign currency exchange rates of $15 million, continued shift from physical revenue to digital revenue, partially offset by the success of new releases. Licensing revenue decreased by $13 million primarily due to the unfavorable impact of foreign currency exchange rates of $11 million and the impact of ASC 606 of $4 million.
Music Publishing revenues decreased by $10 million, or 2%, to $643 million for the fiscal year ended September 30, 2019 from $653 million for the fiscal year ended September 30, 2018, which was partially offset by an increase of $23 million due to the adoption of ASC 606. U.S. Music Publishing revenues were $300 million, or 47% of consolidated Music Publishing revenues for the fiscal year ended September 30, 2019,
73
Table of Contents
and $294 million, or 45% of consolidated Music Publishing revenues for the fiscal year ended September 30, 2018. International Music Publishing revenues were $343 million, or 53% of consolidated Music Publishing revenues for the fiscal year ended September 30, 2019, and $359 million, or 55% of consolidated Music Publishing revenues for the fiscal year ended September 30, 2018.
The overall decrease in Music Publishing revenue was mainly driven by decreases in performance revenue of $29 million and mechanical revenue of $17 million, partially offset by increases in digital revenue of $34 million, synchronization revenue of $1 million and other revenue of $1 million. The decreases in Music Publishing performance revenue and mechanical revenue are primarily due to lost administration rights and lower market share, partially offset by $7 million related to the adoption of ASC 606. The increase in digital revenue includes an $14 million increase resulting from the adoption of ASC 606 and increases in streaming revenue driven by the continued growth in streaming services, partially offset by decreases in download revenue.
2018 vs. 2017
Total revenues increased by $429 million, or 12%, to $4,005 million for the fiscal year ended September 30, 2018 from $3,576 million for the fiscal year ended September 30, 2017. Prior to intersegment eliminations, Recorded Music and Music Publishing revenues represented 84% and 16% of revenues for each of the fiscal years ended September 30, 2018 and the fiscal year ended September 30, 2017. Prior to intersegment eliminations, U.S. and international revenues represented 44% and 56% of total revenues for each of the fiscal years ended September 30, 2018 and September 30, 2017.
Total digital revenues after intersegment eliminations increased by $382 million, or 20%, to $2,252 million for the fiscal year ended September 30, 2018 from $1,870 million for the fiscal year ended September 30, 2017. Total digital revenues represented 56% and 52% of consolidated revenues for the fiscal year ended September 30, 2018 and September 30, 2017, respectively. Prior to intersegment eliminations, total digital revenues for the fiscal year ended September 30, 2018 were comprised of U.S. revenues of $1,169 million and international revenues of $1,087 million, or 52% and 48% of total digital revenues, respectively. Prior to intersegment eliminations, total digital revenues for the fiscal year ended September 30, 2017 were comprised of U.S. revenues of $1,005 million and international revenues of $874 million, or 53% and 47% of total digital revenues, respectively.
Recorded Music revenues increased by $340 million, or 11%, to $3,360 million for the fiscal year ended September 30, 2018 from $3,020 million for the fiscal year ended September 30, 2017. U.S. Recorded Music revenues were $1,460 million and $1,329 million, or 43% and 44% of consolidated Recorded Music revenues for the fiscal year ended September 30, 2018 and September 30, 2017, respectively. International Recorded Music revenues were $1,900 million and $1,691 million, or 57% and 56% of consolidated Recorded Music revenues for the fiscal years ended September 30, 2018 and September 30, 2017, respectively.
The overall increase in Recorded Music revenue was driven by increases in digital revenue, licensing revenue and artist services and expanded-rights revenue, partially offset by a decrease in physical revenue. Digital revenue increased by $327 million as a result of the continued growth in streaming services, and a strong release schedule. Revenue from streaming services grew by $391 million to $1,733 million for the fiscal year ended September 30, 2018 from $1,342 million for the fiscal year ended September 30, 2017. Digital revenue growth was partially offset by download and other digital declines of $64 million to $286 million for the fiscal year ended September 30, 2018 from $350 million for the fiscal year ended September 30, 2017. Licensing revenue increased by $46 million primarily due to higher broadcast fee income, revenue from recent acquisitions and increased synchronization activity. Artist services and expanded-rights revenue increased by $4 million primarily due to the favorable impact of foreign currency exchange rates of $13 million and higher merchandise revenue, partially offset by certain concert promotion business divestitures and the timing of tours. Physical revenue decreased by $37 million primarily due to underlying market decline as consumption shifts from physical to digital products.
74
Table of Contents
Music Publishing revenues increased by $81 million, or 14%, to $653 million for the fiscal year ended September 30, 2018 from $572 million for the fiscal year ended September 30, 2017. U.S. Music Publishing revenues were $294 million and $258 million, or 45% of consolidated Music Publishing revenues for each of the fiscal years ended September 30, 2018 and September 30, 2017. International Music Publishing revenues were $359 million and $314 million, or 55% of consolidated Music Publishing revenues for each of the fiscal years ended September 30, 2018 and September 30, 2017.
The overall increase in Music Publishing revenue was mainly driven by increases in digital revenue of $50 million, performance revenue of $15 million, synchronization revenue of $7 million and mechanical revenue of $7 million. The increase in digital revenue was due to an increase in streaming of $60 million, partially offset by download and other digital declines of $10 million. Performance revenue increased due to higher distributions. Synchronization revenue increased due to increased television and commercial income. The increase in mechanical revenue was attributable to the timing of distributions.
Revenue by Geographical Location
2019 vs. 2018
U.S. revenue increased by $202 million, or 12%, to $1,956 million for the fiscal year ended September 30, 2019 from $1,754 million for the fiscal year ended September 30, 2018. U.S. Recorded Music revenue increased by $196 million or 13%. The primary driver was the increase in U.S. Recorded Music digital revenue, which increased by $191 million due to the continued growth in streaming services. Streaming revenue increased by $228 million, partially offset by a $37 million decline in download revenue. U.S. artist services and expanded-rights revenue also increased by $50 million, or 40%, driven by higher advertising and merchandising revenues. These increases were partially offset by a decline in U.S. physical revenue of $38 million due to the shift from physical to digital formats. U.S. Music Publishing revenue increased by $6 million or 2%. This was primarily driven by the increase in U.S. Music Publishing digital revenue of $22 million due to an increase in streaming revenue and adoption of ASC 606, partially offset by decreases in mechanical revenue of $12 million, performance revenue of $3 million and other revenue of $1 million.
International revenue increased by $268 million, or 12%, to $2,527 million for the fiscal year ended September 30, 2019 from $2,259 million for the fiscal year ended September 30, 2018, which includes $240 million related to the acquisition of EMP. Excluding the unfavorable impact of foreign currency exchange rates, International revenue increased by $375 million or 17%. International Recorded Music revenue increased $284 million primarily due to increases in digital revenue of $133 million and artist services and expanded-rights revenue of $190 million, partially offset by a decrease in physical revenue of $33 million and licensing revenue of $6 million. International Recorded Music digital revenue increased due to a $168 million increase in streaming services revenue, partially offset by a $35 million decline in download and other digital revenue. The increase in international Recorded Music streaming revenue was due to the continued growth in streaming services internationally and strong release performance. Decline in downloads was due to the continued shift to streaming services. International Recorded Music artist services and expanded-rights revenue increased $240 million due to the acquisition of EMP, higher merchandising revenues and timing of larger tours in Japan in the current fiscal year, partially offset by $94 million related to the divestment of a concert promotion business in Italy and the unfavorable impact of foreign currency exchange rates of $11 million. International Recorded Music physical revenue decreased due to the continued shift from physical to digital formats and the unfavorable impact of foreign currency exchange rates of $15 million, partially offset by the success of new releases including Johnny Hallyday in France and local artists in Japan. International Recorded Music licensing revenue decreased due to the unfavorable impact of foreign currency exchange rates of $13 million and the impact of ASC 606, partially offset by increased synchronization activity in the U.K. and Japan. International Music Publishing revenue decreased $16 million or 4%. This was primarily driven by decreases in international Music Publishing performance revenue of $26 million and mechanical revenue of $5 million both due to lost administration rights and lower market share, partially offset by the increase in digital revenue of $12 million primarily due to growth in streaming and the adoption of ASC 606.
75
Table of Contents
2018 vs. 2017
U.S. revenue increased by $167 million, or 11%, to $1,754 million for the fiscal year ended September 30, 2018 from $1,587 million for the fiscal year ended September 30, 2017. U.S. Recorded Music revenue increased by $131 million or 10%. The primary driver was the increase in U.S. Recorded Music digital revenue, which increased by $144 million due to the continued growth in streaming services and strong release performance. U.S. licensing revenue increased by $9 million due to higher broadcast fee income and increased synchronization activity. These increases were partially offset by a decline in U.S. physical revenue of $16 million due to the shift from physical revenue to digital revenue and a decline in artist services and expanded-rights revenue of $6 million. U.S. Music Publishing revenues increased by $36 million or 14%. This was primarily driven by the increase in U.S. Music Publishing digital revenue of $20 million due to an increase in streaming revenue of $32 million from the continued growth in streaming services, partially offset by declines in download and other digital revenue of $12 million. U.S. mechanical revenue and U.S. performance revenue increased by $8 million and $3 million, respectively, due to higher distributions. U.S. synchronization revenue increased by $4 million due to increased film and commercial income.
International revenue increased by $254 million, or 13%, to $2,259 million for the fiscal year ended September 30, 2018 from $2,005 million for the fiscal year ended September 30, 2017. Excluding the favorable impact of foreign currency exchange rates, international revenue increased by $163 million or 8%. International Recorded Music revenue increased $209 million primarily due to increases in digital revenue of $183 million, licensing revenue of $37 million and artist services and expanded-rights revenue of $10 million, partially offset by a decrease in physical revenue of $21 million. International Recorded Music digital revenue increased due to a $211 million increase in streaming services revenue, partially offset by a $28 million decline in download and other digital revenue. The increase in international Recorded Music streaming revenue was due to the continued growth in streaming services internationally and strong release performance from WANIMA in Japan. International Recorded Music licensing revenue increased due to revenue from recent acquisitions, higher broadcast fee income and the favorable impact of foreign currency exchange rates of $10 million. International Recorded Music artist services and expanded-rights revenue increased due to the favorable impact of foreign currency exchange rates of $13 million, partially offset by successful tours in France in the prior fiscal year with no comparable tours in the current fiscal year and divestment of certain concert promotion businesses in the prior year. International Recorded Music physical revenue decreased due to the continued shift from physical to digital revenue, partially offset by the favorable impact of foreign currency exchange rates of $27 million. International Music Publishing revenue increased $45 million primarily due to increases in digital revenue of $30 million, in performance revenue of $12 million and in synchronization revenue of $3 million.
Cost of revenues
Our cost of revenues was composed of the following amounts (in millions):
| For the Fiscal Year Ended September 30, |
2019 vs. 2018 | 2018 vs. 2017 | ||||||||||||||||||||||||||
| 2019 | 2018 | 2017 | $ Change | % Change | $ Change | % Change | ||||||||||||||||||||||
| Artist and repertoire costs |
$ | 1,574 | $ | 1,471 | $ | 1,303 | $ | 103 | 7 | % | $ | 168 | 13 | % | ||||||||||||||
| Product costs |
827 | 700 | 628 | 127 | 18 | % | 72 | 12 | % | |||||||||||||||||||
|
|
|
|
|
|
|
|
|
|
|
|||||||||||||||||||
| Total cost of revenues |
$ | 2,401 | $ | 2,171 | $ | 1,931 | $ | 230 | 11 | % | $ | 240 | 12 | % | ||||||||||||||
|
|
|
|
|
|
|
|
|
|
|
|||||||||||||||||||
2019 vs. 2018
Our cost of revenues increased by $230 million, or 11%, to $2,401 million for the fiscal year ended September 30, 2019 from $2,171 million for the fiscal year ended September 30, 2018. Expressed as a percentage of revenues, cost of revenues remained constant at 54% for each of the fiscal years ended September 30, 2019 and September 30, 2018.
76
Table of Contents
Artist and repertoire costs increased by $103 million, or 7%, to $1,574 million for the fiscal year ended September 30, 2019 from $1,471 million for the fiscal year ended September 30, 2018. Artist and repertoire costs as a percentage of revenues decreased to 35% for the fiscal year ended September 30, 2019 from 37% for the fiscal year ended September 30, 2018 due to the acquisition of EMP, which has no artist and repertoire costs and therefore reduces our total artist and repertoire costs as a percentage of revenue. Excluding EMP revenue, artist and repertoire costs were flat at 37%.
Product costs increased by $127 million, or 18%, to $827 million for the fiscal year ended September 30, 2019 from $700 million for the fiscal year ended September 30, 2018. Product costs as a percentage of revenues remained flat at 18% for each of the fiscal years ended September 30, 2019 and September 30, 2018. The overall increase in product costs relate to the acquisition of EMP of $116 million as well as revenue mix related to increasing artist services and expanded-rights revenues, which were partially offset by $82 million related to the divestment of a concert promotion business in Italy.
2018 vs. 2017
Our cost of revenues increased by $240 million, or 12%, to $2,171 million for the fiscal year ended September 30, 2018 from $1,931 million for the fiscal year ended September 30, 2017. Expressed as a percentage of revenues, cost of revenues remained flat at 54% for each of the fiscal years ended September 30, 2018 and September 30, 2017.
Artist and repertoire costs increased by $168 million, or 13%, to $1,471 million for the fiscal year ended September 30, 2018 from $1,303 million for the fiscal year ended September 30, 2017. Artist and repertoire costs as a percentage of revenues increased to 37% for the fiscal year ended September 30, 2018 from 36% for the fiscal year ended September 30, 2017. The increase was primarily driven by the mix of revenue and increased investment in artists and songwriters.
Product costs increased by $72 million, or 12%, to $700 million for the fiscal year ended September 30, 2018 from $628 million for the fiscal year ended September 30, 2017. Product costs as a percentage of revenues remained flat at 18% for each of the fiscal years ended September 30, 2018 and September 30, 2017.
Selling, general and administrative expenses
Our selling, general and administrative expenses are composed of the following amounts (in millions):
| For the Fiscal Year Ended September 30, |
2019 vs. 2018 | 2018 vs. 2017 | ||||||||||||||||||||||||||
| 2019 | 2018 | 2017 | $ Change | % Change | $ Change | % Change | ||||||||||||||||||||||
| General and administrative expense (1) |
$ | 764 | $ | 814 | $ | 684 | $ | (50 | ) | -6 | % | $ | 130 | 19 | % | |||||||||||||
| Selling and marketing expense |
632 | 530 | 472 | 102 | 19 | % | 58 | 12 | % | |||||||||||||||||||
| Distribution expense |
114 | 67 | 66 | 47 | 70 | % | 1 | 2 | % | |||||||||||||||||||
|
|
|
|
|
|
|
|
|
|
|
|||||||||||||||||||
| Total selling, general and administrative expense |
$ | 1,510 | $ | 1,411 | $ | 1,222 | $ | 99 | 7 | % | $ | 189 | 16 | % | ||||||||||||||
|
|
|
|
|
|
|
|
|
|
|
|||||||||||||||||||
| (1) | Includes depreciation expense of $61 million, $55 million and $50 million for the fiscal years ended September 30, 2019, September 30, 2018 and September 30, 2017, respectively. |
2019 vs. 2018
Total selling, general and administrative expense increased by $99 million, or 7%, to $1,510 million for the fiscal year ended September 30, 2019 from $1,411 million for the fiscal year ended September 30, 2018. Expressed as a percentage of revenues, selling, general and administrative expenses decreased to 34% for the fiscal year ended September 30, 2019 from 35% for the fiscal year ended September 30, 2018.
77
Table of Contents
General and administrative expenses decreased by $50 million, or 6%, to $764 million for the fiscal year ended September 30, 2019 from $814 million for the fiscal year ended September 30, 2018. The decrease in general and administrative expense was primarily due to lower expense associated with the Senior Management Free Cash Flow Plan of $37 million and a decrease in severance and restructuring costs of $46 million, partially offset by higher employee-related costs. Expressed as a percentage of revenue, general and administrative expense decreased to 17% for the fiscal year ended September 30, 2019 from 20% for the fiscal year ended September 30, 2018.
Selling and marketing expense increased by $102 million, or 19%, to $632 million for the fiscal year ended September 30, 2019 from $530 million for the fiscal year ended September 30, 2018. The increase in selling and marketing expense was primarily due to an increase of $71 million relating to the acquisition of EMP and increased variable marketing expenses on higher revenue during the fiscal year. Expressed as a percentage of revenues, selling and marketing expense increased to 14% for the fiscal year ended September 30, 2019 from 13% for the fiscal year September 30, 2018. Excluding the acquisition of EMP, selling and marketing expense was flat at 13%.
Distribution expense increased by $47 million, or 70%, to $114 million for the fiscal year ended September 30, 2019 from $67 million for the fiscal year ended September 30, 2018. Expressed as a percentage of revenues, distribution expense increased to 3% for the fiscal year ended September 30, 2019 from 2% for the fiscal year ended September 30, 2018 mainly due to $35 million in costs resulting from the acquisition of EMP. Excluding the acquisition of EMP, distribution expense was flat at 2%.
2018 vs. 2017
Total selling, general and administrative expense increased by $189 million, or 16%, to $1,411 million for the fiscal year ended September 30, 2018 from $1,222 million for the fiscal year ended September 30, 2017. Expressed as a percentage of revenues, selling, general and administrative expenses increased to 35% for the fiscal year ended September 30, 2018 from 34% for the fiscal year ended September 30, 2017.
General and administrative expenses increased by $130 million, or 19%, to $814 million for the fiscal year ended September 30, 2018 from $684 million for the fiscal year ended September 30, 2017. The increase in general and administrative expense was primarily due to increases in other employee related compensation expense, including severance and restructuring costs, of $78 million, and an increase in facilities cost due to an overlap in terms on the lease of our new Los Angeles, California headquarters with our existing office leases of $16 million. The increase was also due to an increase in expense associated with the Senior Management Free Cash Flow Plan of $6 million, which is primarily related to compensation costs associated with higher dividend payments in the 2018 fiscal year. Expressed as a percentage of revenue, general and administrative expense increased to 20% for the fiscal year ended September 30, 2018 from 19% for the fiscal year ended September 30, 2017.
Selling and marketing expense increased by $58 million, or 12%, to $530 million for the fiscal year ended September 30, 2018 from $472 million for the fiscal year ended September 30, 2017. Expressed as a percentage of revenues, selling and marketing expense remained flat at 13% for each of the fiscal years ended September 30, 2018 and September 30, 2017.
Distribution expense increased by $1 million, or 2%, to $67 million for the fiscal year ended September 30, 2018 from $66 million for the fiscal year ended September 30, 2017. Expressed as a percentage of revenues, distribution expense remained flat at 2% for each of the fiscal years ended September 30, 2018 and September 30, 2017.
78
Table of Contents
Reconciliation of Net Income Attributable to Warner Music Group Corp. and Operating Income to Consolidated OIBDA
As previously described, we use OIBDA as our primary measure of financial performance. The following table reconciles operating income to OIBDA, and further provides the components from net income attributable to Warner Music Group Corp. to operating income for purposes of the discussion that follows (in millions):
| For the Fiscal Year Ended September 30, |
2019 vs. 2018 | 2018 vs. 2017 | ||||||||||||||||||||||||||
| 2019 | 2018 | 2017 | $ Change | % Change | $ Change | % Change | ||||||||||||||||||||||
| Net income attributable to Warner Music Group Corp. |
$ | 256 | $ | 307 | $ | 143 | $ | (51 | ) | -17 | % | $ | 164 | 115 | % | |||||||||||||
| Income attributable to noncontrolling interest |
2 | 5 | 6 | (3 | ) | -60 | % | (1 | ) | -17 | % | |||||||||||||||||
|
|
|
|
|
|
|
|
|
|
|
|||||||||||||||||||
| Net income |
258 | 312 | 149 | (54 | ) | -17 | % | 163 | 109 | % | ||||||||||||||||||
| Income tax expense (benefit) |
9 | 130 | (151 | ) | (121 | ) | -93 | % | 281 | — | % | |||||||||||||||||
|
|
|
|
|
|
|
|
|
|
|
|||||||||||||||||||
| Income (loss) before income taxes |
267 | 442 | (2 | ) | (175 | ) | -40 | % | 444 | — | % | |||||||||||||||||
| Other (income) expense |
(60 | ) | (394 | ) | 40 | 334 | -85 | % | (434 | ) | — | % | ||||||||||||||||
| Interest expense, net |
142 | 138 | 149 | 4 | 3 | % | (11 | ) | -7 | % | ||||||||||||||||||
| Loss on extinguishment of debt |
7 | 31 | 35 | (24 | ) | -77 | % | (4 | ) | -11 | % | |||||||||||||||||
|
|
|
|
|
|
|
|
|
|
|
|||||||||||||||||||
| Operating income |
356 | 217 | 222 | 139 | 64 | % | (5 | ) | -2 | % | ||||||||||||||||||
| Amortization expense |
208 | 206 | 201 | 2 | 1 | % | 5 | 3 | % | |||||||||||||||||||
| Depreciation expense |
61 | 55 | 50 | 6 | 11 | % | 5 | 10 | % | |||||||||||||||||||
|
|
|
|
|
|
|
|
|
|
|
|||||||||||||||||||
| OIBDA |
$ | 625 | $ | 478 | $ | 473 | $ | 147 | 31 | % | $ | 5 | 1 | % | ||||||||||||||
|
|
|
|
|
|
|
|
|
|
|
|||||||||||||||||||
OIBDA
2019 vs. 2018
Our OIBDA increased by $147 million, or 31%, to $625 million for the fiscal year ended September 30, 2019 as compared to $478 million for the fiscal year ended September 30, 2018, primarily as a result of higher revenues and lower general and administrative expenses. Expressed as a percentage of total revenues, OIBDA increased to 14% for the fiscal year ended September 30, 2019 from 12% for the fiscal year ended September 30, 2018 largely due to $15 million related to the transition in timing of revenues and related costs resulting from the adoption of ASC 606, $18 million related to the acquisition of EMP, which is a lower-margin business, and lower general and administrative expenses.
2018 vs. 2017
Our OIBDA increased by $5 million, or 1%, to $478 million for the fiscal year ended September 30, 2018 as compared to $473 million for the fiscal year ended September 30, 2017, primarily as a result of higher revenue, partially offset by higher general and administrative expenses. Expressed as a percentage of total revenues, OIBDA decreased to 12% for the fiscal year ended September 30, 2018 from 13% for the fiscal year ended September 30, 2017.
Depreciation expense
2019 vs. 2018
Our depreciation expense increased by $6 million, or 11%, to $61 million for the fiscal year ended September 30, 2019 from $55 million for the fiscal year ended September 30, 2018, primarily due to increased assets from the EMP acquisition in October 2018 and our new Los Angeles, California headquarters placed into service in April 2019.
79
Table of Contents
2018 vs. 2017
Our depreciation expense increased by $5 million, or 10%, to $55 million for the fiscal year ended September 30, 2018 from $50 million for the fiscal year ended September 30, 2017, primarily due to an increase in technology and facilities capital spending.
Amortization expense
2019 vs. 2018
Amortization expense increased by $2 million, or 1%, to $208 million for the fiscal year ended September 30, 2019 from $206 million for the fiscal year ended September 30, 2018, primarily due to an increase in amortizable intangible assets related to the acquisition of EMP in October 2018, offset by the impact of foreign currency exchange rates.
2018 vs. 2017
Amortization expense increased by $5 million, or 3%, to $206 million for the fiscal year ended September 30, 2018 from $201 million for the fiscal year ended September 30, 2017, primarily due to an increase in amortizable intangible assets and the impact of foreign currency exchange rates.
Operating income
2019 vs. 2018
Our operating income increased by $139 million to $356 million for the fiscal year ended September 30, 2019 from $217 million for the fiscal year ended September 30, 2018. The increase in operating income was due to the factors that led to the increase in OIBDA.
2018 vs. 2017
Our operating income decreased by $5 million to $217 million for the fiscal year ended September 30, 2018 from $222 million for the fiscal year ended September 30, 2017. The decrease in operating income was primarily due to higher general and administrative expenses as noted above, partially offset by higher revenue.
Loss on extinguishment of debt
2019 vs. 2018
We recorded a loss on extinguishment of debt in the amount of $7 million for the fiscal year ended September 30, 2019, which represents the unamortized deferred financing costs related to the redemption of the 4.125% Secured Notes and 5.625% Secured Notes, in addition to the open market purchase of the 4.875% Secured Notes. We recorded a loss on extinguishment of debt in the amount of $31 million for the fiscal year ended September 30, 2018, which represents the premium paid on early redemption and unamortized deferred financing costs related to the refinancing transactions that occurred during fiscal 2018. Please refer to Note 8 of our audited Consolidated Financial Statements for further discussion.
2018 vs. 2017
We recorded a loss on extinguishment of debt in the amount of $31 million for the fiscal year ended September 30, 2018, which represents the premium paid on early redemption and unamortized deferred financing costs related to the June 7, 2018 amendment to the Senior Term Loan Credit Agreement, the redemption of the 6.750% Senior Notes and the December 6, 2017 amendment to the Senior Term Loan Credit Agreement. We recorded a loss on extinguishment of debt in the amount of $35 million for the fiscal year ended September 30,
80
Table of Contents
2017, which represents the premium paid on early redemption and unamortized deferred financing costs related to the refinancing transactions that occurred during fiscal 2017. Please refer to Note 8 of our audited Consolidated Financial Statements for further discussion.
Interest expense, net
2019 vs. 2018
Our interest expense, net increased by $4 million, or 3% to $142 million for the fiscal year ended September 30, 2019 from $138 million for the fiscal year ended September 30, 2018. This was primarily driven by the higher debt balance from the issuance of the 3.625% Secured Notes during the current year, offset by lower interest rates as a result of refinancing transactions and redemption activity.
2018 vs. 2017
Our interest expense, net, decreased by $11 million, or 7% to $138 million for the fiscal year ended September 30, 2018 from $149 million for the fiscal year ended September 30, 2017. This was primarily due to lower interest rates as a result of refinancing transactions and interest income on higher cash balances during the year.
Other (income) expense, net
2019 vs. 2018
Other (income) expense, net decreased by $334 million to other income of $60 million for the fiscal year ended September 30, 2019 from other income of $394 million for the fiscal year ended September 30, 2018. Other (income) expense, net for the fiscal year ended September 30, 2019 primarily includes the unrealized gain of $19 million on the mark-to-market of an equity method investment and foreign exchange currency gains on our Euro-denominated debt of $43 million, partially offset by movements in foreign exchange rates.
Other (income) expense, net for the fiscal year ended September 30, 2018 includes the gain on the Spotify share sale, net of estimated artist share and other related costs, of $382 million, gain on investments of $7 million and foreign currency gains on our Euro-denominated debt of $4 million.
2018 vs. 2017
Other (income) expense, net, increased by $434 million to other income of $394 million for the fiscal year ended September 30, 2018 from other expense of $40 million for the fiscal year ended September 30, 2017. Other (income) expense, net for the fiscal year ended September 30, 2018, includes the gain on the Spotify share sale, net of estimated artist share and other related costs of $382 million, gain on investments of $7 million and foreign currency gains on our Euro-denominated debt of $4 million.
Other (income) expense, net for the fiscal year ended September 30, 2017, includes currency exchange loss on our Euro-denominated debt of $27 million, loss on investments of $21 million, partially offset by foreign currency exchange gains on intercompany loans and derivative liabilities of $5 million.
Income tax expense (benefit)
2019 vs. 2018
Our income tax expense decreased by $121 million to $9 million for the fiscal year ended September 30, 2019 from $130 million for the fiscal year ended September 30, 2018. The net decrease of $121 million in income tax expense primarily relates to the release of $59 million of our U.S. deferred tax valuation allowance and higher tax expense of $77 million in fiscal 2018 as a result of the gain on the sale of the Spotify shares in the fiscal year ended September 30, 2018.
81
Table of Contents
2018 vs. 2017
Our income tax expense (benefit) increased by $281 million to $130 million for the fiscal year ended September 30, 2018 compared to an income tax benefit of $151 million for the fiscal year ended September 30, 2017. The net increase of $281 million in income tax expense primarily relates to higher pre-tax income as a result of the gain on the Spotify share sale of $77 million and U.S. tax expense of $23 million for the reduction of our net U.S. deferred tax assets as a result of the change in the U.S. corporate statutory tax rate, as compared to a U.S. tax benefit of $125 million related to the reversal of a significant portion of our U.S. deferred tax valuation allowance and a $59 million benefit related to foreign currency losses on intra-entity loans.
Net income
2019 vs. 2018
Our net income decreased by $54 million to $258 million for the fiscal year ended September 30, 2019 from $312 million for the fiscal year ended September 30, 2018 as a result of the factors described above.
2018 vs. 2017
Our net income increased by $163 million, to $312 million for the fiscal year ended September 30, 2018 from $149 million for the fiscal year ended September 30, 2017 as a result of the factors described above. The increase in income was primarily driven by the factors described above.
Noncontrolling interest
2019 vs. 2018
There was $2 million of income attributable to noncontrolling interests for the fiscal year ended September 30, 2019 primarily due to the adoption of ASC 606. There was $5 million of income attributable to noncontrolling interests for the fiscal year ended September 30, 2018.
2018 vs. 2017
Net income attributable to noncontrolling interests was $5 million for the fiscal year ended September 30, 2018 and $6 million for the fiscal year ended September 30, 2017.
Business Segment Results
Revenue, operating income (loss) and OIBDA by business segment are as follows (in millions):
| For the Fiscal Year Ended September 30, |
2019 vs. 2018 | 2018 vs. 2017 | ||||||||||||||||||||||||||
| 2019 | 2018 | 2017 | $ Change | % Change | $ Change | % Change | ||||||||||||||||||||||
| Recorded Music |
||||||||||||||||||||||||||||
| Revenue |
$ | 3,840 | $ | 3,360 | $ | 3,020 | $ | 480 | 14 | % | $ | 340 | 11 | % | ||||||||||||||
| Operating income |
439 | 307 | 283 | 132 | 43 | % | 24 | 9 | % | |||||||||||||||||||
| OIBDA |
623 | 480 | 451 | 143 | 30 | % | 29 | 6 | % | |||||||||||||||||||
| Music Publishing |
||||||||||||||||||||||||||||
| Revenue |
643 | 653 | 572 | (10 | ) | -2 | % | 81 | 14 | % | ||||||||||||||||||
| Operating income |
92 | 84 | 81 | 8 | 10 | % | 3 | 4 | % | |||||||||||||||||||
| OIBDA |
166 | 159 | 152 | 7 | 4 | % | 7 | 5 | % | |||||||||||||||||||
| Corporate expenses and eliminations |
||||||||||||||||||||||||||||
| Revenue elimination |
(8 | ) | (8 | ) | (16 | ) | — | — | % | 8 | -50 | % | ||||||||||||||||
| Operating loss |
(175 | ) | (174 | ) | (142 | ) | (1 | ) | 1 | % | (32 | ) | 23 | % | ||||||||||||||
| OIBDA |
(164 | ) | (161 | ) | (130 | ) | (3 | ) | 2 | % | (31 | ) | 24 | % | ||||||||||||||
| Total |
||||||||||||||||||||||||||||
| Revenue |
4,475 | 4,005 | 3,576 | 470 | 12 | % | 429 | 12 | % | |||||||||||||||||||
| Operating income |
356 | 217 | 222 | 139 | 64 | % | (5 | ) | -2 | % | ||||||||||||||||||
| OIBDA |
625 | 478 | 473 | 147 | 31 | % | 5 | 1 | % | |||||||||||||||||||
82
Table of Contents
Recorded Music
Revenues
2019 vs. 2018
Recorded Music revenues increased by $480 million, or 14%, to $3,840 million for the fiscal year ended September 30, 2019 from $3,360 million for the fiscal year ended September 30, 2018. U.S. Recorded Music revenues were $1,656 million and $1,460 million, or 43% of consolidated Recorded Music revenues, for the fiscal year ended September 30, 2019 and September 30, 2018, respectively. International Recorded Music revenues were $2,184 million and $1,900 million, or 57% of consolidated Recorded Music revenues, for each of the fiscal years ended September 30, 2019 and September 30, 2018, respectively.
The overall increase in Recorded Music revenue was driven by increases in digital revenue and artist services and expanded-rights revenue, partially offset by a decrease in physical revenue and licensing revenue as described in the “—Results of Operations—Fiscal Year Ended September 30, 2019 Compared with Fiscal Year Ended September 30, 2018 and Fiscal Year Ended September 30, 2017—Consolidated Results—Total Revenue” and “—Results of Operations—Fiscal Year Ended September 30, 2019 Compared with Fiscal Year Ended September 30, 2018 and Fiscal Year Ended September 30, 2017—Consolidated Results—Revenue by Geographical Location” sections above.
2018 vs. 2017
Recorded Music revenues increased by $340 million, or 11%, to $3,360 million for the fiscal year ended September 30, 2018 from $3,020 million for the fiscal year ended September 30, 2017. U.S. Recorded Music revenues were $1,460 million and $1,329 million, or 43% and 44% of consolidated Recorded Music revenues for the fiscal year ended September 30, 2018 and September 30, 2017, respectively. International Recorded Music revenues were $1,900 million and $1,691 million, or 57% and 56% of consolidated Recorded Music revenues for each of the fiscal years ended September 30, 2018 and September 30, 2017, respectively.
The overall increase in Recorded Music revenue was mainly driven by streaming revenue growth as described in the “—Results of Operations—Fiscal Year Ended September 30, 2019 Compared with Fiscal Year Ended September 30, 2018 and Fiscal Year Ended September 30, 2017—Consolidated Results—Total Revenue” and “—Results of Operations—Fiscal Year Ended September 30, 2019 Compared with Fiscal Year Ended September 30, 2018 and Fiscal Year Ended September 30, 2017—Consolidated Results—Revenue by Geographical Location” sections above.
Cost of revenues
Recorded Music cost of revenues was composed of the following amounts (in millions):
| For the Fiscal Year Ended September 30, |
2019 vs. 2018 | 2018 vs. 2017 | ||||||||||||||||||||||||||
| 2019 | 2018 | 2017 | $ Change | % Change | $ Change | % Change | ||||||||||||||||||||||
| Artist and repertoire costs |
$ | 1,178 | $ | 1,054 | $ | 964 | $ | 124 | 12 | % | $ | 90 | 9 | % | ||||||||||||||
| Product costs |
827 | 700 | 628 | 127 | 18 | % | 72 | 12 | % | |||||||||||||||||||
|
|
|
|
|
|
|
|
|
|
|
|||||||||||||||||||
| Total cost of revenues |
$ | 2,005 | $ | 1,754 | $ | 1,592 | $ | 251 | 14 | % | $ | 162 | 10 | % | ||||||||||||||
|
|
|
|
|
|
|
|
|
|
|
|||||||||||||||||||
2019 vs. 2018
Recorded Music cost of revenues increased by $251 million, or 14%, to $2,005 million for the fiscal year ended September 30, 2019 from $1,754 million for the fiscal year ended September 30, 2018. Expressed as a percentage of Recorded Music revenues, cost of revenues remained flat at 52% for each of the fiscal years ended September 30, 2019 and September 30, 2018.
83
Table of Contents
Artist and repertoire costs as a percentage of revenue remained constant at 31% for each of the fiscal years ended September 30, 2019 and September 30, 2018. Excluding EMP revenue, artist and repertoire costs as a percentage of revenue increased to 33% primarily driven by the mix of revenue, increased investments in artists and songwriters and the prior year benefit for advance recoveries of $10 million.
Product costs as a percentage of revenue increased to 22% for the fiscal year ended September 30, 2019 from 21% for the fiscal year ended September 30, 2018. The increase in product costs is primarily due to the acquisition of EMP, partially offset by a concert promotion business divestment in Italy.
2018 vs. 2017
Recorded Music cost of revenues increased by $162 million, or 10%, to $1,754 million for the fiscal year ended September 30, 2018 from $1,592 million for the fiscal year ended September 30, 2017. Artist and repertoire costs as a percentage of revenue decreased to 31% for the fiscal year ended September 30, 2018 from 32% for the fiscal year ended September 30, 2017 primarily due to a shift in revenue mix toward higher-margin digital revenues from lower-margin physical revenues internationally and a benefit for advance recoveries of $10 million. Product costs as a percentage of revenue remained flat at 21% for each of the fiscal years ended September 30, 2018 and September 30, 2017. Expressed as a percentage of Recorded Music revenues, cost of revenues decreased to 52% for the fiscal year ended September 30, 2018 from 53% for the fiscal year ended September 30, 2017.
Selling, general and administrative expense
Recorded Music selling, general and administrative expenses were composed of the following amounts (in millions):
| For the Fiscal Year Ended September 30, |
2019 vs. 2018 | 2018 vs. 2017 | ||||||||||||||||||||||||||
| 2019 | 2018 | 2017 | $ Change | % Change | $ Change | % Change | ||||||||||||||||||||||
| General and administrative expense (1) |
$ | 522 | $ | 573 | $ | 478 | $ | (51 | ) | -9 | % | $ | 95 | 20 | % | |||||||||||||
| Selling and marketing expense |
621 | 521 | 465 | 100 | 19 | % | 56 | 12 | % | |||||||||||||||||||
| Distribution expense |
114 | 67 | 66 | 47 | 70 | % | 1 | 2 | % | |||||||||||||||||||
|
|
|
|
|
|
|
|
|
|
|
|||||||||||||||||||
| Total selling, general and administrative expense |
$ | 1,257 | $ | 1,161 | $ | 1,009 | $ | 96 | 8 | % | $ | 152 | 15 | % | ||||||||||||||
|
|
|
|
|
|
|
|
|
|
|
|||||||||||||||||||
| (1) | Includes depreciation expense of $45 million, $35 million, and $32 million for the fiscal years ended September 30, 2019, September 30, 2018 and September 30, 2017, respectively. |
2019 vs. 2018
Recorded Music selling, general and administrative expense increased by $96 million, or 8%, to $1,257 million for the fiscal year ended September 30, 2019 from $1,161 million for the fiscal year ended September 30, 2018. The decrease in Recorded Music general and administrative expense was primarily due to lower expense associated with the Senior Management Free Cash Flow Plan of $21 million and decreases in severance and restructuring costs of $44 million, partially offset by higher employee related costs. The increase in selling and marketing expense was primarily due to $71 million resulting from the acquisition of EMP and increased variable marketing expense on higher revenue in the fiscal year. The increase in distribution expense was primarily due to $35 million in costs resulting from the acquisition of EMP during the year. Expressed as a percentage of Recorded Music revenue, Recorded Music selling, general and administrative expense decreased to 33% for the fiscal year ended September 30, 2019 from 35% for the fiscal year ended September 30, 2018.
84
Table of Contents
2018 vs. 2017
Recorded Music selling, general and administrative expense increased by $152 million, or 15%, to $1,161 million for the fiscal year ended September 30, 2018 from $1,009 million for the fiscal year ended September 30, 2017. The increase in Recorded Music general and administrative expense was primarily due to increases in other employee related compensation including severance and restructuring costs of $63 million and an increase in facilities cost due to an overlap in terms on the lease of our new Los Angeles, California headquarters with our existing office leases of $15 million. The increase was also due to an increase in expense of $1 million associated with the Senior Management Free Cash Flow Plan, which is primarily related to compensation costs associated with higher dividend payments in the 2018 fiscal year. Selling and marketing expense increased in line with the increase in revenue. Expressed as a percentage of Recorded Music revenue, Recorded Music selling, general and administrative expense increased to 35% for the fiscal year ended September 30, 2018 from 33% for the fiscal year ended September 30, 2017.
Operating income and OIBDA
Recorded Music OIBDA included the following amounts (in millions):
| For the Fiscal Year Ended September 30, |
2019 vs. 2018 | 2018 vs. 2017 | ||||||||||||||||||||||||||
| 2019 | 2018 | 2017 | $ Change | % Change | $ Change | % Change | ||||||||||||||||||||||
| Operating income |
$ | 439 | $ | 307 | $ | 283 | $ | 132 | 43 | % | $ | 24 | 9 | % | ||||||||||||||
| Depreciation and amortization |
184 | 173 | 168 | 11 | 6 | % | 5 | 3 | % | |||||||||||||||||||
|
|
|
|
|
|
|
|
|
|
|
|||||||||||||||||||
| OIBDA |
$ | 623 | $ | 480 | $ | 451 | $ | 143 | 30 | % | $ | 29 | 6 | % | ||||||||||||||
|
|
|
|
|
|
|
|
|
|
|
|||||||||||||||||||
2019 vs. 2018
Recorded Music OIBDA increased by $143 million, or 30%, to $623 million for the fiscal year ended September 30, 2019 from $480 million for the fiscal year ended September 30, 2018 primarily as a result of higher Recorded Music revenues, $18 million related to the acquisition of EMP which is a lower-margin business and lower general and administrative expenses. Expressed as a percentage of Recorded Music revenues, Recorded Music OIBDA increased to 16% for the fiscal year ended September 30, 2019 from 14% for the fiscal year ended September 30, 2018.
Recorded Music operating income increased by $132 million to $439 million for the fiscal year ended September 30, 2019 from $307 million for the fiscal year ended September 30, 2018 due to the factors that led to the increase in Recorded Music OIBDA noted above.
2018 vs. 2017
Recorded Music OIBDA increased by $29 million, or 6%, to $480 million for the fiscal year ended September 30, 2018 from $451 million for the fiscal year ended September 30, 2017 primarily as a result of higher Recorded Music revenues, partially offset by higher general and administrative expenses. Expressed as a percentage of Recorded Music revenues, Recorded Music OIBDA decreased to 14% for the fiscal year ended September 30, 2018 from 15% for the fiscal year ended September 30, 2017.
Recorded Music operating income increased by $24 million to $307 million for the fiscal year ended September 30, 2018 from $283 million for the fiscal year ended September 30, 2017 due to the increase in revenue, partially offset by higher general and administrative expenses as noted above.
85
Table of Contents
Music Publishing
Revenues
2019 vs. 2018
Music Publishing revenues decreased by $10 million, or 2%, to $643 million for the fiscal year ended September 30, 2019 from $653 million for the fiscal year ended September 30, 2018. U.S. Music Publishing revenues were $300 million and $294 million, or 47% and 45%, of Music Publishing revenues for the fiscal years ended September 30, 2019 and September 30, 2018, respectively. International Music Publishing revenues were $343 million and $359 million, or 53% and 55%, of Music Publishing revenues for the fiscal years ended September 30, 2019 and September 30, 2018, respectively.
The overall decrease in Music Publishing revenue was mainly driven by a decrease in revenues associated with lost administrative rights and lower market share, partially offset by the increase in digital revenue and the impact of the adoption of ASC 606, as described in the “Total Revenues” and “Revenue by Geographical Location” sections above.
2018 vs. 2017
Music Publishing revenues increased by $81 million, or 14%, to $653 million for the fiscal year ended September 30, 2018 from $572 million for the fiscal year ended September 30, 2017. U.S. Music Publishing revenues were $294 million and $258 million, or 45% of Music Publishing revenues for each of the fiscal years ended September 30, 2018 and September 30, 2017. International Music Publishing revenues were $359 million and $314 million, or 55% of Music Publishing revenues for each of the fiscal years ended September 30, 2018 and September 30, 2017.
The overall increase in Music Publishing revenue was mainly driven by the increase in digital revenue as described in the “Total Revenues” and “Revenue by Geographical Location” sections above.
Cost of revenues
Music Publishing cost of revenues was composed of the following amounts (in millions):
| For the Fiscal Year Ended September 30, |
2019 vs. 2018 | 2018 vs. 2017 | ||||||||||||||||||||||||||
| 2019 | 2018 | 2017 | $ Change | % Change | $ Change | % Change | ||||||||||||||||||||||
| Artist and repertoire costs |
$ | 404 | $ | 425 | $ | 355 | $ | (21 | ) | -5 | % | $ | 70 | 20 | % | |||||||||||||
|
|
|
|
|
|
|
|
|
|
|
|||||||||||||||||||
| Total cost of revenues |
$ | 404 | $ | 425 | $ | 355 | $ | (21 | ) | -5 | % | $ | 70 | 20 | % | |||||||||||||
|
|
|
|
|
|
|
|
|
|
|
|||||||||||||||||||
2019 vs. 2018
Music Publishing cost of revenues decreased by $21 million, or 5%, to $404 million for the fiscal year ended September 30, 2019 from $425 million for the fiscal year ended September 30, 2018. Expressed as a percentage of Music Publishing revenue, Music Publishing cost of revenues decreased to 63% for the fiscal year ended September 30, 2019 from 65% for the fiscal year ended September 30, 2018, primarily due to the adoption of ASC 606, which resulted in a shift in the timing of recognition of revenues and certain related costs from a cash to an accrual basis.
2018 vs. 2017
Music Publishing cost of revenues increased by $70 million, or 20%, to $425 million for the fiscal year ended September 30, 2018 from $355 million for the fiscal year ended September 30, 2017 due to revenue mix
86
Table of Contents
and increased A&R investment costs. Expressed as a percentage of Music Publishing revenue, Music Publishing cost of revenues increased to 65% for the fiscal year ended September 30, 2018 from 62% for the fiscal year ended September 30, 2017.
Selling, general and administrative expense
Music Publishing selling, general and administrative expenses were comprised of the following amounts (in millions):
| For the Fiscal Year Ended September 30, |
2019 vs. 2018 | 2018 vs. 2017 | ||||||||||||||||||||||||||
| 2019 | 2018 | 2017 | $ Change | % Change | $ Change | % Change | ||||||||||||||||||||||
| General and administrative expense (1) |
$ | 76 | $ | 74 | $ | 69 | $ | 2 | 3 | % | $ | 5 | 7 | % | ||||||||||||||
| Selling and marketing expense |
2 | 2 | 2 | — | — | % | — | — | % | |||||||||||||||||||
|
|
|
|
|
|
|
|
|
|
|
|||||||||||||||||||
| Total selling, general and administrative expense |
$ | 78 | $ | 76 | $ | 71 | $ | 2 | 3 | % | $ | 5 | 7 | % | ||||||||||||||
|
|
|
|
|
|
|
|
|
|
|
|||||||||||||||||||
| (1) | Includes depreciation expense of $5 million, $7 million and $6 million for the fiscal year ended September 30, 2019, September 30, 2018 and September 30, 2017, respectively. |
2019 vs. 2018
Music Publishing selling, general and administrative expense increased by $2 million, or 3%, to $78 million for the fiscal year ended September 30, 2019 as compared to $76 million for the fiscal year ended September 30, 2018. The increase in general and administrative expense was primarily due to an increase in facilities costs. Expressed as a percentage of Music Publishing revenues, Music Publishing selling, general and administrative expense remained flat at 12% for each of the fiscal years ended September 30, 2019 and September 30, 2018.
2018 vs. 2017
Music Publishing selling, general and administrative expense increased by $5 million, or 7%, to $76 million for the fiscal year ended September 30, 2018 as compared to $71 million for the fiscal year ended September 30, 2017. The increase in general and administrative expense was due to an increase in compensation expense of $3 million and facilities costs of $2 million. Expressed as a percentage of Music Publishing revenues, Music Publishing selling, general and administrative expense remained flat at 12% for each of the fiscal years ended September 30, 2018 and September 30, 2017.
Operating income and OIBDA
Music Publishing OIBDA includes the following amounts (in millions):
| For the Fiscal Year Ended September 30, |
2019 vs. 2018 | 2018 vs. 2017 | ||||||||||||||||||||||||||
| 2019 | 2018 | 2017 | $ Change | % Change | $ Change | % Change | ||||||||||||||||||||||
| Operating income |
$ | 92 | $ | 84 | $ | 81 | $ | 8 | 10 | % | $ | 3 | 4 | % | ||||||||||||||
| Depreciation and amortization |
74 | 75 | 71 | (1 | ) | -1 | % | 4 | 6 | % | ||||||||||||||||||
|
|
|
|
|
|
|
|
|
|
|
|||||||||||||||||||
| OIBDA |
$ | 166 | $ | 159 | $ | 152 | $ | 7 | 4 | % | $ | 7 | 5 | % | ||||||||||||||
|
|
|
|
|
|
|
|
|
|
|
|||||||||||||||||||
2019 vs. 2018
Music Publishing OIBDA increased by $7 million, or 4%, to $166 million for the fiscal year ended September 30, 2019 from $159 million for the fiscal year ended September 30, 2018. Expressed as a percentage
87
Table of Contents
of Music Publishing revenues, Music Publishing OIBDA margin increased to 26% for the fiscal year ended September 30, 2019 from 24% for the fiscal year ended September 30, 2018. The increase was primarily due to $12 million from the adoption of ASC 606, which resulted in a shift in the timing of recognition of revenues and certain related costs from a cash to an accrual basis, partially offset by lower revenue and higher general and administrative expenses.
Music Publishing operating income increased by $8 million to $92 million for the fiscal year ended September 30, 2019 from $84 million for the fiscal year ended September 30, 2018 due to the factors that led to the increase in Music Publishing OIBDA noted above.
2018 vs. 2017
Music Publishing OIBDA increased by $7 million, or 5%, to $159 million for the fiscal year ended September 30, 2018 from $152 million for the fiscal year ended September 30, 2017 as a result of higher Music Publishing revenue, partially offset by higher artist and repertoire costs and higher general and administrative costs, as noted above. Expressed as a percentage of Music Publishing revenues, Music Publishing OIBDA margin decreased to 24% for the fiscal year ended September 30, 2018 from 27% for the fiscal year ended September 30, 2017.
Music Publishing operating income increased by $3 million to $84 million for the fiscal year ended September 30, 2018 from $81 million for the fiscal year ended September 30, 2017 due to the factors that led to the increase in Music Publishing OIBDA noted above.
Corporate Expenses and Eliminations
2019 vs. 2018
Our OIBDA loss from corporate expenses and eliminations increased by $3 million to $164 million for the fiscal year ended September 30, 2019 from $161 million for the fiscal year ended September 30, 2018, which includes higher corporate related costs, partially offset by a decrease of $15 million in variable compensation associated with the Senior Management Free Cash Flow Plan.
Our operating loss from corporate expenses and eliminations increased by $1 million to $175 million for the fiscal year ended September 30, 2019 from $174 million for the fiscal year ended September 30, 2018.
2018 vs. 2017
Our OIBDA loss from corporate expenses and eliminations increased by $31 million to $161 million for the fiscal year ended September 30, 2018 from $130 million for the fiscal year ended September 30, 2017 due to costs associated with our U.S. shared services and other transformation initiatives of $16 million, an increase in our annual Access management fee of $7 million, an increase in variable compensation expense of $5 million associated with the Senior Management Free Cash Flow Plan, which is associated with higher compensation costs on dividend payments in the 2018 fiscal year.
Our operating loss from corporate expenses and eliminations increased by $32 million to $174 million for the fiscal year ended September 30, 2018 from $142 million for the fiscal year ended September 30, 2017 due to the factors that led to the increase in operating loss noted above.
FINANCIAL CONDITION AND LIQUIDITY
Financial Condition at March 31, 2020
At March 31, 2020, we had $2.983 billion of debt (which is net of $25 million of deferred financing costs), $484 million of cash and equivalents (net debt of $2.499 billion, defined as total debt, less cash and equivalents
88
Table of Contents
and deferred financing costs) and $306 million of Warner Music Group Corp. deficit. This compares to $2.974 billion of debt (which is net of $29 million of deferred financing costs), $619 million of cash and equivalents (net debt of $2.355 billion) and $289 million of Warner Music Group Corp. deficit at September 30, 2019.
Cash Flows
The following table summarizes our historical cash flows (in millions). The financial data for the six months ended March 31, 2020 and March 31, 2019 are unaudited and have been derived from our interim financial statements included elsewhere herein. The financial data for fiscal years ended September 30, 2019, September 30, 2018 and September 30, 2017 have been derived from our audited financial statements included elsewhere herein.
| For the Six Months Ended March 31, | For the Fiscal Year Ended September 30, | |||||||||||||||||||
| 2020 | 2019 | 2019 | 2018 | 2017 | ||||||||||||||||
| Cash provided by (used in): |
||||||||||||||||||||
| Operating activities |
$ | 164 | $ | 99 | $ | 400 | $ | 425 | $ | 535 | ||||||||||
| Investing activities |
(51 | ) | (293 | ) | (376 | ) | 405 | (126 | ) | |||||||||||
| Financing activities |
(245 | ) | 151 | 88 | (955 | ) | (128 | ) | ||||||||||||
Operating Activities
Cash provided by operating activities was $164 million for the six months ended March 31, 2020 as compared with cash provided by operating activities of $99 million for the six months ended March 31, 2019. The $65 million increase in cash provided by operating activities was primarily due to timing of working capital partially offset by higher cash taxes.
Cash provided by operating activities was $400 million for the fiscal year ended September 30, 2019 compared to $425 million for the fiscal year ended September 30, 2018 and $535 million for the fiscal year ended September 30, 2017. The primary driver of the $25 million decrease in cash provided by operating activities during the current year was due to an increase in royalty advances and royalty payments, partially offset by an OIBDA increase of $147 million.
The decrease in results from operating activities for the fiscal year ended September 30, 2018 compared to the fiscal year ended September 30, 2017 reflected timing of royalty payments, partially offset by improved operating performance.
Investing Activities
Cash used in investing activities was $51 million for the six months ended March 31, 2020 as compared with cash used in investing activities of $293 million for the six months ended March 31, 2019. The $51 million of cash used in investing activities in the six months ended March 31, 2020 consisted of $5 million relating to investments, $28 million relating to capital expenditures and $18 million to acquire music publishing rights and recorded music catalogs. The $293 million of cash used in investing activities in the six months ended March 31, 2019 consisted of $183 million relating to the acquisition of EMP, net of cash and equivalents acquired, $35 million relating to the acquisition of equity investments, $59 million relating to capital expenditure and $16 million to acquire music publishing rights.
Cash used in investing activities was $376 million for the fiscal year ended September 30, 2019, compared to cash provided by investing activities of $405 million for the fiscal year ended September 30, 2018 and cash used in investing activities of $126 million for the fiscal year ended September 30, 2017.
Cash used in investing activities of $376 million for the fiscal year ended September 30, 2019 consisted of $183 million related to the acquisition of EMP, net of cash and equivalents acquired, $48 million relating to the
89
Table of Contents
acquisition of investments, $104 million relating to capital expenditures and $41 million to acquire music publishing rights and music catalogs.
Cash provided by investing activities of $405 million for the fiscal year ended September 30, 2018 consisted of $516 million of proceeds from sale of investments which includes the Spotify share sale of $504 million, partially offset by $74 million of capital expenditures, which has increased due to costs incurred related to the build-out of our new Los Angeles, California headquarters of $28 million, $23 million of investments and acquisitions and $14 million to acquire music publishing rights.
Cash used in investing activities of $126 million for the fiscal year ended September 30, 2017 consisted of $139 million of business investments and acquisitions, including the Spinnin’ Records acquisition in September 2017, $16 million to acquire music publishing rights and $44 million of capital expenditures, partially offset by $73 million of proceeds from divestitures.
Financing Activities
Cash used in financing activities was $245 million for the six months ended March 31, 2020 as compared with cash provided by financing activities of $151 million for the six months ended March 31, 2019. The $245 million of cash used in financing activities for the six months ended March 31, 2020 consisted of dividends paid of $244 million and distributions to noncontrolling interest holders of $1 million. The $151 million of cash provided by financing activities for the six months ended March 31, 2019 consisted of proceeds of $287 million from the issuance of Acquisition Corp.’s 3.625% Senior Secured Notes due 2026 partially offset by deferred financing costs paid of $4 million, the partial repayment of Acquisition Corp.’s 4.125% Senior Secured Notes due 2024, 4.875% Senior Secured Notes due 2024 and 5.625% Senior Secured Notes due 2022, including call premiums paid, in an aggregate amount of $99 million, dividends paid of $31 million and distributions to noncontrolling interest holders of $2 million.
Cash provided by financing activities was $88 million for the fiscal year ended September 30, 2019 compared to cash used in financing activities of $955 million for the fiscal year ended September 30, 2018 and $128 million for the fiscal year ended September 30, 2017.
The $88 million of cash provided by financing activities for the fiscal year ended September 30, 2019 consisted of proceeds of $514 million from the issuance of Acquisition Corp.’s 3.625% Secured Notes due 2026, partially offset by deferred financing costs paid of $7 million, the repayment of Acquisition Corp.’s 5.625% Secured Notes due 2022 of $247 million including call premiums paid of $5 million, partial repayment of Acquisition Corp.’s 4.125% Secured Notes due 2024 of $40 million and 4.875% Secured Notes due 2024 of $30 million, for an aggregate $185 million, cash dividends paid of $94 million and distributions to noncontrolling interest holders of $3 million.
The $955 million of cash used in financing activities for the fiscal year ended September 30, 2018 consisted of the repayment of and deposit for Acquisition Corp.’s 6.750% Senior Notes of $635 million, cash dividends paid of $925 million, call premiums paid on and redemption deposit for early redemption of $23 million, deferred financing costs paid of $12 million and a distribution to our non-controlling interest holders of $5 million, partially offset by proceeds from issuance of Acquisition Corp.’s Senior Notes (as defined below) of $325 million and proceeds from the issuance of Acquisition Corp.’s Senior Term Loan Facility of $320 million.
The $128 million of cash used in financing activities for the fiscal year ended September 30, 2017 consisted of the repayment of Acquisition Corp.’s 6.000% Senior Secured Notes due 2021 of $450 million, repayment of Acquisition Corp.’s 6.250% Senior Secured Notes due 2021 of $173 million, repayment of Acquisition Corp.’s 5.625% Secured Notes of $28 million, call premiums paid on early redemption of $27 million, deferred financing costs paid of $13 million, cash dividends paid of $84 million and a distribution to our non-controlling interest holders of $5 million, partially offset by proceeds from issuance of Acquisition Corp.’s 4.125% Secured Notes of
90
Table of Contents
€345 million, proceeds from issuance of Acquisition Corp.’s 4.875% Secured Notes of $250 million and proceeds from the amendment of Acquisition Corp.’s Senior Term Loan Facility of $22 million.
There were no drawdowns on the Revolving Credit Facility during the fiscal years ended September 30, 2019, September 30, 2018 and September 30, 2017.
Liquidity
Our primary sources of liquidity are the cash flows generated from our subsidiaries’ operations, available cash and equivalents and funds available for drawing under our Revolving Credit Facility. These sources of liquidity are needed to fund our debt service requirements, working capital requirements, capital expenditure requirements, strategic acquisitions and investments, and any dividends, prepayments of debt or repurchases or retirement of our outstanding debt or notes in open market purchases, privately negotiated purchases or otherwise, we may elect to pay or make in the future. Certain of our executive officers participate in the Plan, which permits those executive officers to defer all or a portion of their free cash flow bonuses and receive grants of indirect equity interests in the Company. Payments under the Plan, which could be material, are influenced by the Company’s valuation and other market factors, including valuations of similar companies. In connection with preparing for the this offering, we amended the Plan to provide that, following completion of the offering, Plan participants would no longer have the option to settle deferred accounts in cash or to be paid in cash for redemption of their vested interests in Management LLC. Instead, following the offering, all deferred interests under the Plan would be settled in or redeemed with shares of our common stock.
We believe that our existing sources of cash will be sufficient to support our existing operations over the next twelve months.
In August 2019, we announced that we were beginning a financial transformation initiative to upgrade our information technology and finance infrastructure over the next two years, including related systems and processes, for which we currently expect upfront costs to be approximately $120 million, which includes capital expenditures of approximately $40 million to $50 million (approximately half of which is expected to be incurred in the 2020 fiscal year and the remainder of which is expected to be incurred in the 2021 fiscal year). There has been a slight delay in the timing of the transformation initiative as a result of COVID-19 but it is still expected to be completed over the next two years. Annualized run-rate savings from the financial transformation initiative are expected to be between approximately $35 million and $40 million once fully implemented. We expect that our primary sources of liquidity will be sufficient to fund these expenditures.
Debt Financing
Since Access acquired us in 2011, we have sought to extend the maturity dates on our outstanding indebtedness, reduce interest expense and improve our debt ratings. For example, our S&P corporate credit rating has improved from B in 2017 to BB- in 2019. On February 20, 2020, S&P upgraded the outlook on our corporate credit rating from stable to positive. Our Moody’s corporate family rating has improved from B1 in 2016 to Ba3 in 2020. In addition, our weighted-average interest rate on our outstanding indebtedness has decreased from 10.5% in 2011 to 4.3% in 2019. Our nearest-term maturity date is in 2023. Subject to market conditions, we expect to continue to take opportunistic steps to extend our maturity dates and reduce related interest expense. From time to time, we may incur additional indebtedness for, among other things, working capital, repurchasing, redeeming or tendering for existing indebtedness and acquisitions or other strategic transactions.
Revolving Credit Facility
On January 31, 2018, Acquisition Corp. entered into the Revolving Credit Agreement for a senior secured revolving credit facility with Credit Suisse AG, as administrative agent, and the other financial institutions and lenders from time to time party thereto (as amended by the amendment dated October 9, 2019 and as further
91
Table of Contents
amended, amended and restated or otherwise modified from time to time, the “Revolving Credit Facility”). On April 3, 2020, Acquisition Corp. entered into an amendment to the Revolving Credit Agreement (the “Second Amendment”) which, among other things, extended the final maturity of the Revolving Credit Facility from January 31, 2023 to April 3, 2025. For a more detailed description of the changes effected by the Second Amendment, see Note 14 to our unaudited interim consolidated financial statements included elsewhere in this prospectus.
Acquisition Corp. is the borrower (the “Revolving Borrower”) under the Revolving Credit Agreement which provides for a revolving credit facility in the amount of up to $300 million (the “Commitments”) and includes a $90 million letter of credit sub-facility. Amounts are available under the Revolving Credit Facility in U.S. dollars, euros or pounds sterling. The Revolving Credit Agreement permits loans for general corporate purposes and may also be utilized to issue letters of credit. Borrowings under the Revolving Credit Agreement bear interest at the Revolving Borrower’s election at a rate equal to (i) the rate for deposits in the borrowing currency in the London interbank market (adjusted for maximum reserves) for the applicable interest period (“Revolving LIBOR”) plus 1.875% per annum, or (ii) the base rate, which is the highest of (x) the corporate base rate established by the administrative agent from time to time, (y) the overnight federal funds rate plus 0.5% and (z) the one-month Revolving LIBOR plus 1.00% per annum, plus, in each case, 0.875% per annum; provided that, for each of clauses (i) and (ii), the applicable margin with respect to such loans is subject to adjustment upon achievement of certain leverage ratios as set forth in a leverage-based pricing grid in the Revolving Credit Agreement. Based on the Senior Secured Indebtedness to EBITDA Ratio of 3.22x at March 31, 2020, the applicable margin for Eurodollar loans would be 1.625% instead of 1.875% and the applicable margin for ABR loans would be 0.625% instead of 0.875% in the case of 2020 Revolving Loans.
Prepayments
If, at any time, the aggregate amount of outstanding loans (including letters of credit outstanding thereunder) exceeds the commitments under the Revolving Credit Facility, prepayments of the loans (and after giving effect to such prepayment the cash collateralization of letters of credit) will be required in an amount equal to such excess. The application of proceeds from mandatory prepayments shall not reduce the aggregate amount of then effective commitments under the Revolving Credit Facility and amounts prepaid may be reborrowed, subject to then effective commitments under the Revolving Credit Facility.
Voluntary reductions of the unutilized portion of the Commitments under the Revolving Credit Facility are permitted at any time in certain minimum principal amounts, without premium or penalty. Voluntary prepayments of borrowings under the Revolving Credit Facility are permitted at any time in certain minimum principal amounts, subject to reimbursement of the lenders’ redeployment costs actually incurred in the case of a prepayment of LIBOR-based borrowings other than on the last day of the relevant interest period.
Senior Term Loan Facility
Acquisition Corp. is party to a $1.326 billion senior secured term loan credit facility, pursuant to the Senior Term Loan Credit Agreement with Credit Suisse AG, as administrative agent and collateral agent, and the other financial institutions and lenders from time to time party thereto (as described below, the “Senior Term Loan Facility”).
General
Acquisition Corp. is the borrower under the Senior Term Loan Facility (the “Term Loan Borrower”). The loans outstanding under the Senior Term Loan Facility mature on November 1, 2023.
In addition, the Senior Term Loan Credit Agreement provides the right for individual lenders to extend the maturity date of their loans upon the request of the Term Loan Borrower and without the consent of any other lender.
92
Table of Contents
Subject to certain conditions, without the consent of the then existing lenders (but subject to the receipt of commitments), the Senior Term Loan Facility may be expanded (or a new term loan facility entered into) by up to the greater of (i) $300 million and (ii) such additional amount as would not cause the net senior secured leverage ratio, after giving effect to the incurrence of such additional amount and any use of proceeds thereof, to exceed 4.50:1.00.
Interest Rates and Fees
Term loan borrowings under the Senior Term Loan Credit Agreement bear interest at a floating rate measured by reference to, at Acquisition Corp.’s option, either (i) an adjusted London inter-bank offered rate, LIBOR, not less than 0.00% per annum plus a borrowing margin of 2.125% per annum or (ii) an alternative base rate plus a borrowing margin of 1.125% per annum.
Prepayments
The Senior Term Loan Facility is subject to mandatory prepayment and reduction in an amount equal to (a) 50% of excess cash flow (as defined in the Senior Term Loan Credit Agreement), with reductions to 25% and zero based upon achievement of a net senior secured leverage ratio of less than or equal to 4.50:1.00 or 4.00:1.00, respectively, (b) 100% of the net cash proceeds received from the incurrence of indebtedness by the Term Loan Borrower or any of its restricted subsidiaries (other than indebtedness permitted under the Senior Term Loan Facility) and (c) 100% of the net cash proceeds of all non-ordinary course asset sales or other dispositions of property by the Term Loan Borrower and its restricted subsidiaries (including certain insurance and condemnation proceeds) in excess of $75 million and subject to the right of the Term Loan Borrower and its restricted subsidiaries to reinvest such proceeds within a specified period of time, and other exceptions. Voluntary prepayments of borrowings under the Senior Term Loan Facility are permitted at any time, in minimum principal amounts of $1 million or a whole multiple of $500,000 in excess thereof, subject to reimbursement of the lenders’ redeployment costs actually incurred in the case of a prepayment of adjusted LIBOR borrowings other than on the last day of the relevant interest period.
Secured Notes
General
On July 27, 2016, Acquisition Corp. issued $300 million in aggregate principal amount of its 5.000% Secured Notes under the Senior Secured Base Indenture, as supplemented by the 5.000% Supplemental Indenture. On October 18, 2016, Acquisition Corp. issued $250 million in aggregate principal amount of its 4.875% Secured Notes and €345 million in aggregate principal amount of its 4.125% Secured Notes under the Senior Secured Base Indenture, as supplemented by (i) in the case of the 4.875% Secured Notes, the 4.875% Supplemental Indenture and (ii) in the case of the 4.125% Notes, the 4.125% Supplemental Indenture”. On October 9, 2018, Acquisition Corp. issued €250 million in aggregate principal amount of its 3.625% Secured Notes under the Senior Secured Base Indenture, as supplemented by the 3.625% Supplemental Indenture. On April 30, 2019, Acquisition Corp. issued €195 million in aggregate principal amount of additional 3.625% Secured Notes under the Senior Secured Base Indenture, as supplemented by the Additional 3.625% Supplemental Indenture.
Optional Redemption
5.000% Secured Notes
On or after August 1, 2019, Acquisition Corp. may redeem all or a portion of the 5.000% Secured Notes, at its option, at the redemption prices (expressed as percentages of principal amount) set forth below plus accrued
93
Table of Contents
and unpaid interest thereon, if any, on the 5.000% Secured Notes to be redeemed to the applicable redemption date, if redeemed during the twelve-month period beginning on August 1 of the years indicated below:
| Year |
Percentage | |||
| 2019 |
102.500 | % | ||
| 2020 |
101.250 | % | ||
| 2021 and thereafter |
100.000 | % | ||
4.875% Secured Notes
On or after November 1, 2019, Acquisition Corp. may redeem all or a portion of the 4.875% Secured Notes, at its option, at the redemption prices (expressed as percentages of principal amount) set forth below plus accrued and unpaid interest thereon, if any, on the 4.875% Secured Notes to be redeemed to the applicable redemption date, if redeemed during the twelve-month period beginning on November 1 of the years indicated below:
| Year |
Percentage | |||
| 2019 |
103.656 | % | ||
| 2020 |
102.438 | % | ||
| 2021 |
101.219 | % | ||
| 2022 and thereafter |
100.000 | % | ||
4.125% Secured Notes
On or after November 1, 2019, Acquisition Corp. may redeem all or a portion of the 4.125% Secured Notes, at its option, at the redemption prices (expressed as percentages of principal amount) set forth below plus accrued and unpaid interest thereon, if any, on the 4.125% Secured Notes to be redeemed to the applicable redemption date, if redeemed during the twelve-month period beginning on November 1 of the years indicated below:
| Year |
Percentage | |||
| 2019 |
103.094 | % | ||
| 2020 |
102.063 | % | ||
| 2021 |
101.031 | % | ||
| 2022 and thereafter |
100.000 | % | ||
3.625% Secured Notes
At any time prior to October 15, 2021, Acquisition Corp. may on any one or more occasions redeem up to 40% of the aggregate principal amount of the 3.625% Secured Notes (including the aggregate principal amount of any additional securities constituting 3.625% Secured Notes) issued under the Secured Notes Indenture, at its option, at a redemption price equal to 103.625% of the principal amount of the 3.625% Secured Notes redeemed, plus accrued and unpaid interest thereon, if any, to the date of redemption (subject to the rights of holders of Notes on the relevant record date to receive interest on the relevant interest payment date), with funds in an aggregate amount not exceeding the net cash proceeds of one or more equity offerings by Acquisition Corp. or any contribution to Acquisition Corp.’s common equity capital made with the net cash proceeds of one or more equity offerings by Acquisition Corp.’s direct or indirect parent; provided that:
(1) at least 50% of the aggregate principal amount of the 3.625% Secured Notes originally issued under the Secured Notes Indenture (including the aggregate principal amount of any additional securities constituting 3.625% Secured Notes issued under the Secured Notes Indenture) remains outstanding immediately after the occurrence of such redemption; and
(2) the redemption occurs within 180 days of the date of, and may be conditioned upon, the closing of such equity offering.
94
Table of Contents
The 3.625% Secured Notes may be redeemed, in whole or in part, at any time prior to October 15, 2021, at the option of Acquisition Corp., at a redemption price equal to 100% of the principal amount of the 3.625% Secured Notes redeemed plus the applicable make-whole premium as of, and accrued and unpaid interest thereon, if any, to the applicable redemption date (subject to the right of holders of record on the relevant record date to receive interest due on the relevant interest payment date).
On or after October 15, 2021, Acquisition Corp. may redeem all or a portion of the 3.625% Secured Notes, at its option, at the redemption prices (expressed as percentages of principal amount) set forth below plus accrued and unpaid interest thereon, if any, on the 3.625% Secured Notes to be redeemed to the applicable redemption date, if redeemed during the twelve-month period beginning on October 15 of the years indicated below:
| Year |
Percentage | |||
| 2021 |
101.813 | % | ||
| 2022 |
100.906 | % | ||
| 2023 and thereafter |
100.000 | % | ||
In addition, during any twelve-month period prior to October 15, 2021, Acquisition Corp. will be entitled to redeem up to 10% of the original aggregate principal amount of the 3.625% Secured Notes (including the principal amount of any additional securities of the same series) at a redemption price equal to 103.000% of the aggregate principal amount thereof, plus accrued and unpaid interest thereon, if any, to the redemption date (subject to the right of holders of record on the relevant record date to receive interest due on the relevant interest payment date).
Senior Notes
General
On March 14, 2018, Acquisition Corp. issued $325 million in aggregate principal amount of 5.500% Senior Notes due 2026 under the Senior Notes Base Indenture, as supplemented by the Senior Notes Supplemental Indenture.
Optional Redemption
At any time prior to April 15, 2021, Acquisition Corp. may on any one or more occasions redeem up to 40% of the aggregate principal amount of the Senior Notes (including the aggregate principal amount of any additional securities constituting the same series) issued under the Senior Notes Indenture, at its option, at a redemption price equal to 105.500% of the principal amount of the Senior Notes redeemed, plus accrued and unpaid interest thereon, if any, to the date of redemption (subject to the rights of holders of the Senior Notes on the relevant record date to receive interest on the relevant interest payment date), with funds in an aggregate amount not exceeding the net cash proceeds of one or more equity offerings by Acquisition Corp. or any contribution to Acquisition Corp.’s common equity capital made with the net cash proceeds of one or more equity offerings by Acquisition Corp.’s direct or indirect parent; provided that: (1) at least 50% of the aggregate principal amount of the Senior Notes originally issued under the Senior Notes Indenture (including the aggregate principal amount of any additional securities constituting the Senior Notes issued under the Senior Notes Indenture) remains outstanding immediately after the occurrence of such redemption; and (2) the redemption occurs within 180 days of the date of, and may be conditioned upon, the closing of such equity offering.
The Senior Notes may be redeemed, in whole or in part, at any time prior to April 15, 2021, at the option of Acquisition Corp., at a redemption price equal to 100% of the principal amount of the Senior Notes redeemed plus the applicable make-whole premium as of, and accrued and unpaid interest thereon, if any, to the applicable redemption date (subject to the right of holders of record on the relevant record date to receive interest due on the relevant interest payment date).
95
Table of Contents
On or after April 15, 2021, Acquisition Corp. may redeem all or a portion of the Senior Notes, at its option, at the redemption prices (expressed as percentages of principal amount) set forth below plus accrued and unpaid interest thereon, if any, on the Senior Notes to be redeemed to the applicable redemption date, if redeemed during the twelve-month period beginning on April 15 of the years indicated below:
| Year |
Percentage | |||
| 2021 |
102.750 | % | ||
| 2022 |
101.375 | % | ||
| 2023 and thereafter |
100.000 | % | ||
General Terms of Our Indebtedness
Certain terms of the Senior Credit Facilities and certain terms of each series of notes under our Secured Notes Indenture and Senior Notes Indenture are described below.
Ranking
The indebtedness incurred pursuant to the Revolving Credit Facility and the Senior Term Loan Facility and the Secured Notes are Acquisition Corp.’s senior secured obligations and are secured on an equal and ratable basis with all existing and future indebtedness secured with the same security arrangements. The Secured Notes rank senior in right of payment to Acquisition Corp.’s subordinated indebtedness; rank equally in right of payment with all of Acquisition Corp.’s existing and future senior indebtedness and any future senior secured credit facility; are effectively senior to Acquisition Corp.’s unsecured senior indebtedness, including the Senior Notes, to the extent of the value of the collateral securing the senior secured obligations; and are structurally subordinated in right of payment to all existing and future indebtedness and other liabilities of any of Acquisition Corp.’s non-guarantor subsidiaries (other than indebtedness and liabilities owed to Acquisition Corp. or one of its subsidiary guarantors (as such term is defined below)).
The Senior Notes are Acquisition Corp.’s senior unsecured obligations. The Senior Notes rank senior in right of payment to Acquisition Corp.’s subordinated indebtedness; rank equally in right of payment with all of Acquisition Corp.’s existing and future senior indebtedness; are effectively subordinated to Acquisition Corp.’s secured senior indebtedness, to the extent of the value of the collateral securing such indebtedness; and are structurally subordinated in right of payment to all existing and future indebtedness and other liabilities of any of Acquisition Corp.’s non-guarantor subsidiaries (other than indebtedness and liabilities owed to Acquisition Corp. or one of its subsidiary guarantors).
Guarantees and Security
The obligations under each of the Revolving Credit Facility, the Senior Term Loan Facility, the Secured Notes Indenture and the Senior Notes Indenture are guaranteed by each direct and indirect U.S. restricted subsidiary of Acquisition Corp., other than certain excluded subsidiaries. All obligations of Acquisition Corp. and each guarantor under the Revolving Credit Facility, the Senior Term Loan Facility and the Secured Notes Indenture are secured by substantially all the assets of Acquisition Corp and each subsidiary guarantor. In addition, each series of notes issued pursuant to the Secured Notes Indenture and the Senior Notes Indenture have been fully and unconditionally guaranteed by the Company.
Covenants, Representations and Warranties
The Revolving Credit Facility, the Senior Term Loan Facility, the Secured Notes and the Senior Notes contain customary representations and warranties and customary affirmative and negative covenants. The negative covenants are incurrence-based high yield covenants and limit the ability of Acquisition Corp. and its restricted subsidiaries to incur additional indebtedness or issue certain preferred shares; pay dividends, redeem
96
Table of Contents
stock or make other distributions; repurchase, prepay or redeem subordinated indebtedness; make investments; create restrictions on the ability of its restricted subsidiaries to pay dividends to it or make other intercompany transfers; create liens; transfer or sell assets; consolidate, merge, sell or otherwise dispose of all or substantially all of its assets; enter into certain transactions with its affiliates; and designate subsidiaries as unrestricted subsidiaries.
The negative covenants are subject to customary exceptions. There are no financial covenants included in the Revolving Credit Agreement, other than a springing leverage ratio of 4.75:1.00 (with no step-down), which is not tested unless at the end of a fiscal quarter the outstanding amount of loans and drawings under letters of credit which have not been reimbursed exceeds $54,000,000. There are no financial covenants included in the Senior Term Loan Credit Agreement, the Secured Notes Indenture or the Senior Notes Indenture.
Events of Default
Events of default under the Revolving Credit Facility, the Senior Term Loan Facility and the Secured Notes Indenture include nonpayment of principal when due, nonpayment of interest or other amounts, inaccuracy of representations or warranties in any material respect, violation of covenants, cross default and cross acceleration to other material debt, certain bankruptcy or insolvency events, certain ERISA events, certain material judgments, actual or asserted invalidity of security interests in excess of $50 million, in each case subject to customary thresholds, notice and grace period provisions.
Change of Control
Upon the occurrence of a change of control, which is defined in the Secured Notes Base Indenture and the Senior Notes Base Indenture, each holder of the Secured Notes and the Senior Notes has the right to require Acquisition Corp. to repurchase some or all of such holder’s Secured Notes and Senior Notes at a purchase price in cash equal to 101% of the principal amount thereof, plus accrued and unpaid interest, if any, to the repurchase date.
Existing Debt as of March 31, 2020
As of March 31, 2020, our long-term debt, all of which was issued by Acquisition Corp., was as follows (in millions):
| Revolving Credit Facility (a) |
$ | — | ||
| Senior Term Loan Facility due 2023 (b) |
1,315 | |||
| 5.000% Senior Secured Notes due 2023 (c) |
298 | |||
| 4.125% Senior Secured Notes due 2024 (d) |
339 | |||
| 4.875% Senior Secured Notes due 2024 (e) |
218 | |||
| 3.625% Senior Secured Notes due 2026 (f) |
492 | |||
| 5.500% Senior Notes due 2026 (g) |
321 | |||
| Total long-term debt, including the current portion (h) |
$ | 2,983 |
| (a) | Reflects $180 million of commitments under the Revolving Credit Facility available at March 31, 2020, less letters of credit outstanding of approximately $13 million at March 31, 2020. There were no loans outstanding under the Revolving Credit Facility at March 31, 2020. On April 3, 2020, Acquisition Corp. entered into an amendment to the Revolving Credit Facility which, among other things, increased the commitments under the Revolving Credit Facility from an aggregate principal amount of $180 million to an aggregate principal amount of $300 million. For a more detailed description of the changes effected by the amendment, see Note 14 to our unaudited interim consolidated financial statements included elsewhere in this prospectus. |
| (b) | Principal amount of $1.326 billion less unamortized discount of $3 million and unamortized deferred financing costs of $8 million at March 31, 2020. |
97
Table of Contents
| (c) | Principal amount of $300 million less unamortized deferred financing costs of $2 million at March 31, 2020. |
| (d) | Face amount of €311 million. Above amount represents the dollar equivalent of such note at March 31, 2020. Principal amount of $342 million less unamortized deferred financing costs of $3 million at March 31, 2020. |
| (e) | Principal amount of $220 million less unamortized deferred financing costs of $2 million at March 31, 2020. |
| (f) | Face amount of €445 million at March 31, 2020. Above amount represents the dollar equivalent of such note at March 31, 2020. Principal amount of $491 million, an additional issuance premium of $7 million, less unamortized deferred financing costs of $6 million at March 31, 2020. |
| (g) | Principal amount of $325 million less unamortized deferred financing costs of $4 million at March 31, 2020. |
| (h) | Principal amount of debt of $3.004 billion, an additional issuance premium of $7 million, less unamortized discount of $3 million and unamortized deferred financing costs of $25 million at March 31, 2020. |
Dividends
The Company’s ability to pay dividends is restricted by covenants in the indentures governing its notes and in the credit agreements for the Senior Term Loan Facility and the Revolving Credit Facility.
On March 25, 2020, the Company’s board of directors declared a cash dividend of $37.5 million which was paid to stockholders on April 17, 2020 and recorded as an accrual as of March 31, 2020. On December 16, 2019, the Company’s board of directors declared a cash dividend of $37.5 million which was paid to stockholders on January 17, 2020. On September 23, 2019, the Company’s board of directors declared a cash dividend of $206.25 million which was paid to stockholders on October 4, 2019. For fiscal year 2019, the Company paid an aggregate of $93.75 million in cash dividends to stockholders. For fiscal year 2018, the Company paid an aggregate of $925 million in cash dividends to stockholders, which reflected proceeds from the sale of Spotify shares acquired in the ordinary course of business. For fiscal year 2017, the Company paid an aggregate of $84 million in cash dividends to stockholders. See “Dividend Policy.”
Covenant Compliance
The Company was in compliance with its covenants under its outstanding notes, the Revolving Credit Facility and the Senior Term Loan Facility as of March 31, 2020. With respect to the Revolving Credit Facility, the discussion below reflects the covenants in effect under the Second Amendment, dated as of April 3, 2020.
On January 18, 2019, we delivered a notice to the administrative agent under the Senior Term Loan Facility and the trustee under the indentures governing each of the Senior Notes and the Secured Notes changing the Fixed GAAP Date, as defined under each such facility and the indentures, to October 1, 2018. Under the Revolving Credit Facility, the Fixed GAAP Date is set for April 3, 2020, other than in respect of capital leases, which are frozen at November 1, 2012.
The Revolving Credit Facility contains a springing leverage ratio that is tied to a ratio based on EBITDA, which is defined under the Revolving Credit Agreement. Our ability to borrow funds under the Revolving Credit Facility may depend upon our ability to meet the leverage ratio test at the end of a fiscal quarter to the extent we have drawn a certain amount of revolving loans. The indentures governing our notes and the Senior Term Loan Facility use financial measures called “Consolidated EBITDA” or “EBITDA,” respectively, that are substantially similar (but not identical) to EBITDA as defined under the Revolving Credit Agreement. Adjusted EBITDA, a key measure used by our management to understand and evaluate our operating performance, generate future operating plans and make strategic decisions regarding allocation of capital, is equivalent to “EBITDA” as defined in our Revolving Credit Facility, and we refer to “Adjusted EBITDA” in the disclosure below. See “Summary Historical Consolidated Financial Data.”
Adjusted EBITDA is a material component of the leverage ratio contained in the Revolving Credit Agreement. Non-compliance with the leverage ratio could result in the inability to use the Revolving Credit Facility, which could have a material adverse effect on our results of operations, financial position and cash flow.
98
Table of Contents
Adjusted EBITDA as presented is not a measure of the performance of our business and should not be used by investors as an indicator of performance for any future period. Further, our debt instruments require that it be calculated for the most recent four fiscal quarters. As a result, the measure can be disproportionately affected by a particularly strong or weak quarter. Further, it may not be comparable to the measure for any subsequent four-quarter period or any complete fiscal year. In addition, our debt instruments require that the leverage ratio be calculated on a pro forma basis for certain transactions including acquisitions as if such transactions had occurred on the first date of the measurement period and may include expected cost savings and synergies resulting from or related to any such transaction. There can be no assurances that any such cost savings or synergies will be achieved in full.
| Twelve Months Ended March 31, 2020 |
||||
| (in millions, except ratio) | ||||
| Adjusted EBITDA |
$ | 755 | ||
|
|
|
|||
| Senior Secured Indebtedness (a) |
$ | 2,428 | ||
|
|
|
|||
| Leverage Ratio (b) |
3.22x | |||
| (a) | Reflects the principal balance of senior secured debt at Acquisition Corp. of approximately $2.678 billion less cash of $250 million. |
| (b) | Reflects the ratio of Senior Secured Indebtedness, including Revolving Credit Agreement Indebtedness, to Adjusted EBITDA as of the twelve months ended March 31, 2020. This is calculated net of cash and equivalents of the Company as of March 31, 2020 not exceeding $250 million. If the outstanding aggregate principal amount of borrowings and drawings under letters of credit which have not been reimbursed under the Revolving Credit Facility is greater than $105 million at the end of a fiscal quarter, the maximum leverage ratio permitted under the Revolving Credit Facility is 5.00:1.00. The Company’s Revolving Credit Facility does not impose any “leverage ratio” restrictions on the Company when the aggregate principal amount of borrowings and drawings under letters of credit, which have not been reimbursed under the Revolving Credit Facility, is less than or equal to $105 million at the end of a fiscal quarter. |
Summary
Management believes that funds generated from our operations and borrowings under the Revolving Credit Facility and available cash and equivalents will be sufficient to fund our debt service requirements, working capital requirements and capital expenditure requirements for the foreseeable future. We also have additional borrowing capacity under our indentures and the Senior Term Loan Facility. However, our ability to continue to fund these items and to reduce debt may be affected by general economic, financial, competitive, legislative and regulatory factors, as well as other industry-specific factors such as the ability to control music piracy and the continued transition from physical to digital formats in the recorded music and music publishing industries. It could also be affected by the severity and duration of natural or man-made disasters, including pandemics such as COVID-19. We and our affiliates continue to evaluate opportunities to, from time to time, depending on market conditions and prices, contractual restrictions, our financial liquidity and other factors, seek to pay dividends or prepay outstanding debt or repurchase or retire Acquisition Corp.’s outstanding debt or debt securities in open market purchases, privately negotiated purchases or otherwise. The amounts involved in any such transactions, individually or in the aggregate, may be material and may be funded from available cash or from additional borrowings. In addition, from time to time, depending on market conditions and prices, contractual restrictions, our financial liquidity and other factors, we may seek to refinance the Senior Credit Facilities or our outstanding debt or debt securities with existing cash and/or with funds provided from additional borrowings. Certain of our executive officers participate in the Plan, which permits those executive officers to defer all or a portion of their free cash flow bonuses and receive grants of indirect equity interests in the Company. Payments under the Plan, which could be material, are influenced by the Company’s valuation and other market factors, including the price of our common stock.
99
Table of Contents
Contractual and Other Obligations
Firm Commitments
The following table summarizes the Company’s aggregate contractual obligations at September 30, 2019, and the estimated timing and effect that such obligations are expected to have on the Company’s liquidity and cash flow in future periods.
| Firm Commitments and Outstanding Debt |
Less than 1 year |
1-3 years |
3-5 years |
After 5 years |
Total | |||||||||||||||
| (in millions) | ||||||||||||||||||||
| Senior Secured Notes (1) |
$ | — | $ | — | $ | 300 | $ | 1,047 | $ | 1,347 | ||||||||||
| Interest on Senior Secured Notes (1) |
57 | 115 | 100 | 56 | 328 | |||||||||||||||
| Senior Notes (1) |
— | — | — | 325 | 325 | |||||||||||||||
| Interest on Senior Notes (1) |
18 | 36 | 36 | 36 | 126 | |||||||||||||||
| Senior Term Loan Facility (1) |
— | — | 1,326 | — | 1,326 | |||||||||||||||
| Interest on Senior Term Loan Facility (1) |
52 | 100 | 55 | — | 207 | |||||||||||||||
| Operating leases (2) |
52 | 97 | 92 | 207 | 448 | |||||||||||||||
| Artist, songwriter and co-publisher commitments (3) |
428 | * | * | * | 428 | |||||||||||||||
| Management Fees (4) |
11 | 18 | 18 | ** | 47 | |||||||||||||||
| Minimum funding commitments to investees and other obligations (5) |
7 | 3 | — | — | 10 | |||||||||||||||
|
|
|
|
|
|
|
|
|
|
|
|||||||||||
| Total firm commitments and outstanding debt |
$ | 625 | $ | 369 | $ | 1,927 | $ | 1,671 | $ | 4,592 | ||||||||||
|
|
|
|
|
|
|
|
|
|
|
|||||||||||
The following is a description of our firmly committed contractual obligations at September 30, 2019:
| (1) | Outstanding debt obligations consist of the Senior Term Loan Facility, the Senior Secured Notes and the Senior Notes. These obligations have been presented based on the principal amounts due, current and long term as of September 30, 2019. Amounts do not include any fair value adjustments, bond premiums, discounts or unamortized deferred financing costs. |
| (2) | Operating lease obligations primarily relate to the minimum lease rental obligations for our real estate and operating equipment in various locations around the world. These obligations have been presented without the benefit of $1 million of total sublease income expected to be received under non-cancelable agreements. |
| (3) | The Company routinely enters into long-term commitments with recording artists, songwriters and publishers for the future delivery of music. Such commitments generally become due only upon delivery and Company acceptance of albums from the artists or future musical compositions by songwriters and publishers. Additionally, such commitments are typically cancelable at the Company’s discretion, generally without penalty. Based on contractual obligations, aggregate firm commitments to such talent approximate $428 million at September 30, 2019. The aggregate firm commitments expected for the next twelve-month period based on contractual obligations and the Company’s expected release schedule approximates $229 million at September 30, 2019. |
| (4) | Pursuant to the Management Agreement, the Company is required to pay Access an annual fee equal to the greater of (i) a base amount, which is the sum of (x) $6 million and (y) 1.5% of the aggregate amount of Acquired EBITDA (as defined in the Management Agreement) and was approximately $9 million for the fiscal year ended September 30, 2019, and (ii) 1.5% of the EBITDA (as defined in the indenture governing the redeemed WMG Holdings Corp. 13.75% Senior Notes due 2019) of the Company for the applicable fiscal year, plus expenses, as well as certain other fees specified in the Management Agreement. The future balances disclosed are representative of the base amount of the annual fee only. The Management Agreement will terminate in accordance with its terms upon consummation of this offering, and the Company will pay all fees and expenses due and payable thereunder following such termination in accordance with the terms of the Management Agreement, including a termination fee and a fee for transaction services in an estimated aggregate amount of approximately $60 million. See “Certain Relationships and Related Party Transactions—Transactions with Access Affiliates—Management Agreement.” |
100
Table of Contents
| (5) | We have minimum funding commitments and other related obligations to support the operations of various investments, which are reflected in the table above. Other long-term liabilities include $12 million and $15 million of liabilities for uncertain tax positions as of September 30, 2019 and September 30, 2018, respectively. We are unable to accurately predict when these amounts will be realized or released. |
| * | Because the timing of payment, and even whether payment occurs, is dependent upon the timing of delivery of albums and musical compositions, the timing and amount of payment of these commitments as presented in the above summary can vary significantly. |
| ** | Per the above explanation, the minimum annual fee would have been approximately $9 million per year. As disclosed in note (4) above, the Management Agreement will terminate in accordance with its terms upon consummation of this offering. |
CRITICAL ACCOUNTING POLICIES
The SEC’s Financial Reporting Release No. 60, “Cautionary Advice Regarding Disclosure About Critical Accounting Policies” (“FRR 60”), suggests companies provide additional disclosure and commentary on those accounting policies considered most critical. FRR 60 considers an accounting policy to be critical if it is important to our financial condition and results, and requires significant judgment and estimates on the part of management in our application. We believe the following list represents critical accounting policies as contemplated by FRR 60. For a summary of all of our significant accounting policies, see Note 2 to our audited Consolidated Financial Statements included elsewhere herein.
Business Combinations
We account for our business acquisitions under the FASB ASC Topic 805, Business Combinations (“ASC 805”) guidance for business combinations. The total cost of acquisitions is allocated to the underlying identifiable net assets based on their respective estimated fair values. The excess of the purchase price over the estimated fair values of the net assets acquired is recorded as goodwill. Determining the fair value of assets acquired and liabilities assumed requires management’s judgment and often involves the use of significant estimates and assumptions, including assumptions with respect to future cash inflows and outflows, discount rates, asset lives and market multiples, among other items. If our assumptions or estimates in the fair value calculation change, the fair value of our acquired intangible assets could change; this would also change the value of our goodwill.
Accounting for Goodwill and Other Intangible Assets
We account for our goodwill and other indefinite-lived intangible assets as required by FASB ASC Topic 350, Intangibles—Goodwill and Other (“ASC 350”). Under ASC 350, we do not amortize goodwill, including the goodwill included in the carrying value of investments accounted for using the equity method of accounting, and certain other intangible assets deemed to have an indefinite useful life. ASC 350 requires that goodwill and certain intangible assets be assessed for impairment using fair value measurement techniques on an annual basis and when events occur that may suggest that the fair value of such assets cannot support the carrying value. ASC 350 gives an entity the option to first assess qualitative factors to determine whether it is more likely than not that the fair value of a reporting unit is less than its carrying amount. If an entity determines it is not more likely than not that the fair value of a reporting unit is less than its carrying amount, then performing the two-step impairment test is unnecessary. However, if an entity concludes otherwise, then it is required to perform the step one of the two-step process. The first step of the goodwill impairment test is used to identify potential impairment by comparing the fair value of a reporting unit with its net book value (or carrying amount), including goodwill.
In performing the first step, management determines the fair value of its reporting units using a discounted cash flow (“DCF”) analysis. Determining fair value requires significant judgment concerning the assumptions used in the valuation model, including discount rates, the amount and timing of expected future cash flows, and growth
101
Table of Contents
rates. The cash flows employed in the DCF analysis are based on management’s most recent budgets and business plans and when applicable, various growth rates have been assumed for years beyond the current business plan periods. Any forecast contains a degree of uncertainty and modifications to these cash flows could significantly increase or decrease the fair value of a reporting unit. For example, if revenue from sales of physical formats continues to decline and the revenue from sales of digital formats does not continue to grow as expected and we are unable to adjust costs accordingly, it could have a negative impact on future impairment tests.
If the fair value of a reporting unit exceeds its carrying amount, goodwill of the reporting unit is considered not impaired and the second step of the impairment test is unnecessary. If the carrying amount of a reporting unit exceeds its fair value, the second step of the goodwill impairment test is performed to measure the amount of impairment loss, if any. The second step of the goodwill impairment test compares the implied fair value of the reporting unit’s goodwill with the carrying amount of that goodwill. If the carrying amount of the reporting unit’s goodwill exceeds the implied fair value of that goodwill, an impairment loss is recognized in an amount equal to that excess. The implied fair value of goodwill is determined in the same manner as the amount of goodwill recognized in a business combination. That is, the fair value of the reporting unit is allocated to all of the assets and liabilities of that unit (including any unrecognized intangible assets) as if the reporting unit had been acquired in a business combination and the fair value of the reporting unit was the purchase price paid to acquire the reporting unit.
As of March 31, 2020, we had recorded goodwill in the amount of $1.761 billion, including $1.297 billion and $464 million for our Recorded Music and Music Publishing businesses, respectively, primarily related to the Merger and PLG Acquisition. We test our goodwill and other indefinite-lived intangible assets for impairment on an annual basis in the fourth quarter of each fiscal year as of July 1. The performance of our fiscal 2019 impairment analysis did not result in an impairment of the Company’s goodwill and other indefinite-lived intangible assets and no indicators of impairment were identified during the six months ended March 31, 2020 that required the Company to perform an interim assessment or recoverability test.
The impairment test for other intangible assets not subject to amortization involves a comparison of the estimated fair value of the intangible asset with its carrying value. If the carrying value of the intangible asset exceeds its fair value, an impairment loss is recognized in an amount equal to that excess. The estimates of fair value of intangible assets not subject to amortization are determined using a DCF analysis. Common among such approaches is the “relief from royalty” methodology, which is used in estimating the fair value of the Company’s trademarks. Discount rate assumptions are based on an assessment of the risk inherent in the projected future cash flows generated by the respective intangible assets. Also subject to judgment are assumptions about royalty rates, which are based on the estimated rates at which similar trademarks are being licensed in the marketplace.
See Note 7 to the audited Consolidated Financial Statements included elsewhere in this prospectus for a further discussion of our goodwill and intangible assets.
Revenue and Cost Recognition
Revenues
Recorded Music
As required by FASB ASC Topic 606, Revenue from Contracts with Customers (“ASC 606”), the Company recognizes revenue when, or as, control of the promised services or goods is transferred to our customers and in an amount that reflects the consideration the Company is contractually due in exchange for those services or goods.
Revenues from the licenses of Recorded Music products through digital distribution channels are typically recognized when usage occurs based on usage reports received from the customer. These licenses typically contain a single performance obligation, which is ongoing access to all intellectual property in an evolving
102
Table of Contents
content library, predicated on: (1) the business practice and contractual ability to remove specific content without a requirement to replace the content and without impact to minimum royalty guarantees; and (2) the contracts not containing a specific listing of content subject to the license.
For certain licenses where the consideration is fixed and the intellectual property being licensed is static, revenue is recognized at the point in time when control of the licensed content is transferred to the customer.
Revenues from the sale of physical Recorded Music products are recognized upon delivery, which occurs once the product has been shipped and control has been transferred. In accordance with industry practice and as is customary in many territories, certain products, such as CDs and DVDs, are sold to customers with the right to return unsold items. Revenues from such sales are generally recognized upon shipment based on gross sales less a provision for future estimated returns.
Music Publishing
Music Publishing revenues are earned from the receipt of royalties relating to the licensing of rights in musical compositions and the sale of published sheet music and songbooks. The receipt of royalties principally relates to amounts earned from the public performance of musical compositions, the mechanical reproduction of musical compositions on recorded media including digital formats and the use of musical compositions in synchronization with visual images. Music publishing royalties, except for synchronization royalties, generally are recognized when the sale or usage occurs.
The most common form of consideration for publishing contracts is sales- and usage-based royalties. The collecting societies submit usage reports, typically with payment for royalties due, often on a quarterly or biannual reporting period, in arrears. Royalties are recognized as the sale or usage occurs based upon usage reports and, when these reports are not available, royalties are estimated based on historical data, such as recent royalties reported, company-specific information with respect to changes in repertoire, industry information and other relevant trends. Synchronization revenue is typically recognized as revenue when control of the license is transferred to the customer in accordance with ASC 606.
Refund Liabilities and Allowance for Doubtful Accounts
Management’s estimate of Recorded Music physical products that will be returned, and the amount of receivables that will ultimately be collected is an area of judgment affecting reported revenues and operating income. In determining the estimate of physical product sales that will be returned, management analyzes vendor sales of product, historical return trends, current economic conditions, changes in customer demand and commercial acceptance of the Company’s products. Based on this information, management reserves a percentage of each dollar of physical product sales that provide the customer with the right of return. The provision for such sales returns is reflected as a reduction in the revenues from the related sale.
Similarly, the Company monitors customer credit risk related to accounts receivable. Significant judgments and estimates are involved in evaluating if such amounts will ultimately be fully collected. On an ongoing basis, the Company tracks customer exposure based on news reports, ratings agency information, reviews of customer financial data and direct dialogue with customers. Counterparties that are determined to be of a higher risk are evaluated to assess whether the payment terms previously granted to them should be modified. The Company also monitors payment levels from customers, and a provision for estimated uncollectible amounts is maintained based on such payment levels, historical experience, management’s views on trends in the overall receivable agings and, for larger accounts, analyses of specific risks on a customer-specific basis.
Based on management’s analysis of sales returns, refund liabilities of $23 million and $23 million were established at March 31, 2020 and September 30, 2019, respectively. Based on management’s analysis of uncollectible accounts, reserves of $21 million and $17 million were established at March 31, 2020 and September 30, 2019, respectively. The ratio of our receivable allowances and refund liabilities to gross accounts receivables was 6% at March 31, 2020 and 5% at September 30, 2019.
103
Table of Contents
Accounting for Royalty Advances
We regularly commit to and pay royalty advances to our recording artists and songwriters in respect of future sales. We account for these advances under the related guidance in FASB ASC Topic 928, Entertainment—Music (“ASC 928”). Under ASC 928, we capitalize as assets certain advances that we believe are recoverable from future royalties to be earned by the recording artist or songwriter. Advances vary in both amount and expected life based on the underlying recording artist or songwriter. Advances to recording artists or songwriters with a history of successful commercial acceptability will typically be larger than advances to a newer or unproven recording artist or songwriter. In addition, in certain cases these advances represent a multi-album release or multi-musical composition obligation and the number of album releases and musical compositions will vary by recording artist or songwriter.
Management’s decision to capitalize an advance to a recording artist or songwriter as an asset requires significant judgment as to the recoverability of the advance. The recoverability is assessed upon initial commitment of the advance based upon management’s forecast of anticipated revenue from the sale and licensing of future and existing albums or musical compositions. In determining whether the advance is recoverable, management evaluates the current and past popularity of the recording artist or songwriter, the sales history of the recording artist or songwriter, the initial or expected commercial acceptance of the music, the current and past popularity of the genre of music that the music is designed to appeal to, and other relevant factors. Based upon this information, management expenses the portion of any advance that it believes is not recoverable. In most cases, advances to recording artists or songwriters without a history of success and evidence of current or past popularity will be expensed immediately. Advances are individually assessed for recoverability continuously and at minimum on a quarterly basis. As part of the ongoing assessment of recoverability, we monitor the projection of future sales based on the current environment, the recording artist’s or songwriter’s ability to meet their contractual obligations as well as our intent to support future album releases or musical compositions from the recording artist or songwriter. To the extent that a portion of an outstanding advance is no longer deemed recoverable, that amount will be expensed in the period the determination is made.
We had $421 million and $378 million of advances in our balance sheet at March 31, 2020 and September 30, 2019, respectively. We believe such advances are recoverable through future royalties to be earned by the applicable recording artists and songwriters.
Accounting for Income Taxes
As part of the process of preparing the consolidated financial statements, we are required to estimate income taxes payable in each of the jurisdictions in which we operate. This process involves estimating the actual current tax expense together with assessing temporary differences resulting from differing treatment of items for tax and accounting purposes. These differences result in deferred tax assets and liabilities, which are included within our consolidated balance sheets. FASB ASC Topic 740, Income Taxes (“ASC 740”), requires a valuation allowance be established when it is more likely than not that all or a portion of deferred tax assets will not be realized. In circumstances where there is sufficient negative evidence, establishment of a valuation allowance must be considered. We believe that cumulative losses in the most recent three-year period generally represent sufficient negative evidence to consider a valuation allowance under the provisions of ASC 740. As a result, we determined that certain of our deferred tax assets required the establishment of a valuation allowance.
The realization of the remaining deferred tax assets is primarily dependent on forecasted future taxable income. Any reduction in estimated forecasted future taxable income may require that we record additional valuation allowances against our deferred tax assets on which a valuation allowance has not previously been established. The valuation allowance that has been established will be maintained until there is sufficient positive evidence to conclude that it is more likely than not that such assets will be realized. An ongoing pattern of profitability will generally be considered as sufficient positive evidence. Our income tax expense recorded in the future may be reduced to the extent of offsetting decreases in our valuation allowance. The establishment and reversal of valuation allowances could have a significant negative or positive impact on our future earnings.
104
Table of Contents
From time to time, the Company engages in transactions in which the tax consequences may be subject to uncertainty. Significant judgment is required in assessing and estimating the tax consequences of these transactions. The Company prepares and files tax returns based on its interpretation of tax laws and regulations. In the normal course of business, the Company’s tax returns are subject to examination by various taxing authorities. Such examinations may result in future tax and interest assessments by these taxing authorities. In determining the Company’s tax provision for financial reporting purposes, the Company establishes a reserve for uncertain tax positions unless such positions are determined to be more likely than not of being sustained upon examination based on their technical merits. There is considerable judgment involved in determining whether positions taken on the Company’s tax returns are more likely than not of being sustained.
Accounting for Share-Based Compensation
Share-based compensation represents compensation payment for which the amounts are based on the fair market value of the Company’s common stock. The Plan is classified as a liability rather than equity under
FASB ASC Topic 718, Compensation—Stock Compensation (“ASC 718”). Liability classified share-based compensation costs are measured at fair value each reporting date until settlement.
Determining fair value requires significant judgment concerning the assumptions used in the valuation model, including discount rates, the amount and timing of expected future cash flows and growth rates. Determining fair value requires significant judgment concerning the assumptions used in the valuation model, including discount rates, the amount and timing of expected future cash flows and growth rates. There are two general valuation approaches that are used in estimating fair value of a business that is considered to be a going concern: the income approach and market approach. As of September 30, 2019, the Company derived its fair value through the application of the income approach using a discounted cash flow model, which is then adjusted for non-operating assets and the estimated fair value of the Company’s debt. The Company’s valuation approach did not include the application of the market approach due to no directly comparable market transactions.
Since inception of the Plan, the Company had made a policy election that whenever share-based payment awards are required to be measured as a liability, the Company would use the intrinsic value method to measure the costs. Under the intrinsic value method, the Company obtained the valuation of the presumed stock price and re-measures the related awards using this new price, recognizing compensation costs for the difference between the existing price and new price.
In February 2020, the Company was required a change this accounting policy during the quarter from the intrinsic value method to fair value method in determining the basis of measurement of its share-based compensation liability. In determining fair value of the liability under this new basis, the Company utilized an option pricing model for those awards with an option-like pay-off, which includes various inputs for volatility, term to exit, discount for lack of marketability, expected dividend yield and risk-free rates. For awards with an equity-like pay-off, inputs for discount of lack of marketability and non-performance risk were considered. The Company continued to use an income approach using a discounted cash flow model to determine its per-share value input within the model. As a result of this change in accounting policy, the Company recorded a decrease to its share-based compensation liability of $38 million, which resulted in a decrease of $33 million, net of tax, to accumulated deficit as of March 31, 2020.
Under the income approach, the cash flows employed in the discounted cash flows analysis are based on management’s most recent budget and business plans and when applicable, various growth rates have been assumed for years beyond the current business plan periods. Any forecast contains a degree of uncertainty and modifications to these cash flows could significantly increase or decrease the fair value of the presumed share price. For example, if revenue from sales of physical formats continues to decline and the revenue from sales of digital formats does not continue to grow as expected and we are unable to adjust costs accordingly, it could have a negative impact on future pricing. In determining which discount rate to utilize, management determines the appropriate weighted average cost of capital (“WACC”) for the Company. Management considers many factors
105
Table of Contents
in selecting a WACC, including the market view of risk, the appropriate capital structure and the appropriate borrowing rates for the Company. The selection of a WACC is subjective and modification to this rate could significantly increase or decrease the fair value of our presumed stock price.
We currently expect to incur an accounting-related non-cash charge for the quarterly reporting period ending June 30, 2020, which is the next reporting date on which we are required to measure our share-based compensation costs under the Plan, and we currently estimate such charge to be approximately $388 million (assuming the midpoint of the price range set forth on the cover of this prospectus). Our estimate of this Plan-related charge is preliminary and is subject to change due to numerous factors, including the price at which shares are ultimately sold in this offering. We may also incur non-cash charges in subsequent quarters during which the Plan is in effect.
New Accounting Principles
In May 2014, the FASB issued guidance codified in ASC 606, which replaces the guidance in former ASC 605, Revenue Recognition and ASC 928-605, Entertainment—Music. The amendment was the result of a joint effort by the FASB and the International Accounting Standards Board to improve financial reporting by creating common revenue recognition guidance for U.S. GAAP and international financial reporting standards (“IFRS”). The joint project clarifies the principles for recognizing revenue and develops a common revenue standard for U.S. GAAP and IFRS.
The Company adopted ASC 606 on October 1, 2018, using the modified retrospective method to all contracts not completed as of the date of adoption. The reported results as of and for the fiscal year ended September 30, 2019 reflect the application of the new standard, while the reported results for the fiscal year ended September 30, 2018 have not been adjusted to reflect the new standard and were prepared under prior revenue recognition accounting guidance.
The adoption of ASC 606 resulted in a change in the timing of revenue recognition in the Company’s Music Publishing segment as well as international broadcast rights within the Company’s Recorded Music segment. Under the new revenue recognition rules, revenue is recorded based on best estimates available in the period of sale or usage whereas revenue was previously recorded when cash was received for both the licensing of publishing rights and international Recorded Music broadcast fees. Additionally, for certain licenses where the consideration is fixed and the intellectual property being licensed is static, revenue is recognized at the point in time when control of the licensed content is transferred to the customer. As a result of adopting ASC 606, the Company recorded a decrease to the opening accumulated deficit of approximately $139 million, net of tax, as of October 1, 2018. The Company also reclassified $28 million from accounts receivable to other current liabilities related to estimated refund liabilities for its physical sales.
We adopted ASC 842, Leases, on October 1, 2019, which results in most of our operating leases being recognized as right of use assets and operating lease liabilities on our consolidated balance sheet. None of the remaining new accounting principles had a material effect on our audited financial statements. See Note 2 to our audited Consolidated Financial Statements included elsewhere herein for a complete summary of all our significant accounting policies.
106
Table of Contents
QUANTITATIVE AND QUALITATIVE DISCLOSURES ABOUT MARKET RISK
We are exposed to market risk arising from changes in market rates and prices, including movements in foreign currency exchange rates and interest rates.
Foreign Currency Risk
Within our global business operations, we have transactional exposures that may be adversely affected by changes in foreign currency exchange rates relative to the U.S. dollar. We may at times choose to use foreign exchange currency derivatives, primarily forward contracts, to manage the risk associated with the volatility of future cash flows denominated in foreign currencies, such as unremitted or future royalties and license fees owed to our U.S. companies for the sale or licensing of U.S.-based music and merchandise abroad that may be adversely affected by changes in foreign currency exchange rates. We focus on managing the level of exposure to the risk of foreign currency exchange rate fluctuations on major currencies, which can include the Euro, British pound sterling, Japanese yen, Canadian dollar, Swedish krona, Australian dollar, Brazilian real, Korean won and Norwegian krone, and in many cases we have natural hedges where we have expenses associated with local operations that offset the revenue in local currency and our Euro-denominated debt, which can offset declines in the Euro. As of March 31, 2020, the Company had outstanding hedge contracts for the sale of $243 million and the purchase of $142 million of foreign currencies at fixed rates. Subsequent to March 31, 2020, certain of our foreign exchange contracts expired. As of September 30, 2019, September 30, 2018 and September 30, 2017, the Company had no outstanding hedge contracts.
The fair value of foreign exchange contracts is subject to changes in foreign currency exchange rates. For the purpose of assessing the specific risks, we use a sensitivity analysis to determine the effects that market risk exposures may have on the fair value of our financial instruments. For foreign exchange forward contracts outstanding at March 31, 2020, we typically perform a sensitivity analysis assuming a hypothetical 10% depreciation of the U.S. dollar against foreign currencies from prevailing foreign currency exchange rates and assuming no change in interest rates. The fair value of the foreign exchange forward contracts would have decreased by $10 million based on this analysis. Hypothetically, even if there was a decrease in the fair value of the forward contracts, because our foreign exchange contracts are entered into for hedging purposes, these losses would be largely offset by gains on the underlying transactions.
Interest Rate Risk
We had $3.004 billion of principal debt outstanding at March 31, 2020, of which $1.326 billion was variable-rate debt and $1.678 billion was fixed-rate debt. As of September 30, 2019, September 30, 2018 and September 30, 2017, we had $2.998 billion, $2.851 billion and $2.846 billion of principal debt outstanding, respectively, of which $1.326 billion, $1.326 billion and $1.006 billion was variable-rate debt, respectively, and $1.672 billion, $1.525 billion and $1.840 billion was fixed-rate debt, respectively. As such, we are exposed to changes in interest rates. At March 31, 2020, September 30, 2019, September 30, 2018 and September 30, 2017, 56%, 56%, 53% and 65% of the Company’s debt, respectively, was at a fixed rate. In addition, at March 31, 2020, we have the option under all of our floating rate debt under the Senior Term Loan Facility to select a one, two, three or six month LIBOR rate. To manage interest rate risk on $820 million of U.S. dollar-denominated variable-rate debt, the Company has entered into interest rate swaps to effectively convert the floating interest rates to a fixed interest rate on a portion of its variable-rate debt.
Based on the level of interest rates prevailing at March 31, 2020, September 30, 2019, September 30, 2018 and September 30, 2017, the fair value of the Company’s fixed-rate and variable-rate debt was approximately $2.890 billion, $3.080 billion, $2.862 billion and $2.936 billion, respectively. Further, as of March 31, 2020, based on the amount of the Company’s fixed-rate debt, a 25 basis point increase or decrease in the level of interest rates would decrease the fair value of the fixed-rate debt by approximately $5 million or increase the fair value of the fixed-rate debt by approximately $20 million. This potential fluctuation is based on the simplified
107
Table of Contents
assumption that the level of fixed-rate debt remains constant with an immediate across the board increase or decrease in the level of interest rates with no subsequent changes in rates for the remainder of the period.
Inflation Risk
Inflationary factors such as increases in overhead costs may adversely affect our results of operations. We do not believe that inflation has had a material effect on our business, financial condition or results of operations to date. If our costs were to become subject to significant inflationary pressures, we may not be able to fully offset such higher costs through price increases for services. Our inability or failure to do so could harm our business, financial condition or results of operations.
108
Table of Contents
Our Company
We are one of the world’s leading music entertainment companies. Our renowned family of iconic record labels, including Atlantic Records, Warner Records, Elektra Records and Parlophone Records, is home to many of the world’s most popular and influential recording artists. In addition, Warner Chappell Music, our global music publishing business, boasts an extraordinary catalog that includes timeless standards and contemporary hits, representing works by over 80,000 songwriters and composers, with a global collection of more than 1.4 million musical compositions. Our entrepreneurial spirit and passion for music has driven our recording artist and songwriter focused innovation for decades.
Our Recorded Music business, home to superstar recording artists such as Ed Sheeran, Bruno Mars and Cardi B, generated $3.840 billion of revenue in fiscal 2019, representing 86% of total revenues. Our Music Publishing business, which includes esteemed songwriters such as Twenty One Pilots, Lizzo and Katy Perry, generated $643 million of revenue in fiscal 2019, representing 14% of total revenues. We benefit from the scale of our global platform and our local focus.
Today, global music entertainment companies such as ours are more important and relevant than ever. The traditional barriers to widespread distribution of music have been erased. The tools to make and distribute music are at every musician’s fingertips, and today’s technology makes it possible for music to travel around the world in an instant. This has resulted in music being ubiquitous and accessible at all times. Against this industry backdrop, the volume of music being released on digital platforms is making it harder for recording artists and songwriters to get noticed. We cut through the noise by identifying, signing, developing and marketing extraordinary talent. Our global A&R experience and marketing strategies are critical ingredients for recording artists or songwriters who want to build long-term global careers. We believe that the music, not the technology, delights fans and drives the business forward.
Our commercial innovation is crucial to maintaining our momentum. We have championed new business models and empowered established players, while protecting and enhancing the value of music. We were the first major music entertainment company to strike landmark deals with important companies such as Apple, YouTube and Tencent Music Entertainment Group, as well as with pure-play music technology companies such as MixCloud, SoundCloud and Audiomack. We adapted to streaming faster than other major music entertainment companies and, in 2016, were the first such company to report that streaming was the largest source of our recorded music revenue. Looking into the future, we believe the universe of opportunities will continue to expand, including through the proliferation of new devices such as smart speakers and the monetization of music on social media and other platforms. We believe advancements in technology will continue to drive consumer engagement and shape a growing and vibrant music entertainment ecosystem.
We have achieved growth and profitability at scale. For the fiscal years ended September 30, 2019, September 30, 2018 and September 30, 2017, we generated $4.5 billion, $4.0 billion and $3.6 billion in revenue, respectively, representing year-over-year growth of 12% and 12%, respectively. For the fiscal years ended September 30, 2019, September 30, 2018 and September 30, 2017, we reported net income of $258 million, $312 million and $149 million, respectively. For the fiscal years ended September 30, 2019, September 30, 2018 and September 30, 2017, our Adjusted EBITDA was $737 million, $1,033 million (which includes a pre-tax net gain of $389 million related to the sale of Spotify shares acquired in the ordinary course of business) and $604 million, respectively. Adjusted EBITDA is a non-U.S. GAAP measure. For a discussion of Adjusted EBITDA and a reconciliation to the most closely comparable U.S. GAAP measure, see “Summary Historical Consolidated Financial Data.”
109
Table of Contents
Our History
The Company today consists of individual companies that are among the most respected and iconic in the music industry, with a history that dates back to the establishment of Chappell & Co. in 1811 and Parlophone in 1896.
The Company began to take shape in 1967 when Warner-Seven Arts, the parent company of Warner Records (formerly known as Warner Bros. Records) acquired Atlantic Records, which discovered artists such as Led Zeppelin and Aretha Franklin. In 1969, Kinney National Company acquired Warner-Seven Arts, and in 1970, Kinney Services (which was later spun off into Warner Communications) acquired Elektra Records, which was renowned for artists such as The Doors and Judy Collins. In order to harness their collective strength and capabilities, in 1971, Warner Bros., Elektra and Atlantic Records formed a groundbreaking U.S. distribution network commonly known as WEA Corp., or simply WEA, which now stretches across the world.
Throughout this time, the Company’s music publishing division, Warner Bros. Music, built a strong presence. In 1987, the purchase of Chappell & Co. created Warner Chappell Music, one of the industry’s major music publishing forces with a storied history that today connects Ludwig van Beethoven, George Gershwin, Madonna and Lizzo.
The parent company that had grown to become Time Warner completed the sale of the Company to a consortium of private equity investors in 2004, in the process creating the world’s largest independent music company. The Company was taken public the following year, and in 2011, Access acquired the Company.
Since acquiring the Company, Access has focused on revenue growth and increasing operating margins and cash flow combined with financial discipline. Looking past more than a decade of music entertainment industry transitions, Access and the Company foresaw the opportunities that streaming presented for music. Over the last eight years, Access has consistently backed the Company’s bold expansion strategies through organic A&R as well as acquisitions. These strategies include investing more heavily in recording artists and songwriters, growing the Company’s global reach, augmenting its streaming expertise, overhauling its systems and technological infrastructure, and diversifying into other music-based revenue streams.
The purchase of PLG in 2013 strengthened the Company’s presence in core European territories, with recording artists as diverse as Coldplay, David Bowie, David Guetta and Tinie Tempah. That acquisition was followed by other investments that further strengthened the Company’s footprint in established and emerging markets. Other milestones include the Company’s acquisitions of direct-to-audience businesses such as entertainment specialty e-tailer EMP, live music application Songkick and youth culture platform UPROXX.
Our Industry and Market Opportunity
The music entertainment industry is large, global and vibrant. The recorded music and music publishing industries are growing, driven by consumer and demographic trends in the digital consumption of music.
Consumer Trends and Demographics
Consumers today engage with music in more ways than ever. According to IFPI, global consumers spent 18 hours listening to music each week in 2019. Demographic trends and smartphone penetration have been key factors in driving growth in consumer engagement. Younger consumers typically are early adopters of new technologies, including music-enabled devices. According to Nielsen, in 2019, 58% of teens in the United States between the ages of 13 and 17 and 45% of millennials in the United States between the ages of 18 and 34 used their smartphones to listen to music on a weekly basis, as compared to a 40% average for all U.S. consumers. Furthermore, in 2019, U.S. teens and millennials listened to an average of 32.6 and 29.7 hours of music each week, respectively, above the 26.9 hours for all U.S. consumers.
110
Table of Contents
Members of older demographic groups are also increasing their music engagement. According to an IFPI survey of 19 leading geographic markets in 2019, 54% of 35- to 64-year-olds used a streaming service to listen to music in the past month, representing an increase from 46% in 2018, which was the highest rate of growth for use of streaming services across all age groups.
Music permeates our culture across age groups, as evidenced by the footprint that music has across social media. According to RIAA, as of September 2019, 7 out of the top 10 most followed accounts on Twitter belong to musicians, and according to YouTube, the majority of videos that have achieved more than one billion lifetime views as well as the top 10 most watched videos of all time, belong to musicians.
Recorded Music
The recorded music industry generated $20.2 billion in global revenue in 2019 and has consistently grown since 2015, according to IFPI. IFPI measures the recorded music industry based on four revenue categories: digital (including streaming), physical, synchronization and performance rights. Digital is the largest, generating $12.9 billion of revenue in 2019, representing 64% of global recorded music revenue. Within digital, streaming generated approximately 88% of revenue, or $11.4 billion, with the remainder of digital revenue coming from other formats such as downloads. Overall, digital grew by 18% in 2019, with streaming increasing by 24%.
Physical represented approximately 22% of global recorded music revenue in 2019, with growth in formats such as vinyl partially offsetting declines in CD sales. Performance rights revenue represents the use of recorded music by broadcasters and public venues, and represented approximately 13% of global recorded music revenue in 2019. Synchronization revenue is generated from the use of recorded music in advertising, film, video games and television content, and represented 2% of global recorded music revenue in 2019. According to IFPI, global recorded music revenue has grown at a 9% CAGR since 2015.
Global Recorded Music Industry Revenues 2015 to 2019 ($ in billions)
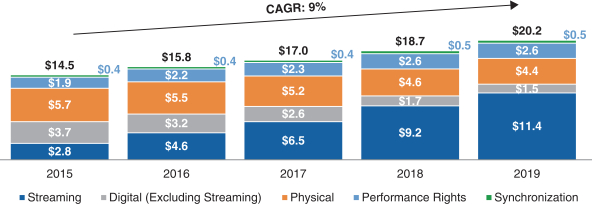
We believe the following secular trends will continue to drive growth in the recorded music industry:
Streaming Still in Early Stages of Global Adoption and Penetration
According to IFPI, global paid music streaming subscribers totaled 341 million at the end of 2019. While this represents an increase of 34% from 255 million in 2018, it still represents less than 11% of the 3.2 billion smartphone users globally, according to Statista. It also represents a small fraction of the user bases for large, globally scaled digital services such as Facebook, which reported 2.6 billion monthly users across its services as of April 2020, and YouTube, which reported over two billion unique monthly users as of May 2020. On-demand streaming (both audio and video) reached 1.15 trillion streams in the United States in 2019, according to Nielsen,
111
Table of Contents
and this growth is expected to continue. According to Statista, as of March 16, 2020, 12% of adults (calculated across four demographic cohorts—Generation Z, Millennials, Generation X and Baby Boomers) reported that they are likely to spend more on music streaming due to the COVID-19 pandemic.
The potential of global paid streaming subscriber growth is demonstrated by the penetration rates in early adopter markets. Approximately 30% of the population in Sweden, where Spotify was founded, was estimated to be paid music subscribers in 2018, according to MIDiA. This compares to approximately 25% and 16% for established markets such as the United States and Germany, respectively. Moreover, paid digital music subscribers in Japan, the world’s second-largest recorded music market in 2018 according to IFPI, still only represented approximately 7% of the population, according to MIDiA. There also remains substantial opportunity in emerging markets, such as Brazil and India, where smartphone penetration is low compared to developed markets. For example, according to Statista, smartphone penetration for Brazil and India as of September 2019 was 46% and 25%, respectively, compared to 79% in the United States.
China, in particular, represents a substantial growth market for the recorded music industry. Digital music monetization models, including paid streaming and virtual gifting (which refers to the purchase of a digital, non-durable, non-physical item (e.g., an emoji) that is delivered to another person often during a live karaoke performance), created the foundation for the recorded music industry to overcome piracy and generate revenue in China. According to IFPI, paid streaming models are at an early stage in China, with an estimated 33 million paid subscribers in 2018, representing only 2% of China’s population of over 1.4 billion. Despite its substantial population, China was the world’s seventh-largest music market in 2019, having only broken into the top 10 in 2017.
Opportunities for Improved Streaming Pricing
In addition to paid subscriber growth, we believe that, over time, streaming revenues will increase due to pricing increases as the broader market further develops. Streaming services are already at the early stages of experimenting with price increases. For example, in 2018, Spotify increased monthly prices for its service in Norway. In addition, in 2019, Amazon launched Amazon Music HD, a high-quality audio streaming offering that is available to customers at a premium price in the United States. We believe the value proposition that streaming provides to consumers supports premium product initiatives.
Technology Enables Innovation and Presents Additional Opportunities
Technological innovation has helped facilitate the penetration of music listening across locations, including homes, offices and cars, as well as across devices, including smartphones, tablets, wearables, digital dashboards, gaming consoles and smart speakers. These technologies represent advancements that are deepening listener engagement and driving further growth in music consumption.
Device Innovation. According to Nielsen, as of August 2019, U.S. consumers listened to music across an average of 4.1 devices per week. We believe that the use of multiple devices is expanding listening hours by bringing music into more moments of consumers’ lives, and the different uses these devices enable are also broadening the base of music to which consumers are exposed. The music that consumers listen to during a commute may be different than the music they listen to while they exercise, and different still than the music they play through a smart speaker while cooking a meal. Smart speakers enable consumers to access music more readily by using their voices. According to PwC, smart speaker ownership is expected to increase at a 38% CAGR from 2018 through 2023, to 440 million devices globally in 2023. The adoption of smart speakers in the United States has been strong, and according to Nielsen, 31% of music listeners today own smart speakers. Smart speakers are fueling further growth in streaming, by converting more casual listeners into paid subscribers, drawn in by music as a critical application for these devices. According to Nielsen, 61% of U.S. consumers who use a smart speaker weekly to listen to music currently pay for a subscription as well.
112
Table of Contents
Format and Monetization Model Innovation. Short-form music and music-based video content has grown rapidly, driven by the growth of global social video applications such as TikTok, which features 15-second videos often set to music. TikTok has reportedly been downloaded more than one billion times since its launch in 2017 and has a global reach of 500 million users, according to Nielsen. Such applications have the potential for mass adoption, illustrating the opportunity for additional platforms of scale to be created to the benefit of the music entertainment industry. These platforms enable incremental consumption of music appealing to varied, and often younger, audiences. From a recording artist’s perspective, these platforms have the potential to rewrite the path to stardom. For example, our recording artist, Fitz & the Tantrums, an American band, rose to international fame in 2018 as their song “HandClap” went viral in Asia on TikTok. Fitz & the Tantrums quickly topped the international music charts in South Korea and surpassed one billion streams in China. Short-form music and music-based video content have also become increasingly popular on social media platforms such as Facebook and Instagram, further illustrating the growing number of potential pathways through which recording artists may gain consumer exposure.
Music Publishing
According to Music & Copyright, the music publishing industry generated $5.6 billion in global revenue in 2019, representing an approximate 2% increase from $5.5 billion in 2018 (following an increase in global music publishing revenues of 11% from 2017 to 2018). Music publishing involves the acquisition of rights to, and the licensing of, musical compositions (as opposed to sound recordings) from songwriters, composers or other rightsholders. Music publishing revenues are derived from four main royalty sources: mechanical, performance, synchronization and digital. In 2019, digital, which accounted for approximately 42% of global revenue, represented the largest and fastest-growing component of industry revenues, while performance, which accounted for approximately 30%, represented the second-largest component of industry revenues. Synchronization accounted for approximately 19% of global revenue in 2019. Mechanical revenues from traditional physical music formats (e.g., CDs, DVDs, downloads), which accounted for approximately 8% of global revenue in 2019, have continued to fall while digital revenues have grown to offset this decline.
Global Music Publishing Industry Revenues 2015 to 2019 ($ in billions)
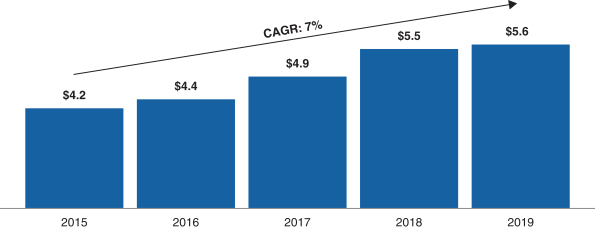
Positive Regulatory Trends
The music industry has benefitted from positive regulatory developments in recent years, which are expected to lead to increased revenues for the music entertainment industry in the coming years.
Music Modernization Act. In 2018, the enactment of the MMA in the United States resulted in major reforms to music licensing. The MMA improves the way digital music services obtain mechanical licenses for
113
Table of Contents
musical compositions, requires the payment of royalties to recording artists for pre-1972 sound recordings streamed on digital radio services such as SiriusXM and Pandora, and provides for direct payments of royalties owed to producers, mixers and engineers when their original works are streamed on non-interactive webcasting services.
Copyright Royalty Board. In 2018, the CRB issued its determination of royalty rates and terms, significantly increasing the mechanical royalty rates paid for musical compositions in the United States from 2018 through 2022. That decision is currently being appealed by some digital music services. In 2018, the CRB issued its determination of royalty rates and terms, significantly increasing the royalty rates paid for sound recordings in the United States by SiriusXM from 2018 through 2022, and the MMA extended that increase through 2027.
European Union Copyright Directive. In 2019, the E.U. passed legislation which will reign in safe harbors from liability for copyright infringement and rebalance the online marketplace to ensure that rightsholders and recording artists are remunerated fairly when their music is shared online by user-uploaded content services such as YouTube.
Our Competitive Strengths
Well-Positioned to Benefit from Growth in the Global Music Market Driven by Streaming. The music entertainment industry has undergone a transformation in the consumption and monetization of content towards streaming over the last five years. According to IFPI, from 2015 through 2019, global recorded music revenue grew at a CAGR of 9%, with streaming revenue growing at a CAGR of 42% and increasing as a percentage of global recorded music revenue from 19% to 56% over the same period. By comparison, from fiscal year 2015 to fiscal year 2019, our recorded music streaming revenue grew at a CAGR of 37% and increased as a percentage of our total recorded music revenues from 24% to 55%. We believe our innovation-focused operating strategy with an emphasis on genres that over-index on streaming platforms (e.g., hip-hop and pop) has consistently allowed our digital revenue growth to outpace the market, highlighted by our becoming the first major music entertainment company to report that our streaming revenue was the largest source of recorded music revenue in 2016.
The growth of streaming services has not only improved the discoverability and personalization of music, but has also increased consumer willingness to pay for seamless convenience and access. We believe consumer adoption of paid streaming services still has significant potential for growth. For example, according to MIDiA, in 2018, approximately 30% of the population in Sweden, an early adopter market, was paid music subscribers. This illustrates the opportunity to drive long-term growth by increasing penetration of paid subscriptions throughout the world, including important markets such as the United States, Japan, Germany, the United Kingdom and France, where paid subscriber levels are lower. Our catalog and roster of recording artists and songwriters, including our strengths in hip-hop and pop music, position us to benefit as streaming continues to grow. We also believe our diversified catalog of evergreen music amassed over many decades will prove advantageous as demographics evolve from younger early adopters to a wider demographic mix and as digital music services target broader audiences.
Established Presence in Growing International Markets, Including China. We believe we will benefit from the growth in international markets due to our local A&R focus, as well as our local and global marketing and distribution infrastructure that includes a network of subsidiaries, affiliates, and non-affiliated licensees and sub-publishers in more than 70 countries. We are developing local talent to achieve regional, national and international success. We have expanded our global footprint over time by acquiring independent recorded music and music publishing businesses, catalogs and recording artist and songwriter rosters in China, Indonesia, Poland, Russia and South Africa, among other markets. In addition, we have increased organic investment in heavily populated emerging markets by, for example, launching Warner Music Middle East, our recorded music affiliate covering 17 markets across the Middle East and North Africa with a total population of 380 million people. We have also strengthened our Warner Music Asia executive team with new appointments and
114
Table of Contents
promotions. According to IFPI in 2018, recorded music industry revenues in Asia and Australasia grew 12% year-over-year. Over the same period and on a constant-currency basis, we grew revenues in Asia and Australasia by 21%, again outpacing the industry.
With every region around the world at different stages in transitioning to digital formats, we believe establishing creative hubs by opening new regional offices and partnering with local players will achieve our objective of building local expertise while delivering maximum global impact for our recording artists and songwriters. For example, we recently invested in one of Nigeria’s leading music entertainment companies, Chocolate City, and music from this influential independent company’s recording artists and songwriters will join our repertoire and receive the support of our wide-ranging global expertise, including distribution and artist services.
Differentiated Platform of Scale with Top Industry Position. With over $4 billion in annual revenues, over half of which are generated outside of the United States, we believe our platform is differentiated by the scale, reach and broad appeal of our music. Our collection of owned and controlled recordings and musical compositions, spanning a large variety of genres and geographies over many decades, cannot be replicated. As one of three major music entertainment companies, our industry position remains strong and poised for continued growth. As reported in Music & Copyright, our global recorded music market share has increased approximately 6% from 2011 to 2019, growing from 15.1% to 16.0%. In addition, according to Nielsen, Atlantic Records was the No. 1 record label on the Billboard 200 in the United States in 2017, 2018 and 2019.
Star-Making, Culture-Defining Core Capabilities. For decades, our A&R strategy of identifying and nurturing recording artists and songwriters with the talents to be successful has yielded an extensive catalog of iconic music across a wide breadth of musical genres and marquee brands all over the world. Our marketing and promotion departments provide a comprehensive suite of solutions that are specifically tailored to each of our recording artists and carefully coordinated to create the greatest sales momentum for new and catalog releases alike. The development of our vibrant roster of recording artists has been informed by our significant experience in being able to adapt to changes in consumer trends and sentiment over time. Our creative instincts yield custom strategies for each and every one of our recording artists, including, for example:
| • | Cardi B, whose first Atlantic Records single “Bodak Yellow” was a break-out hit that has been certified nine times Platinum in the United States by the RIAA; |
| • | Twenty One Pilots, whose rise to stardom accelerated with the release of their second Fueled by Ramen studio album, Blurryface; and |
| • | Portugal. The Man, which celebrated its first entry on the Billboard Hot 100 chart after the release of their eighth studio album, Woodstock, featuring the track “Feel It Still.” |
In addition, Warner Chappell Music boasts a diversified catalog of timeless classics together with an ever-growing group of contemporary songwriters who are actively contributing to today’s top hits. We believe our longstanding reputation and relationships in the creative community, as well as our historical success in talent development and management, will continue to attract new recording artists and songwriters with staying power and market potential through the strength and scale of our proprietary capabilities.
Strong Financial Profile with Robust Growth, Operating Leverage and Free Cash Flow Generation. For fiscal year 2017 through fiscal year 2019, we have grown as-reported revenues at a CAGR of 12%, and on a constant-currency basis, at a CAGR of 10%, driven by secular tailwinds, organic reinvestment in A&R and strategic acquisitions. For our fiscal year 2019, our business generated net income and Adjusted EBITDA of $258 million and $737 million, respectively, implying an Adjusted EBITDA margin of approximately 16%. We have an efficient business model as demonstrated by our high Free Cash Flow conversion of Adjusted EBITDA. In fiscal year 2019, we generated $24 million of Free Cash Flow (after taking into account $183 million related to the acquisition of EMP). We believe our financial profile provides a strong foundation for our continued growth.
115
Table of Contents
Experienced Leadership Team and Committed Strategic Investor. Our management team has successfully designed and implemented our business strategy, delivering strong financial results, releasing an increasing flow of new music and establishing a dynamic culture of innovation. At the same time, our management team has driven an increase in operating margins and cash flow through an improved revenue mix to higher-margin digital platforms and overhead cost management, while maintaining financial flexibility to both organically invest in the business and pursue strategic acquisitions to diversify our revenue mix. Our Recorded Music and Music Publishing businesses are led by entrepreneurial and creative individuals with extensive experience in discovering and developing recording artists and songwriters and managing their creative output on a global scale. In addition, we have benefited, and expect to continue to benefit, from our acquisition by Access in July 2011, which has provided us with strategic direction, M&A and capital markets expertise and planning support to help us take full advantage of the ongoing transition in the music entertainment industry.
Expertise in Strategic Acquisitions and Investments That Extend Our Capabilities. Since 2011 when Access became our controlling shareholder, we have completed more than 15 strategic acquisitions. The acquisition of PLG in 2013 significantly strengthened our worldwide roster, global footprint and executive talent, particularly in Europe. In addition, we have made several smaller strategic acquisitions aimed at expanding our artist services capabilities in our Recorded Music business, including EMP, one of Europe’s leading specialty music and entertainment merchandise e-tailers; Sodatone, a premier A&R insight tool; UPROXX, the youth culture and video production powerhouse; Spinnin’ Records, one of the world’s leading independent electronic music companies; and Songkick’s concert discovery application. These transactions showcase the growing breadth of our platform across the music entertainment ecosystem and have increased our direct access to fans of our recording artists and songwriters. In addition to our commercial arrangements with digital music services, we opportunistically invest in some of those services as well as other companies in our industry, including minority equity stakes in Deezer, a French digital music service in which Access owns a controlling equity interest, and Tencent Music Entertainment Group, the leading online music entertainment platform in China. Acquiring and investing in businesses that are highly complementary to our existing portfolio further enables us to potentially derive incremental and new revenue streams from different business models in new markets.
Our Growth Strategies
Attract, Develop and Retain Established and Emerging Recording Artists and Songwriters. A critical component of our global strategy is to produce an increasing flow of new music by finding, developing and retaining recording artists and songwriters who achieve long-term success. Since 2011, our annual new releases have grown significantly and our catalog of musical compositions has increased to over 1.4 million. We expect to enhance the value of our assets by continuing to attract and develop new recording artists and songwriters with staying power and market potential. Our A&R teams seek to sign talented recording artists and songwriters who will generate meaningful revenues and increase the enduring value of our catalog. We have also made meaningful investments in technology to further expand our A&R capabilities in a rapidly changing music environment. In 2018, we acquired Sodatone, an advanced A&R tool that uses streaming, social and touring data to help track early predictors of success. When combined with the strength of our current ability to identify creative talent, we expect this to further enhance our ability to scout and sign breakthrough recording artists and songwriters. In addition, we anticipate that investment in or commercial relationships with technology companies will enable us to tailor our marketing efforts for established recording artists and songwriters by gaining valuable insight into consumer reactions to new releases. We regularly evaluate our recording artist and songwriter rosters to ensure that we remain focused on developing the most promising and profitable talent and are committed to maintaining financial discipline in the negotiation of our agreements with recording artists and songwriters.
Focus on Growth Markets to Position Us to Realize Upside from Incremental Penetration of Streaming. While the rapid growth of streaming has already transformed the music entertainment industry, streaming is still in relatively early stages, as significant opportunity remains in both developed markets and markets largely untapped by the adoption of paid streaming subscriptions. Some of our largest markets, such as the United States, Germany, United Kingdom and France, still lag Nordic countries in penetration of paid subscriptions and have room for future
116
Table of Contents
growth. In these markets, we will continue to increase our output of new releases and use data to more effectively target our marketing efforts. Less mature markets, such as China and Brazil, have large populations with relatively high smartphone penetration, and we are well placed to benefit from streaming tailwinds over the next several years with our local presence and extensive catalog.
Expand Global Presence with Investment in Local Music in Nascent Markets. We recognize that music is inherently local in nature, shaped by people and culture. According to IFPI, in 2018, at least seven of the top-selling singles in Brazil, India, Italy and South Korea were performed by or featured local artists. Similarly, in 2018, at least seven of the top-selling albums in France, Germany, Spain and Turkey were performed by or featured local artists. One of our vital business functions is to help our recording artists and songwriters solve the complexities associated with a fragmented, global market of mixed musical tastes. We have found that investment in local music provides the best opportunity to understand these nuances, and we have made it a strategic priority to seek out investment opportunities in emerging markets. For example, we opened an office in the Middle East and North Africa region to prepare for the forecasted rise in smartphone penetration and projected uptake in digital music. These investments are made with the purpose of increasing our understanding of local market dynamics and popularizing our current roster of recording artists and songwriters around the world. The impact of this local focus is demonstrated by increased revenues. For example, in fiscal year 2019, on a constant-currency basis, our revenues grew by 11% in the United States and Canada, 17% in Latin America, 25% in Asia and Australasia, 26% in Europe and the rest of the world.
Embrace Commercial Innovation with New Digital Distributors and Partners. We believe the growth of digital formats will continue to create new and powerful ways to distribute and monetize our music. We were the first major music company to strike landmark deals with important companies such as Apple, YouTube, Peloton and Tencent Music Entertainment Group, as well as with pure-play music technology companies such as MixCloud, SoundCloud and Audiomack. We believe that the continued development of new digital channels for the consumption of music and increasing access to digital music services present significant promise and opportunity for the music entertainment industry. We are also focused on investing in emerging music technologies, demonstrated by our launch of WMG Boost, a seed-stage investment fund for start-ups in the music entertainment industry and through partnerships with entrepreneurial incubators such as TechStars. We intend to continue to extend our technological reach by executing deals with new partners and developing optimal business models that will enable us to monetize our music across various platforms, services and devices. We also intend to continue to support and invest in emerging technologies, including artificial intelligence, artificial reality, virtual reality, high-resolution audio, mobile messaging and other technologies to continue to build new revenue streams and position ourselves for long-term growth.
Pursue Acquisitions to Enhance Asset Portfolio and Long-Term Growth. We have successfully completed a number of strategic acquisitions, particularly in our Recorded Music business. Strengthening and expanding our global footprint provides us with insights on markets in which we can immediately capitalize on favorable industry trends, as evidenced by our acquisition of PLG in 2013. We also build upon our core competencies with additive and ancillary capabilities. For example, our acquisition of UPROXX, one of the most influential media brands for youth culture, not only provides a platform for short-form music and music-based video content production to market and promote our recording artists, but also includes sales capabilities to monetize advertising inventory on digital audio and video platforms. We plan to continue selectively pursuing acquisition opportunities while maintaining financial discipline to further improve our growth trajectory and drive operating efficiencies with increased free cash flow generation. With respect to our Music Publishing business, we have the opportunity to generate significant value by acquiring other music publishers and extracting cost savings (as acquired catalogs can be administered with little incremental cost), as well as by increasing revenues through more aggressive monetization efforts. We will also continue to evaluate opportunities to add to our catalog or acquire or make investments in companies engaged in businesses that we believe will help to advance our strategies.
117
Table of Contents
Recorded Music
Our Recorded Music business primarily consists of the discovery and development of recording artists and the related marketing, promotion, distribution, sale and licensing of music created by such recording artists. We play an integral role in virtually all aspects of the recorded music value chain from discovering and developing talent to producing, distributing and selling music to marketing and promoting recording artists and their music.
In the United States, our Recorded Music business is conducted principally through our major record labels—Atlantic Records and Warner Records. In October 2018, we launched Elektra Music Group in the United States as a standalone label group, which comprises the Elektra, Fueled by Ramen and Roadrunner labels. Our Recorded Music business also includes Rhino Entertainment, a division that specializes in marketing our recorded music catalog through compilations, reissuances of previously released music and video titles and releasing previously unreleased material from our vault. We also conduct our Recorded Music business through a collection of additional record labels including Asylum, Big Beat, Canvasback, East West, Erato, FFRR, Nonesuch, Parlophone, Reprise, Sire, Spinnin’ Records, Warner Classics and Warner Music Nashville.
Outside the United States, our Recorded Music business is conducted through various subsidiaries, affiliates and non-affiliated licensees. Internationally, we engage in the same activities as in the United States: discovering and signing artists and distributing, selling, marketing and promoting their music. In most cases, we also market, promote, distribute and sell the music of those recording artists for whom our domestic record labels have international rights. In certain smaller markets, we license the right to distribute and sell our music to non-affiliated third-party record labels.
Our Recorded Music business’ distribution operations include WEA Corp., which markets, distributes and sells music and video products to retailers and wholesale distributors; ADA, which markets, distributes and sells the products of independent labels to retail and wholesale distributors; and various distribution centers and ventures operated internationally.
In addition to our music being sold in physical retail outlets, our music is also sold in physical form to online physical retailers, such as amazon.com, barnesandnoble.com and bestbuy.com, and distributed in digital form to an expanded universe of digital partners, including streaming services such as those of Amazon, Apple, Deezer, SoundCloud, Spotify, Tencent Music Entertainment Group and YouTube, radio services such as iHeart Radio and SiriusXM and download services.
We have diversified our revenues beyond our traditional businesses by entering into expanded-rights deals with recording artists in order to partner with such artists in other aspects of their careers. Under these agreements, we provide services to and participate in recording artists’ activities outside the traditional recorded music business such as touring, merchandising and sponsorships. We have built and acquired artist services capabilities and platforms for marketing and distributing this broader set of music-related rights and participating more widely in the monetization of the artist brands we help create. We believe that entering into expanded-rights deals and enhancing our artist services capabilities in areas such as merchandising, VIP ticketing, fan clubs, concert promotion and management has permitted us to diversify revenue streams and capitalize on other revenue opportunities. This provides for improved long-term relationships with our recording artists and allows us to more effectively connect recording artists and fans.
For each of the fiscal years ended September 30, 2019, September 30, 2018 and September 30, 2017, Recorded Music represented 86%, 84% and 84%, respectively, of consolidated revenues, before intersegment eliminations.
A&R
We have a decades-long history of identifying and contracting with recording artists who become commercially successful. Our ability to select recording artists who are likely to be successful is a key element of
118
Table of Contents
our Recorded Music business strategy and spans all music genres and all major geographies and includes recording artists who achieve national, regional and international success. We believe that this success is directly attributable to our experienced global team of A&R executives, to the longstanding reputation and relationships that we have developed in the artistic community and to our effective management of this vital business function.
In the United States, our major record labels identify potentially successful recording artists, sign them to recording contracts, collaborate with them to develop recordings of their work and market and sell or license these finished recordings to legitimate digital channels and retail stores. Increasingly, we are also expanding our participation in image and brand rights associated with artists, including merchandising and sponsorships. Our labels scout and sign talent across all major music genres, including pop, rock, jazz, classical, country, R&B, hip-hop, rap, reggae, Latin, alternative, folk, blues, gospel and other Christian music. Internationally, we market and sell U.S. and local repertoire through our network of subsidiaries, affiliates and non-affiliated licensees. With a roster of local recording artists performing in various local languages throughout the world, we have an ongoing commitment to developing local talent aimed at achieving national, regional or international success.
Many of our recording artists continue to appeal to audiences long after we cease to release their new music. We have an efficient process for sustaining sales across our catalog releases. Relative to our new releases, we spend lesser amounts on marketing for our catalog.
We maximize the value of our catalog of recorded music through our Rhino Entertainment business unit and through activities of each of our record labels. We use our catalog as a source of material for re-releases, compilations, box sets and special package releases, which provide consumers with incremental exposure to familiar music and recording artists. Rhino Entertainment also releases new music from legacy recording artists and markets and promotes the name and likeness of certain artist estates and brands.
Recording Artists’ Contracts
Our recording artists’ contracts define the commercial relationship between our recording artists and our record labels. We negotiate recording contracts with recording artists that define our rights to use the recording artists’ music. In accordance with the terms of the contract, the recording artists receive royalties based on sales and other uses of such recording artists’ music. We customarily provide up-front payments to recording artists called advances, which are recoupable by us from future royalties otherwise payable to such recording artists. We also typically pay costs associated with the recording and production of music, which in certain countries are treated as advances recoupable by us from future royalties. Our typical contract for a new recording artist covers a sufficient number of master recordings to constitute a single initial extended-play record (known as an EP) or an album and provides us with a series of options to acquire subsequent albums from the artist. Royalty rates and advances are often increased for subsequent albums for which we have exercised our options. Many of our contracts contain a commitment from the record label to fund video production costs, at least a portion of which in certain countries is treated as advances recoupable by us from future royalties.
Our recording contracts with established artists generally provide for greater advances and higher royalty rates. Typically, such contracts entitle us to fewer albums, and, of those, fewer are optional albums. In contrast to new artists’ contracts, which customarily give us ownership in the artist’s work for the full term of copyright, some established artists’ contracts provide us with an exclusive license for some fixed period of time. It is not unusual for us to renegotiate contract terms with a successful artist during the term of their existing contracts, sometimes in return for an increase in the number of albums that the artist is required to deliver.
With certain territorial or other exceptions, our recording contracts typically grant us ownership for the duration of copyright. See “Intellectual Property—Copyrights.” United States copyright law permits authors or their estates to terminate an assignment or license of copyright (for the United States only) after a set period of time in certain circumstances. See “Risk Factors—We face a potential loss of catalog to the extent that our recording artists have a right to recapture rights in their recordings under the U.S. Copyright Act.”
119
Table of Contents
We are also continuing to transition to other forms of business models with recording artists to adapt to changing industry conditions. Many of the recording contracts we currently enter into are expanded-rights deals, in which we share in the touring, merchandising, sponsorship, fan club or other ancillary music revenues associated with those artists.
Marketing and Promotion
Our approach to marketing and promoting our recording artists and their music is comprehensive. Our goal is to maximize the likelihood of success for new releases as well as to stimulate the success of catalog releases. We seek to increase the value of music and help our recording artists connect with their fans.
The marketing and promotion of recorded music is carefully coordinated to create the greatest sales momentum, while maintaining financial discipline. We have significant experience in our marketing and promotion departments, which we believe allows us to achieve an optimal balance between our marketing expenditure and the eventual sales of our artists’ recordings. We use a budget-based approach to plan marketing and promotions, and we monitor all expenditures related to each release to ensure compliance with the agreed-upon budget. These planning processes are regularly evaluated based on updated sales reports, streaming service data and radio airplay data, so that a promotion plan can be quickly adjusted if necessary.
Manufacturing, Packaging and Physical Distribution
We have arrangements with various suppliers and distributors as part of our manufacturing, packaging and physical distribution services throughout the world. In 2019, we switched to a new U.S. physical distribution supplier, which increased the supplier’s volume and has led to delays and other inventory issues. We believe that our manufacturing, packaging and physical distribution arrangements are sufficient to meet our business needs.
Sales and Digital Distribution
We generate revenues from the new releases of current artists and our catalog of recordings. In addition, we actively repackage music from our catalog to form new compilations. Our revenues are generated in digital formats including streaming and downloads, CD format, as well as through historical formats, such as vinyl albums.
In connection with the digital distribution of our music, we currently partner with a broad range of digital music services, such as Amazon, Apple, Deezer, KKBox, Spotify, Telefonica, Tencent Music Entertainment Group, YouTube and Google, and are actively seeking to develop and grow our digital business. We also sell traditional physical formats through both the online distribution arms of traditional retailers such as fye.com and walmart.com and traditional online physical retailers such as amazon.com, bestbuy.com and barnesandnoble.com. Streaming services stream our music on an ad-supported or paid subscription basis. In addition, downloading services download our music on a per-album or per-track basis. In digital formats, per-unit costs related directly to physical products such as manufacturing, distribution, inventory and return costs do not apply. While there are some digital-specific variable costs and infrastructure investments needed to produce, market and license digital products, it is reasonable to expect that we will generally derive a higher contribution margin from streaming and downloads than from physical sales. We sell our physical recorded music products through a variety of different retail and wholesale outlets including music specialty stores, general entertainment specialty stores, supermarkets, mass merchants and discounters, independent retailers and other traditional retailers. Although some of our retailers are specialized, many of our customers offer a substantial range of products other than music.
Most of our physical sales represent purchases by a wholesale or retail distributor. Our sale and return policies are in accordance with wholesaler and retailer requirements, applicable laws and regulations, territory and customer-specific negotiations and industry practice. We attempt to minimize the return of unsold product by working with retailers to manage inventory and SKU counts as well as by monitoring shipments and sell-through data.
120
Table of Contents
We enter into license agreements with digital music services to make our music available for access in digital formats (e.g., streaming and downloads). We then provide digital assets for our music to these services in an accessible form. Our license agreements with these services establish our fees for the distribution of our music, which vary based on the service. We typically receive accounting from these services on a monthly basis, detailing the distribution activity, with payments rendered on a monthly basis. Our license agreements with digital music services generally last one to three years. In fiscal year 2019, Recorded Music revenue earned under license agreements with our top two digital music accounts, Apple and Spotify, accounted for approximately 30% of our total revenues.
Since the emergence of digital formats, our business has become less seasonal in nature and driven more by the timing of our releases.
Music Publishing
While Recorded Music is focused on marketing, promoting, distributing and licensing a particular recording of a musical composition, Music Publishing is an intellectual property business focused on generating revenue from uses of the musical composition itself. In return for promoting, placing, marketing and administering the creative output of a songwriter, or engaging in those activities for other rightsholders, our Music Publishing business garners a share of the revenues generated from use of the musical compositions.
The operations of our Music Publishing business are conducted principally through Warner Chappell Music, our global music publishing company headquartered in Los Angeles, and through various subsidiaries, affiliates, and non-affiliated licensees and sub-publishers. We own or control rights to more than 1.4 million musical compositions, including numerous pop hits, American standards, folk songs and motion picture and theatrical compositions. Assembled over decades, our award-winning catalog includes over 80,000 songwriters and composers and a diverse range of genres including pop, rock, jazz, classical, country, R&B, hip-hop, rap, reggae, Latin, folk, blues, symphonic, soul, Broadway, techno, alternative and gospel. Warner Chappell Music also administers the music and soundtracks of several third-party television and film producers and studios. We have an extensive production music catalog collectively branded as Warner Chappell Production Music.
For each of the fiscal years ended September 30, 2019, September 30, 2018 and September 30, 2017, Music Publishing represented 14%, 16% and 16%, respectively, of consolidated revenues, before intersegment eliminations.
Music Publishing Royalties
Warner Chappell Music, as a copyright owner and administrator of musical compositions, is entitled to receive royalties for the use of musical compositions. We continually add new musical compositions to our catalog and seek to acquire rights in musical compositions that will generate substantial revenue over the long term.
Music publishers generally receive royalties pursuant to public performance, digital, mechanical, synchronization and other licenses. In the United States, music publishers collect and administer mechanical royalties, and statutory rates are established pursuant to the U.S. Copyright Act of 1976, as amended, for the royalty rates applicable to musical compositions for sale and licensing of recordings embodying those musical compositions. In the United States, public performance income is administered and collected by music publishers and their performing rights organizations and in most countries outside the United States, collection, administration and allocation of both mechanical and performance income are undertaken and regulated by governmental or quasi-governmental authorities. Throughout the world, each synchronization license is generally subject to negotiation with a prospective licensee and, by contract, music publishers pay a contractually required percentage of synchronization income to the songwriters or their heirs and to any co-publishers.
121
Table of Contents
Warner Chappell Music acquires copyrights or portions of copyrights and administration rights from songwriters or other third-party holders of rights in musical compositions. Typically, in either case, the grantor of rights retains a right to receive a percentage of revenues collected by Warner Chappell Music. As an owner and administrator of musical compositions, we promote the use of those musical compositions by others. For example, we encourage recording artists to record and include our musical compositions on their recordings, offer opportunities to include our musical compositions in filmed entertainment, advertisements and digital media and advocate for the use of our musical compositions in live stage productions. Examples of music uses that generate music publishing revenues include:
Performance: performance of the song to the general public
| • | Broadcast of musical compositions on television, radio and cable |
| • | Live performance at a concert or other venue (e.g., arena concerts, nightclubs) |
| • | Broadcast of musical compositions at sporting events, restaurants or bars |
| • | Performance of musical compositions in staged theatrical productions |
Digital: licensing of recorded music in various digital formats and digital performance of musical compositions to the general public
| • | Streaming and download services |
Mechanical: sale of recorded music in various physical formats
| • | Vinyl, CDs and DVDs |
Synchronization: use of the musical composition in combination with visual images
| • | Films or television programs |
| • | Television commercials |
| • | Video games |
| • | Merchandising, toys or novelty items |
Other:
| • | Licensing of copyrights for use in printed sheet music |
In the United States, mechanical royalties are collected directly by music publishers from recorded music companies or via The Harry Fox Agency, a non-exclusive licensing agent affiliated with the Society of European Stage Authors and Composers (“SESAC”), while outside the United States, mechanical royalties are collected directly by music publishers or from collecting societies. Once mechanical royalties reach the publisher, percentages of those royalties are paid or credited to the writer or other rightsholder of the copyright in accordance with the underlying rights agreement. Mechanical royalties are paid at a rate of 9.1 cents per song per unit in the United States for physical formats (e.g., CDs and vinyl albums) and permanent digital downloads (recordings in excess of five minutes attract a higher rate). There are also rates set for interactive streaming and non-permanent downloads based on a formula that takes into account revenues paid by consumers or advertisers with certain minimum royalties that may apply depending on the type of service. “Controlled composition” provisions contained in some recording contracts may apply to the rates mentioned above pursuant to which artist/songwriters license their rights to their record companies for as little as 75% of the statutory rates. The current U.S. statutory mechanical rates will remain in effect through December 31, 2022. In most other territories, mechanical royalties are based on a percentage of wholesale prices for physical formats and based on a percentage of consumer prices for digital formats. In international markets, these rates are determined by multi-year collective bargaining agreements and rate tribunals.
122
Table of Contents
Throughout the world, performance royalties are collected by publishers directly or on behalf of music publishers and songwriters by performance rights organizations and collecting societies. Key performing rights organizations and collecting societies include: The American Society of Composers, Authors and Publishers (“ASCAP”), SESAC and Broadcast Music, Inc. (“BMI”) in the United States; Mechanical-Copyright Protection Society and The Performing Right Society in the United Kingdom; The German Copyright Society in Germany and the Japanese Society for Rights of Authors, Composers and Publishers in Japan. The societies pay a percentage (which is set in each country) of the performance royalties to the copyright owner(s) or administrators (i.e., the publisher(s)), and a percentage directly to the songwriter(s), of the composition. Thus, the publisher generally retains the performance royalties it receives other than any amounts attributable to co-publishers.
Composers’ and Lyricists’ Contracts
Warner Chappell Music derives its rights through contracts with composers, lyricists (songwriters) or their heirs and with third-party music publishers. In some instances, those contracts grant either 100% or some lesser percentage of copyright ownership in musical compositions and/or administration rights. In other instances, those contracts only convey to Warner Chappell Music rights to administer musical compositions for a period of time without conveying a copyright ownership interest. Our contracts grant us exclusive use rights in the territories concerned excepting any pre-existing arrangements. Many of our contracts grant us rights on a global basis. Warner Chappell Music customarily possesses administration rights for every musical composition created by the writer or composer during the exclusive acquisition term of the contract.
While the duration of the administration rights under contracts may vary, some of our contracts grant us ownership and/or administration rights for the duration of copyright. See “—Intellectual Property—Copyrights.” U.S. copyright law permits authors or their estates to terminate an assignment or license of copyright (for the United States only) after a set period of time. See “Risk Factors—We face a potential loss of catalog to the extent that our recording artists have a right to recapture rights in their recordings under the U.S. Copyright Act.”
Competition
In our Recorded Music and Music Publishing businesses, we compete based on marketing (including both how we allocate our marketing resources as well as how much we spend on a dollar basis) and on recording artist and songwriter signings. We believe we currently compete favorably in these areas. Our Recorded Music business is also dependent on technological development, including access to, selection and viability of new technologies, and is subject to potential pressure from competitors as a result of their technological developments. Additionally, we compete, to a lesser extent, for disposable consumer income with alternative forms of entertainment, content and leisure activities, such as cable and satellite television, motion pictures and video games in physical and digital formats.
The recorded music industry is highly competitive based on consumer preferences and is rapidly changing. At its core, the recorded music business relies on artistic talent. As such, competitive strength is predicated upon the ability to continually develop and market new recording artists whose work gains commercial acceptance. According to Music and Copyright, in 2019, the three largest recorded music companies were Universal Music Group, Sony Music Entertainment and us, which collectively accounted for approximately 68% of global recorded music revenues. There are many mid-sized and smaller players in the industry that accounted for the remaining approximately 32%, including independent recorded music companies. Universal Music Group was the market leader with an approximately 32% global market share in 2019 after absorbing the bulk of the recorded music assets of the former EMI in late 2012, followed by Sony Music Entertainment with an approximately 20% share. We held an approximately 16% share of global recorded music revenues in 2019.
The music publishing industry is also highly competitive. The three largest music publishing companies collectively accounted for approximately 58% of the global market in 2019 according to Music & Copyright. According to Music & Copyright, Sony/ATV was the market leader in music publishing in 2019 with an
123
Table of Contents
approximately 25% share (reflecting its ownership of the EMI music publishing assets). Universal Music Publishing was the second-largest music publisher with an approximately 21% share, followed by us at approximately 12%. There are many mid-sized and smaller players in the industry that account for the remaining approximately 42%, including many individual songwriters who publish their own works.
Intellectual Property
Copyrights
Our business, like that of other companies involved in the music entertainment industry, rests on our ability to maintain rights in sound recordings and musical compositions through copyright protection. In the United States, copyright protection for works created as “works made for hire” (e.g., works of employees or certain specially commissioned works) on or after January 1, 1978 generally lasts for 95 years from first publication or 120 years from creation, whichever expires first. The period of copyright protection for works created on or after January 1, 1978 that are not “works made for hire” lasts for the life of the author plus 70 years. Works created and published or registered in the United States prior to January 1, 1978 generally enjoy copyright protection for 95 years, subject to compliance with certain statutory provisions including notice and renewal. Additionally, the MMA extended federal copyright protection in the U.S. to sound recordings created prior to February 15, 1972. The duration of copyright protection for such sound recordings varies based on the year of publication, with all such sound recordings receiving copyright protection for at least 95 years, and sound recordings published between January 1, 1957 and February 15, 1972 receiving copyright protection until February 15, 2067. The term of copyright in the E.U. for musical compositions in all member states lasts for the life of the author plus 70 years.
In the E.U., the term of copyright for sound recordings lasts for 70 years from the date of release in respect of sound recordings that were still in copyright on November 1, 2013 and for 50 years from date of release in respect of sound recordings the copyright in which had expired by that date. The E.U. also harmonized the copyright term for joint musical works. In the case of a musical composition with words that is protected by copyright on or after November 1, 2013, E.U. member states are required to calculate the life of the author plus 70 years term from the date of death of the last surviving author of the lyrics and the composer of the musical composition, provided that both contributions were specifically created for the musical composition.
We are largely dependent on legislation in each territory in which we operate to protect our rights against unauthorized reproduction, distribution, public performance or rental. In all territories where we operate, our intellectual property receives some degree of copyright protection, although the extent of effective protection varies widely. In a number of developing countries, the protection of copyright remains inadequate.
Technological changes have focused attention on the need for new legislation that will adequately protect the rights of producers. We actively lobby in favor of industry efforts to increase copyright protection and support the efforts of organizations such as RIAA, IFPI, National Music Publishers’ Association, International Confederation of Music Publishers and the World Intellectual Property Organization.
Trademarks
We consider our trademarks to be valuable assets to our business. Although we cannot assure you that our trademark applications, even for major trademarks, will be approved, we endeavor to register our major trademarks in every country where we believe the protection of these trademarks is important for our business. Our major trademarks include Asylum, Atlantic, Elektra, EMP, Parlophone, Reprise, Rhino, Sire, SPINNIN’ RECORDS, Warner Chappell and WEA, and their respective logos. We also use certain trademarks pursuant to a royalty-free license agreement. The duration of the license relating to the WARNER, WARNER MUSIC and WARNER RECORDS trademarks and “W” logo is perpetual, but may be terminated under certain limited circumstances, including our material breach of the license agreement and certain events of insolvency. We
124
Table of Contents
actively monitor and protect against activities that might infringe, dilute or otherwise harm our trademarks. However, the actions we take to protect our trademarks may not be adequate to prevent third parties from infringing, diluting, or otherwise harming our trademarks, and the laws of foreign countries may not protect our trademark rights to the same extent as do the laws of the United States.
Joint Ventures
We have entered into joint venture arrangements pursuant to which we or our various subsidiary companies distribute, market, promote, license and sell (in most cases, domestically and internationally) recordings and other rights owned by the joint ventures. An example of this arrangement is Frank Sinatra Enterprises, a joint venture established to administer licenses for use of Frank Sinatra’s name and likeness and manage all aspects of his music, film and stage content.
Employees
As of September 30, 2019, we employed approximately 5,400 persons worldwide, including temporary and part-time employees as well as employees that were added with the acquisition of EMP. As of such date, none of our employees in the United States were subject to a collective bargaining agreement, although certain employees in our non-domestic companies were covered by national labor agreements. We believe that our relationship with our employees is good.
Properties
We own studio and office facilities and also lease certain facilities in the ordinary course of business. Our principal executive offices and worldwide headquarters are currently located at 1633 Broadway, New York, New York 10019, under a long-term lease ending July 31, 2029. The lease also includes a single option for us to extend the term for either five years or ten years. In addition, under certain conditions, we have the ability to lease additional space in the building and have a right of first refusal with regard to certain additional space. On October 7, 2016, we entered into a lease agreement for new office space located in the Ford Factory Building at 777 S. Santa Fe Avenue, Los Angeles, California 90021 beginning on August 1, 2017 for an initial term of 12 years and 9 months with a single option to extend the term of the lease for 10 years. This office space is currently used as our Los Angeles, California headquarters. We also own other property and lease facilities elsewhere throughout the world as necessary to operate our businesses. We consider our properties adequate for our current needs.
Legal Proceedings
SiriusXM
On September 11, 2013, the Company joined with Capitol Records, LLC, Sony Music Entertainment, UMG Recordings, Inc. and ABKCO Music & Records, Inc. in a lawsuit brought in California Superior Court against SiriusXM Radio Inc., alleging copyright infringement for SiriusXM’s use of pre-1972 sound recordings under California law. A nation-wide settlement was reached on June 17, 2015 pursuant to which SiriusXM paid the plaintiffs, in the aggregate, $210 million on July 29, 2015 and the plaintiffs dismissed their lawsuit with prejudice. The settlement resolved all past claims as to SiriusXM’s use of pre-1972 recordings owned or controlled by the plaintiffs and enabled SiriusXM, without any additional payment, to reproduce, perform and broadcast such recordings in the United States through December 31, 2017. The allocation of the settlement proceeds among the plaintiffs was determined and the settlement proceeds were distributed accordingly. This resulted in a cash distribution to the Company of $33 million of which $28 million was recognized in revenue during the 2016 fiscal year and $4 million was recognized in revenue during the 2017 fiscal year. The balance of $1 million was recognized in the first quarter of the 2018 fiscal year. The Company is sharing its allocation of the settlement proceeds with its artists on the same basis as statutory revenue from SiriusXM is shared, i.e., the artist share of our allocation will be paid to artists by SoundExchange.
125
Table of Contents
As part of the settlement, plaintiffs agreed to negotiate in good faith to grant SiriusXM a license to publicly perform the plaintiffs’ pre-1972 sound recordings for the five-year period running from January 1, 2018 to December 31, 2022. Pursuant to the settlement, if the parties were unable to reach an agreement on license terms, the royalty rate for each license would be determined by binding arbitration on a willing buyer/willing seller standard. On December 21, 2017, SiriusXM commenced a single arbitration against all of the plaintiffs in California through JAMS to determine the rate for the five-year period. On May 1, 2018, the Company filed a lawsuit against SiriusXM in New York state court to stay the California arbitration and to compel a separate arbitration in New York solely between SiriusXM and the Company. On August 23, 2018, the Company filed a Stipulation of Discontinuance without Prejudice as to the New York state court action after SiriusXM agreed to participate in a separate arbitration with the Company in New York if the parties were unable to reach an agreement on pre-1972 license terms. On March 28, 2019, the Company and SiriusXM entered into an agreement granting SiriusXM a license to publicly perform the Company’s pre-1972 sound recordings for the five-year period running from January 1, 2018 to December 31, 2022.
Other Matters
In addition to the matter discussed above, the Company is involved in various litigation and regulatory proceedings arising in the normal course of business. Where it is determined, in consultation with counsel based on litigation and settlement risks, that a loss is probable and estimable in a given matter, the Company establishes an accrual. In the currently pending proceedings, the amount of accrual is not material. An estimate of the reasonably possible loss or range of loss in excess of the amounts already accrued cannot be made at this time due to various factors typical in contested proceedings, including (1) the results of ongoing discovery; (2) uncertain damage theories and demands; (3) a less than complete factual record; (4) uncertainty concerning legal theories and their resolution by courts or regulators; and (5) the unpredictable nature of the opposing party and its demands. However, the Company cannot predict with certainty the outcome of any litigation or the potential for future litigation. As such, the Company continuously monitors these proceedings as they develop and adjusts any accrual or disclosure as needed. Regardless of the outcome, litigation could have an adverse impact on the Company, including the Company’s brand value, because of defense costs, diversion of management resources and other factors, and it could have a material effect on the Company’s results of operations for a given reporting period.
126
Table of Contents
The following table sets forth certain information concerning our executive officers and directors. The respective age of each individual in the table below is as of May 1, 2020.
| Name |
Age |
Position | ||||
| Stephen Cooper |
73 | Chief Executive Officer; Director | ||||
| Max Lousada |
46 | Chief Executive Officer, Recorded Music; Director | ||||
| Eric Levin |
57 | Executive Vice President and Chief Financial Officer | ||||
| Carianne Marshall |
42 | Co-Chair and Chief Operating Officer, Warner Chappell Music | ||||
| Guy Moot |
54 | Co-Chair and Chief Executive Officer, Warner Chappell Music | ||||
| Maria Osherova |
54 | Executive Vice President, Chief Human Resources Officer | ||||
| Paul M. Robinson |
61 | Executive Vice President and General Counsel and Secretary | ||||
| Oana Ruxandra |
38 | Executive Vice President of Business Development and Chief Digital Officer | ||||
| James Steven |
43 | Executive Vice President, Chief Communications Officer | ||||
| Michael Lynton |
60 | Chairman of the Board | ||||
| Len Blavatnik |
62 | Vice Chairman of the Board | ||||
| Lincoln Benet |
56 | Director | ||||
| Alex Blavatnik |
55 | Director | ||||
| Mathias Döpfner |
57 | Director | ||||
| Noreena Hertz |
52 | Director | ||||
| Ynon Kreiz |
55 | Director | ||||
| Thomas H. Lee |
76 | Director | ||||
| Donald A. Wagner |
56 | Director | ||||
Executive Officers
Our executive officers are appointed by, and serve at the discretion of, our board of directors. Each executive officer is an employee of the Company or one of its subsidiaries. The following information provides a brief description of the business experience of each of our executive officers and directors. The current executive officers are as follows:
Stephen Cooper, Chief Executive Officer
Mr. Cooper has served as a director since July 20, 2011 and as our CEO since August 18, 2011. Previously, Mr. Cooper was our Chairman of the Board from July 20, 2011 to August 18, 2011. Mr. Cooper is a member of the Board of Directors of LyondellBasell, one of the world’s largest olefins, polyolefins, chemicals and refining companies. He has more than 30 years of experience as a financial advisor, and has served as Chief Executive Officer of Metro-Goldwyn-Mayer, Inc.; Chief Executive Officer of Hawaiian Telcom; Executive Chairman of Blue Bird Corporation; Executive Chairman of the Board of Collins & Aikman Corporation; Chief Executive Officer of Krispy Kreme Doughnuts; and Chief Executive Officer and Chief Restructuring Officer of Enron Corporation. Mr. Cooper also serves on the Board of Directors of LyondellBasell Industries N.V. Mr. Cooper is also the Managing Partner of Cooper Investment Partners, a private equity firm.
Mr. Cooper brings beneficial experience and attributes to our board of directors, including more than 30 years of experience as a financial advisor, and his experience having served as chairman or chief executive officer of various businesses, including Chief Executive Officer of Metro-Goldwyn-Mayer, Inc. and Chief Executive Officer of Hawaiian Telcom.
Max Lousada, Chief Executive Officer, Recorded Music
Mr. Lousada has served as a director since October 1, 2017 and as our CEO, Recorded Music, since October 1, 2017. He oversees the Company’s worldwide Recorded Music business, including Atlantic, Warner Records, Elektra,
127
Table of Contents
Parlophone, Warner Music Nashville, Global Catalog/Rhino and Warner Classics, as well as the Company’s international Recorded Music affiliates and WMG’s Artist & Label Services divisions, WEA Corp. and ADA. Before taking his latest role, Mr. Lousada was the Chairman & CEO of Warner Music UK, where he was responsible for overseeing the Company’s U.K. family of labels during a four-year run of record-breaking success. In addition, he served as Chairman of the BRITs Committee from 2014 to 2016. Mr. Lousada previously headed up Atlantic Records UK for nine years, where he built an award-winning team and roster of artists. Prior to his tenure at Atlantic Records UK, Mr. Lousada led A&R at Mushroom Records.
Mr. Lousada brings beneficial experience and attributes to our board of directors, including his experience managing the Recorded Music business on a day-to-day basis, which provides him with intimate knowledge of our operations, and his significant experiences in the entertainment industry, advising and managing companies.
Eric Levin, Executive Vice President and Chief Financial Officer
Mr. Levin has served as our Executive Vice President and Chief Financial Officer since October 13, 2014. From October 2012 to June 2014, he served as the financial director of Ecolab (China) Investment Co. Ltd, a multinational technology and manufacturing group in China. From May 1988 to December 2001, he worked in various financial functions at Home Box Office, Inc., a subsidiary of Time Warner, and was promoted to CFO from January 2000 to December 2001. Thereafter and until 2011, he served in various operational and financial roles in companies in the media and publishing industry. From 2004 to 2007, he was the Co-Founder and CEO of City on Demand, LLC, a television production company. From 2009 to 2011, Mr. Levin was CFO at SCMP Group Limited, a company listed on the Hong Kong Stock Exchange, which is a leading Asia media holding company, and joined the board of The Post Publishing Public Company Limited, a company listed on the Stock Exchange of Thailand, which publishes newspapers and magazines. Mr. Levin obtained a B.S. in Electrical Engineering from the University of Pennsylvania in May 1984 and an M.B.A. in finance and economics from the University of Chicago Graduate School of Business in March 1988.
Carianne Marshall, Co-Chair and Chief Operating Officer, Warner Chappell Music
Ms. Marshall has served as Co-Chair and Chief Operating Officer of Warner Chappell Music since January 2019. Ms. Marshall joined Warner Chappell in June 2018 as Chief Operating Officer of Warner Chappell. Prior to joining Warner Chappell in June 2018, she was Partner, Head of Creative Services, and Head of Creative Licensing at SONGS, the noted independent music publisher, which she joined in 2006. Ms. Marshall served as SONGS’ executive leader on the West Coast, helping to build a roster of over 300 songwriters and overseeing a creative licensing staff responsible for placing compositions by SONGS’ writers in all forms of visual media and overseeing the non-top 40 roster. From 2003 to 2006, Ms. Marshall was Director of Motion Picture and Television Music for Universal Music Publishing Group, and, from 2000 to 2003, she worked at DreamWorks Music Publishing, where she was an A&R coordinator and subsequently the company’s synchronization executive. Ms. Marshall also held previous roles at Elektra Records and Universal Music Publishing. Ms. Marshall began her career in the music entertainment industry at Los Angeles-based VOX Productions, where she worked in live music production, while helping manage and book local bands. Ms. Marshall obtained a B.A. degree in Communications from the University of Southern California.
Guy Moot, Co-Chair and Chief Executive Officer, Warner Chappell Music
Mr. Moot has served as Co-Chair and Chief Executive Officer of Warner Chappell Music since April 1, 2019. From 2017 until 2019, Mr. Moot served as President of Worldwide Creative at Sony/ATV, where he led the company’s efforts to seek out the best songwriting talent, regardless of their country of origin. From 2005 to 2017, Mr. Moot was Managing Director of EMI Music Publishing UK and President of European Creative where his leadership played a key role in ensuring that EMI was named Music Week Publisher of the Year for fourteen years running. During that time, Mr. Moot led the Sony/ATV and EMI Music Publishing merger across Europe in 2012, and, from 2016 to 2017, he led the company to a record-breaking, year-long hold on the UK Number 1
128
Table of Contents
Singles spot. From 2003 to 2005, Mr. Moot was EMI Music Publishing’s Executive Vice President of A&R for the U.K. and Europe.
Maria Osherova, Executive Vice President, Chief Human Resources Officer
Ms. Osherova has served as our Executive Vice President, Chief Human Resources Officer since July 29, 2014. Ms. Osherova joined the Company in 2006 as Vice President, Human Resources for Warner Music International, based in London. Advancing to Senior Vice President of Warner Music International, she played a pivotal role in the successful integration of Parlophone Label Group within the Company. Prior to joining the Company, Ms. Osherova was Global HR Manager for a division of Shell International Petroleum, where she headed a department responsible for employees in over 120 countries. She previously held several posts at The Coca-Cola Company, based variously in Copenhagen, Oslo, and St. Petersburg. Osherova studied at St. Petersburg State Technical University, where she was awarded a Master of Sciences degree.
Paul M. Robinson, Executive Vice President and General Counsel and Secretary
Mr. Robinson has served as our Executive Vice President and General Counsel and Secretary since December 2006. He is responsible for our worldwide legal and business affairs and public policy functions. Mr. Robinson joined the Company’s legal department in 1995. From 1995 to December 2006, Mr. Robinson held various positions with the Company, including Acting General Counsel and Senior Vice President, Deputy General Counsel. Before joining the Company, Mr. Robinson was a partner in the New York City law firm Mayer, Katz, Baker, Leibowitz & Roberts. Mr. Robinson has a B.A. in English from Williams College and a J.D. from Fordham University School of Law.
Oana Ruxandra, Executive Vice President of Business Development and Chief Digital Officer
Ms. Ruxandra has served as Executive Vice President of Business Development and Chief Digital Officer since April 2020. In such capacity, Ms. Ruxandra oversees global business development and digital strategy for the Company, with a focus on exploring new forms of commercial innovation and creating new digital revenue opportunities. From December 2018 to April 2020, Ms. Ruxandra served as Executive Vice President, New Business Channels—Chief Acquisition Officer, a role that required her to attract non-traditional partners and identify unconventional M&A opportunities and from June 2019 to April 2020, she served as interim head of business development for our Recorded Music business. From 2016 until December 2018, she served as Senior Vice President of Digital Strategy and Partnerships at Universal Music Group, prior to which she spent four years at the Company, advancing to Vice President of Digital Strategy and Business Development. Ms. Ruxandra previously spent seven years in the financial industry at firms such as BlackRock and Constellation Capital Management. Ms. Ruxandra received her B.A. in Economics and Political Science from Columbia University and her M.B.A. from The Wharton School at the University of Pennsylvania.
James Steven, Executive Vice President, Chief Communications Officer
Mr. Steven has served as Executive Vice President, Chief Communications Officer since January 1, 2015. He is responsible for our worldwide communications and corporate marketing functions, including external and internal communications, investor relations, social responsibility and special events. He also oversees the interaction and coordination of the communications functions of our operating companies. Mr. Steven joined the Company in 2007 as part of the Company’s international communications team based in London. He relocated to New York in 2012, becoming Senior Vice President, Communications and Marketing. Prior to joining the Company, Mr. Steven held various roles at public relations and marketing agencies, including Cow PR and Consolidated PR, working with clients in the film, TV, technology, retail, beverages and automobile industries. Mr. Steven holds an M.A. (Honors) degree from the University of Edinburgh.
129
Table of Contents
Directors
Michael Lynton
Mr. Lynton has served as Chairman of the Board of the Company since February 7, 2019. Mr. Lynton also currently serves as Chairman of the Board of Snap, Inc., a position he has held since 2016 after joining Snap Inc.’s board in 2013. Mr. Lynton also currently serves as Chairman of the Board of Directors of Schrödinger, Inc., a position he has held since October 2018 after joining the board of directors of Schrödinger, Inc. in January 2018, and is a member of the board of directors of Pearson plc. and Ares Management, L.P. Previously, Mr. Lynton served as the CEO of Sony Entertainment from April 2012 until February 2017, overseeing Sony’s global entertainment businesses, including Sony Music Entertainment, Sony/ATV Music Publishing and Sony Pictures Entertainment. Mr. Lynton also served as Chairman and CEO of Sony Pictures Entertainment since January 2004. Prior to joining Sony Pictures, Mr. Lynton worked for Time Warner, and from 2000 to 2004, he served as CEO of AOL Europe, President of AOL International and President of Time Warner International. From 1996 to 2000, Mr. Lynton served as Chairman and CEO of Pearson plc’s Penguin Group where he oversaw the acquisition of Putnam, Inc. and extended the Penguin brand to music and the Internet. Mr. Lynton joined the Walt Disney Company in 1987, and from 1992 to 1996, he served as President of Disney’s Hollywood Pictures. Mr. Lynton is also a member of the Harvard Board of Overseers and serves on the boards of the Los Angeles County Museum of Art, the Tate, and the Rand Corporation. Mr. Lynton holds a B.A. in History and Literature from Harvard College and received his M.B.A. from Harvard University.
Mr. Lynton brings beneficial experience and attributes to our board of directors, including his various experiences in the entertainment industry, advising and managing companies.
Len Blavatnik
Mr. Blavatnik has served as a director and as Vice Chairman of the Board of the Company since July 20, 2011. Mr. Blavatnik is the founder and Chairman of Access, a privately held, U.S. industrial group with global strategic investments. He previously served as a member of the Company’s board of directors from March 2004 to January 2008. Mr. Blavatnik provides financial support to, and remains engaged in, many educational pursuits. Mr. Blavatnik is a member of boards at Oxford University and Tel Aviv University, and is a member of Harvard University’s Committee on University Resources, Global Advisory Council and the Task Force on Science and Engineering. In 2010, the Blavatnik Family Foundation committed £75 million to establish the Blavatnik School of Government at the University of Oxford. Mr. Blavatnik and the Blavatnik Family Foundation have also been generous supporters of other leading educational, scientific, cultural and charitable institutions throughout the world. Mr. Blavatnik is a member of the board of directors of the 92nd Street Y in New York, The Mariinsky Foundation of America, The Carnegie Hall Society, Inc. and The Center for Jewish History in New York. He is also a Trustee of the State Hermitage Museum in St. Petersburg, Russia. Mr. Blavatnik emigrated to the U.S. in 1978 and became a U.S. citizen in 1984. He received his Master’s degree from Columbia University in 1981 and his M.B.A. from Harvard Business School in 1989. Mr. Blavatnik is the brother of Alex Blavatnik.
Mr. Blavatnik brings beneficial experience and attributes to our Board, among which is his extensive experience advising companies, particularly as founder and Chairman of Access and in his role as a former director of UC Rusal plc and TNK-BP Limited. In addition, Mr. Blavatnik possesses experience in advising and managing publicly traded and privately held enterprises and has significant expertise with the corporate finance and strategic business planning activities that are unique to leveraged companies.
Lincoln Benet
Mr. Benet has served as a director since July 20, 2011. Mr. Benet is the Chief Executive Officer of Access. Prior to joining Access in 2006, Mr. Benet spent 17 years at Morgan Stanley, most recently as a Managing Director. His experience spans corporate finance, mergers and acquisitions, fixed income and capital markets. Mr. Benet is a member of the Supervisory Board of Directors for LyondellBasell Industries N.V. and a member
130
Table of Contents
of the boards of DAZN Group Limited and, until 2019, Clal Industries Ltd. Mr. Benet graduated summa cum laude with a B.A. in Economics from Yale University and received his M.B.A. from Harvard Business School.
Mr. Benet brings beneficial experience and attributes to our board of directors, among which is his extensive experience advising companies, in particular as the Chief Executive Officer of Access, in his role as a director of LyondellBasell Industries N.V. and in his former role as director of Clal Industries Ltd. In addition, Mr. Benet possesses experience in advising and managing publicly traded and privately held enterprises and has significant expertise with the corporate finance and strategic business planning activities that are unique to leveraged companies.
Alex Blavatnik
Mr. Blavatnik has served as a director since July 20, 2011. Mr. Blavatnik is an Executive Vice President and Vice Chairman of Access. A 1993 graduate of Columbia University, Mr. Blavatnik joined Access in 1996 to manage the Company’s growing activities in Russia. Currently, he oversees Access’s operations out of its New York-based headquarters and serves as a director of various companies in the Access global portfolio. In addition, Mr. Blavatnik is engaged in numerous philanthropic pursuits and sits on the boards of several educational and charitable institutions. Mr. Blavatnik is the brother of Len Blavatnik.
Mr. Blavatnik brings beneficial experience and attributes to our board of directors, among which is his extensive experience advising companies, particularly as Vice Chairman of Access, as a director of Clal Industries Ltd. and, previously, as a director of OGIP Ventures, Ltd. In addition, Mr. Blavatnik possesses experience in advising and managing publicly traded and privately held enterprises and has significant expertise with the corporate finance and strategic business planning activities that are unique to leveraged companies.
Mathias Döpfner
Mr. Döpfner has served as a director since May 1, 2014. Mr. Döpfner is Chairman and CEO of German media group Axel Springer SE in Berlin. Holding a stake of about 3%, Mr. Döpfner is also one of the company’s largest shareholders. Axel Springer is the leading digital publisher in Europe and is active in more than 40 countries. Publishing brands include BILD, WELT and BUSINESS INSIDER. Since Mr. Döpfner became CEO in 2002, Axel Springer revenues from digital activities increased from €117 million to €2.3 billion and worldwide digital audience expanded to more than 300 million users. Mr. Döpfner is also a member of the Board of Directors of Netflix Inc.
Mr. Döpfner brings beneficial experience and attributes to our board of directors, including his extensive experience in the media industry. In addition, through his positions as Chairman and CEO of Axel Springer, he has a profound understanding of the challenges and developments of today’s business, such as content creation and monetization or distribution and digital platforms.
Noreena Hertz
Professor Hertz has served as a director since September 15, 2017 and previously served as a director from May 1, 2014 through May 22, 2016. Professor Hertz advises some of the biggest organizations and most senior figures in the world on strategy, decision-making, corporate social responsibility and global economic and geo-political trends. Her best-selling books, Eyes Wide Open, the Silent Takeover and IOU: The Debt Threat, have been published in 22 countries. Professor Hertz served as a member of Citigroup’s Politics and Economics Global Advisory Board between 2007 and 2008 and as a member of the Advisory Group steering McKinsey CEO Dominic Barton’s Inclusive Capitalism Taskforce between 2012 and 2013. A much sought-after commentator on television and radio Hertz contributes to a wide range of publications and networks including The BBC, CNN, CNBC, CBS, ITV, The New York Times, The Wall Street Journal, The Daily Beast, the Financial Times, the Guardian, The Washington Post, The Times of London, Wired, and Nature. She has given
131
Table of Contents
Keynote Speeches at TED and The World Economic Forum, as well as for leading global corporations, and has shared platforms with such luminaries as President Bill Clinton and James Wolfensohn. An influential economist on the international stage, Professor Hertz also played a pivotal role in the development of (RED), an innovative commercial model to raise money for people with AIDS in Africa, having inspired Bono (co-founder of the project) with her writings. Professor Hertz has been described by the Observer as “one of the world’s leading young thinkers,” Vogue as “one of the world’s most inspiring women” and was featured on the cover of Newsweek’s September 30, 2013 issue in Europe, Asia and the Middle East. She has an M.B.A. from the Wharton School of the University of Pennsylvania and a Ph.D. from the University of Cambridge. Having spent 10 years at the University of Cambridge as Associate Director of the Centre for International Business and Management, in 2014 she moved to University College London where she is a Visiting Professor at the Institute for Global Prosperity.
Professor Hertz brings beneficial experience and attributes to our board of directors, including over 25 years of experience in advising companies in a variety of sectors and geographies on strategic and policy decisions, intelligence gathering and analysis, millennials and post-millennials and stakeholder management and corporate social responsibility. In addition, Ms. Hertz has also held senior academic positions where her research has focused on decision-making, risk assessment and management, globalization, innovation and corporate social responsibility.
Ynon Kreiz
Mr. Kreiz has served as a director since May 9, 2016. Since April 26, 2018, Mr. Kreiz has been the Chairman and CEO of Mattel, Inc. (NASDAQ: MAT), one of the world’s largest toy companies. From March 2012 to January 2016, Mr. Kreiz served as the Chairman and CEO of Maker Studios, a global leader in online short-form video and one of the largest content networks on YouTube. From June 2008 to June 2011, Mr. Kreiz was Chairman and CEO of Endemol Group, one of the world’s largest independent television production companies. From 2005 to 2007, Mr. Kreiz was a General Partner at Balderton Capital (formerly Benchmark Capital Europe). From 1996 to 2002, Mr. Kreiz was co-founder, Chairman and CEO of Fox Kids Europe N.V., a leading pay-TV channel in Europe and the Middle East, broadcasting in 56 countries. FKE was listed on the Euronext Stock Exchange in Amsterdam in 1999. Mr. Kreiz holds a B.A. in Economics and Management from Tel Aviv University and an M.B.A. from UCLA’s Anderson School of Management, where he currently serves on the Board of Advisors.
Mr. Kreiz brings beneficial experience and attributes to our board of directors, including his extensive experience advising and managing companies, having served as Chairman and CEO of Maker Studios and the Endemol Group and also as a general partner at Balderton Capital (formerly Benchmark Capital Europe).
Thomas H. Lee
Mr. Lee has served as a director since August 17, 2011. Mr. Lee had previously served as our director from March 4, 2004 to July 20, 2011. He is Chairman and CEO of Thomas H. Lee Capital, LLC, Chairman of Lee Equity Partners, LLC and Chairman of AGL Credit Management LP. In 1974, Mr. Lee founded the Thomas H. Lee Company, the predecessor of Thomas H. Lee Partners, L.P., and from that time until March 2006 served as its Chairman and CEO. From 1966 through 1974, Mr. Lee was with First National Bank of Boston where he directed the bank’s high technology lending group from 1968 to 1974 and became a Vice President in 1973. Prior to 1966, Mr. Lee was a securities analyst in the institutional research department of L.F. Rothschild in New York. Mr. Lee serves or has served, including during the past five years, as a director of numerous public and private companies in which he and his affiliates have invested, including MidCap Financial LLC, Papa Murphy’s International, LLC, Edelman Financial Services, LLC, Aimbridge Hospitality Holdings LLC and KMAC Enterprises Inc. Mr. Lee is currently a Trustee of Lincoln Center for the Performing Arts, NYU Langone Medical Center and the New York City Police Foundation among other civic and charitable organizations. He also serves on the Executive Committee for Harvard University’s Committee on University Resources. Mr. Lee is a 1965 graduate of Harvard College.
132
Table of Contents
Mr. Lee brings beneficial experience and attributes to our board of directors, including his extensive experience advising and managing companies, serving as the Chairman and CEO of Thomas H. Lee Capital, LLC, Thomas H. Lee Capital Management, LLC and Lee Equity Partners, LLC and serving as or having served as a director of numerous public and private companies. In addition, Mr. Lee was also part of the investor group that acquired the Company from Time Warner in the 2004 acquisition and was a director of our company from March 2004 until July 2011, before subsequently rejoining our board of directors in August 2011, and has a detailed understanding of our company.
Donald A. Wagner
Mr. Wagner has served as a director since July 20, 2011. Mr. Wagner is a Managing Director of Access, having been with Access since 2010. He oversees Access’s North America direct investing activities. From 2000 to 2009, Mr. Wagner was a Senior Managing Director of Ripplewood Holdings L.L.C., responsible for investments in several areas and heading the industry group focused on investments in basic industries. Previously, Mr. Wagner was a Managing Director of Lazard Freres & Co. LLC and had a 15-year career at that firm and its affiliates in New York and London. He is a board member of Calpine Corporation, BMC Software and EP Energy and was on the board of NYSE-listed RSC Holdings from November 2006 until August 2009. Mr. Wagner graduated summa cum laude with an A.B. in physics from Harvard College.
Mr. Wagner brings beneficial experience and attributes to our board of directors, among which is his experience serving as a director of various companies, including public companies, and over 25 years of experience in investing, banking and private equity. In addition, Mr. Wagner possesses experience in advising and managing publicly traded and privately held enterprises and has significant expertise with the corporate finance and strategic business planning activities that are unique to leveraged companies.
Corporate Governance
Board Composition and Director Independence
Our board of directors is currently composed of 11 directors. Our directors will be elected annually to serve until the next annual meeting of stockholders or until their successors are duly elected and qualified.
The Stockholder Agreement with Access will provide Access with certain rights relating to the composition of our board of directors. See “Certain Relationships and Related Party Transactions—Relationship with Access Following this Offering—Stockholder Agreement.”
Subject to the provisions of the Stockholder Agreement, the number of members on our board of directors may be fixed by majority vote of the members of our board of directors. Any vacancy in the Board that results from (x) the death, disability, resignation or disqualification of any director shall be filled by an affirmative vote of at least a majority of the directors then in office, even if less than a quorum, or by a sole remaining director and (y) an increase in the number of directors or the removal of any director shall be filled (a) until the first date on which Access ceases to beneficially own more than 50% of the total combined voting power of our common stock, solely by an affirmative vote of the holders of at least a majority of the total combined voting power of our outstanding common stock entitled to vote in an election of directors and (b) from and after the first date on which Access ceases to beneficially own more than 50% of the total combined voting power of our common stock, by an affirmative vote of at least a majority of the directors then in office, even if less than a quorum, or by a sole remaining director. Each director shall hold office until his or her successor has been duly elected and qualified, or until his or her earlier death, resignation or removal.
Our board of directors has determined that Messrs. Lynton, Döpfner, Kreiz and Lee and Ms. Hertz are “independent” as defined under Nasdaq rules and the Exchange Act rules and regulations.
133
Table of Contents
Controlled Company
After the consummation of this offering, Access and its affiliates will hold approximately 99.2% of the total combined voting power of our outstanding common stock (or approximately 99.1% if the underwriters exercise in full their option to purchase additional shares from the selling stockholders) through their ownership of all of the Class B common stock. Accordingly, we will be a “controlled company” within the meaning of Nasdaq corporate governance standards. Under Nasdaq rules, a company of which more than 50% of the voting power is held by an individual, group or another company is a “controlled company” and may elect not to comply with certain Nasdaq corporate governance standards, including:
| • | the requirement that a majority of the members of our board of directors be independent directors; |
| • | the requirement that we have a compensation committee that is composed entirely of independent directors; |
| • | the requirement that our nominating and corporate governance committee be composed entirely of independent directors; and |
| • | the requirement for an annual performance evaluation of the nominating and corporate governance and compensation committees. |
Following this offering, we will use these exemptions. Accordingly, you may not have the same protections afforded to stockholders of companies that are subject to all of Nasdaq corporate governance rules and requirements. The “controlled company” exception does not modify audit committee independence requirements of Rule 10A-3 under the Exchange Act and Nasdaq rules.
Board Committees
Upon the listing of our Class A common stock our board of directors will maintain an Audit Committee, a Compensation Committee, a Nominating and Corporate Governance Committee, an Executive Committee and a Finance Committee. Until the date Access ceases to beneficially own at least 50% of the total combined voting power of our common stock, Access will have the right to designate Access-designated directors for appointment to each of the foregoing committees, subject to applicable law. Following such date, Access will be entitled to representation on each committee equal to the number of Access-designated director(s) that is as close as possible to Access’s proportional voting power in the Company (with any fractional amounts to be rounded up). Under Nasdaq rules, our Audit Committee will be required to be composed entirely of independent directors within one year from the date of this prospectus. As a controlled company, we are not required to have independent Compensation or Nominating and Corporate Governance Committees. The following is a brief description of our committees.
Audit Committee
The primary purposes of the Audit Committee will be to: (i) to assist our board of directors in overseeing (a) the quality and integrity of our financial statements; (b) the qualifications, independence and performance of our independent auditor; (c) the evaluation and management of the Company’s financial risks; (d) our accounting, financial and external reporting policies and practices; (e) the performance of our internal audit function; and (f) our compliance with legal and regulatory requirements, including without limitation any requirements promulgated by the Public Company Accounting Oversight Board and the Financial Accounting Standards Board; and (ii) to prepare the report of the Audit Committee required to be included in our annual proxy statement. The charter of our Audit Committee will be available without charge on the investor relations portion of our website upon the listing of our Class A common stock.
Upon consummation of this offering, we expect the members of our Audit Committee to be Donald A. Wagner (chair), Ynon Kreiz and Thomas H. Lee. Our board of directors has designated
134
Table of Contents
Messrs. Wagner, Kreiz and Lee as “audit committee financial experts,” and Messrs. Wagner, Kreiz and Lee has been determined to be “financially literate” under Nasdaq rules. Each member of the Audit Committee is able to read and understand fundamental financial statements, including a balance sheet, income statement and cash flow statement, as such qualification is interpreted by our board of directors in its business judgment. Our board of directors has also determined that Messrs. Kreiz and Lee are “independent” as defined under Nasdaq and Exchange Act rules and regulations.
Compensation Committee
The primary purpose of the Compensation Committee will be to: (i) be responsible for general oversight of compensation and compensation related matters; (ii) prepare any report on executive compensation required by the rules and regulations of the SEC for inclusion in our annual proxy statement; and (iii) take such other actions relating to our compensation and benefits structure as the Compensation Committee deems necessary or appropriate. The charter of our Compensation Committee will be available without charge on the investor relations portion of our website upon the listing of our Class A common stock.
Upon consummation of this offering, we expect the members of our Compensation Committee to be Lincoln Benet (chair), Alex Blavatnik, Len Blavatnik, Mathias Döpfner and Thomas H. Lee. Our board of directors has also determined that Messrs. Lee and Döpfner are “independent” as defined under Nasdaq and Exchange Act rules and regulations. In light of our status as a “controlled company” within the meaning of the corporate governance standards of Nasdaq following this offering, we are exempt from the requirement that our Compensation Committee be composed entirely of independent directors under listing standards applicable to membership on the Compensation Committee. We intend to establish a sub-committee of our Compensation Committee consisting of Messrs. Lee and Döpfner for purposes of approving any equity-based compensation that we may wish to qualify for the exemption provided under Rule 16b-3 under the Exchange Act.
Nominating and Corporate Governance Committee
Our Nominating and Corporate Governance Committee will be responsible, among its other duties and responsibilities, for: (i) identifying individuals qualified and suitable to become members of our board of directors and recommending to our board of directors the director nominees for each annual meeting of stockholders; (ii) developing and recommending to our board of directors a set of corporate governance principles applicable to us; and (iii) otherwise taking a leadership role in shaping our corporate governance policies. The charter of our Nominating and Corporate Governance Committee will be available without charge on the investor relations portion of our website upon the completion of this offering.
Upon consummation of this offering, we expect the members of our Nominating and Corporate Governance Committee to be Lincoln Benet (chair), Len Blavatnik, Noreena Hertz and Donald A. Wagner. Our board of directors has also determined that Ms. Hertz is “independent” as defined under Nasdaq and Exchange Act rules and regulations. In light of our status as a “controlled company” within the meaning of the corporate governance standards of Nasdaq following this offering, we are exempt from the requirement that our Nominating and Corporate Governance Committee be composed entirely of independent directors.
Executive Committee
Until Access no longer holds more than 50% of the total combined voting power of our common stock, our Executive Committee, as the Company’s governing body, will be vested with all of the powers of our board of directors (under applicable law) in the management of our business and affairs and will act in lieu of our board of directors to the fullest extent permitted by applicable law.
Upon consummation of this offering, we expect the members of our Executive Committee to be Michael Lynton (chair), Len Blavatnik, Lincoln Benet and Donald A. Wagner.
135
Table of Contents
Actions taken by the Executive Committee remain subject to a director’s or officer’s, as applicable, fiduciary duties under Delaware law and the requirement to act in the best interests of the Company and its stockholders. Once Access no longer holds more than 50% of the total combined voting power of our common stock, the Executive Committee will be dissolved.
Finance Committee
The primary purpose of the Finance Committee is to assist our board of directors in fulfilling its oversight of management’s responsibilities with respect to financial matters and the Company’s capital structure, including declaration of dividends and strategies that bear upon our long-term financial sustainability.
Upon consummation of this offering, we expect the members of our Finance Committee to be Donald A. Wagner (chair), Alex Blavatnik, Lincoln Benet and Stephen Cooper.
Code of Ethics
We have a Code of Conduct that applies to all of our directors, officers and employees and financial professionals. Upon the completion of this offering, we expect to have a Code of Financial Ethics that applies to our chief executive officer, chief financial officer or persons performing similar functions, and other designated officers and associates. The Code of Conduct addresses, and we expect that the Code of Financial Ethics will address, matters such as conflicts of interest, confidentiality, fair dealing and compliance with laws and regulations. The Code of Conduct and the Code of Financial Ethics will be available without charge on the investor relations portion of our website upon consummation of this offering.
136
Table of Contents
COMPENSATION DISCUSSION AND ANALYSIS
Introduction
Upon the listing of our Class A common stock, the Compensation Committee of our board of directors will continue to determine the appropriate philosophy, objectives and design for our executive compensation program and the compensation of our executive officers following the listing. The committee may make changes to the compensation arrangements described below, and intends to retain a compensation consultant to provide advice and support to the committee in the design and implementation of our executive compensation program, as it deems necessary or appropriate.
The specific compensation and benefits that will be provided to our executive officers in connection with and following the listing of our Class A common stock have not yet been determined. A description of the changes that may be contemplated by our Compensation Committee in connection with the offering will be described in a subsequent filing once determined.
2019 Named Executive Officers
This compensation discussion and analysis provides information about the material elements of compensation that are paid, awarded to, or earned by our “named executive officers,” who consist of our principal executive officer, principal financial officer and our three other most highly compensated executive officers for fiscal year 2019. Our named executive officers (“NEOs”) for fiscal year 2019 are:
| • | Stephen Cooper, Chief Executive Officer (“CEO”) |
| • | Eric Levin, Executive Vice President and Chief Financial Officer |
| • | Max Lousada, Chief Executive Officer, Warner Recorded Music |
| • | Carianne Marshall, Co-Chair and Chief Operating Officer, Warner Chappell Music |
| • | Guy Moot, Co-Chair and Chief Executive Officer, Warner Chappell Music |
Role of the Compensation Committee
The Compensation Committee is responsible for overseeing our compensation programs. As part of that responsibility, the Compensation Committee determines all compensation for the Company’s executive officers. For executive officers other than the CEO, the Compensation Committee considers the recommendation of the CEO and the Executive Vice President, Human Resources in making its compensation determinations. The Committee interacts regularly with management regarding our executive compensation initiatives and programs. The Compensation Committee has the authority to engage its own advisors and had done so prior to the consummation of the Merger. However, during fiscal year 2019, no independent compensation advisor provided any advice or recommendations on the amount or form of executive and director compensation to the Compensation Committee and since the consummation of the Merger, we have not retained a compensation consultant to assist in determining or recommending the amount or form of executive compensation. The Compensation Committee may elect in the future to retain a compensation consultant if it determines that doing so would assist it in implementing and maintaining our compensation programs.
Our executive team consists of individuals with extensive industry expertise, creative vision, strategic and operational skills, in-depth company knowledge, financial acumen and high ethical standards. We are committed to providing competitive compensation packages to ensure that we retain these executives and maintain and strengthen our position as a leading global music entertainment company. Our executive compensation programs and the decisions made by the Compensation Committee are designed to achieve these goals. The compensation
137
Table of Contents
for the Company’s NEOs (the executive officers for whom disclosure of compensation is provided in the tables below) consists of base salary and annual bonuses. In addition, two of our NEOs, Messrs. Cooper and Lousada, participate, based on their individual elections, in the Second Amended and Restated Warner Music Group Corp. Senior Management Free Cash Flow Plan (the “Plan”), our long-term incentive program. The NEOs do not receive any other compensation or benefits other than standard benefits available to all U.S. employees, which primarily consist of health plans, the opportunity to participate in the Company’s 401(k) and deferred compensation plans, basic life insurance and accidental death insurance coverage. Additionally, because Mr. Lousada is located in the United Kingdom, he participates in our defined contribution pension scheme for our U.K. employees, and he also receives a car allowance and is reimbursed for certain tax preparation costs. Mr. Moot also participated in the defined contribution pension scheme for U.K. employees for a portion of the 2019 fiscal year during his employment in London, U.K., prior to his relocation to Los Angeles, California.
For the 2019 fiscal year, in determining the compensation of the NEOs, the Compensation Committee sought to establish a level of compensation that is (a) appropriate for the size and financial condition of the Company, (b) structured so as to attract and retain qualified executives and (c) tied to annual financial performance and long-term shareholder value creation.
The Company has entered into employment arrangements with each of our NEOs (other than Mr. Cooper), which establish each executive’s base salary and, for Mr. Lousada, his entitlement to a percentage of our annual free cash flow under the Plan and, in the case of Messrs. Levin and Moot and Ms. Marshall, their discretionary or target annual bonus. The Company has not entered into an employment agreement with Mr. Cooper because, among other reasons, as a participant in the Plan (with an entitlement to a percentage of our annual free cash flow under the Plan), the Company believes he already has retention incentives to remain employed at the Company.
Executive Compensation Objectives and Philosophy
We design our executive compensation programs to attract talented executives to join the Company and to motivate them to position us for long-term success, achieve superior operating results and increase stockholder value. To realize these objectives, the Compensation Committee and management focus on the following key factors when considering the amount and structure of the compensation arrangements for our executives:
| • | Alignment of executive and stockholder interests by providing incentives linked to operating performance and achievement of cash flow and strategic objectives. We are committed to creating stockholder value and believe that our executives and employees should be provided incentives through our compensation programs that align their interests with those of our stockholders. Accordingly, we provide our executives with annual cash bonus incentives linked to our operating performance. In addition, in 2013, we adopted the Plan, which, as described below, is an incentive compensation program that pays annual bonuses based on our free cash flow and offers participants the opportunity to share in appreciation of our common stock. For information on the components of our executive compensation programs and the reasons why each is used, see “Components of Executive Compensation” below. |
| • | A clear link between an executive’s compensation and Company-wide performance. Two of our NEOs (Messrs. Cooper and Lousada) and some of our other senior executives have elected to participate in the Plan. As further discussed below, the Plan, which is a significant part of our executive compensation program, is designed to reward our executives’ contributions to our free cash flow and long-term value. For other executives, their compensation is designed to reward their achievement of specified key goals, which include, among other things, the successful implementation of strategic initiatives, realizing superior operating and financial performance, and other factors that we believe are important, such as the promotion of an ethical work environment and teamwork within the Company. We believe our compensation structure motivates our executives to achieve these goals and rewards them for their significant efforts and contributions to the Company and the results they achieve. |
138
Table of Contents
| • | The extremely competitive nature of the media and entertainment industry, and our need to attract and retain the most creative and talented industry leaders. We compete for talented executives in relatively high-priced markets, and the Compensation Committee takes this into consideration when making compensation decisions. For example, we compete for executives with other recorded music and music publishing companies, other entertainment, media and technology companies, law firms, private ventures, investment banks and many other companies that offer high levels of compensation. We believe that our senior management team is among the best in the industry and is the right team to lead us to long-term success. Our commitment to ensuring that we are led by the right executives is a high priority, and we make our compensation decisions accordingly. |
Components of Executive Compensation
Employment Arrangements
With the exception of Mr. Cooper as described above, in the 2019 fiscal year we had employment arrangements with all of our NEOs, the key terms of which are described below under “Summary of NEO Employment Arrangements.” We believe that having employment arrangements with certain of our executives can be beneficial to us because it provides retentive value, requires them to comply with key restrictive covenants, and may give us some competitive advantage in the recruiting process over a company that does not offer employment arrangements. Our employment arrangements set forth the terms and conditions of employment and establish the components of an executive’s compensation, which generally include the following:
| • | Base salary; |
| • | Participation in the free cash flow bonus pool of the Plan or a discretionary or target annual cash bonus; |
| • | Severance payable upon a qualifying termination of employment; and |
| • | Benefits, including participation in a defined contribution plan and health, life insurance and disability insurance plans. |
Key Considerations in Determining Executive Compensation
The following describes the components of our NEO compensation arrangements and why each is included in our executive compensation programs.
Base Salary
The cash base salary an NEO receives is determined by the Compensation Committee after considering the individual’s compensation history, the range of salaries for similar positions, the individual’s expertise and experience, and other factors the Compensation Committee believes are important, such as whether we are trying to attract the executive from another opportunity. The Compensation Committee believes it is appropriate for executives to receive a competitive level of guaranteed compensation in the form of base salary and determines the initial base salary by taking into account recommendations from management and, if deemed necessary, the Compensation Committee’s independent compensation consultant.
Each of our NEOs (other than Mr. Cooper) was paid base salary in accordance with the terms of their respective employment arrangement for fiscal year 2019. Mr. Cooper was paid annual base salary of $1,000,000 for fiscal year 2019.
Effective November 1, 2018, Ms. Marshall’s annual base salary increased from $750,000 to $1,000,000 in recognition of additional duties and responsibilities she assumed in connection with the departure of Warner Chappell Music’s former Chair and Chief Executive Officer. On February 1, 2019, her annual base salary increased to $1,250,000 in connection with her promotion to Co-Chair and Chief Operating Officer of Warner Chappell Music.
139
Table of Contents
Annual Cash Bonus
Our Compensation Committee directly links the amount of the annual cash bonuses we pay to our financial performance for the particular year. Messrs. Cooper and Lousada have elected to participate in the annual free cash flow bonus pool in the Plan, as described below.
Annual Free Cash Flow Bonus Pool
Messrs. Cooper and Lousada have elected to participate in the Plan, which is also a non-qualified deferred compensation plan that allows the participants to defer receipt of all or a portion of their annual bonuses until future dates prescribed by the Plan. Our Compensation Committee adopted the Plan to, among other reasons, reinforce a partnership culture with our executives, by allowing them to participate in our short-term performance (in the form of annual free cash flow bonuses) and long-term performance (in the form of deferred compensation that is indexed to the value of our common stock and with grants of Profits Interests, as described below under “Long-Term Equity Incentives”). We believe it is important for our executives and shareholders to be motivated to work together towards shared financial and operational goals. In addition, our Compensation Committee considered that the Plan offers our executives the opportunity for tax-efficient wealth management creation based on our performance.
For the 2019 fiscal year, Messrs. Cooper and Lousada participated in the Plan with fixed percentages of free cash flow of 2.5% and 1.0%, respectively. The Company’s free cash flow for the 2019 fiscal year for the Plan was $283 million. Accordingly, for fiscal year 2019, Messrs. Cooper and Lousada earned free cash flow bonuses under the Plan of $7,075,000 and $2,830,000, respectively. Because he had already deferred his maximum allocation under the Plan prior to the 2019 fiscal year, Mr. Cooper was not entitled to defer any of his free cash flow bonus payable for the 2019 fiscal year and all of it will be paid to him in cash. Mr. Lousada elected to defer 100% of his free cash flow bonus earned from the 2019 fiscal year and, in doing so, to acquire equity interests representing shares of our common stock. The amounts to be paid in cash to Mr. Cooper for his free cash flow bonus under the Plan for the 2019 fiscal year are set forth below under the “Non-Equity Incentive Plan Compensation” column in the Summary Compensation Table.
Discretionary Bonuses
Messrs. Levin and Moot and Ms. Marshall do not participate in the Plan. For the 2019 fiscal year, Mr. Levin had an annual target bonus amount of $850,000 set forth in his employment agreement. For the 2019 fiscal year, Mr. Moot had an annual target bonus amount of $1,750,000 set forth in his employment agreement, to be prorated from his date of hire. For the 2019 fiscal year, Ms. Marshall had an annual target bonus amount of $1,266,667 set forth in her employment agreement. The actual amount of Messrs. Levin’s and Moot’s and Ms. Marshall’s annual bonuses are determined by the Compensation Committee in its sole discretion and may be higher or lower than their target amounts. The amounts of Messrs. Levin’s and Moot’s and Ms. Marshall’s bonuses for fiscal year 2019 are set forth below under the “Bonus” column in the Summary Compensation Table.
For Messrs. Levin and Moot and Ms. Marshall, the Compensation Committee considered the recommendation of the CEO and the Executive Vice President, Human Resources in making its bonus determinations. The bonuses for each of Messrs. Levin and Moot and Ms. Marshall were based on the target bonus set forth in his or her employment agreement, corporate performance and other discretionary factors, including achievement of strategic objectives and other goals. A variety of qualitative and quantitative factors that vary by year and are given different weights in different years depending on facts and circumstances were considered, with no single factor predominant in the overall bonus determination. The factors considered by the Compensation Committee in connection with Messrs. Levin and Moot’s and Ms. Marshall’s fiscal year 2019 bonuses are discussed in more detail below.
For fiscal year 2019, after considering the factors described above and management’s recommendations, the Compensation Committee determined that the bonuses for Messrs. Levin and Moot and Ms. Marshall would be
140
Table of Contents
set at amounts equal to $1,034,340, $913,985 and $1,319,487, respectively. This reflected the Compensation Committee’s and management’s assessment that overall corporate performance and discretionary factors justified payment of such bonus to each of them based on their and the Company’s performance during the fiscal year. Specifically, the Compensation Committee set the amount of Mr. Levin’s bonus after considering the quality of his individual performance in running the company-wide finance function, and taking into account other qualitative factors including performance in internal and public financial reporting, budgeting and forecasting processes, compliance and infrastructure, investment and cost-savings initiatives and communicating to investors and other important constituencies. The Compensation Committee set the amounts of Mr. Moot’s and Ms. Marshall’s bonuses after considering the quality of their individual performance in running their specific business functions as well as the performance of the Company as well as their additional responsibilities during the transition period following the departure of Warner Chappell Music’s former Chair and Chief Executive Officer.
Other non-financial factors taken into account by the Compensation Committee in setting these bonus amounts included, among other items, providing strategic leadership and direction for the Company, including corporate governance matters, managing the strategic direction of the Company.
Long-Term Equity Incentives
Warner Music Group Corp. Senior Management Free Cash Flow Plan
As noted above, Messrs. Cooper and Lousada have elected to participate in the Plan. In addition to providing an annual bonus that is based on a percentage of the Company’s free cash flow, as described above, the Plan provides its participants with the opportunity to defer all or a portion of their free cash flow bonuses and receive grants of equity interests, within prescribed limits.
Deferral of Compensation under the Plan
Subject to prescribed limits under the Plan (including on an individualized participant basis), deferred amounts, if any, will be credited to a participant’s account as and when a deferred bonus is earned and indexed to the fair market value of a share of our common stock (as determined from time to time by the Compensation Committee), except that the initial value of deferred amounts at the time of deferral was based on our fair market value as of January 1, 2013 for the Plan’s initial participants, including Mr. Cooper, and as of the grant date for other participants who joined the Plan at a later date, including Mr. Lousada. The amount deferred in respect of Mr. Lousada’s bonus for the 2019 fiscal year is $2,830,000. As noted above, Mr. Cooper was not entitled to defer any of his 2019 free cash flow bonus because he had previously deferred his maximum allocation under the Plan.
Equity Interests under the Plan
Each of our NEOs who elected to participate in the Plan became a member of WMG Management Holdings, LLC (“Management LLC”), a limited liability company formed in connection with the Plan’s adoption, and was granted a “profits interest” in Management LLC (“Profits Interests”) in amounts equal to the maximum number of shares of our common stock available for issuance to the participants in settlement of his or her deferred accounts. Prior to the stock split in connection with this offering, awards of Profits Interests and deferred equity units under the Plan were denominated as fractional shares in amounts based on 10,000 times the number of shares of our common stock available under the Plan or held by Management LLC. As a result of the stock split, these numbers in the Plan and Management LLC have been adjusted to the number of shares actually represented by those interests on a 1-for-1 basis. The numbers shown in this registration statement reflect this adjustment. These Profits Interests granted to Messrs. Cooper and Lousada represent an economic entitlement to future appreciation in our common stock above the fair market value on the grant date. In addition, in connection with the increase to the free cash flow percentage allocations of Mr. Cooper, he was granted an additional number of Profits Interests in Management LLC equal to the additional number of deferred equity units that may be granted
141
Table of Contents
to him, representing an economic entitlement to future appreciation in our common stock from the date of grant. Terms and conditions of the Plan with respect to the Profits Interests are described below in the narrative accompanying the “Grant of Plan-Based Awards in Fiscal Year 2019” table and under “Potential Payments upon Termination or Change-In-Control.”
Under the Plan, deferred equity units are settled at the participants’ election in shares of our common stock or with a cash payment equal to the fair market value of the shares. Any shares received on settlement are required to be immediately exchanged for fully-vested equity units in Management LLC. See “Grants of Plan-Based Awards in Fiscal Year 2019”. In connection with the offering, the Plan and the LLC Agreement associated with the Plan were amended to provide that, following the offering, Plan participants will no longer have the option to settle deferred accounts in cash or to be paid in cash for redemption of their vested interests in Management LLC. Following the offering, all deferred equity units and vested Profits Interests and Acquired LLC Units will be settled in or redeemed with shares of our common stock. All such shares of common stock that will be distributed by Management LLC to Plan participants will convert to Class A common stock from shares of Class B common stock that are currently outstanding and owned by Management LLC. Furthermore, shares of common stock received in settlement of deferred equity units will no longer be required to be immediately exchanged for equity units in Management LLC.
In connection with the sale of Class A common stock by Access in the offering, Management LLC has agreed to give each Plan participant a right to sell a portion of the shares of common stock underlying their vested Profits Interests, even if the Plan participant does not own any Acquired LLC Units. As a result, Plan participants will be able to cause the LLC to sell a percentage of the shares of common stock underlying their vested Profits Interests and Acquired LLC Units (to the extent that a participant owns Acquired LLC Units). Such percentage will be based on the percentage of shares of Class A common stock that Access is offering for sale in the offering.
Assuming that all of the participants’ interests under the Plan were vested, a maximum of 8,224,241 shares of our common stock would be distributable in redemption of outstanding Acquired LLC Units, a maximum of 9,484,990 shares of our common stock would be issuable in redemption of outstanding deferred equity units, and a maximum of 18,031,928 shares of our common stock would be distributable in redemption of outstanding Profits Interests (ignoring any Benchmark Amount of Profits Interests).
On January 4, 2019, April 5, 2019 and July 5, 2019, we paid a special cash dividend to our stockholders on all the issued and outstanding shares of our common stock. Under the Plan, deferred equity unit holders receive dividend equivalents for cash dividends paid on our common stock.
Tax Deductibility of Compensation and Other Tax Considerations
Where appropriate, and after taking into account various considerations, including that certain incentives, including the Profits Interests under the Plan, may have competing advantages, we structure our executive employment arrangements and compensation programs to allow us to take a tax deduction for the full amount of the compensation we pay to our executives.
Section 162(m) of the U.S. Internal Revenue Code of 1986, as amended (the “Code”), limits tax deductions relating to executive compensation of certain executives of publicly held companies. For taxable years ended prior to this offering, we were not deemed to be a publicly held company for purposes of Section 162(m) of the Code. Accordingly, these limitations were not applicable to the executive compensation program described above and were not taken into consideration in making compensation decisions. For fiscal year 2020 and future years, our Compensation Committee will review and consider the deductibility of executive compensation under Section 162(m) of the Code. However, it is expected that our Compensation Committee will authorize compensation payments that are not deductible for federal income tax purposes when the committee believes that such payments are appropriate to attract, retain and incentivize executive talent.
142
Table of Contents
Benefits
Our NEOs also receive health coverage, life insurance, disability benefits and, generally, other similar benefits in the same manner as our U.S. employees and, in the case of Mr. Lousada and, for a portion of the 2019 fiscal year during his employment in London, U.K. (before he relocated to Los Angeles, California), Mr. Moot, U.K. employees of equivalent status.
Retirement Benefits
We offer a tax-qualified 401(k) plan to our U.S. employees and in November 2010 we adopted a non-qualified deferred compensation plan, which is available to those of our employees whose base salary is at least $200,000 and who are bonus eligible and who are not eligible to participate in the Plan. Both plans are available to the NEOs except for the non-qualified deferred compensation plan if they participate in the Plan. None of our NEOs participated in the non-qualified deferred compensation plan during fiscal year 2019.
In accordance with the terms of the Company’s 401(k) plan, the Company matches after one year of service, in cash, 50% of the first 6% of each plan participant’s contributions to the plan, up to 3% of eligible pay, with a limit of up to $8,400 in 2019, whichever is less. Employees can contribute up to the maximum IRS pre-tax deferral of $19,000 in 2019 (with a catch up of $6,000 in 2019 in the case of participants age 50 or greater), whichever occurs first. The matching contributions made by the Company are initially subject to vesting, based on continued employment, with 25% scheduled to vest on each of the second through fifth anniversaries of the employee’s date of hire.
Additionally, the Company offers a defined contribution pension scheme for U.K. employees, including, in fiscal year 2019, Messrs. Lousada and Moot.
Perquisites
We generally do not provide perquisites to our NEOs, although, in fiscal year 2019, Mr. Lousada and Mr. Moot received a car allowance, Mr. Moot received relocation assistance and Messrs. Lousada and Moot were reimbursed for certain tax preparation costs and received employer contributions with respect to private medical insurance, life assurance and income protection. See the Summary Compensation Table below for a summary of compensation received by our NEOs, including any perquisites received in fiscal year 2019.
143
Table of Contents
Summary Compensation Table
The following table provides summary information concerning compensation paid or accrued by us to or, on behalf of, our NEOs, for services rendered to us during the specified fiscal year.
| Name and Principal Position |
Year | Salary ($) |
Bonus ($)(1) |
Non-Equity Incentive Plan Compensation ($)(2) |
Change in Pension Value and Nonqualified Deferred Compensation Earnings ($) |
All Other Compensation ($)(3) |
Total ($) |
|||||||||||||||||||||
| Stephen Cooper |
2019 | $ | 1,000,000 | — | $ | 7,075,000 | — | $ | 2,013,264 | $ | 10,088,264 | |||||||||||||||||
| CEO |
2018 | $ | 1,000,000 | — | $ | 9,325,000 | — | $ | 24,025,974 | $ | 34,350,974 | |||||||||||||||||
| 2017 | $ | 1,000,000 | — | $ | 12,025,000 | — | $ | 2,181,818 | $ | 15,206,818 | ||||||||||||||||||
| Max Lousada (4)(5) |
2019 | $ | 5,108,000 | — | — | — | $ | 510,330 | $ | 5,618,330 | ||||||||||||||||||
| CEO, Warner Recorded Music |
2018 | $ | 5,180,000 | — | — | — | $ | 1,467,059 | $ | 6,647,059 | ||||||||||||||||||
| Eric Levin |
2019 | $ | 850,000 | $ | 1,034,340 | — | — | $ | 8,400 | $ | 1,892,740 | |||||||||||||||||
| Executive Vice President and Chief Financial Officer |
2018 | $ | 750,000 | $ | 677,907 | — | — | $ | 8,250 | $ | 1,436,157 | |||||||||||||||||
| 2017 | $ | 750,000 | $ | 625,000 | — | — | $ | 8,100 | $ | 1,383,100 | ||||||||||||||||||
| Carianne Marshall (6) |
2019 | $ | 1,132,692 | $ | 1,319,487 | — | — | $ | 721 | $ | 2,452,900 | |||||||||||||||||
| Co-Chair and COO, Warner Chappell Music |
||||||||||||||||||||||||||||
| Guy Moot (6) |
2019 | $ | 829,994 | $ | 913,985 | — | — | $ | 322,754 | $ | 2,066,733 | |||||||||||||||||
| Co-Chair and CEO, Warner Chappell Music |
||||||||||||||||||||||||||||
| (1) | Represents discretionary cash bonuses for fiscal year 2019 performance for each of Messrs. Levin and Moot and Ms. Marshall paid in January 2020, and discretionary cash bonuses for fiscal years 2018 and 2017 to Mr. Levin. |
| (2) | For the 2019 fiscal year, Mr. Cooper’s free cash flow bonus under the Plan will be paid entirely in cash because he previously acquired all of his deferred equity unit allocation. All of his 2018 and 2017 free cash flow bonus were also paid in cash. |
| (3) | Fiscal year 2019 includes 401(k) matching contributions of $8,400 for Mr. Levin and defined contribution pension matching contributions of $23,991 (£18,787) for Mr. Lousada and $7,740 (£6,061) for Mr. Moot. Additionally, fiscal year 2019 for Messrs. Cooper and Lousada, includes $2,013,264 and $433,667, respectively, in cash dividends paid to them under the Plan in respect of their then outstanding deferred equity units and Profits Interests. Messrs. Lousada and Moot were reimbursed for certain tax preparation costs and received car allowances as well as employer contributions with respect to private medical insurance, life assurance and income protection. Mr. Moot also received relocation assistance totaling $282,168, including a related tax gross-up of $97,574. |
| (4) | Mr. Lousada became an NEO in fiscal year 2018. |
| (5) | The amounts reported for Mr. Lousada have been converted from British pound sterling to U.S. dollars using a conversion factor of 1.277 and 1.295 for fiscal years 2019 and 2018, respectively. |
| (6) | Ms. Marshall and Mr. Moot became NEOs in fiscal year 2019. Base salary information for Ms. Marshall and Mr. Moot reflects proration resulting from Ms. Marshall’s salary changes during fiscal year 2019 and Mr. Moot’s commencement of employment during fiscal year 2019. |
Grant of Plan-Based Awards in Fiscal Year 2019
No deferred equity units or Profits Interests were granted in fiscal year 2019 to our NEOs.
144
Table of Contents
Under the Plan, the deferred amounts granted to our participating NEOs are credited to a participant’s account as and when a deferred bonus is earned based on the fair market value of a share of our common stock as of January 1, 2013. Uncredited deferred equity units are forfeited upon an NEO’s termination of employment. Under the Plan, our participating NEOs’ Profits Interests vest over time as equivalent amounts of their annual free cash flow bonuses are deferred under the Plan. Unvested Profits Interests are forfeited on any termination of employment. As of September 30, 2019, 6,517,563.99 and 2,607,025.60 deferred equity units had been granted to Mr. Cooper and Mr. Lousada, respectively. As of September 30, 2019, all of Mr. Cooper’s deferred equity units, including special deferred equity units, had vested, and Mr. Lousada had vested in 1,169,930.68 of his deferred equity units. Also, each of Messrs. Cooper and Lousada had vested in an equal number of the Profits Interests held by him (or in Mr. Cooper’s case, held in trust by him). In December 2018, 2,173,125.20 of Mr. Cooper’s deferred equity units, including special deferred equity units, settled and ceased to be outstanding. Deferred equity units described herein reflect an adjustment the Company made during fiscal year 2019 to account for a change to the number of shares of our common stock outstanding.
The deferred amounts reflected in the “Outstanding Equity Awards at 2019 Fiscal Year-End” and “Nonqualified Deferred Compensation” tables below have been or are scheduled to be settled in equal installments as follows: For Mr. Cooper, on the December 2019 and 2020 redemption dates; and for Mr. Lousada, on the December 2023, 2024, and 2025 redemption dates. Under the Plan, deferred accounts are to be settled at the participants’ election, in shares of our common stock or with a cash payment equal to the then fair market value of the shares. Any shares received on settlement are required to be immediately exchanged for fully-vested equity units (“Acquired LLC Units”) in Management LLC. On each scheduled redemption date, a Plan participant may elect to redeem up to one-third of his or her vested Profits Interests (including any Profits Interests eligible for redemption on a prior redemption date that were not then redeemed) for a cash payment equal to their liquidation value. A Plan participant may also elect to redeem his or her Acquired LLC Units for a cash payment equal to the fair market value of their underlying shares of the Company’s common stock on each redemption date. In addition to a Plan participant’s right to redemption of his or her vested Profits Interests and Acquired LLC Units on the redemption dates and annually thereafter, Management LLC may redeem vested Profits Interests and Acquired LLC Units following a participant’s termination of employment with the Company and its subsidiaries. All remaining Profits Interests will be redeemed in December 2020 for Mr. Cooper and December 2025 for Mr. Lousada. Redemption payments in respect of Profits Interests may be reduced by the amount of any outstanding unrecovered added investment amounts. In connection with the offering, the Plan and the LLC Agreement associated with the Plan were amended to provide that, following the offering, Plan participants will no longer have the option to settle deferred accounts in cash or to be paid in cash for redemption of their vested interests in Management LLC. Following the offering, all deferred equity units and vested Profits Interests and Acquired LLC Units will be settled in or redeemed with shares of our common stock. All such shares of common stock that will be distributed by Management LLC to Plan participants will convert to Class A common stock from shares of Class B common stock that are currently outstanding and owned by Management LLC. Furthermore, shares of common stock received in settlement of deferred equity units will no longer be required to be immediately exchanged for equity units in Management LLC.
As a condition to the grant of Profits Interests to our NEOs who elected to participate in the Plan, each of them agreed to restrictive covenants in the LLC Agreement associated with the Plan, including non-competition with the businesses of the Company and its subsidiaries during the participant’s term of employment, non-solicitation of certain artists, labels and employees during the participant’s term of employment and for one year afterwards, as well as obligations of non-disparagement and confidentiality.
Summary of NEO Employment Arrangements
This section describes employment arrangements in effect for our NEOs during fiscal year 2019. Potential payments under the severance agreements and arrangements described below are provided in the section entitled “Potential Payments upon Termination or Change-In-Control.” In addition, for a summary of the meanings of “cause” and “good reason” as discussed below, see “Termination for ‘Cause’” and “Resignation for ‘Good Reason’ or without ‘Good Reason’” below.
145
Table of Contents
Employment Arrangements with Stephen Cooper
As noted above, except for Mr. Cooper’s annual base salary of $1,000,000 and his participation in the Plan, the Company does not have any other employment arrangement with Mr. Cooper.
Employment Agreement with Max Lousada
During fiscal year 2019, Mr. Lousada was party to an employment agreement with us that provided, among other things, for the following:
| (1) | the term of Mr. Lousada’s employment agreement ends on September 30, 2022; |
| (2) | Mr. Lousada’s base salary for fiscal year 2019 was $5,108,000 (£4,000,000); |
| (3) | eligibility to participate in the Plan; and |
| (4) | eligibility to participate in the defined contribution pension plan for U.K. employees, along with company matching contributions of up to 10% of Mr. Lousada’s base salary. |
In the event we terminate his employment for any reason other than “cause” (as defined in his employment agreement) or he is constructively dismissed, Mr. Lousada will be entitled to cash severance benefits equal to $7,662,000 (£6,000,000).
Mr. Lousada’s employment agreement also contains covenants relating to confidentiality, a six-month post-employment non-compete and a one-year post-employment non-solicitation covenant.
Employment Agreement with Eric Levin
During fiscal year 2019, Mr. Levin was party to an employment agreement with us that provided, among other things, for the following:
| (1) | the term of Mr. Levin’s employment agreement ends on September 30, 2023; and |
| (2) | Mr. Levin’s base salary for fiscal year 2019 was $850,000 and his target bonus was $850,000. Additionally, Mr. Levin’s base salary and target bonus will continue to be $850,000 for fiscal years 2020 and 2021, and will increase to $900,000 for fiscal years 2022 and 2023. |
Also, his employment agreement provides that, if during the term, we establish a new long-term incentive plan, we will consider offering Mr. Levin an opportunity to participate in it.
In the event we terminate his employment for any reason other than for “cause” (as defined in his employment agreement), Mr. Levin will be entitled to cash severance benefits equal to the annual base salary payable to him under his employment agreement, except that if we elect to not renew his employment agreement at the end of its term, he will be paid $600,000.
Mr. Levin’s employment agreement also contains standard covenants relating to confidentiality and a one-year post-employment non-solicitation covenant.
Employment Agreement with Carianne Marshall
For fiscal year 2019, Ms. Marshall was party to an employment agreement with us that provided, among other things, for the following:
| (1) | the term of Ms. Marshall’s employment agreement ends on March 31, 2024; and |
| (2) | Ms. Marshall’s base salary for fiscal year 2019 was increased to $1,250,000 on February 1, 2019 (after an earlier increase to $1,000,000 on November 1, 2018), and her target bonus was $1,266,667. Ms. Marshall’s target bonus for each fiscal year after 2019 will be $1,750,000. |
146
Table of Contents
Also, her employment agreement provides that, if during the term, we establish a new long-term incentive plan, we will offer Ms. Marshall an opportunity to participate in it.
In the event we terminate her employment for any reason other than for “cause” (as defined in her employment agreement), death or disability or if Ms. Marshall terminates her employment for “good reason” (as defined in her employment agreement), Ms. Marshall will be entitled to severance benefits equal to 15 months of her annual base salary plus a discretionary pro-rated bonus (as determined by the Company in good faith) and continued participation in the Company’s group health and life insurance plans for the month of termination. However, if we elect to not renew her employment agreement at the end of its term, she will be paid the severance that would be payable to her under our severance policy if she did not have an employment agreement.
Ms. Marshall’s employment agreement also contains standard covenants relating to confidentiality and a one-year post-employment non-solicitation covenant.
Employment Agreement with Guy Moot
For fiscal year 2019, Mr. Moot was party to employment agreements with us that provided, among other things, for the following:
| (1) | the term of Mr. Moot’s employment agreement ends on March 31, 2024; |
| (2) | Mr. Moot’s annual base salary is $1,750,000 (although prior to his relocation to Los Angeles, California in fiscal year 2019, his annual base salary was denominated as £1,365,000), and his target bonus is the same amount; |
| (3) | Mr. Moot was entitled to up to $298,818 (£234,000), after-tax, in relocation assistance in connection with his relocation to Los Angeles, California. |
Also, his employment agreement provides that, if during the term, we establish a new long-term incentive plan, we will offer Mr. Moot an opportunity to participate in it.
In the event we terminate his employment for any reason other than for “cause” (as defined in his employment agreement), death or disability or if Mr. Moot terminates his employment for “good reason” (as defined in his employment agreement), Mr. Moot will be entitled to severance benefits equal to 18 months of his annual base salary plus a discretionary prorated bonus (as determined by the Company in good faith), up to $75,000 in relocation assistance to move from Los Angeles, California to London, U.K. and continued participation in the Company’s group health and life insurance plans for the month of termination. However, if we elect to not renew his employment agreement at the end of its term, he will be paid 12 months of annual base salary.
If Mr. Moot resigns without “good reason” or is terminated for “cause” before the second anniversary of his relocation to Los Angeles, California, he will be required to repay all or a portion of the relocation assistance and related tax gross-up.
Mr. Moot’s employment agreement also contains standard covenants relating to confidentiality and a one-year post-employment non-solicitation covenant.
Outstanding Equity Awards at 2019 Fiscal Year-End
| Name |
Number of Shares or Units of Stock That Have Not Vested (#)(1) |
Market Value of Shares or Units of Stock That Have Not Vested ($)(4) |
||||||
| Stephen Cooper |
— | (2) | $ | — | ||||
| — | (3) | $ | — | |||||
| Max Lousada |
1,437,095.39 | (2) | $ | 11,080,184 | ||||
| 1,437,095.39 | (3) | $ | 6,498,271 | |||||
147
Table of Contents
| (1) | An NEO’s deferred equity units and Profits Interests generally vest over time as equivalent amounts of annual free cash flow bonuses are deferred under the Plan. All of Mr. Cooper’s deferred equity units, including special deferred equity units, and Profits Interests had vested as of September 30, 2019. |
| (2) | Uncredited deferred equity units approved for grant to the NEO as of September 30, 2019. Each deferred equity unit is equivalent to one share of our common stock. |
| (3) | Unvested Profits Interests. This table does not include vested Profits Interests that were held by the NEOs or Class A units of Management LLC received in settlement of vested deferred equity units held directly and in trust by Mr. Cooper, in each case, as of September 30, 2019: for Mr. Cooper, 6,517,563.99 vested Profits Interests, with a value of $34,105,592; and for Mr. Lousada, 1,169,930.68 vested Profits Interests, with a value of $5,290,203. A Profits Interest’s benchmark amount reflects the value of our common stock on the grant date of the Profits Interest, and the value of a Profits Interest reflects the appreciation in the fair market value of our common stock above its benchmark amount. For the 2019 redemption date, Mr. Cooper received shares of the Company’s common stock for his deferred equity units that settled in December 2018 (and all such shares were immediately contributed to Management LLC in exchange for Class A units, pursuant to the Plan) and Mr. Cooper elected to retain (and not redeem) all of his Profits Interests then eligible for redemption. Because Mr. Lousada joined the Plan in 2017, he was not eligible to redeem any deferred equity units or Profits Interests in December 2018. |
| (4) | As of September 30, 2019, after giving effect to a 477,242.614671815-for-1 stock split of the Company’s Class B common stock effected on February 28, 2020, the value of a share of our common stock, as determined under the Plan, was $7.71. Assumptions used in the calculation of this amount are included in Note 11 to our audited financial statements for the fiscal year ended September 30, 2019. |
Equity Awards Vested in 2019 Fiscal Year
| Name |
Number of Shares or Units of Stock Acquired on Vesting (#) |
Value Realized on Vesting ($)(3) |
||||||
| Stephen Cooper |
— | (1) | $ | — | ||||
| — | (2) | $ | — | |||||
| Max Lousada |
467,144.16 | (1) | $ | 1,488,424 | ||||
| 467,144.16 | (2) | $ | 1,488,424 | |||||
| (1) | Deferred equity units that vested in fiscal year 2019. Generally, an NEO’s deferred equity units vest in the fiscal year following the fiscal year in which the NEO’s free cash flow bonuses are paid. However, in August 2018, prior to the 2019 fiscal year, vesting was accelerated for 702,786.52 of Mr. Lousada’s deferred equity units that would otherwise have vested in fiscal year 2019 and the remaining 467,144.16 vested in December 2018. |
| (2) | Profits Interests that vested in fiscal year 2019 reflect a number of Profits Interests equal to the number of deferred equity units acquired by Mr. Lousada in fiscal year 2019. |
| (3) | Reflects the difference between the purchase price of a deferred equity unit and the fair market value of a deferred equity unit on the date Mr. Lousada acquired the vested deferred equity units in December 2018, and for a Profits Interest reflects the appreciation in the fair market value of a share of our common stock as of the vesting date since the date of grant. Pursuant to the Plan and the NEOs’ elections, the deferred equity units and Profits Interests will not be settled or redeemed until the scheduled redemption dates or, if earlier, termination of the NEO’s employment. See the descriptions in the narratives accompanying the “Grants of Plan-Based Awards in Fiscal Year 2019” table above and below under “Potential Payments upon Termination or Change-In-Control.” |
148
Table of Contents
Nonqualified Deferred Compensation
The following table provides information concerning the deferred accounts of our NEOs under the Plan:
| Name |
Executive Contributions in Last FY ($)(1) |
Registrant Contributions in Last FY ($)(2) |
Aggregate Earnings in Last FY ($)(3) |
Aggregate Withdrawals / Distributions ($) |
Aggregate Balance at Last FYE ($)(4) |
|||||||||||||||
| Stephen Cooper |
$ | — | $ | — | $ | 5,802,385 | $ | 13,582,814 | $ | 32,960,714 | ||||||||||
| Max Lousada |
$ | 1,490,000 | $ | 1,488,424 | $ | 1,562,547 | $ | — | $ | 9,020,311 | ||||||||||
| (1) | Amounts of free cash flow bonuses that were deferred by Mr. Lousada under the Plan through the acquisition of vested deferred equity units in fiscal year 2019. |
| (2) | Reflects the difference between the purchase price of a deferred equity unit and the fair market value of a deferred equity unit on the date Mr. Lousada acquired the vested deferred equity units in fiscal year 2019. |
| (3) | Reflects the increase in value of vested deferred equity units outstanding as of September 30, 2019 since October 1, 2018. |
| (4) | For Mr. Cooper, this reflects the value of shares of the Company’s common stock that he received in settlement of his deferred equity units in December 2019. |
Potential Payments upon Termination or Change-In-Control
We have entered into employment arrangements that, by their terms, will require us to provide compensation and other benefits to our NEOs if their employment terminates or they resign under specified circumstances. In addition, the Plan provides for certain payments upon a participant’s termination of employment or a change-in-control of the Company.
The following discussion summarizes the potential payments upon a termination of employment in various circumstances. The amounts discussed apply the assumptions that employment terminated on September 30, 2019 and the NEO does not become employed by a new employer or return to work for the Company, or that a change in control occurred on September 30, 2019. The discussion that follows addresses Ms. Marshall and Messrs. Lousada, Cooper, Levin and Moot. See “Summary of NEO Employment Arrangements” above for a description of their respective agreements. The value of a share of our common stock applied to this discussion was $7.71, as determined under the Plan as of September 30, 2019.
Estimated Benefits upon Termination for “Cause” or Resignation Without “Good Reason”
In the event an NEO is terminated for “cause,” or resigns without “good reason” as such terms are defined below, the NEO is only eligible to receive compensation and benefits accrued through the date of termination. Therefore, no amounts other than accrued amounts would be payable to Ms. Marshall or Messrs. Lousada, Levin and Moot in this instance pursuant to their employment arrangements. As noted above, Mr. Cooper does not have an employment arrangement directly with the Company and, therefore, he is also not entitled to any benefits from the Company, except under the Plan, if he is terminated for “cause” or he resigns without “good reason.”
Estimated Benefits upon Termination without “Cause” or Resignation for “Good Reason”
Upon termination without “cause” or resignation for “good reason,” Ms. Marshall and Messrs. Lousada, Levin and Moot are entitled to contractual severance benefits payable on termination plus, in the case of Ms. Marshall and Mr. Moot, a pro-rated annual bonus for the year of termination. Although annual free cash flow bonuses under the Plan are generally contingent upon the participant being employed with the Company on the date of payment, if, after the first quarter of a fiscal year, the employment of Messrs. Cooper or Lousada is terminated by the Company without “cause”, by him for “good reason” or due to his death or “disability,” he will be entitled under the Plan to a pro rata free cash flow bonus in respect of the year in which such event occurs (as
149
Table of Contents
such terms are defined in the Plan). None of our NEOs is entitled to any additional severance upon a termination in connection with a change in control.
| Name |
Salary (other than accrued amounts)(1) |
Bonus(2) | Value of Deferred Compensation(3) |
Acceleration of Profits Interests(4) |
Benefits | Total | ||||||||||||||||||
| Stephen Cooper |
— | $ | 7,075,000 | $ | 32,960,714 | — | — | $ | 40,035,714 | |||||||||||||||
| Eric Levin |
$ | 850,000 | — | — | — | — | $ | 850,000 | ||||||||||||||||
| Max Lousada (5) |
$ | 7,662,000 | $ | 2,830,000 | $ | 9,020,311 | — | — | $ | 19,512,311 | ||||||||||||||
| Carianne Marshall |
$ | 1,562,500 | $ | 1,319,487 | — | — | — | $ | 2,881,987 | |||||||||||||||
| Guy Moot |
$ | 2,625,000 | $ | 913,985 | — | — | — | $ | 3,538,985 | |||||||||||||||
| (1) | For Messrs. Levin, Moot and Lousada and Ms. Marshall, the amount represents the severance payable to them on such a qualifying termination. |
| (2) | For Messrs. Cooper and Lousada, represents a pro rata amount of the annual free cash flow bonus payable under the Plan (or, since the termination date is assumed to be September 30, 2019, their full 2019 annual bonuses). For Ms. Marshall and Mr. Moot, represents the actual 2019 bonus paid assuming the Company in its good-faith discretion determined to pay that amount. |
| (3) | Reflects the value of vested deferred equity units that will be settled on a termination of employment without “cause” or by the NEO for “good reason” (including, in Mr. Cooper’s case, units held in trust). |
| (4) | Profits Interests will not accelerate on a termination of employment that is not in connection with a change in control of the Company. This table does not include vested Profits Interests held by the NEOs (or, in Mr. Cooper’s case, Profits Interests held in trust). |
| (5) | The amounts reported for Mr. Lousada have been converted from British pound sterling to U.S. dollars using a conversion factor of 1.277. |
Estimated Benefits in Connection with a Change in Control
As participants in the Plan, each of Messrs. Lousada and Cooper will be entitled to additional payments upon a change in control in respect of his amounts deferred under the Plan and the Profits Interests granted to him.
| Name |
Value of Deferred Compensation(1) |
Acceleration of Profits Interests(2) |
Total | |||||||||
| Stephen Cooper |
$ | 32,960,714 | $ | — | $ | 32,960,714 | ||||||
| Max Lousada |
$ | 9,020,311 | $ | 2,830,000 | $ | 11,850,311 | ||||||
| (1) | For each of Messrs. Cooper and Lousada, represents the value of the NEO’s deferred equity units that were vested and outstanding on September 30, 2019 and for Mr. Cooper, the then outstanding portion of the additional deferred equity units granted to him in December 2013 to offset the impact of the $54 million of investments that were funded through fiscal year 2013 free cash flow (but reduced for the amount of any unrecovered investment amounts that were allocated to the NEO with such additional grant). Also, for Mr. Lousada, the deferred equity units that would have been credited to his deferred compensation account with a pro rata portion of the free cash flow bonus in respect of the 2019 fiscal year payable in deferred equity units (i.e., the remainder due to be deferred from his 2019 fiscal year free cash flow bonus, since the change in control would be deemed to occur on September 30, 2019). |
| (2) | For Mr. Lousada, his Profits Interests that would have vested if 100% of his 2019 free cash flow bonus would have been deferred under the Plan. The value of a Profits Interest reflects the appreciation in the fair market value of a share of our common stock as of September 30, 2019 since the date of grant. In each case, the value of a Profits Interest assumes that Management LLC was liquidated and its proceeds distributed to its members, including our NEOs. This table does not include vested Profits Interests held directly or in trust by the NEOs or Profits Interests or Class A units in Management LLC held directly and in trust by Mr. Cooper. |
150
Table of Contents
Upon a change of control of the Company and upon certain sales of shares of our common stock underlying Profits Interests and Acquired LLC Units, distributions will be made in respect of Profits Interests (to the extent of their liquidation value) and Acquired LLC Units. The LLC Agreement associated with the Plan provides Access with the right to cause Plan participants (including the NEOs) to sell their Profits Interests, Acquired LLC Units or the underlying shares of our common stock on a sale by Access of more than 50% of the outstanding shares of our common stock to third parties (i.e., a “drag-along right”), other than in a public offering of our common stock. Also, the LLC Agreement provides Plan participants (including the NEOs) with the right to sell their vested Profits Interests and Acquired LLC Units in the event that Access proposes to sell to third parties or us shares of our common stock other than certain sales after a public offering of our common stock (i.e., a “tag-along right”).
Estimated Benefits upon Death or Disability
Death. For Messrs. Lousada, Levin and Moot and Ms. Marshall, other than accrued benefits and, in the case of Messrs. Cooper and Lousada under the Plan, no other benefits are provided in connection with such NEO’s death. Also, for Ms. Marshall and Mr. Moot, represents the actual 2019 bonus paid assuming the Company in its good-faith discretion determined to pay that amount.
Disability. For Messrs. Lousada, Levin and Moot and Ms. Marshall, other than accrued benefits and short-term disability amounts and, in the case of Messrs. Cooper and Lousada under the Plan, no benefits are provided in connection with such NEO’s disability. Also, for Ms. Marshall and Mr. Moot, represents the actual 2019 bonus paid assuming the Company in its good-faith discretion determined to pay that amount.
As participants in the Plan, each of Messrs. Cooper and Lousada will be entitled to the following payments if terminated as a result of death or disability:
| Name |
Bonus(1) | Value of Deferred Compensation(2) |
Acceleration of Profits Interests(3) |
Total | ||||||||||||
| Stephen Cooper |
$ | 7,075,000 | $ | 32,960,714 | — | $ | 40,035,714 | |||||||||
| Max Lousada |
$ | 2,830,000 | $ | 9,020,311 | — | $ | 11,850,311 | |||||||||
| Carianne Marshall |
$ | 1,319,487 | — | — | $ | 1,319,487 | ||||||||||
| Guy Moot |
$ | 913,985 | — | — | $ | 913,985 | ||||||||||
| (1) | Represents a pro rata amount of the annual free cash flow bonus payable under the Plan (or, since the termination date is assumed to be September 30, 2019, the full 2019 annual bonus) for each of Messrs. Cooper and Lousada. For Ms. Marshall and Mr. Moot, represents the actual 2019 bonus paid assuming the Company in its good-faith discretion determined to pay that amount. |
| (2) | Represents the value of each NEOs’ deferred equity units that were vested and outstanding on September 30, 2019, and the then outstanding portion of the additional deferred equity units granted to Mr. Cooper in December 2013 to offset the impact of the $54 million of investments that were funded through fiscal year 2013 free cash flow (but reduced for the amount of any unrecovered investment amounts that were allocated to the NEO with such additional grant), in each case, based on the value of our common stock as of September 30, 2019. |
| (3) | Profits Interests will not accelerate on a termination of employment that is not in connection with a change in control of the Company. This table does not include vested Profits Interests held directly or in trust by the NEOs or Profits Interests or Class A units in Management LLC held directly and in trust by Mr. Cooper. |
Relevant Provisions of Employment Arrangements
Upon termination of employment for any reason, all of our employees, including our NEOs, are entitled to unpaid salary and vacation time accrued through the termination date.
151
Table of Contents
Termination for “Cause”
Under the terms of his employment agreement (and for purposes of the Plan), we generally would have “cause” to terminate the employment of Mr. Lousada in any of the following circumstances: (1) serious or repeated breach of any of his material obligations, (2) refusing to carry out any lawful and reasonable order given to him or failing to attend to his duties, (3) committing any financially dishonest or fraudulent act relating to the Company, (4) conviction of a crime that is punishable by imprisonment, (5) guilty of gross misconduct or of any other conduct which brings or is likely to bring serious professional discredit to the Company, (6) unable to perform his duties by reason of ill-health or accident either for a specified period, (7) becoming of unsound mind and a patient for the purpose of any statute relating to mental health, (8) a petition or application for an order in bankruptcy is presented by or against him or any person becomes entitled to petition or apply for any such order, (9) a disqualification order (as defined in Section 1 of the Directors Disqualification Act 1986) is made against him or he otherwise becomes prohibited by law from being a member of the Company’s board of directors and (10) if he voluntarily resigns as a member of the Company’s board of directors. In the event of (1) or (2) that is curable, we are required to notify Mr. Lousada of such circumstances and give him a reasonable opportunity to cure.
For purposes of the Plan, we would have “cause” to terminate the employment of Mr. Cooper in any of the following circumstances: (1) ceasing to perform his material duties to the Company or its affiliates (other than as a result of vacation, approved leave or incapacity due to physical or mental illness or injury), which failure amounts to an extended neglect of his duties, (2) engaging in conduct that is demonstrably and materially injurious to the business of the Company or its affiliates, (3) conviction of a felony or entered a plea of guilty or no contest to a felony charge or a misdemeanor involving as a material element fraud, dishonest or sale or possession of illicit substances, (4) failing to follow lawful instructions of his direct superiors or the Company’s board of directors and (5) breach of any restrictive covenant addressed in his employee letter.
Under the terms of their employment agreements, we generally would have “cause” to terminate the employment of Messrs. Levin or Moot or Ms. Marshall in any of the following circumstances: (1) repeated and continual refusal to perform his or her duties with the Company, (2) engaging in willful malfeasance that has a material adverse effect on the Company, (3) breach of his or her covenants in his/her employment agreement and (4) conviction of a felony or entered a plea of nolo contendere to a felony charge.
Resignation for “Good Reason” or without “Good Reason”
For purposes of the Plan, Messrs. Cooper or Lousada generally would have “good reason” to terminate employment in any of the following circumstances: (1) if his salary or annual bonus percentage under the Plan is materially reduced, (2) if we fail to pay him any salary which has become payable and due to him, or (3) our failure to pay him any entitlement that has become payable and due under the Plan. Messrs. Cooper and Lousada are required to notify us within 30 days after becoming aware of the occurrence of any event that constitutes “good reason,” and in general we have 30 days to cure the event, but failing a cure, he must terminate his employment within 30 days after the cure period expires.
Our employment agreements with Mr. Moot and Ms. Marshall provide that he or she generally would have “good reason” to terminate employment in any of the following circumstances: (1) if we assign duties inconsistent with his/her current positions, duties or responsibilities or if we change the parties to whom he or she reports, (2) if we fail to pay any amounts due under the employment agreement, (3) if we relocate him/her beyond a specified area, (4) if we assign the Company’s obligations under the employment agreement to a non-affiliate (except, in Ms. Marshall’s case, if the assignment is in connection with a sale, transfer or disposition of all or a substantial portion of the stock or assets of Warner Chappell Music, Inc. or its direct or indirect parent). Our employment agreement with Mr. Levin does not include “good reason” termination provisions.
Restrictive Covenants
Our agreements with our NEOs contain several important restrictive covenants with which an executive must comply following termination of employment. For example, Messrs. Cooper’s and Lousada’s entitlements
152
Table of Contents
to payments under the Plan are each conditioned on the NEO’s compliance with covenants not to solicit certain of our artists and employees. This non-solicitation covenant continues in effect during a period that, for each of our NEOs, will end one year following his termination of employment.
Messrs. Levin’s and Moot’s and Ms. Marshall’s employment agreements and the Plan for Messrs. Cooper and Lousada also contain covenants regarding non-disclosure of confidential information.
Changes to Executive Compensation in Connection with the Offering
Omnibus Incentive Plan
Our board of directors and our stockholders have approved the Warner Music Group Corp. 2020 Omnibus Incentive Plan, or the “Omnibus Incentive Plan,” which will be effective on the day prior to the effective date of the registration statement of which this prospectus forms a part, pursuant to which, following the offering at times determined by our board of directors or our compensation committee, we will make grants of long-term equity incentive compensation to our directors, officers and other employees. The following are the material terms of the Omnibus Incentive Plan, which is qualified by reference to the full text of the Omnibus Incentive Plan.
Administration. Our board of directors has the authority to interpret the terms and conditions of the Omnibus Incentive Plan, to determine eligibility for and terms of awards for participants and to make all other determinations necessary or advisable for the administration of the Omnibus Incentive Plan. The board of directors may delegate its authority to a subcommittee. The board of directors, or the applicable subcommittee, is referred to below as the “Administrator.” To the extent consistent with applicable law, the Administrator may further delegate matters involving administration of the Omnibus Incentive Plan to our Chief Executive Officer or other of our officers. In addition, subcommittees may be established to the extent necessary to comply with Rule 16b-3 under the Exchange Act.
Eligible Award Recipients. Our directors, employees, advisors and consultants are eligible to receive awards under the Omnibus Incentive Plan.
Awards. Awards under the Omnibus Incentive Plan may be made in the form of stock options, which may be either incentive stock options or non-qualified stock options; restricted stock; restricted stock units; performance shares; performance units; stock appreciation rights, or “SARs”; dividend equivalents; and other stock-based awards. Cash awards may also be granted under the Plan as annual or long-term incentives.
Shares Subject to the Omnibus Incentive Plan. Subject to adjustment as described below, the aggregate number of shares of common stock available for issuance under the Omnibus Incentive Plan will be equal to 31,169,099 shares over the 10-year period from the date of adoption, including up to 1,000,000 shares of our Class A common stock that would be issued upon vesting of equity awards that we expect to grant to a broad group of our employees, subject to certain conditions, in connection with (but not prior to) this offering. Shares issued under the Omnibus Incentive Plan may be either authorized but unissued shares or shares reacquired by us. All of the shares under the Omnibus Incentive Plan may be granted as incentive stock options within the meaning of the Code.
Any shares covered by an award, or portion of an award, granted under the Omnibus Incentive Plan that are forfeited, canceled, expired or otherwise terminated for any reason will again be available for the grant of awards under the Omnibus Incentive Plan. Additionally, any shares tendered or withheld to satisfy the grant or exercise price or tax withholding obligations pursuant to any award under the Omnibus Incentive Plan, and the shares subject to any award that is settled in cash, will again be available for issuance. The Omnibus Incentive Plan permits us to issue replacement awards to employees of companies acquired by us, but those replacement awards would not count against the share maximum listed above.
153
Table of Contents
Director Limits. With respect to any period from one annual meeting of shareholders to the next following annual meeting of shareholders, the fair market value of shares subject to awards granted to any non-employee director (as of the grant date), and the cash paid to any non-employee director, may not exceed $800,000 in the aggregate for any such non-employee director who is serving as chairman of the board of directors and $700,000 in the aggregate for any other such non-employee director.
Terms and Conditions of Options and Stock Appreciation Rights. An “incentive stock option” is an option that meets the requirements of Section 422 of the Code, and a “non-qualified stock option” is an option that does not meet those requirements. A SAR is the right of a participant to a payment, in shares of common stock, or such other form determined by the Administrator, equal to the amount by which the fair market value of a share of common stock on the exercise date exceeds the exercise price of the stock appreciation right. An option or SAR granted under the Omnibus Incentive Plan will be exercisable only to the extent that it is vested on the date of exercise. Subject to the one-year minimum vesting requirement described below, each option and SAR will vest and become exercisable according to the terms and conditions determined by the Administrator. Unless otherwise determined by the Administrator, no option or SAR may be exercisable more than ten years from the grant date. SARs may be granted to participants in tandem with options or separately.
The exercise price per share under each non-qualified option and SAR granted under the Omnibus Incentive Plan may not be less than 100% of the fair market value of our common stock on the option grant date. The Omnibus Incentive Plan includes a general prohibition on the repricing of out-of-the-money options and SARs without shareholder approval.
Terms and Conditions of Restricted Stock and Restricted Stock Units. Restricted stock is an award of common stock on which certain restrictions are imposed over specified periods that subject the shares to a substantial risk of forfeiture. A restricted stock unit is a unit, equivalent in value to a share of common stock, credited by means of a bookkeeping entry in our books to a participant’s account, which is settled after vesting in stock or cash, as determined by the Administrator. Subject to the provisions of the Omnibus Incentive Plan, our Administrator will determine the terms and conditions of each award of restricted stock or restricted stock units, including the restricted period for all or a portion of the award, and the restrictions applicable to the award. Subject to the one-year minimum vesting requirement described below, restricted stock and restricted stock units will vest based on a period of service specified by our Administrator, the occurrence of events specified by our Administrator or both. Restricted stock units granted under the plan will receive dividend equivalents settled in shares of our common stock unless otherwise determined by the Administrator.
Terms and Conditions of Performance Shares and Performance Units. A performance share is a grant of a specified number of shares of common stock, or a right to receive a specified (or formulaic) number of shares of common stock after the date of grant, subject to the achievement of predetermined performance conditions. A performance unit is a unit, having a specified cash value that represents the right to receive a share of common stock or cash (based on the fair market value of our common stock) if performance conditions are achieved. Vested performance units may be settled in cash, stock or a combination of cash and stock, at the discretion of the Administrator. Subject to the one-year minimum vesting requirement described below, performance shares and performance units will vest based on the achievement of performance goals during the performance cycle established by the Administrator, and such other conditions, restrictions and contingencies as the Administrator may determine. Performance shares and performance units granted under the plan will receive dividend equivalents settled in shares of our common stock unless otherwise determined by the Administrator.
Other Stock-Based Awards. The Administrator may make other equity-based or equity-related awards not otherwise described by the terms of the Omnibus Incentive Plan.
Minimum Vesting Requirements. No award granted under the Omnibus Incentive Plan may vest before the first anniversary of the date of grant, subject to certain accelerated vesting contemplated under the plan, with the exception of (i) up to five percent (5%) of the number of shares reserved for issuance under the Omnibus
154
Table of Contents
Incentive Plan, (ii) replacement awards granted under the Omnibus Incentive Plan, (iii) awards granted in connection with the assumption or substitution of awards as part of a transaction, and (iv) awards that may be settled only in cash.
Dividend Equivalents. A dividend equivalent is the right to receive payments in cash or in stock, based on dividends with respect to shares of stock. Dividend equivalents may be granted to participants in tandem with another award or as freestanding awards.
Termination of Employment or Service. Except as provided below under “Effect of a Change in Control” or as determined by the Administrator, unvested awards granted under the Omnibus Incentive Plan will be forfeited upon a participant’s termination of employment or service to the Company.
Other Forfeiture Provisions; Clawback. A participant will be required to forfeit and disgorge any awards granted or vested and all gains earned or accrued due to the exercise of stock options or SARs or the sale of any Company common stock to the extent required by any policies as to forfeiture and recoupment or clawback policies as may be adopted by the Administrator or the board of directors, or as required by applicable law, including Section 304 of the Sarbanes-Oxley Act and Section 10D of the Exchange Act, or as required by any stock exchange or quotation system on which our common stock is listed.
In addition, in the event a participant engages in “competitive activity” (as defined in the Omnibus Incentive Plan) following a termination of the participant’s employment or service, all options and SARs, whether vested or unvested, and all other awards that are vested or unpaid as of the date of engagement in competitive activity may (in the Administrator’s discretion) be immediately forfeited and canceled, and any portion of the participant’s award that became vested after such termination of employment or service, and any shares of common stock or cash issued upon exercise or settlement of such awards, may (in the Administrator’s discretion) be immediately forfeited, canceled, and disgorged or paid to the Company together with all gains earned or accrued due to the sale of shares of common stock issued upon exercise or settlement of the awards.
Change in Capitalization or Other Corporate Event. The number or amount of shares of stock, other property or cash covered by outstanding awards, the number and type of shares of stock that have been authorized for issuance under the Omnibus Incentive Plan, the exercise or purchase price of each outstanding award, and the other terms and conditions of outstanding awards, will be subject to adjustment by the Administrator in the event of any stock dividend, extraordinary dividend, stock split or share combination or any recapitalization, merger, consolidation, exchange of shares, spin-off, liquidation or dissolution of the Company or other similar transaction affecting our common stock. Any such adjustment would not be considered a repricing for purposes of the prohibition on repricing described above.
Effect of a Change in Control. Except as otherwise determined by the Administrator, upon a future change in control of the Company, unless prohibited by applicable law (including if such action would trigger adverse tax treatment under Section 409A of the Code), no accelerated vesting or cancellation of awards would occur if the awards are assumed and/or replaced in the change in control with substitute awards having the same or better terms and conditions, except that any substitute awards must fully vest on a participant’s involuntary termination of employment without “cause” or for “good reason” (as defined in the Omnibus Incentive Plan), in each case occurring within 12 months following the date of the change in control. To the extent that awards that vest based on continued service are not assumed and/or replaced in this manner, then those awards would fully vest and be cancelled for the same per share payment made to the shareholders in the change in control (less, in the case of options and SARs, the applicable exercise or base price). Performance-vesting awards would be modified into time-vesting awards at the time of the change in control based on either target or actual levels of performance (as determined by the Administrator), and the modified awards would then either be replaced or assumed, or cashed out, as described above. The Administrator has the ability to prescribe different treatment of awards in the award agreements and/or to take actions that are more favorable to participants.
155
Table of Contents
Expiration Date. The Omnibus Incentive Plan has a ten-year term and will expire at the end of that term unless further approval of our shareholders of the Omnibus Incentive Plan (or a successor plan) is obtained. However, the expiration of the Omnibus Incentive Plan would have no effect on outstanding awards previously granted.
DIRECTOR COMPENSATION
The following table provides summary information concerning compensation paid or accrued by, or on behalf of, our non-employee directors for services rendered to us during fiscal year 2019.
Mr. Lynton is entitled to an annual retainer of $350,000, payable pro rata quarterly in arrears, for his service on the Company’s board of directors, and he was paid a prorated portion of this retainer from the date of his appointment to the Company’s board of directors on February 7, 2019. Mathias Döpfner is entitled to an annual retainer of €250,000, payable pro rata quarterly in arrears, for his service as a director on the Company’s board of directors. Messrs. Lee and Kreiz and Ms. Hertz were entitled to $75,000 for fiscal year 2019. No other non-employee directors received any compensation for service on the Company’s board of directors or board committees during fiscal year 2019.
Directors are entitled to reimbursement of their expenses incurred in connection with travel to meetings. In addition, the Company reimburses directors for fees paid to attend director education events.
| Name |
Fees Earned or Paid in Cash ($) |
Stock Awards ($) |
Option Awards ($) |
Non-Equity Incentive Plan Compensation ($) |
Change in Pension Value and Nonqualified Deferred Compensation Earnings |
All Other Compensation ($) |
Total ($) | |||||||||||||||||||||
| Michael Lynton |
$ | 226,528 | — | — | — | — | — | $ | 226,528 | |||||||||||||||||||
| Lincoln Benet |
— | — | — | — | — | — | — | |||||||||||||||||||||
| Alex Blavatnik |
— | — | — | — | — | — | — | |||||||||||||||||||||
| Len Blavatnik |
— | — | — | — | — | — | — | |||||||||||||||||||||
| Mathias Döpfner |
$ | 282,150 | (1) | — | — | — | — | — | $ | 282,150 | ||||||||||||||||||
| Noreena Hertz |
$ | 75,000 | — | — | — | — | — | $ | 75,000 | |||||||||||||||||||
| Ynon Kreiz |
$ | 75,000 | — | — | — | — | — | $ | 75,000 | |||||||||||||||||||
| Thomas H. Lee |
$ | 75,000 | — | — | — | — | — | $ | 75,000 | |||||||||||||||||||
| Donald A. Wagner |
— | — | — | — | — | — | — | |||||||||||||||||||||
| (1) | The amount reported for Mr. Döpfner has been converted from Euros to U.S. dollars using a conversion factor of 1.1286 as of September 30, 2019. |
Changes to Director Compensation in Connection with the Offering
We expect to implement a non-officer director compensation program following the offering, including a mix of cash and equity compensation as well as certain benefits.
156
Table of Contents
Cash Retainers and Equity-Based Award
| Compensation Item |
Amount | |
| Annual Cash Retainer |
$100,000 | |
| Annual Equity Award |
$175,000 restricted stock grant with one-year vesting | |
| Board Chair Additional Retainer |
$80,000 restricted stock grant with one-year vesting and $45,000 in cash | |
| Committee Chair Annual Cash Retainer Fee |
Audit Committee: $15,000 Compensation Committee: $15,000 Nominating & Governance Committee: $15,000 Executive Committee: $15,000 Finance Committee: $15,000 | |
| Committee Member Annual Cash Retainer Fee |
Audit Committee: $5,000 Compensation Committee: $5,000 Nominating & Governance Committee: $5,000 Executive Committee: $5,000 Finance Committee: $5,000 |
Non-officer directors who are affiliated with Access will not be entitled to compensation for service as a director or committee member during any period in which Access owns more than 50% of the value of the Company’s outstanding equity.
Directors are also entitled to reimbursement of their expenses incurred in connection with travel to meetings. In addition, the Company reimburses directors for fees paid to attend director education events.
Stock Ownership
We intend to implement a stock ownership policy under which our non-officer directors who are not affiliated with Access will be required to hold four times the value of their annual cash retainer in Company stock (which includes unvested restricted stock). The directors will be required to retain 100% of any net shares (after the payment of taxes) received as compensation until the ownership requirement is achieved.
COMPENSATION COMMITTEE INTERLOCKS AND INSIDER PARTICIPATION
None of the Compensation Committee’s members is or has been a Company officer or employee during the last fiscal year. During fiscal year 2019, none of the Company’s executive officers served on the Company’s board of directors, the Compensation Committee or any similar committee of another entity of which an executive officer served on our board of directors or Compensation Committee.
157
Table of Contents
PRINCIPAL AND SELLING STOCKHOLDERS
The following tables set forth information as of May 15, 2020 with respect to the ownership of our common stock by:
| • | each person known to own beneficially more than five percent of our common stock, including the selling stockholders; |
| • | each of our directors; |
| • | each of our named executive officers; and |
| • | all of our current executive officers and directors as a group. |
The amounts and percentages of shares beneficially owned are reported on the basis of regulations of the SEC governing the determination of beneficial ownership of securities. Under SEC rules, a person is deemed to be a “beneficial owner” of a security if that person has or shares voting power or investment power, which includes the power to dispose of or to direct the disposition of such security. A person is also deemed to be a beneficial owner of any securities of which that person has a right to acquire beneficial ownership within 60 days. Securities that can be so acquired are deemed to be outstanding for purposes of computing such person’s ownership percentage, but not for purposes of computing any other person’s percentage. Under these rules, more than one person may be deemed to be a beneficial owner of the same securities, and a person may be deemed to be a beneficial owner of securities as to which such person has no economic interest.
Applicable percentage ownership before the offering is based on no shares of Class A common stock and 510,000,000 shares of Class B common stock outstanding. Applicable percentage ownership after the offering is based on (i) 70,000,000 shares of Class A common stock and 440,000,000 shares of Class B common stock outstanding immediately after the completion of this offering (assuming no exercise by the underwriters of their option to purchase additional shares of Class A common stock from the selling stockholders) and (ii) 80,500,000 shares of Class A common stock and 429,500,000 shares of Class B common stock outstanding immediately after the completion of this offering (assuming that the underwriters exercise their option to purchase additional shares of Class A common stock from the selling stockholders in full).
158
Table of Contents
Except as otherwise indicated in these footnotes, each of the beneficial owners listed has, to our knowledge, sole voting and investment power with respect to the indicated shares of common stock. Unless otherwise set forth in the footnotes to the table, the address for each listed stockholder is c/o Warner Music Group Corp., 1633 Broadway, New York, New York 10019.
| Shares Beneficially Owned Before the Offering |
% of Total Voting Power Before Offering(1) |
Shares Offered Hereby |
Shares Beneficially Owned After the Offering Assuming the Underwriters’ Option Is Not Exercised(1) |
% of Total Voting Power After Offering Assuming the Underwriters’ Option Is Not Exercised(1) |
Shares Beneficially Owned After the Offering Assuming Exercise of Underwriters’ Option |
% of Total Voting Power After Offering Assuming Exercise of Underwriters’ Option(1) |
||||||||||||||||||||||||||||||||||||||||||||||||||||||||||
| Class A | Class B | Class A | Class B | Class A | Class B | |||||||||||||||||||||||||||||||||||||||||||||||||||||||||||
| Name of Beneficial |
Shares | % | Shares | % | Shares | % | Shares | % | Shares | % | Shares | % | ||||||||||||||||||||||||||||||||||||||||||||||||||||
| AI Entertainment Holdings LLC(2)(3) |
— | — | 444,629,202(4) | 87.2% | 87.2% | 45,886,845(3) | — | — | 398,742,357 | 90.6% | 89.9% | — | — | 388,603,687 | 90.5% | 89.6% | ||||||||||||||||||||||||||||||||||||||||||||||||
| Altep 2012 L.P. (5) |
— | — | 2,001,168 | * | * | 289,578 | — | — | 1,711,590 | * | * | — | — | 1,668,153 | * | * | ||||||||||||||||||||||||||||||||||||||||||||||||
| WMG Management Holdings, LLC (5) |
— | — | 26,256,169 | 5.1% | 5.1% | 2,119,286 | — | — | 24,136,883 | 5.5% | 5.4% | — | — | 23,818,990 | 5.5% | 5.5% | ||||||||||||||||||||||||||||||||||||||||||||||||
| Access Industries, LLC (2)(6) |
— | — | 20,479,800(6) | 4.0% | 4.0% | 20,479,800 | — | — | — | — | — | — | — | — | — | — | ||||||||||||||||||||||||||||||||||||||||||||||||
| AI Entertainment Management, LLC |
— | — | 6,501,216(7) | 1.3% | 1.3% | 1,224,491 | — | — | 5,276,725 | 1.2% | 1.2% | — | — | 5,276,725 | 1.2% | 1.2% | ||||||||||||||||||||||||||||||||||||||||||||||||
| CT/FT Holdings LLC(3) |
— | — | 2,978,598(6) | * | * | — | — | — | 2,978,598 | * | * | — | — | 2,978,598 | — | — | ||||||||||||||||||||||||||||||||||||||||||||||||
| Blavatnik Family Foundation LLC (2)(7) |
— | — | — | — | — | — | — | — | — | — | — | — | — | — | — | — | ||||||||||||||||||||||||||||||||||||||||||||||||
| Blavatnik July 2019-13 Investment Trust(3) |
— | — | 6,850,786(6) | 1.3% | 1.3% | — | — | — | 6,850,786 | * | * | — | — | 6,850,786 | — | — | ||||||||||||||||||||||||||||||||||||||||||||||||
| Michael Lynton |
— | — | — | — | — | — | — | — | — | — | — | — | — | — | — | — | ||||||||||||||||||||||||||||||||||||||||||||||||
| Len Blavatnik (8) |
— | — | 509,696,939 | 100.0 | % | 100.0 | % | — | — | — | 440,000,000 | 100.0% | 99.2% | — | — | 429,500,000 | 100.0% | 99.1% | ||||||||||||||||||||||||||||||||||||||||||||||
| Lincoln Benet (5)(9) |
— | — | — | — | — | — | — | — | — | — | — | — | — | — | — | — | ||||||||||||||||||||||||||||||||||||||||||||||||
| Alex Blavatnik(3) |
— | — | 303,061(6) | * | * | — | — | — | 303,061 | * | * | — | — | 303,061 | — | — | ||||||||||||||||||||||||||||||||||||||||||||||||
| Mathias Döpfner |
— | — | — | — | — | — | — | — | — | — | — | — | — | — | — | — | ||||||||||||||||||||||||||||||||||||||||||||||||
| Noreena Hertz |
— | — | — | — | — | — | — | — | — | — | — | — | — | — | — | — | ||||||||||||||||||||||||||||||||||||||||||||||||
| Ynon Kreiz |
— | — | — | — | — | — | — | — | — | — | — | — | — | — | — | — | ||||||||||||||||||||||||||||||||||||||||||||||||
| Thomas H. Lee |
— | — | — | — | — | — | — | — | — | — | — | — | — | — | — | — | ||||||||||||||||||||||||||||||||||||||||||||||||
| Donald A. Wagner (5)(9) |
— | — | — | — | — | — | — | — | — | — | — | — | — | — | — | — | ||||||||||||||||||||||||||||||||||||||||||||||||
| Stephen Cooper (5)(9) |
— | — | — | — | — | — | — | — | — | — | — | — | — | — | — | — | ||||||||||||||||||||||||||||||||||||||||||||||||
| Max Lousada (5)(9) |
— | — | — | — | — | — | — | — | — | — | — | — | — | — | — | — | ||||||||||||||||||||||||||||||||||||||||||||||||
| Eric Levin |
— | — | — | — | — | — | — | — | — | — | — | — | — | — | — | — | ||||||||||||||||||||||||||||||||||||||||||||||||
| Carianne Marshall |
— | — | — | — | — | — | — | — | — | — | — | — | — | — | — | — | ||||||||||||||||||||||||||||||||||||||||||||||||
| Guy Moot |
— | — | — | — | — | — | — | — | — | — | — | — | — | — | — | — | ||||||||||||||||||||||||||||||||||||||||||||||||
| Maria Osherova |
— | — | — | — | — | — | — | — | — | — | — | — | — | — | — | — | ||||||||||||||||||||||||||||||||||||||||||||||||
| Paul M. Robinson |
— | — | — | — | — | — | — | — | — | — | — | — | — | — | — | — | ||||||||||||||||||||||||||||||||||||||||||||||||
| Oana Ruxandra |
— | — | — | — | — | — | — | — | — | — | — | — | — | — | — | — | ||||||||||||||||||||||||||||||||||||||||||||||||
| James Steven |
— | — | — | — | — | — | — | — | — | — | — | — | — | — | — | — | ||||||||||||||||||||||||||||||||||||||||||||||||
| All current directors and executive officers as a group (18 persons) (3)(9) |
— | — | 510,000,000 | 100.0 | % | 100.0 | % | — | — | — | 440,000,000 | 100.0 | % | 99.2 | — | — | 429,500,000 | 100.0 | % | 99.1 | ||||||||||||||||||||||||||||||||||||||||||||
| * | Less than one percent. |
| (1) | Percentage of total voting power represents voting power with respect to all shares of our Class A common stock and Class B common stock, as a single class. The holders of our Class B common stock are entitled to 20 votes per share, and holders of our Class A common stock are entitled to one vote per share. For more information about the voting rights of our Class A and Class B common stock, see “Description of Capital Stock—Common Stock.” |
| (2) | Access Industries, LLC may contribute shares of Class B common stock to one or more series of Blavatnik Family Foundation LLC (“BFFLLC”) in connection with this offering, and one or more such series of BFFLLC may, if authorized by its member(s), participate in the offering as a selling stockholder. Any contribution of shares of Class B common stock to one or more series of BFFLLC (or the decision of any member of any series of BFFLLC not to authorize the sale of all or a portion of such series’ shares in this offering) will not change the aggregate number of shares of Class A common stock being offered by the selling stockholders in this offering. To the extent that shares of common stock held by any series of BFFLLC, if any, are not included in this offering, AI Entertainment Holdings LLC and/or Access Industries, LLC will sell a corresponding number of shares of Class A common stock such that the aggregate number of shares of Class A common stock being offered and sold by the selling stockholders in this offering remains unchanged. |
| (3) | Assumes that (i) none of CT/FT Holdings LLC, Blavatnik July 2019-13 Investment Trust and Alex Blavatnik sell any shares of Class A common stock in this offering and (ii) AI Entertainment Holdings LLC sells a corresponding number of shares of Class A common stock such that the aggregate number of shares of Class A common stock being offering and sold by the selling stockholders in this offering remains unchanged. |
| (4) | Reflects shares to be distributed by AI Entertainment Holdings LLC to Access Industries, LLC, CT/FT Holdings LLC, Blavatnik July 2019-13 Investment Trust, and Alex Blavatnik in connection with this offering. |
| (5) | In connection with the offering, Altep 2012 L.P. and WMG Management Holdings, LLC will sell a portion of the shares of Class A common stock that they hold. The proceeds of such sales will be distributed to beneficial owners of limited partnership interests, in the case of Altep 2012 L.P., and to certain members of management that beneficially own deferred equity units and Profits Interests, in the case of WMG Management Holdings, LLC, in |
159
Table of Contents
| each case in accordance with the terms of the relevant limited partnership agreement or limited liability company operating agreement. No shares issuable for deferred equity units granted under the Plan will be sold in the offering. For additional information on the Plan, see “Executive Compensation—Long-Term Equity Incentives—Warner Music Group Corp. Senior Management Free Cash Flow Plan.” |
| (6) | Represents shares to be received by means of distribution from AI Entertainment Holdings LLC in connection with this offering. Assumes that Access Industries, LLC sells all 20,479,800 shares reflected in the table above in this offering. AI Entertainment Holdings LLC may sell some or all of such shares in lieu of Access Industries, LLC. |
| (7) | Assumes that no series of BFFLLC receives any shares of Class B common stock as a contribution from Access Industries, LLC in connection with this offering. |
| (8) | Represents shares held by entities over which Len Blavatnik either exercises or may be deemed to exercise direct or indirect control as of the date of this prospectus. |
| (9) | Does not reflect shares of the Company’s common stock that may be attributable to the beneficial owners of limited partnership interests in Altep 2012 L.P. or Acquired LLC Units and Profits Interests in WMG Management Holdings, LLC or deferred equity units granted under the Plan. Messrs. Benet and Wagner beneficially own limited partnership interests in Altep 2012 L.P. and disclaim any beneficial ownership of shares of the Company’s common stock. Messrs. Cooper and Lousada own Profits Interests, and Mr. Cooper owns Acquired LLC Units, in WMG Management Holdings, LLC and each of them holds vested deferred equity units granted under the Plan (with respect to Mr. Cooper, this includes interests and units held in trust) and disclaim any beneficial ownership of shares of the Company’s common stock. |
160
Table of Contents
CERTAIN RELATIONSHIPS AND RELATED PARTY TRANSACTIONS
Policies and Procedures for Related Person Transactions
Prior to the consummation of this offering, our board of directors will approve written policies and procedures with respect to the review and approval of certain transactions between us and a “Related Person,” or a “Related Person Transaction,” which we refer to as our “Related Person Transaction Policy.” Pursuant to the terms of the Related Person Transaction Policy, our board of directors, acting through our Audit Committee, must review and decide whether to approve or ratify any Related Person Transaction. Any potential Related Person Transaction is required to be reported to our legal department, which will then determine whether it should be submitted to our Audit Committee for consideration. The Audit Committee must then review and decide whether to approve any Related Person Transaction.
For the purposes of the Related Person Transaction Policy, a “Related Person Transaction” is a transaction, arrangement or relationship (or any series of similar transactions, arrangements or relationships) in which we were, are or will be a participant and the amount involved exceeds $120,000, and in which any Related Person had, has or will have a direct or indirect material interest.
A “Related Person,” as defined in the Related Person Transaction Policy, means any person who is, or at any time since the beginning of our last fiscal year was, a director or executive officer of WMG or a nominee to become a director of WMG; any person who is known to be the beneficial owner of more than five percent of our common stock; any immediate family member of any of the foregoing persons, including any child, stepchild, parent, stepparent, spouse, sibling, mother-in-law, father-in-law, son-in-law, daughter-in-law, brother-in-law, or sister-in-law of the director, executive officer, nominee or more than five percent beneficial owner, and any person (other than a tenant or employee) sharing the household of such director, executive officer, nominee or more than five percent beneficial owner; and any firm, corporation or other entity in which any of the foregoing persons is a general partner or, for other ownership interests, a limited partner or other owner in which such person has a beneficial ownership interest of ten percent or more.
Relationship with Access Following this Offering
Following this offering, Access will continue to hold more than majority of the total combined voting power of our outstanding common stock, and as a result Access will continue to have significant control of our business, including pursuant to the agreements described below. See “Risk Factors—Risks Related to Our Controlling Stockholder—Following the completion of this offering, Access will continue to control us and may have conflicts of interest with other stockholders. Conflicts of interest may arise because affiliates of our controlling stockholder have continuing agreements and business relationships with us.”
Stockholder Agreement
We intend to enter into a stockholder agreement (the “Stockholder Agreement”) with Access prior to the consummation of this offering. The Stockholder Agreement will govern the relationship between Access and us following this offering, including matters related to our corporate governance, including board nomination rights and information rights.
Boards of Directors and Access Rights with respect to Director Designation
The Stockholder Agreement will grant Access the right to designate nominees for our board of directors, whom we refer to as the “Access Designees,” subject to maintaining specified ownership levels. Specifically, the Stockholder Agreement will grant Access the right to designate for nomination for election to our board of directors a number of Access Designees equal to:
| • | all directors comprising our board of directors at such time as long as Access holds at least 50% of the total combined voting power of our outstanding common stock; |
161
Table of Contents
| • | at least 40% of the total number of directors comprising our board of directors at such time as long as Access holds at least 40% but less than 50% of the total combined voting power of our outstanding common stock; |
| • | at least 30% of the total number of directors comprising our board of directors at such time as long as Access holds at least 30% but less than 40% of the total combined voting power of our outstanding common stock; |
| • | at least 20% of the total number of directors comprising our board of directors at such time as long as Access holds at least 20% but less than 30% of the total combined voting power of our outstanding common stock; and |
| • | at least 10% of the total number of directors comprising our board of directors at such time as long as Access holds at least 10% but less than 20% of the total combined voting power of our outstanding common stock. |
For purposes of calculating the number of Access Designees that Access is entitled to nominate pursuant to the formula outlined above, any fractional amounts would be rounded up to the nearest whole number and the calculation would be made on a pro forma basis after taking into account any increase in the size of our board of directors. With respect to any vacancy of an Access-designated director, Access will have the right to designate a new director for election by a majority of the remaining directors then on our board of directors. The Stockholder Agreement will provide that an Access-designated director will serve as the Chairman of our board of directors as long as Access holds at least 35% of the total combined voting power of our outstanding common stock.
Consent Rights
The Stockholder Agreement will provide that, until and including the date on which Access ceases to hold at least 10% of our outstanding common stock, the prior written consent of Access will be required before we may take any of the following actions, whether directly or indirectly through a subsidiary:
| • | any merger, consolidation or similar transaction (or any amendment to or termination of an agreement to enter into such a transaction) with or into any other person whether in a single transaction or a series of transactions, other than any acquisition or disposition involving consideration less than $25 million; |
| • | any acquisition or disposition of securities, assets or liabilities involving consideration or book value greater than $25 million; |
| • | any change in our authorized capital stock or the creation of any new class or series of our capital stock; |
| • | any issuance or acquisition of capital stock (including stock buy-backs, redemptions or other reductions of capital), or securities convertible into or exchangeable or exercisable for capital stock or equity-linked securities, except (i) issuances of equity awards to directors or employees pursuant to an equity compensation plan approved by our board of directors; (ii) issuances or acquisitions of capital stock of one of our subsidiaries to or by one of our wholly-owned subsidiaries; and (iii) issuances or acquisitions of capital stock that our board of directors determines are necessary to maintain compliance with covenants contained in any debt instrument; |
| • | any issuance or acquisition (including redemptions, prepayments, open market or negotiated repurchases or other transactions reducing the outstanding debt of the Company or any subsidiary) of debt securities to or from a third party involving an aggregate principal amount exceeding $25 million; |
| • | any other incurrence of a debt obligation to or from a third party having a principal amount greater than $25 million; |
| • | entry into or termination of any joint venture or similar business alliance having a value exceeding $25 million; |
162
Table of Contents
| • | listing or delisting of any securities on a securities exchange, other than the listing or delisting of debt securities on Nasdaq or any other securities exchange located solely in the United States; |
| • | (A) any action to increase or decrease the size of the board of directors, (B) the formation of, or delegation of authority to, any new committee, or subcommittee thereof, of the board of directors, (C) the delegation of authority to any existing committee or subcommittee thereof not set forth in the committee’s charter or authorized by the board of directors prior to consummation of this offering or (D) any amendments to the charter (or equivalent authorizing document) of any committee, including any action to increase or decrease size of any committee (whether by amendment or otherwise), except in each case as required by applicable law; |
| • | any amendment (or approval or recommendation of any amendment) to our certificate of incorporation or by-laws; |
| • | any filing or petition under bankruptcy laws, admission of insolvency or similar actions by us or any of our subsidiaries, or our dissolution or winding-up; |
| • | the election, appointment, hiring, dismissal or removal of the Company’s chief executive officer, chief financial officer or general counsel; |
| • | any material change in a significant accounting policy of the Company and any termination or change of the Company’s independent auditor; |
| • | settlement of any litigation to which the Company or any of its subsidiaries is a party involving the payment by the Company or any of its subsidiaries of an amount equal to or greater than $15 million; or |
| • | the creation or amendment of any stock option, employee stock purchase or similar equity-based plan for management or employees, or any increase in the number of shares of Common Stock reserved under such plan. |
Other Rights
The Stockholder Agreement will also grant to Access certain other rights, including specified information and access rights and rights to have certain expenses reimbursed by the Company.
Registration Rights Agreement
We intend to enter into a registration rights agreement with Access (the “Registration Rights Agreement”) prior to the consummation of this offering. The Registration Rights Agreement will provide Access certain registration rights relating to shares of our common stock held by Access whereby, at any time following the consummation of this offering and the expiration of any related lock-up period, Access and its permitted
transferees may require us to register under the Securities Act, all or any portion of these shares, a so-called “demand request.” Access and its permitted transferees will also have “piggyback” registration rights, such that Access and its permitted transferees may include their respective shares in any future registrations of our equity securities, whether or not that registration relates to a primary offering by us or a secondary offering by or on behalf of any of our stockholders.
The Registration Rights Agreement will set forth customary registration procedures, including an agreement by us to make our management reasonably available to participate in road show presentations in connection with any underwritten offerings. We will also agree to indemnify Access and its permitted transferees with respect to liabilities resulting from untrue statements or omissions in any registration statement used in any such registration, other than untrue statements or omissions resulting from information furnished to us for use in a registration statement by Access or any permitted transferee.
163
Table of Contents
Transactions with Access Affiliates
As a wholly owned subsidiary of Access, historically, we have entered into various transactions with Access and its subsidiaries in the normal course of business including, among others, service agreements, lease arrangements and license arrangements. The transactions described below are between us and affiliates of Access that are not also subsidiaries of WMG.
Management Agreement
The Company and Holdings are party to the Management Agreement pursuant to which Access provides the Company and its subsidiaries with financial, investment banking, management, advisory and other services. Pursuant to the Management Agreement, the Company pays quarterly to Access an annual fee and reimburses Access for certain expenses incurred performing services under the agreement. The Company and Holdings agreed to indemnify Access and certain of its affiliates against all liabilities arising out of performance of the Management Agreement.
Costs incurred by the Company under the terms of the Management Agreement were approximately $11 million, $16 million and $9 million for the fiscal years ended September 30, 2019, September 30, 2018 and September 30, 2017, respectively. The fiscal year ended September 30, 2019 included the annual base fee of $9 million and an increase of $2 million calculated pursuant to the Management Agreement. The fiscal year ended September 30, 2018 included the annual base fee of $9 million and an increase of $7 million calculated pursuant to the Management Agreement.
The Management Agreement will terminate in accordance with its terms upon consummation of this offering, and the Company will pay all fees and expenses due and payable thereunder following such termination in accordance with the terms of the Management Agreement, including a termination fee and a fee for transaction services in an estimated aggregate amount of approximately $60 million.
Lease Arrangements with Access
On March 29, 2019, an affiliate of Access acquired the Ford Factory Building, located on 777 S. Santa Fe Avenue in Los Angeles, California, from an unaffiliated third party. The building is the Company’s new Los Angeles, California headquarters and as such, the Company is the sole tenant of the building acquired by Access. The existing lease agreement was assumed by Access upon purchase of the building and was not modified as a result of the purchase. Rental payments by the Company under the existing lease total approximately $12 million per year, subject to annual fixed increases. The remaining lease term is approximately 11 years, after which the Company may exercise a single option to extend the term of the lease for 10 years thereafter.
On August 13, 2015, a subsidiary of the Company, Warner Music Inc., entered into a license agreement with Access, for the use of office space in the Company’s corporate headquarters at 1633 Broadway New York, New York. The license fee of $2,775 per month, plus an IT support fee of $1,000 per month, was based on the per foot lease costs to the Company of its headquarters space, which represented market terms. The space is occupied by The Blavatnik Archive, which is dedicated to the discovery and preservation of historically distinctive and visually compelling artifacts, images and stories that contribute to the study of 20th century Jewish, WWI and WWII history. For the fiscal years ended September 30, 2019, September 30, 2018 and September 30, 2017, an immaterial amount was recorded as rental income.
On July 29, 2014, AI Wrights Holdings Limited, an affiliate of Access, entered into a lease and related agreements with Warner Chappell Music Limited and WMG Acquisition (UK) Limited, subsidiaries of the Company, for the lease of 27 Wrights Lane, Kensington, London. The Company had been the tenant of the building, which Access acquired. Subsequent to the change in ownership, the parties entered into the lease and related agreements pursuant to which, on January 1, 2015, the rent was increased to £3,460,250 per year and the term was extended for an additional five years from December 24, 2020 to December 24, 2025, with a market rate rent review beginning December 25, 2020.
164
Table of Contents
Music Publishing Agreement
Val Blavatnik (the son of the Company’s director and controlling shareholder, Len Blavatnik) entered into a music publishing contract with Warner-Tamerlane Publishing Corp., dated September 7, 2018, pursuant to which, in fiscal 2019, he was paid $162,500 in advances recoupable from royalties otherwise payable to him from the licensing of musical compositions written or co-written by him.
License Agreements with Deezer
Access owns a controlling equity interest in Deezer S.A., which was formerly known as Odyssey Music Group (“Odyssey”), a French company that controls and operates a music streaming service, formerly through Odyssey’s subsidiary, Blogmusik SAS, under the name Deezer, and is represented on Deezer S.A.’s Board of Directors. Subsidiaries of the Company have been a party to license agreements with Deezer since 2008, which provide for the use of the Company’s sound recordings on Deezer’s ad-supported and subscription streaming services worldwide (excluding Japan) in exchange for fees paid by Deezer. The Company has also authorized Deezer to include the Company’s sound recordings in Deezer’s streaming services where such services are offered as a bundle with third-party services or products (e.g., telco services or hardware products), for which Deezer is also required to make payments to the Company. Deezer paid to the Company an aggregate amount of approximately $49 million, $39 million and $36 million in connection with the foregoing arrangements during the fiscal years ended September 30, 2019, September 30, 2018 and September 30, 2017, respectively. In addition, in connection with these arrangements, (i) the Company was issued, and currently holds, warrants to purchase shares of Deezer S.A. and (ii) the Company purchased a small number of shares of Deezer S.A., which collectively represent a small minority interest in Deezer S.A. The Company also has various publishing agreements with Deezer. Warner Chappell has licenses with Deezer for use of repertoire on the service in Europe, which the Company refers to as a PEDL license (referencing the Company’s Pan European Digital Licensing initiative), and for territories in Latin America. For the PEDL and Latin American licenses for the fiscal year ended September 30, 2019, Deezer paid the Company an additional approximately $1 million. Deezer also licenses other publishing rights controlled by Warner Chappell through statutory licenses or through various collecting societies.
Investment in Tencent Music Entertainment Group
On October 1, 2018, WMG China LLC (“WMG China”), an affiliate of the Company, entered into a share subscription agreement with Tencent Music Entertainment Group pursuant to which WMG China agreed to purchase 37,162,288 ordinary shares of Tencent Music Entertainment Group for $100 million. WMG China is 80% owned by AI New Holdings 5 LLC, an affiliate of Access, and 20% owned by the Company. On October 3, 2018, WMG China acquired the shares pursuant to the share subscription agreement.
Acquisitions of Selected Assets of Songkick
As of July 12, 2017, we acquired selected assets from Songkick, including the concert discovery app and website and the Songkick trademark, for a purchase price of $5 million. At the time we acquired such assets, Access owned a significant minority interest in the seller.
Relationships with Other Directors, Executive Officers and Affiliates
Lease Arrangements with Cooper Investment Partners
On July 15, 2016, a subsidiary of the Company, Warner Music Inc., entered into a license agreement with Cooper Investment Partners LLC, for the use of office space in the Company’s corporate headquarters at 1633 Broadway, New York, New York. The license fee of $16,967.21 per month, was based on the per foot lease costs to the Company of its headquarters space, which represented market terms. For the fiscal years ended September 30, 2019, September 30, 2018 and September 30, 2017, an immaterial amount was recorded as rental
165
Table of Contents
income. The space is occupied by Cooper Investment Partners LLC, which is a private equity fund that pursues a wide range of investment opportunities. Mr. Cooper, Chief Executive Officer and a director of the Company, is the Managing Partner of Cooper Investment Partners LLC.
Loan Agreement with Max Lousada
On April 16, 2018, the Company loaned $227,000 to Mr. Lousada in exchange for a promissory note. Mr. Lousada was obligated to repay this loan upon the earliest of specified events, including April 30, 2019, termination of his employment, the event of a default (as specified therein) or if the Company or one of its affiliates became an issuer of publicly traded stock. Mr. Lousada repaid this loan prior to April 30, 2019.
Director Indemnification Agreements
Prior to the consummation of this offering, we will enter into indemnification agreements with our directors. The indemnification agreements will provide the directors with contractual rights to indemnification and expense rights. See “Description of Capital Stock—Limitations on Liability and Indemnification.”
166
Table of Contents
The following description of our capital stock is a summary of the material terms of our amended and restated certificate of incorporation and amended and restated by-laws. Reference is made to the more detailed provisions of, and the descriptions are qualified in their entirety by reference to, these documents, forms of which will be filed with the SEC as exhibits to the registration statement of which this prospectus is a part, and applicable law. This description assumes the effectiveness of our amended and restated certificate of incorporation and amended and restated by-laws, which will take effect prior to the consummation of this offering.
General
Our authorized capital stock consists of 1,000,000,000 shares of Class A common stock, par value $0.001 per share, 1,000,000,000 shares of Class B common stock, par value $0.001, and 100,000,000 shares of preferred stock, par value $1.00 per share. Upon the closing of this offering, there will be 70,000,000 shares of our Class A common stock issued and outstanding, 440,000,000 shares of our Class B common stock issued and outstanding and no shares of our preferred stock outstanding.
Common Stock
Except as otherwise expressly provided in our amended and restated certificate of incorporation or as required by applicable law and as described herein, our Class A common stock and Class B common stock have the same rights, are equal in all respects and are treated by us as if they were one class of shares.
Voting Rights
Shares of our Class A common stock are entitled to one vote per share and shares of our Class B common stock are entitled to 20 votes per share. Our shares of Class B common stock will automatically be converted into shares of Class A common stock upon the occurrence of certain events set forth below under “—Conversion, Exchange and Transferability.” Holders of shares of Class A common stock and Class B common stock will vote together as a single class on all matters (including the election of directors) submitted to a vote of stockholders, except as otherwise required by applicable law and as specified in our amended and restated certificate of incorporation.
Dividends
Any dividend paid or payable to the holders of shares of Class A common stock and Class B common stock will be paid on an equal priority, pari passu basis, on a per share basis to the holders of shares of Class A common stock and Class B common stock, unless different treatment of the shares of each such class is approved by the affirmative vote of a majority of the voting power of the then-outstanding shares of Class A common stock entitled to vote thereon and by the affirmative vote of a majority of the voting power of the then-outstanding shares of Class B common stock entitled to vote thereon, each voting separately as a class; provided, however, that if a dividend is paid in the form of Class A common stock or Class B common stock (or rights to acquire shares of Class A common stock or Class B common stock), then the holders of Class A common stock will receive Class A common stock (or rights to acquire shares of Class A common stock) and holders of Class B common stock will receive Class B common stock (or rights to acquire shares of Class B common stock) with holders of Class A common stock and Class B common stock receiving an identical number of shares of Class A common stock or Class B common stock (or rights to acquire such stock, as the case may be), unless approved by the affirmative vote of a majority of the voting power of the then outstanding shares of Class A common stock entitled to vote thereon and by the affirmative vote of a majority of the voting power of the then outstanding shares of Class B common stock entitled to vote thereon, each voting separately as a class. For the avoidance of doubt, shares of Class B common stock or rights to acquire Class B common stock may not be issued, paid or
167
Table of Contents
otherwise distributed to holders of Class A common stock or rights to acquire Class A common stock unless approved by the affirmative vote of a majority of the then-outstanding shares of Class B common stock entitled to vote thereon.
A dividend payable in shares of any class or series of securities of the Company or any other person, other than shares of Class A common stock or Class B common stock (or rights to acquire Class A common stock or rights to acquire Class B common stock) may be declared and paid on the basis of a distribution of (i) identical securities, on an equal per share basis, to holders of Class A common stock and Class B common stock or (ii) a separate class or series of securities to the holders of shares of Class A common stock and a different class or series of securities to the holders of shares of Class B common stock, on an equal per share basis to such holders; provided that, in connection with a dividend payable in shares pursuant to (ii) above, such separate classes or series of securities do not differ in any respect other than their relative voting rights, with holders of Class B common stock receiving the class or series of securities having the highest relative voting rights and the holders of shares of Class A common stock receiving securities having lesser relative voting rights; provided that the highest relative voting rights are no more than 20 times greater than the lesser relative voting rights; provided further, that unless approved by the affirmative vote of a majority of the voting power of the then-outstanding shares of Class B common stock, entitled to vote thereon, the class or series of securities received by the holders of the Class B common stock shall provide for 20 votes per share.
Liquidation
In the event of our dissolution, liquidation or winding-up of our affairs, whether voluntary or involuntary, after payment of all our preferential amounts required to be paid to the holders of any series of preferred stock, our remaining assets legally available for distribution, if any, will be distributed among the holders of the shares of Class A common stock and Class B common stock, treated as a single class, pro rata based on the number of shares held by each such holder, unless different treatment of the shares of each such class is approved by the affirmative vote of the holders of a majority of the voting power of the then-outstanding Class A common stock and a majority of the voting power of the then-outstanding Class B common stock, voting separately.
Merger, Consolidation or Tender or Exchange Offer
The holders of Class B common stock will not be entitled to receive economic consideration for their shares in excess of that payable to the holders of Class A common stock in the event of a merger, consolidation or other business combination requiring the approval of our stockholders or a tender or exchange offer to acquire any shares of our common stock, unless different treatment of the shares of each such class is approved by the affirmative vote of the holders of a majority of the voting power of the then-outstanding Class A common stock and a majority of the voting power of the then-outstanding Class B common stock, voting separately. However, in any such event involving consideration in the form of securities of another corporation or other entity, then the holders of shares of Class B common stock shall have their shares of Class B common stock converted into, or may otherwise be paid or distributed, such securities with a greater number of votes per share (but in no event greater than 20 times; provided that, unless otherwise approved by the affirmative vote of the holders of a majority of the voting power of the then-outstanding shares of Class B common stock entitled to vote thereon, the class or series of securities received by the holders of Class B common stock shall provide for 20 votes per share) than such securities into which shares of Class A common stock are converted, or which are otherwise paid or distributed to the holders of shares of Class A common stock.
Any merger or consolidation that is not a change of control transaction would require approval by the affirmative vote of the holders of a majority of the voting power of the then-outstanding Class A common stock and a majority of the voting power of the then-outstanding Class B common stock, voting separately, unless (i) the shares of Class A common stock and Class B common stock outstanding immediately prior to such merger or consolidation are treated equally, identically and ratably or (ii) such shares are converted on a pro rata basis into shares of the surviving entity having identical rights, powers and privileges to the shares of Class A common
168
Table of Contents
stock and Class B common stock in effect immediately prior to such merger or consolidation, respectively; provided that if the voting power of the Class B common stock would be adversely affected in connection with such merger or consolidation, the approval by the affirmative vote of the holders of a majority of the then-outstanding shares of Class B common stock shall be required.
Reclassification, Subdivisions and Combinations
If we reclassify, subdivide or combine in any manner our outstanding shares of Class A common stock or Class B common stock, then all outstanding shares of Class A common stock and Class B common stock will be reclassified, subdivided or combined in the same proportion and manner, unless different treatment of the shares of each such class is approved by the affirmative vote of the holders of a majority of the voting power of the then-outstanding Class A common stock and a majority of the voting power of the then-outstanding Class B common stock, voting separately; provided that if the voting power of the Class B common stock would be adversely affected by such reclassification, subdivision or combination, the approval by the affirmative vote of a majority of the voting power of the then-outstanding shares of Class B common stock will be required.
Spin-offs
Any new company formed as a result of a spin-off to our stockholders must have a certificate of incorporation or other constituent document with provisions substantially similar in all material respects to the amended and restated certificate of incorporation, including provisions providing for the distribution of voting securities to holders of Class B common stock that have 20 times the voting power of any securities distributed to holders of Class A common stock, unless a majority of the voting power of the Class B common stock otherwise consents.
Conversion, Exchange and Transferability
Shares of Class A common stock are not convertible into any other class of shares.
Each outstanding share of Class B common stock may at any time, at the option of the holder, be converted into one share of Class A common stock. In addition, each outstanding share of Class B common stock will be automatically converted into one share of Class A common stock upon any transfer of such share of Class B common stock, except for certain permitted transfers described in our amended and restated certificate of incorporation. Permitted transfers include transfers made to Access; Len Blavatnik; the Blavatnik Family Foundation LLC; any direct or indirect equityholder of Access; any family member of any direct or indirect equityholder of Access; entities controlled, directly or indirectly, or managed by Access or an affiliate of Access; and any affiliate or permitted transferee of any of the foregoing, including any affiliate of any permitted transferee. Permitted transferees include family members, trusts solely for the benefit of any direct or indirect equityholder of Access or one or more of such equityholder’s family members and other tax and estate planning vehicles, partnerships, corporations and other entities controlled by the equityholder or such equityholder’s family members, and certain foundations and charities affiliated with Access or any permitted transferees, so long as the equityholder or permitted transferees, or a fiduciary who is selected by Access or such equityholder or permitted transferees and whom Access or such equityholder or permitted transferees have the power to remove and replace, retains voting control over the shares transferred to such foundation or charity.
Each outstanding share of Class B common stock will automatically convert into one share of Class A common stock on the first business day after the date on which the outstanding shares of Class B common stock constitutes less than 10% of the aggregate number of shares of common stock then outstanding.
In addition, all of our shares of Class B common stock will convert into shares of Class A common stock if our board of directors approves such conversion with the consent of a majority of the voting power of the Class B common stock.
169
Table of Contents
Other than as described above or set forth in our amended and restated certificate of incorporation, our Class B common stock will not automatically be converted into Class A common stock. Once converted into Class A common stock, the Class B common stock may not be reissued.
Other Provisions
The holders of our common stock will not have any preemptive, cumulative voting, subscription, conversion, redemption or sinking fund rights. The common stock will not be subject to future calls or assessments by us. The rights and privileges of holders of our common stock are subject to any series of preferred stock that we may issue in the future, as described below.
Under the amended and restated certificate of incorporation, the rights, powers, preferences and privileges of the shares of Class B common stock may not be adversely affected in any manner without the affirmative vote of the holders of a majority of the then-outstanding shares of Class B entitled to vote thereon.
Before the date of this prospectus, there has been no public market for our Class A common stock.
As of May 15, 2020, we had no shares of our Class A common stock and 510,000,000 shares of our Class B common stock outstanding and no holders of record of our Class A common stock and three holders of record of our Class B common stock.
Preferred Stock
Under our amended and restated certificate of incorporation, our board of directors will have the authority, without further action by our stockholders, to issue up to 100,000,000 shares of preferred stock in one or more series and to fix the voting powers, designations, preferences and the relative participating, optional or other special rights and qualifications, limitations and restrictions of each series, including dividend rights, dividend rates, conversion rights, voting rights, terms of redemption, liquidation preferences and the number of shares constituting any series. Upon the completion of this offering, no shares of our authorized preferred stock will be outstanding. Because our board of directors will have the power to establish the preferences and rights of the shares of any additional series of preferred stock, it may afford holders of any preferred stock preferences, powers and rights, including voting and dividend rights, senior to the rights of holders of our common stock, which could adversely affect the holders of the common stock and could delay, discourage or prevent a takeover of us even if a change of control of our company would be beneficial to the interests of our stockholders.
Annual Stockholders Meeting
Our amended and restated by-laws will provide that annual stockholders meetings will be held at a date, time and place, if any, as exclusively selected by our board of directors. To the extent permitted under applicable law, we may conduct meetings by remote communications, including by webcast.
Voting
The affirmative vote of a plurality of the voting power of the shares of our then-outstanding common stock present, in person or by proxy, at the meeting and entitled to vote on the election of directors will decide the election of any directors, and the affirmative vote of a majority of the voting power of the shares of our then-outstanding common stock present, in person or by proxy, at the meeting and entitled to vote at any annual or special meeting of stockholders will decide all other matters voted on by stockholders, unless the question is one upon which, by express provision of law, under our amended and restated certificate of incorporation, or under our amended and restated by-laws, a different vote is required, in which case such provision will control.
170
Table of Contents
Board Designation Rights
Pursuant to the Stockholder Agreement, Access will have certain board designation rights following this offering. See “Certain Relationships and Related Party Transactions—Relationship with Access Following this Offering—Stockholder Agreement.”
Removal of Directors
Our amended and restated certificate of incorporation will provide that directors may be removed with or without cause upon the affirmative vote of holders of at least a majority of the total combined voting power of our outstanding shares of common stock then entitled to vote at an election of directors; provided that the Company shall not permit the removal of an Access-designated director with Access’s consent until such time as Access first beneficially ceases to own at least 10% of the total combined voting power of the then-outstanding common stock. Any vacancy in the Board that results from (x) the death, disability, resignation or disqualification of any director shall be filled by an affirmative vote of at least a majority of the directors then in office, even if less than a quorum, or by a sole remaining director and (y) an increase in the number of directors or the removal of any director shall be filled (a) until the first date on which Access ceases to beneficially own more than 50% of the total combined voting power of our common stock, solely by an affirmative vote of the holders of at least a majority of the total combined voting power of our outstanding common stock entitled to vote in an election of directors and (b) from and after the first date on which Access ceases to beneficially own more than 50% of the total combined voting power of our common stock, by an affirmative vote of at least a majority of the directors then in office, even if less than a quorum, or by a sole remaining director.
Anti-Takeover Effects of our Certificate of Incorporation and By-laws
The provisions of our amended and restated certificate of incorporation and amended and restated by-laws summarized below may have an anti-takeover effect and may delay, defer or prevent a tender offer or takeover attempt that you might consider in your best interest, including an attempt that might result in your receipt of a premium over the market price for your shares. These provisions are also designed, in part, to encourage persons seeking to acquire control of us to first negotiate with our board of directors, which could result in an improvement of the terms offered to us.
Dual Class Common Stock. As described above in the section titled “—Common Stock—Voting Rights,” our amended and restated certificate of incorporation will provide for a dual class common stock structure pursuant to which holders of our Class B common stock will have the ability to control the outcome of matters requiring stockholder approval, even if they own significantly less than a majority of the shares of our outstanding Class A and Class B common stock, including the election of directors and significant corporate transactions, such as a merger or other sale of our company or its assets. Current investors, executives, and employees will have the ability to exercise significant influence over those matters.
Authorized but Unissued Shares of Common Stock. Following the completion of this offering, our shares of authorized and unissued common stock will be available for future issuance without additional stockholders approval. While our authorized and unissued shares are not designed to deter or prevent a change of control, under some circumstances we could use the additional shares to create voting impediments or to frustrate persons seeking to effect a takeover or otherwise gain control by, for example, issuing those shares in private placements to purchasers who might side with our board of directors in opposing a hostile takeover bid.
Authorized but Unissued Shares of Preferred Stock. Under our amended and restated certificate of incorporation, our board of directors will have the authority, without further action by our stockholders, to issue up to 100,000,000 shares of preferred stock in one or more series and to fix the voting powers, designations, preferences and the relative participating, optional or other special rights and qualifications, limitations and restrictions of each series, including dividend rights, dividend rates, conversion rights, voting rights, terms of redemption, liquidation
171
Table of Contents
preferences and the number of shares constituting any series. The existence of authorized but unissued preferred stock could reduce our attractiveness as a target for an unsolicited takeover bid since we could, for example, issue shares of preferred stock to parties who might oppose such a takeover bid or shares that contain terms the potential acquiror may find unattractive. This may have the effect of delaying or preventing a change of control, may discourage bids for the common stock at a premium over the market price of the common stock, and may adversely affect the market price of, and the voting and other rights of the holders of, our common stock.
Special Meetings of Stockholders. Our amended and restated certificate of incorporation will provide that, until the date when Access ceases to beneficially own more than 50% of the total combined voting power of our outstanding common stock, a special meeting of stockholders may be called only by our board of directors or our corporate secretary at the request of the holders of at least a majority of the total combined voting power of our outstanding common stock. From and after such date, a special meeting of the stockholders may be called only by the Chairman of our board of directors or by a resolution adopted by a majority of our board of directors.
Stockholders Advance Notice Procedure. Our amended and restated by-laws will establish an advance notice procedure for stockholders to make nominations of candidates for election as directors or to bring other business before an annual meeting of our stockholders. The amended and restated by-laws will provide that any stockholders wishing to nominate persons for election as directors at, or bring other business before, an annual meeting must deliver to our corporate secretary a written notice of the stockholder’s intention to do so. These provisions may have the effect of precluding the conduct of certain business at a meeting if the proper procedures are not followed. We expect that these provisions may also discourage or deter a potential acquirer from conducting a solicitation of proxies to elect the acquirer’s own slate of directors or otherwise attempting to obtain control of our company. To be timely, the stockholder’s notice must be delivered to our corporate secretary at our principal executive offices not less than 90 days nor more than 120 days before the first anniversary date of the annual meeting for the preceding year; provided, however, that in the event that the annual meeting is set for a date that is more than 30 days before or more than 70 days after the first anniversary date of the preceding year’s annual meeting, a stockholder’s notice must be delivered to our corporate secretary (x) not less than 90 days nor more than 120 days prior to the meeting or (y) no later than the close of business on the 10th day following the day on which a public announcement of the date of the meeting is first made by us.
No Stockholders Action by Written Consent. Our amended and restated certificate of incorporation will provide that stockholders action may be taken only at an annual meeting or special meeting of stockholders, provided that stockholders action may be taken by written consent in lieu of a meeting until Access ceases to beneficially own more than 50% of the total combined voting power of our outstanding common stock.
Amendments to Certificate of Incorporation and By-laws. Our amended and restated certificate of incorporation will provide that our amended and restated certificate of incorporation may be amended by both the affirmative vote of a majority of our board of directors and the affirmative vote of the holders of a majority of the total combined voting power of our outstanding shares of our common stock then entitled to vote at any annual or special meeting of stockholders; provided that, after the date when Access ceases to beneficially own more than 50% of the total combined voting power of our outstanding common stock, specified provisions of our amended and restated certificate of incorporation may not be amended, altered or repealed unless the amendment is approved by the affirmative vote of the holders of at least 662⁄3% of the total combined voting power of our outstanding common stock then entitled to vote at any annual or special meeting of stockholders, including the provisions governing:
| • | dual class common stock capital structure; |
| • | liability and indemnification of directors; |
| • | corporate opportunities; |
| • | elimination of stockholders action by written consent if Access ceases to beneficially own more than 50% of the total combined voting power of our outstanding common stock; |
172
Table of Contents
| • | prohibition on the rights of stockholders to call a special meeting if Access ceases to beneficially own more than 50% of the total combined voting power of our outstanding common stock; and |
| • | required approval of the holders of at least 662⁄3% of the total combined voting power of our outstanding common stock to amend our amended and restated by-laws and certain provisions of our amended and restated certificate of incorporation if Access ceases to beneficially own more than 50% of the total combined voting power of our outstanding common stock. |
In addition, our amended and restated by-laws may be amended, altered or repealed, or new by-laws may be adopted, by the affirmative vote of a majority of our board of directors, or by the affirmative vote of the holders of (x) as long Access beneficially owns more than 50% of the total combined voting power of our outstanding common stock, a majority, and (y) thereafter, at least 662⁄3%, of the total combined voting power of our outstanding common stock then entitled to vote at any annual or special meeting of stockholders.
These provisions make it more difficult for any person to remove or amend any provisions in our amended and restated certificate of incorporation and amended and restated by-laws that may have an anti-takeover effect.
Delaware Anti-Takeover Law. In general, Section 203 of the DGCL prohibits a publicly held Delaware corporation from engaging in a business combination, such as mergers, sales and leases of assets, issuances of securities and similar transactions by a corporation or subsidiary with an interested stockholder including a person or group who beneficially owns 15% or more of the corporation’s voting stock for a period of three years following the date the person became an interested stockholder, unless (with certain exceptions) the business combination or the transaction in which the person became an interested stockholder is approved in a prescribed manner. Section 203 permits corporations, in their certificate of incorporation, to opt out of the protections of Section 203. Our amended and restated certificate of incorporation will provide that we have elected not to be subject to Section 203 of the DGCL for so long as Access owns, directly or indirectly, at least five percent of the outstanding shares of our common stock. From and after the date that Access ceases to own, directly or indirectly, at least five percent of the outstanding shares of our common stock, we will be governed by Section 203.
Limitations on Liability and Indemnification
Our amended and restated certificate of incorporation will contain provisions relating to the liability of directors. These provisions will eliminate a director’s personal liability for monetary damages resulting from a breach of fiduciary duty, except in circumstances involving:
| • | any breach of the director’s duty of loyalty; |
| • | acts or omissions not in good faith or which involve intentional misconduct or a knowing violation of the law; |
| • | unlawful payments of dividends or unlawful stock repurchases, redemptions or other distributions; or |
| • | any transaction from which the director derives an improper personal benefit. |
The principal effect of the limitation on liability provision is that a stockholder will be unable to prosecute an action for monetary damages against a director unless the stockholder can demonstrate a basis for liability for which indemnification is not available under the DGCL. These provisions, however, should not limit or eliminate our rights or any stockholder’s rights to seek non-monetary relief, such as an injunction or rescission, in the event of a breach of director’s fiduciary duty. These provisions will not alter a director’s liability under federal securities laws. The inclusion of this provision in our amended and restated certificate of incorporation may discourage or deter stockholders or management from bringing a lawsuit against directors for a breach of their fiduciary duties, even though such an action, if successful, might otherwise have benefited us and our stockholders. In addition, your investment may be adversely affected to the extent we pay costs of settlement and damage awards against directors and officers pursuant to these indemnification provisions.
173
Table of Contents
Our amended and restated certificate of incorporation and our amended and restated by-laws will require us to indemnify and advance expenses to our directors and officers to the fullest extent not prohibited by the DGCL and other applicable law, except in the case of a proceeding instituted by the director without the approval of our board of directors. Our amended and restated certificate of incorporation and our amended and restated by-laws will provide that we are required to indemnify our directors and executive officers, to the fullest extent permitted by law, for all judgments, fines, settlements, legal fees and other expenses incurred in connection with pending or threatened legal proceedings because of the director’s or officer’s positions with us or another entity that the director or officer serves at our request, subject to various conditions, and to advance funds to our directors and officers to enable them to defend against such proceedings. To receive indemnification, the director or officer must have been successful in the legal proceeding or have acted in good faith and in what was reasonably believed to be a lawful manner in our best interest and, with respect to any criminal proceeding, have had no reasonable cause to believe his or her conduct was unlawful.
Prior to the consummation of this offering, we will enter into an indemnification agreement with each of our directors. The indemnification agreement will provide our directors with contractual rights to the indemnification and expense advancement rights provided under our amended and restated by-laws, as well as contractual rights to additional indemnification as provided in the indemnification agreement.
Corporate Opportunities
Our amended and restated certificate of incorporation will provide that we, on our behalf and on behalf of our subsidiaries, renounce any interest or expectancy in, or in being offered an opportunity to participate in, corporate opportunities, that are from time to time presented to Access or any of its affiliates, directors, officers, employees, stockholders, members, partners or subsidiaries, even if the opportunity is one that we or our subsidiaries might reasonably be deemed to have pursued or had the ability or desire to pursue if granted the opportunity to do so. Neither Access nor any of its affiliates, directors, officers, employees, stockholders, members, partners or subsidiaries will generally be liable to us or any of our subsidiaries for breach of any fiduciary or other duty, as a director or otherwise, by reason of the fact that such person pursues or acquires such corporate opportunity, directs such corporate opportunity to another person or fails to present such corporate opportunity, or information regarding such corporate opportunity, to us or our subsidiaries unless, in the case of any such person who is a director or officer of the Company, such corporate opportunity is expressly offered to such director or officer in writing solely in his or her capacity as a director or officer of the Company. To the fullest extent permitted by law, by becoming a stockholder in our company, stockholders will be deemed to have notice of and consented to this provision of our amended and restated certificate of incorporation.
Choice of Forum
Our amended and restated certificate of incorporation will provide that, unless we consent in writing to the selection of an alternate forum, the Court of Chancery of the State of Delaware will, to the fullest extent provided by law, be the sole and exclusive forum for: (i) any derivative action or proceeding brought on our behalf; (ii) any action asserting a claim of breach of a fiduciary duty owed to us or our stockholders by any of our directors, officers, other employees, agents or stockholders; (iii) any action asserting a claim against us arising under the DGCL or as to which the DGCL confers jurisdiction on the Court of Chancery of the State of Delaware (including, without limitation, any action asserting a claim arising out of or pursuant to our amended and restated by-laws); or (iv) any action asserting a claim against us that is governed by the internal affairs doctrine, in each case subject to such Court of Chancery of the State of Delaware having personal jurisdiction over the indispensable parties named as defendants. However, claims subject to exclusive jurisdiction in the federal courts, such as suits brought to enforce a duty or liability created by the Securities Act, the Exchange Act or the rules and regulations thereunder, need not be brought in the Court of Chancery of the State of Delaware. Although our amended and restated certificate of incorporation will contain the exclusive of forum provisions described above, it is possible that a court could find that such provision is inapplicable for a particular claim or action or that such provision is unenforceable, and our stockholders will not be deemed to have waived our
174
Table of Contents
compliance with the federal securities laws and the rules and regulations thereunder. To the fullest extent permitted by law, by becoming a stockholder in our company, you will be deemed to have notice of and have consented to the provisions of our amended and restated certificate of incorporation related to choice of forum.
Market Listing
We have been approved to list our Class A common stock on Nasdaq under the symbol “WMG”.
Transfer Agent and Registrar
The transfer agent and registrar for our Class A common stock and Class B common stock will be American Stock Transfer & Trust Company, LLC.
175
Table of Contents
SHARES AVAILABLE FOR FUTURE SALE
Immediately prior to this offering, there was no public market for our Class A common stock. Sales of substantial amounts of our Class A common stock in the public market could adversely affect prevailing market prices of our Class A common stock. Some shares of our Class A common stock will not be available for sale for a certain period of time after this offering because they are subject to contractual and legal restrictions on resale some of which are described below. Sales of substantial amounts of Class A common stock in the public market after these restrictions lapse, or the perception that these sales could occur, could adversely affect the prevailing market price and our ability to raise equity capital in the future.
Sales of Restricted Securities
After this offering, 70,000,000 shares of our Class A common stock will be outstanding. Of these shares, 70,000,000 shares sold in this offering (or 80,500,000 shares if the underwriters exercise in full their option to purchase additional shares of Class A common stock from the selling stockholders) will be freely tradable without restriction under the Securities Act, unless purchased by our “affiliates,” as that term is defined in Rule 144 under the Securities Act. No shares of Class A common stock will be outstanding after this offering that are “restricted securities” within the meaning of Rule 144 under the Securities Act. Restricted securities may be sold in the public market only if they are registered under the Securities Act or are sold pursuant to an exemption from registration under Rule 144 or Rule 701 under the Securities Act, which are summarized below. Subject to the lock-up agreements described below, shares held by our affiliates that are not restricted securities or that have been owned for more than one year may be sold subject to compliance with Rule 144 of the Securities Act without regard to the prescribed one-year holding period under Rule 144. In addition, upon the completion of this offering, all 440,000,000 shares outstanding of our Class B common stock (or all 429,500,000 shares if the underwriters exercise in full their option to purchase additional shares of Class A common stock from the selling stockholders) will be deemed “restricted securities” as that term is defined under Rule 144, and would also be subject to the “lock-up” period noted below.
Equity Compensation Plans
Upon the completion of this offering, we intend to file one or more registration statements under the Securities Act to register the shares of common stock to be issued under our equity compensation plans, including the Plan and the Omnibus Incentive Plan, and, as a result, all shares of common stock acquired upon exercise of stock options and other equity-based awards granted under these plans will, subject to a 180-day lock-up period, also be freely tradable under the Securities Act unless purchased by our affiliates. A total of 31,169,099 shares of our Class A common stock will be available for grants of additional equity awards under the Omnibus Incentive Plan to be adopted in connection with the consummation of this offering over the 10-year period from the date of adoption, including up to 1,000,000 shares of our Class A common stock that would be issued upon vesting of equity awards that we expect to grant to a broad group of our employees, subject to certain conditions, in connection with (but not prior to) this offering.
Lock-up Agreements
Upon the completion of the offering, the selling stockholders and our directors and executive officers will have signed lock-up agreements, under which they will agree not to sell, transfer or dispose of, directly or indirectly, any shares of our common stock or any securities convertible into or exercisable or exchangeable for shares of our common stock without the prior written consent of Morgan Stanley & Co. LLC for a period of 180 days after the date of this prospectus. These agreements are described below under “Underwriting.”
Registration Rights Agreement
Access will have the right to require us to register their shares of common stock for resale. See “Certain Relationships and Related Party Transactions—Relationship with Access Following this Offering—Registration Rights Agreement.”
176
Table of Contents
Rule 144
In general, under Rule 144, as currently in effect, a person (or persons whose shares are aggregated) who is not deemed to be or have been one of our affiliates for purposes of the Securities Act at any time during 90 days preceding a sale and who has beneficially owned the shares proposed to be sold for at least six months, including the holding period of any prior owner other than an affiliate, is entitled to sell such shares without registration, subject to compliance with the public information requirements of Rule 144. If such a person has beneficially owned the shares proposed to be sold for at least one year, including the holding period of a prior owner other than an affiliate, then such person is entitled to sell such shares without complying with any of the requirements of Rule 144.
In general, under Rule 144, as currently in effect, our affiliates or persons selling shares on behalf of our affiliates, who have met the six-month holding period for beneficial ownership of “restricted shares” of our common stock, are entitled to sell within any three month period, a number of shares that does not exceed the greater of:
| • | 1% of the number of shares of our Class A common stock then outstanding, which will equal approximately 700,000 shares immediately after this offering (or 805,000 shares if the underwriters exercise in full their option to purchase additional shares of Class A common stock from the selling stockholders); and |
| • | the average reported weekly trading volume of our common stock on Nasdaq during the four calendar weeks preceding the date of filing a Notice of Proposed Sale of Securities Pursuant to Rule 144 with respect to the sale. |
Sales under Rule 144 by our affiliates or persons selling shares on behalf of our affiliates are also subject to certain manner of sale provisions and notice requirements and to the availability of current public information about us. The sale of these shares, or the perception that sales will be made, could adversely affect the price of our common stock after this offering because a great supply of shares would be, or would be perceived to be, available for sale in the public market.
Rule 701
Any of our employees, officers or directors who acquired shares under a written compensatory plan or contract may be entitled to sell them in reliance on Rule 701. Rule 701 permits affiliates to sell their Rule 701 shares under Rule 144 without complying with the holding period requirements of Rule 144. Rule 701 further provides that non-affiliates may sell these shares in reliance on Rule 144 without complying with the holding period, public information, volume limitation or notice provisions of Rule 144. However, all shares issued under Rule 701 are subject to lock-up agreements and will only become eligible for sale when the 180-day lock-up agreements expire.
177
Table of Contents
MATERIAL U.S. FEDERAL TAX CONSIDERATIONS FOR NON-U.S. HOLDERS
The following is a discussion of certain U.S. federal income and estate tax considerations relating to the purchase, ownership and disposition of our Class A common stock by Non-U.S. Holders (as defined below) that purchase such Class A common stock pursuant to this offering and hold such Class A common stock as a capital asset. This discussion is based on the U.S. Internal Revenue Code of 1986, as amended (the “Code”), U.S. Treasury regulations promulgated or proposed thereunder, and administrative and judicial interpretations thereof, all as in effect on the date hereof and all of which are subject to change, possibly with retroactive effect, or to different interpretation. This discussion does not address all of the U.S. federal income tax considerations that may be relevant to specific Non-U.S. Holders in light of their particular circumstances or to Non-U.S. Holders subject to special treatment under U.S. federal income tax law (such as banks, insurance companies, dealers in securities or other Non-U.S. Holders that generally mark their securities to market for U.S. federal income tax purposes, foreign governments, international organizations, tax-exempt entities, certain former citizens or residents of the United States, or Non-U.S. Holders that hold our Class A common stock as part of a straddle, hedge, conversion or other integrated transaction). This discussion does not address any U.S. state or local or non-U.S. tax considerations or any U.S. federal gift or alternative minimum tax considerations.
As used in this discussion, the term “Non-U.S. Holder” means a beneficial owner of our Class A common stock that, for U.S. federal income tax purposes, is:
| • | an individual who is neither a citizen nor a resident of the United States; |
| • | a corporation that is not created or organized in or under the laws of the United States, any state thereof, or the District of Columbia; |
| • | an estate that is not subject to U.S. federal income tax on income from non-U.S. sources which is not effectively connected with the conduct of a trade or business in the United States; or |
| • | a trust unless (i) a court within the United States is able to exercise primary supervision over its administration and one or more U.S. persons have the authority to control all of its substantial decisions or (ii) it has in effect a valid election under applicable U.S. Treasury regulations to be treated as a U.S. person. |
If an entity treated as a partnership for U.S. federal income tax purposes invests in our Class A common stock, the U.S. federal income tax considerations relating to such investment will depend in part upon the status and activities of such entity and the particular partner. Any such entity should consult its own tax advisor regarding the U.S. federal income tax considerations applicable to it and its partners relating to the purchase, ownership and disposition of our Class A common stock.
PERSONS CONSIDERING AN INVESTMENT IN OUR CLASS A COMMON STOCK SHOULD CONSULT THEIR OWN TAX ADVISORS REGARDING THE U.S. FEDERAL, STATE AND LOCAL AND NON-U.S. INCOME, ESTATE AND OTHER TAX CONSIDERATIONS RELATING TO THE PURCHASE, OWNERSHIP AND DISPOSITION OF OUR CLASS A COMMON STOCK IN LIGHT OF THEIR PARTICULAR CIRCUMSTANCES.
Distributions on Class A Common Stock
If we make a distribution of cash or other property (other than certain pro rata distributions of our Class A common stock or rights to acquire our Class A common stock) with respect to a share of our Class A common stock, the distribution generally will be treated as a dividend to the extent it is paid from our current or accumulated earnings and profits (as determined under U.S. federal income tax principles). If the amount of such distribution exceeds our current and accumulated earnings and profits, such excess generally will be treated first as a tax-free return of capital to the extent of the Non-U.S. Holder’s adjusted tax basis in such share of our Class A common stock, and then as capital gain (which will be treated in the manner described below under
178
Table of Contents
“Sale, Exchange or Other Disposition of Class A Common Stock”). Distributions treated as dividends on our Class A common stock that are paid to or for the account of a Non-U.S. Holder generally will be subject to U.S. federal withholding tax at a rate of 30%, or at a lower rate if provided by an applicable tax treaty and the Non-U.S. Holder provides the documentation (generally, Internal Revenue Service (“IRS”) Form W-8BEN or W-8BEN-E) required to claim benefits under such tax treaty to the applicable withholding agent. Even if our current or accumulated earnings and profits are less than the amount of the distribution, the applicable withholding agent may treat the entire distribution as a dividend for U.S. federal withholding tax purposes. Each Non-U.S. Holder should consult its own tax advisor regarding U.S. federal withholding tax on distributions, including such Non-U.S. Holder’s eligibility for a lower rate and the availability of a refund of any excess U.S. federal tax withheld.
If, however, a dividend is effectively connected with the conduct of a trade or business in the United States by a Non-U.S. Holder, such dividend generally will not be subject to the 30% U.S. federal withholding tax if such Non-U.S. Holder provides the appropriate documentation (generally, IRS Form W-8ECI) to the applicable withholding agent. Instead, such Non-U.S. Holder generally will be subject to U.S. federal income tax on such dividend in substantially the same manner as a U.S. person (except as provided by an applicable tax treaty). In addition, a Non-U.S. Holder that is treated as a corporation for U.S. federal income tax purposes may be subject to a branch profits tax at a rate of 30% (or a lower rate if provided by an applicable tax treaty) on its effectively connected income for the taxable year, subject to certain adjustments.
The foregoing discussion is subject to the discussion below under “—FATCA Withholding” and “—Information Reporting and Backup Withholding.”
Sale, Exchange or Other Disposition of Class A Common Stock
A Non-U.S. Holder generally will not be subject to U.S. federal income tax on any gain recognized on the sale, exchange or other disposition of our Class A common stock unless:
| • | such gain is effectively connected with the conduct of a trade or business in the United States by such Non-U.S. Holder, in which event such Non-U.S. Holder generally will be subject to U.S. federal income tax on such gain in substantially the same manner as a U.S. person (except as provided by an applicable tax treaty) and, if it is treated as a corporation for U.S. federal income tax purposes, may also be subject to a branch profits tax at a rate of 30% (or a lower rate if provided by an applicable tax treaty); |
| • | such Non-U.S. Holder is an individual who is present in the United States for 183 days or more during the taxable year of such sale, exchange or other disposition and certain other conditions are met, in which event such gain (net of certain U.S. source losses) generally will be subject to U.S. federal income tax at a rate of 30% (except as provided by an applicable tax treaty); or |
| • | we are or have been a “United States real property holding corporation” for U.S. federal income tax purposes at any time during the shorter of (x) the five-year period ending on the date of such sale, exchange or other disposition and (y) such Non-U.S. Holder’s holding period with respect to such Class A common stock, and certain other conditions are met. |
Generally, a corporation is a “United States real property holding corporation” if the fair market value of its United States real property interests equals or exceeds 50% of the sum of the fair market value of its worldwide real property interests and its other assets used or held for use in a trade or business (all as determined for U.S. federal income tax purposes). We believe that we presently are not, and we do not presently anticipate that we will become, a United States real property holding corporation. However, because this determination is made from time to time and is dependent upon a number of factors, some of which are beyond our control, including the value of our assets, there can be no assurance that we will not become a United States real property holding corporation. If we were a United States real property holding corporation during the period described in clause
179
Table of Contents
(iii) above, gain recognized by a Non-U.S. Holder generally would be treated as income effectively connected with the conduct of a trade or business in the United States by such Non-U.S. Holder, with the consequences described in clause (i) above (except that the branch profits tax would not apply), unless such Non-U.S. Holder owned (directly or constructively) five percent or less of our Class A common stock throughout such period and our Class A common stock is treated as “regularly traded on an established securities market” at any time during the calendar year of such sale, exchange or other disposition.
The foregoing discussion is subject to the discussion below under “—Information Reporting and Backup Withholding.”
FATCA Withholding
Under the Foreign Account Tax Compliance Act provisions of the Code and related U.S. Treasury guidance (“FATCA”), a withholding tax of 30% will be imposed in certain circumstances on payments of dividends on our Class A common stock. In the case of payments made to a “foreign financial institution” (such as a bank, a broker, an investment fund or, in certain cases, a holding company), as a beneficial owner or as an intermediary, this tax generally will be imposed, subject to certain exceptions, unless such institution (i) has agreed to (and does) comply with the requirements of an agreement with the United States (an “FFI Agreement”) or (ii) is required by (and does comply with) applicable foreign law enacted in connection with an intergovernmental agreement between the United States and a foreign jurisdiction (an “IGA”) to, among other things, collect and provide to the U.S. tax authorities or other relevant tax authorities certain information regarding U.S. account holders of such institution and, in either case, such institution provides the withholding agent with a certification as to its FATCA status. In the case of payments made to a foreign entity that is not a financial institution (as a beneficial owner), the tax generally will be imposed, subject to certain exceptions, unless such entity provides the withholding agent with a certification as to its FATCA status and, in certain cases, identifies any “substantial” U.S. owner (generally, any specified U.S. person that directly or indirectly owns more than a specified percentage of such entity). If our Class A common stock is held through a foreign financial institution that has agreed to comply with the requirements of an FFI Agreement or is subject to similar requirements under applicable foreign law enacted in connection with an IGA, such foreign financial institution (or, in certain cases, a person paying amounts to such foreign financial institution) generally will be required, subject to certain exceptions, to withhold tax on payments made to (i) a person (including an individual) that fails to provide any required information or documentation or (ii) a foreign financial institution that has not agreed to comply with the requirements of an FFI Agreement and is not subject to similar requirements under applicable foreign law enacted in connection with an IGA. Each Non-U.S. Holder should consult its own tax advisor regarding the application of FATCA to our Class A common stock.
Information Reporting and Backup Withholding
Distributions on our Class A common stock paid to a Non-U.S. Holder and the amount of any U.S. federal tax withheld from such distributions generally will be reported annually to the IRS and to such Non-U.S. Holder by the applicable withholding agent.
The information reporting and backup withholding rules that apply to payments of dividends to certain U.S. persons generally will not apply to payments of dividends on our Class A common stock to a Non-U.S. Holder if such Non-U.S. Holder certifies under penalties of perjury that it is not a U.S. person (generally by providing an IRS Form W-8BEN or W-8BEN-E to the applicable withholding agent) or otherwise establishes an exemption.
Proceeds from the sale, exchange or other disposition of our Class A common stock by a Non-U.S. Holder effected outside the United States through a non-U.S. office of a non-U.S. broker generally will not be subject to the information reporting and backup withholding rules that apply to payments to certain U.S. persons, provided that the proceeds are paid to the Non-U.S. Holder outside the United States. However, proceeds from the sale, exchange or other disposition of our Class A common stock by a Non-U.S. Holder effected through a non-U.S.
180
Table of Contents
office of a non-U.S. broker with certain specified U.S. connections or of a U.S. broker generally will be subject to these information reporting rules (but generally not to these backup withholding rules), even if the proceeds are paid to such Non-U.S. Holder outside the United States, unless such Non-U.S. Holder certifies under penalties of perjury that it is not a U.S. person (generally by providing an IRS Form W-8BEN or W-8BEN-E to the applicable withholding agent) or otherwise establishes an exemption. Proceeds from the sale, exchange or other disposition of our Class A common stock by a Non-U.S. Holder effected through a U.S. office of a broker generally will be subject to these information reporting and backup withholding rules unless such Non-U.S. Holder certifies under penalties of perjury that it is not a U.S. person (generally by providing an IRS Form W-8BEN or W-8BEN-E to the applicable withholding agent) or otherwise establishes an exemption.
Backup withholding is not an additional tax. Any amounts withheld under the backup withholding rules generally will be allowed as a refund or a credit against a Non-U.S. Holder’s U.S. federal income tax liability if the required information is furnished by such Non-U.S. Holder on a timely basis to the IRS.
U.S. Federal Estate Tax
Shares of our Class A common stock owned or treated as owned by an individual Non-U.S. Holder at the time of such Non-U.S. Holder’s death will be included in such Non-U.S. Holder’s gross estate for U.S. federal estate tax purposes and may be subject to U.S. federal estate tax unless an applicable estate tax treaty provides otherwise.
181
Table of Contents
The company, the selling stockholders and the underwriters named below have entered into an underwriting agreement with respect to the shares of Class A common stock being offered. Subject to certain conditions, each underwriter has severally agreed to purchase the number of shares of Class A common stock indicated in the following table. Morgan Stanley & Co. LLC, Credit Suisse Securities (USA) LLC and Goldman Sachs & Co. LLC are the representatives of the underwriters.
| Underwriters |
Number of Shares |
|||
| Morgan Stanley & Co. LLC |
||||
| Credit Suisse Securities (USA) LLC |
||||
| Goldman Sachs & Co. LLC |
||||
| BofA Securities, Inc. |
||||
| Citigroup Global Markets Inc. |
||||
| J.P. Morgan Securities LLC |
||||
| Barclays Capital Inc. |
||||
| Evercore Group L.L.C. |
||||
| Guggenheim Securities, LLC |
||||
| Macquarie Capital (USA) Inc. |
||||
| Nomura Securities International, Inc. |
||||
| RBC Capital Markets, LLC |
||||
| SunTrust Robinson Humphrey, Inc. |
||||
| CIBC World Markets Corp. |
||||
| HSBC Securities (USA) Inc. |
||||
| SG Americas Securities, LLC; Société Générale |
||||
| LionTree Advisors LLC |
||||
| Raine Securities LLC |
||||
| AmeriVet Securities, Inc. |
||||
| Bancroft Capital, LLC |
||||
| Blaylock Van, LLC |
||||
| C.L. King & Associates, Inc. |
||||
| Loop Capital Markets LLC |
||||
| Roberts & Ryan Investments, Inc. |
||||
| Samuel A. Ramirez & Company, Inc. |
||||
| Siebert Williams Shank & Co., LLC |
||||
| Telsey Advisory Group LLC |
||||
| Tigress Financial Partners, LLC |
||||
|
|
|
|||
| Total |
||||
|
|
|
|||
The underwriters are committed to take and pay for all of the shares of Class A common stock being offered, if any are taken, other than the shares covered by the option described below unless and until this option is exercised. Pursuant to the terms of the underwriting agreement, any series of BFFLLC, to which shares of our Class B common stock may be contributed in connection with this offering, may sell shares of Class A common stock in the offering to the extent authorized by its member. If any series of BFFLLC that receives a contribution of shares of Class B common stock does not participate in the offering or sells less than all of its Contingent Sale Shares, AI Entertainment Holdings LLC and/or Access Industries, LLC will offer a corresponding number of shares of Class A common stock such that the aggregate number of shares of Class A common stock being offered by the selling stockholders in this offering remains unchanged.
182
Table of Contents
The underwriters have an option to buy up to an additional 10,500,000 shares of Class A common stock from the selling stockholders to cover sales by the underwriters of a greater number of shares than the total number set forth in the table above. They may exercise that option for 30 days. If any shares are purchased pursuant to this option, the underwriters will severally purchase shares in approximately the same proportion as set forth in the table above.
The following table shows the per share and total underwriting discounts and commissions to be paid to the underwriters by the selling stockholders. Such amounts are shown assuming both no exercise and full exercise of the underwriters’ option to purchase 10,500,000 additional shares.
Paid by the Selling Stockholders
| No Exercise |
Full Exercise |
|||||||
| Per Share |
$ | $ | ||||||
| Total |
$ | $ | ||||||
Shares of Class A common stock sold by the underwriters to the public will initially be offered at the initial public offering price set forth on the cover of this prospectus. Any shares of Class A common stock sold by the underwriters to securities dealers may be sold at a discount of up to $ per share from the initial public offering price. After the initial offering of the shares of Class A common stock, the representative may change the offering price and the other selling terms. The offering of the shares of Class A common stock by the underwriters is subject to receipt and acceptance and subject to the underwriters’ right to reject any order in whole or in part.
The company has agreed with the underwriters, subject to certain exceptions, not to dispose of or hedge any of its common stock or securities convertible into or exchangeable for shares of common stock during the period from the date of this prospectus continuing through the date 180 days after the date of this prospectus, except with the prior written consent of Morgan Stanley & Co. LLC. This agreement does not apply to (i) shares of common stock to be sold in the offering, (ii) issuances of common stock by the Company upon exercise, settlement or redemption of any option, deferred equity unit or profits interest of the Company or its affiliates or otherwise pursuant to employee equity compensation plans existing on the date of such agreement, or (iii) any issuance or transfer of common stock upon the conversion or exchange of convertible or exchangeable securities outstanding as of the date of such agreement. In addition, the Company’s officers, directors, and holders of all of the Company’s common stock, including the selling stockholders, have agreed with the underwriters, subject to certain exceptions, not to dispose of or hedge any of their common stock or securities convertible into or exchangeable for shares of common stock during the period from the date of this prospectus continuing through the date 180 days after the date of this prospectus, except with the prior written consent of Morgan Stanley & Co. LLC. The agreement by the Company’s officers, directors and holders of its common stock is subject to certain specified exceptions, including: (a) transfers to the underwriters to this offering; (b) open market transactions after the completion of the offering; (c) the establishment of a trading plan pursuant to Rule 10b5-1 of the Exchange Act; (d) a bona fide third-party tender offer, merger, consolidation or other similar transaction made to all holders of our common stock; (e) transfers of our Class B common stock that do not result in such shares converting into Class A common stock; (f) bona fide gifts or transfers by will or intestacy; (g) if the lock-up signatory is a selling stockholder, distributions to its affiliates or stockholders; (h) entering into, and borrowing against, any margin loan facility, borrowing against any account that holds shares of our common stock or otherwise pledging shares of our common stock as collateral for loans; (i) any trust for the direct or indirect benefit of the lock-up signatory or the immediate family of the lock-up signatory; (j) if the lock-up signatory is a corporation, transfers of the capital stock of the corporation to any of its wholly-owned subsidiaries; and (k) one or more sales or distributions or any net share settlement with the Company (1) to satisfy tax withholding or similar obligations in connection with the exercise of options to purchase our common stock, the vesting of restricted stock or restricted stock units or any deferred stock units, including deferred equity units, (2) in payment of the exercise or purchase price with respect to the exercise of options to purchase our common stock
183
Table of Contents
or (3) in connection with the settlement of deferred stock units or deferred equity units or distributions by Management LLC of shares of common stock to its equityholders who are employees of the Company, subject to certain limitations; provided that, in the case of any transfer or distribution pursuant to (f) through (j), the transferee or distribute agrees in writing to be bound by the lock-up restrictions. In addition, a selling stockholder may also make any demand for the sale of, or request to sell, all or a portion of its remaining shares of our common stock pursuant to the Registration Rights Agreement, so long as there is no public announcement of such demand or request. See “Shares Available for Future Sale” for a discussion of certain transfer restrictions.
Prior to the offering, there has been no public market for the shares of Class A common stock. The initial public offering price has been negotiated between the Company and the representatives. Among the factors to be considered in determining the initial public offering price of the shares of Class A common stock, in addition to prevailing market conditions, will be the company’s historical performance, estimates of the business potential and earnings prospects of the company, an assessment of the company’s management and the consideration of the above factors in relation to market valuation of companies in related businesses.
We have been approved to list our Class A common stock on Nasdaq under the symbol “WMG”.
In connection with the offering, the underwriters may purchase and sell shares of Class A common stock in the open market. These transactions may include short sales, stabilizing transactions and purchases to cover positions created by short sales. Short sales involve the sale by the underwriters of a greater number of shares than they are required to purchase in the offering, and a short position represents the amount of such sales that have not been covered by subsequent purchases. A “covered short position” is a short position that is not greater than the amount of additional shares for which the underwriters’ option described above may be exercised. The underwriters may cover any covered short position by either exercising their option to purchase additional shares or purchasing shares in the open market. In determining the source of shares to cover the covered short position, the underwriters will consider, among other things, the price of shares available for purchase in the open market as compared to the price at which they may purchase additional shares pursuant to the option described above. “Naked” short sales are any short sales that create a short position greater than the amount of additional shares for which the option described above may be exercised. The underwriters must cover any such naked short position by purchasing shares in the open market. A naked short position is more likely to be created if the underwriters are concerned that there may be downward pressure on the price of the Class A common stock in the open market after pricing that could adversely affect investors who purchase in the offering. Stabilizing transactions consist of various bids for or purchases of Class A common stock made by the underwriters in the open market prior to the completion of the offering.
The underwriters may also impose a penalty bid. This occurs when a particular underwriter repays to the underwriters a portion of the underwriting discount received by it because the representatives have repurchased shares sold by or for the account of such underwriter in stabilizing or short covering transactions.
Purchases to cover a short position and stabilizing transactions, as well as other purchases by the underwriters for their own accounts, may have the effect of preventing or retarding a decline in the market price of the company’s stock, and together with the imposition of the penalty bid, may stabilize, maintain or otherwise affect the market price of the Class A common stock. As a result, the price of the Class A common stock may be higher than the price that otherwise might exist in the open market. The underwriters are not required to engage in these activities and may end any of these activities at any time. These transactions may be effected on Nasdaq, in the over-the-counter market or otherwise.
The estimated offering expenses payable in connection with the offering, exclusive of the underwriting discounts and commissions, are approximately $6.7 million. We have agreed to reimburse the underwriters for expenses relating to clearance of this offering with the Financial Industry Regulatory Authority, Inc. (“FINRA”) up to $40,000.
184
Table of Contents
The company and the selling stockholders have agreed to indemnify the several underwriters against certain liabilities, including liabilities under the Securities Act.
The underwriters and their respective affiliates are full service financial institutions engaged in various activities, which may include sales and trading, commercial and investment banking, advisory, investment management, investment research, principal investment, hedging, market making, brokerage and other financial and non-financial activities and services. Certain of the underwriters and their respective affiliates have provided, and may in the future provide, a variety of these services to the Company and to persons and entities with relationships with the Company, for which they received or will receive customary fees and expenses.
In the ordinary course of their various business activities, the underwriters and their respective affiliates, officers, directors and employees may purchase, sell or hold a broad array of investments and actively trade securities, derivatives, loans, commodities, currencies, credit default swaps and other financial instruments for their own account and for the accounts of their customers, and such investment and trading activities may involve or relate to assets, securities and/or instruments of the Company (directly, as collateral securing other obligations or otherwise) and/or persons and entities with relationships with the Company. The underwriters and their respective affiliates may also communicate independent investment recommendations, market color or trading ideas and/or publish or express independent research views in respect of such assets, securities or instruments and may at any time hold, or recommend to clients that they should acquire, long and/or short positions in such assets, securities and instruments
Selling Restrictions
European Economic Area and United Kingdom
In relation to each Member State of the European Economic Area and the United Kingdom (each a “Relevant State”), no shares of our Class A common stock have been offered or will be offered pursuant to this offering to the public in that Relevant State prior to the publication of a prospectus in relation to shares of our Class A common stock which has been approved by the competent authority in that Relevant State or, where appropriate, approved in another Relevant State and notified to the competent authority in that Relevant State, all in accordance with the Prospectus Regulation, except that offers of shares of our Class A common stock may be made to the public in that Relevant State at any time under the following exemptions under the Prospectus Regulation:
| • | to any legal entity which is a qualified investor as defined in the Prospectus Regulation; |
| • | to fewer than 150 natural or legal persons (other than qualified investors as defined in the Prospectus Regulation), subject to obtaining the prior consent of the representative for any such offer; or |
| • | In any other circumstances falling within Article 1(4) of the Prospectus Regulation; |
provided that no such offer of shares of our Class A common stock shall require us or any underwriter to publish a prospectus pursuant to Article 3 of the Prospectus Regulation or supplement a prospectus pursuant to Article 23 of the Prospectus Regulation.
For the purposes of this provision, the expression an “offer to the public” in relation to any shares of our Class A common stock in any Relevant State means the communication in any form and by any means of sufficient information on the terms of the offer and any shares of our Class A common stock to be offered so as to enable an investor to decide to purchase or subscribe for any shares of our Class A common stock, and the expression “Prospectus Regulation” means Regulation (EU) 2017/1129.
This European Economic Area selling restriction is in addition to any other selling restrictions set out below.
185
Table of Contents
United Kingdom
Each underwriter has represented and agreed that:
| (a) | it has only communicated or caused to be communicated and will only communicate or cause to be communicated an invitation or inducement to engage in investment activity (within the meaning of Section 21 of the Financial Services and Markets Act 2000 (“FSMA”)) received by it in connection with the issue or sale of the shares of Class A common stock in circumstances in which Section 21(1) of the FSMA does not apply to the company or the selling stockholders; and |
| (b) | it has complied and will comply with all applicable provisions of the FSMA with respect to anything done by it in relation to the shares of Class A common stock in, from or otherwise involving the United Kingdom. |
In the United Kingdom, this prospectus is only addressed to and directed at qualified investors who are (i) investment professionals falling within Article 19(5) of the Financial Services and Markets Act 2000 (Financial Promotion) Order 2005 (the Order); or (ii) high net worth entities and other persons to whom it may lawfully be communicated, falling within Article 49(2)(a) to (d) of the Order (all such persons together being referred to as “relevant persons”). Any investment or investment activity to which this prospectus relates is available only to relevant persons and will only be engaged with relevant persons. Any person who is not a relevant person should not act or rely on this prospectus or any of its contents.
Canada
The Class A common stock may be sold in Canada only to purchasers purchasing, or deemed to be purchasing, as principal that are accredited investors, as defined in National Instrument 45-106 Prospectus Exemptions or subsection 73.3(1) of the Securities Act (Ontario), and are permitted clients, as defined in National Instrument 31-103 Registration Requirements, Exemptions, and Ongoing Registrant Obligations. Any resale of the Class A common stock must be made in accordance with an exemption from, or in a transaction not subject to, the prospectus requirements of applicable securities laws.
Securities legislation in certain provinces or territories of Canada may provide a purchaser with remedies for rescission or damages if this prospectus (including any amendment thereto) contains a misrepresentation, provided that the remedies for rescission or damages are exercised by the purchaser within the time limit prescribed by the securities legislation of the purchaser’s province or territory. The purchaser should refer to any applicable provisions of the securities legislation of the purchaser’s province or territory of these rights or consult with a legal advisor.
Pursuant to section 3A.3 of National Instrument 33-105 Underwriting Conflicts (NI 33-105), the underwriters are not required to comply with the disclosure requirements of NI 33-105 regarding underwriter conflicts of interest in connection with this offering.
Hong Kong
The Class A common stock may not be offered or sold in Hong Kong by means of any document other than (i) in circumstances which do not constitute an offer to the public within the meaning of the Companies (Winding Up and Miscellaneous Provisions) Ordinance (Cap. 32 of the Laws of Hong Kong) (“Companies (Winding Up and Miscellaneous Provisions) Ordinance”) or which do not constitute an invitation to the public within the meaning of the Securities and Futures Ordinance (Cap. 571 of the Laws of Hong Kong) (“Securities and Futures Ordinance”), (ii) to “professional investors” as defined in the Securities and Futures Ordinance and any rules made thereunder, or (iii) in other circumstances which do not result in the document being a “prospectus” as defined in the Companies (Winding Up and Miscellaneous Provisions) Ordinance, and no advertisement, invitation or document relating to the Class A common stock may be issued or may be in the possession of any
186
Table of Contents
person for the purpose of issue (in each case whether in Hong Kong or elsewhere), which is directed at, or the contents of which are likely to be accessed or read by, the public in Hong Kong (except if permitted to do so under the securities laws of Hong Kong) other than with respect to shares of Class A common stock which are or are intended to be disposed of only to persons outside Hong Kong or only to “professional investors” in Hong Kong as defined in the Securities and Futures Ordinance and any rules made thereunder.
Singapore
This prospectus has not been registered as a prospectus with the Monetary Authority of Singapore. Accordingly, this prospectus and any other document or material in connection with the offer or sale, or invitation for subscription or purchase, of the Class A common stock may not be circulated or distributed, nor may the Class A common stock be offered or sold, or be made the subject of an invitation for subscription or purchase, whether directly or indirectly, to persons in Singapore other than (i) to an institutional investor (as defined under Section 4A of the Securities and Futures Act, Chapter 289 of Singapore (the “SFA”)) under Section 274 of the SFA, (ii) to a relevant person (as defined in Section 275(2) of the SFA) pursuant to Section 275(1) of the SFA, or any person pursuant to Section 275(1A) of the SFA, and in accordance with the conditions specified in Section 275 of the SFA or (iii) otherwise pursuant to, and in accordance with the conditions of, any other applicable provision of the SFA, in each case subject to conditions set forth in the SFA.
Where the shares of Class A common stock are subscribed or purchased under Section 275 of the SFA by a relevant person which is a corporation (which is not an accredited investor (as defined in Section 4A of the SFA)) the sole business of which is to hold investments and the entire share capital of which is owned by one or more individuals, each of whom is an accredited investor, the securities (as defined in Section 239(1) of the SFA) of that corporation shall not be transferable for 6 months after that corporation has acquired the shares under Section 275 of the SFA except: (1) to an institutional investor under Section 274 of the SFA or to a relevant person (as defined in Section 275(2) of the SFA), (2) where such transfer arises from an offer in that corporation’s securities pursuant to Section 275(1A) of the SFA, (3) where no consideration is or will be given for the transfer, (4) where the transfer is by operation of law, (5) as specified in Section 276(7) of the SFA, or (6) as specified in Regulation 32 of the Securities and Futures (Offers of Investments) (Shares and Debentures) Regulations 2005 of Singapore (“Regulation 32”).
Where the shares of Class A common stock are subscribed or purchased under Section 275 of the SFA by a relevant person which is a trust (where the trustee is not an accredited investor (as defined in Section 4A of the SFA)) whose sole purpose is to hold investments and each beneficiary of the trust is an accredited investor, the beneficiaries’ rights and interest (howsoever described) in that trust shall not be transferable for 6 months after that trust has acquired the shares under Section 275 of the SFA except: (1) to an institutional investor under Section 274 of the SFA or to a relevant person (as defined in Section 275(2) of the SFA), (2) where such transfer arises from an offer that is made on terms that such rights or interest are acquired at a consideration of not less than S$200,000 (or its equivalent in a foreign currency) for each transaction (whether such amount is to be paid for in cash or by exchange of securities or other assets), (3) where no consideration is or will be given for the transfer, (4) where the transfer is by operation of law, (5) as specified in Section 276(7) of the SFA, or (6) as specified in Regulation 32.
Solely for the purposes of our obligations pursuant to Section 309B of the SFA, we have determined, and hereby notify all relevant persons (as defined in the Securities and Futures (Capital Markets Products) Regulations 2018 (“CMP Regulations”)) that the shares of Class common stock are “prescribed capital markets products” (as defined in the CMP Regulations) and Excluded Investment Products (as defined in MAS Notice SFA 04-N12: Notice on the Sale of Investment Products and MAS Notice FAA-N16: Notice on Recommendations on Investment Products).
187
Table of Contents
Japan
The shares of Class A common stock have not been and will not be registered under the Financial Instruments and Exchange Act of Japan (Act No. 25 of 1948, as amended), or the FIEA. The shares of Class A common stock may not be offered or sold, directly or indirectly, in Japan or to or for the benefit of any resident of Japan (including any person resident in Japan or any corporation or other entity organized under the laws of Japan) or to others for reoffering or resale, directly or indirectly, in Japan or to or for the benefit of any resident of Japan, except pursuant to an exemption from the registration requirements of the FIEA and otherwise in compliance with any relevant laws and regulations of Japan.
Australia
This prospectus:
| • | does not constitute a disclosure document or a prospectus under Chapter 6D.2 of the Corporations Act 2001 (Cth) (the “Corporations Act”); |
| • | has not been, and will not be, lodged with the Australian Securities and Investments Commission (“ASIC”), as a disclosure document for the purposes of the Corporations Act and does not purport to include the information required of a disclosure document for the purposes of the Corporations Act; and |
| • | may only be provided in Australia to select investors who are able to demonstrate that they fall within one or more of the categories of investors, available under section 708 of the Corporations Act (“Exempt Investors”). |
The Class A common stock may not be directly or indirectly offered for subscription or purchased or sold, and no invitations to subscribe for or buy the Class A common stock may be issued, and no draft or definitive offering memorandum, advertisement or other offering material relating to any Class A common stock may be distributed in Australia, except where disclosure to investors is not required under Chapter 6D of the Corporations Act or is otherwise in compliance with all applicable Australian laws and regulations. By submitting an application for the Class A common stock, you represent and warrant to us that you are an Exempt Investor.
As any offer of Class A common stock under this document will be made without disclosure in Australia under Chapter 6D.2 of the Corporations Act, the offer of those securities for resale in Australia within 12 months may, under section 707 of the Corporations Act, require disclosure to investors under Chapter 6D.2 if none of the exemptions in section 708 applies to that resale. By applying for the Class A common stock you undertake to us that you will not, for a period of 12 months from the date of sale of the Class A common stock, offer, transfer, assign or otherwise alienate those Class A common stock to investors in Australia except in circumstances where disclosure to investors is not required under Chapter 6D.2 of the Corporations Act or where a compliant disclosure document is prepared and lodged with ASIC.
Brazil
The offer and sale of our Class A common stock has not been, and will not be, registered (or exempted from registration) with the Brazilian Securities Commission (Comissão de Valores Mobiliários – CVM) and, therefore, will not be carried out by any means that would constitute a public offering in Brazil under Law No. 6,385, of December 7, 1976, as amended, under CVM Rule No. 400, of December 29, 2003, as amended, or under CVM Rule No. 476, of January 16, 2009, as amended. Any representation to the contrary is untruthful and unlawful. As a consequence, our Class A common stock cannot be offered and sold in Brazil or to any investor resident or domiciled in Brazil. Documents relating to the offering of our Class A common stock, as well as information contained therein, may not be supplied to the public in Brazil, nor used in connection with any public offer for subscription or sale of Class A common stock to the public in Brazil.
188
Table of Contents
China
This prospectus will not be circulated or distributed in the People’s Republic of China (“PRC”) and the Class A common stock will not be offered or sold, and will not be offered or sold to any person for re-offering or resale directly or indirectly to any residents of the PRC except pursuant to any applicable laws and regulations of the PRC. Neither this prospectus nor any advertisement or other offering material may be distributed or published in the PRC, except under circumstances that will result in compliance with applicable laws and regulations.
France
Neither this prospectus nor any other offering material relating to the Class A common stock offered by this prospectus has been and will not be submitted to the clearance procedures of the Autorité des Marchés Financiers or of the competent authority of another member state of the European Economic Area and notified to the Autorité des Marchés Financiers. The Class A common stock has not been offered or sold and will not be offered or sold, directly or indirectly, to the public in France. Neither this prospectus nor any other offering material relating to the Class A common stock has been or will be:
| a) | released, issued, distributed or caused to be released, issued or distributed to the public in France; |
| b) | used in connection with any offer for subscription or sale of the notes to the public in France. |
Such offers, sales and distributions will be made in France only:
| c) | to qualified investors (investisseurs qualifiés) and/or to a restricted circle of investors (cercle restreint d’investisseurs), in each case acting for their own account, or otherwise in circumstances in which no offer to the public occurs, all as defined in and in accordance with Articles L.411-2, D.411-1, D.411-2, D.734-1, D.744-1, D.754-1 and D.764-1 of the French Code monétaire et financier; |
| d) | to investment services providers authorized to engage in portfolio management on behalf of third parties; or |
| e) | in a transaction that, in accordance with Article L.411-2-I-1°-or-2° -or 3° of the French Code monétaire et financier and Article 211-2 of the General Regulations (Règlement Général) of the Autorité des Marchés Financiers, does not constitute a public offer (offre au public). |
The Class A common stock may not be distributed directly or indirectly to the public except in accordance with Articles L.411-1, L.411-2, L.412-1 and L.621-8 through L.621-8-3 of the French Code monétaire et financier and applicable regulations thereunder.
Kuwait
The Class A common stock has not been authorized or licensed for offering, marketing or sale in the State of Kuwait. The distribution of this prospectus and the offering and sale of the Class A common stock in the State of Kuwait is restricted by law unless a license is obtained from the Kuwait Ministry of Commerce and Industry in accordance with Law 31 of 1990. Persons into whose possession this prospectus comes are required by us and the international underwriters to inform themselves about and to observe such restrictions. Investors in the State of Kuwait who approach us or any of the international underwriters to obtain copies of this prospectus are required by us and the international underwriters to keep such prospectus confidential and not to make copies thereof or distribute the same to any other person and are also required to observe the restrictions provided for in all jurisdictions with respect to offering, marketing and the sale of the Class A common stock.
Qatar
The Class A common stock described in this prospectus have not been, and will not be, offered, sold or delivered, at any time, directly or indirectly in the State of Qatar in a manner that would constitute a public
189
Table of Contents
offering. This prospectus has not been, and will not be, registered with or approved by the Qatar Financial Markets Authority or Qatar Central Bank and may not be publicly distributed. This prospectus is intended for the original recipient only and must not be provided to any other person. It is not for general circulation in the State of Qatar and may not be reproduced or used for any other purpose.
Saudi Arabia
This document may not be distributed in the Kingdom of Saudi Arabia except to such persons as are permitted under the Offers of Securities Regulations as issued by the board of the Saudi Arabian Capital Market Authority (“CMA”) pursuant to resolution number 2-11-2004 dated 4 October 2004 as amended by resolution number 1-28-2008, as amended (the “CMA Regulations”). The CMA does not make any representation as to the accuracy or completeness of this document and expressly disclaims any liability whatsoever for any loss arising from, or incurred in reliance upon, any part of this document. Prospective purchasers of the securities offered hereby should conduct their own due diligence on the accuracy of the information relating to the securities. If you do not understand the contents of this document, you should consult an authorised financial adviser.
Switzerland
This prospectus is not intended to constitute an offer or solicitation to purchase or invest in the Class A common stock. The Class A common stock may not be publicly offered, directly or indirectly, in Switzerland within the meaning of the Swiss Financial Services Act (“FinSA”) and will not be listed on the SIX Swiss Exchange (“SIX”) or on any other stock exchange or regulated trading venue (exchange or multilateral trading facility) in Switzerland. This document does not constitute a prospectus within the meaning of, and has been prepared without regard to, the disclosure standards for issuance prospectuses under art. 652a or art. 1156 of the Swiss Code of Obligations or the disclosure standards for listing prospectuses under art. 27 ff. of the SIX Listing Rules or the listing rules of any other stock exchange or regulated trading venue (exchange or multilateral trading facility) in Switzerland. Neither this document nor any other offering or marketing material relating to the Class A common stock constitutes a prospectus pursuant to the FinSA, and neither this document nor any other offering or marketing material relating to the Class A common stock or the offering may be publicly distributed or otherwise made publicly available in Switzerland.
Neither this document nor any other offering or marketing material relating to the offering, the Company, or the Class A common stock have been or will be filed with or approved by any Swiss regulatory authority. In particular, this document will not be filed with, and the offer of Class A common stock will not be supervised by, the Swiss Financial Market Supervisory Authority FINMA (FINMA), and the offer of Class A common stock has not been and will not be authorized under the Swiss Federal Act on Collective Investment Schemes (“CISA”). The investor protection afforded to acquirers of interests in collective investment schemes under the CISA does not extend to acquirers of Class A common stock.
United Arab Emirates
The Class A common stock has not been, and are not being, publicly offered, sold, promoted or advertised in the United Arab Emirates (including the Dubai International Financial Centre) other than in compliance with the laws of the United Arab Emirates (and the Dubai International Financial Centre) governing the issue, offering and sale of securities. Further, this prospectus does not constitute a public offer of securities in the United Arab Emirates (including the Dubai International Financial Centre) and is not intended to be a public offer. This prospectus has not been approved by or filed with the Central Bank of the United Arab Emirates, the Securities and Commodities Authority or the Dubai Financial Services Authority.
190
Table of Contents
The validity of the shares of our Class A common stock offered hereby will be passed upon for us by Debevoise & Plimpton LLP, New York, New York and will be passed upon for the underwriters by Davis Polk & Wardwell LLP, New York, New York.
The consolidated financial statements of Warner Music Group Corp. as of September 30, 2019 and 2018 and for each of the years in the three year period ended September 30, 2019 have been included herein in reliance upon the report of KPMG LLP, independent registered public accounting firm, appearing elsewhere herein, and upon the authority of said firm as experts in accounting and auditing. The audit report refers to a change in method of accounting for revenue recognition.
WHERE YOU CAN FIND MORE INFORMATION
We have filed with the SEC a registration statement on Form S-1, of which this prospectus forms a part, with respect to the shares of our Class A common stock being sold in this offering. This prospectus does not contain all of the information set forth in the registration statement and the exhibits thereto because some parts have been omitted in accordance with the rules and regulations of the SEC. For further information with respect to us and the Class A common stock being sold in this offering, reference is made to the registration statement and the exhibits filed therewith. Statements contained in this prospectus as to the contents of any contract or other document referred to are not necessarily complete and in each instance, if such contract or document is filed as an exhibit, reference is made to the copy of such contract or other document filed as an exhibit to the registration statement, each statement being qualified in all respects by such reference. The SEC maintains an internet site at http://www.sec.gov, from which interested persons can electronically access the registration statement, including the exhibits and any schedules thereto. Copies of the registration statement, including the exhibits and schedules thereto, are also available at your request, without charge, from:
Warner Music Group Corp.
1633 Broadway
New York, NY 10019
Attention: Investor Relations
We will be subject to the informational requirements of the Exchange Act and, accordingly, will file annual reports containing financial statements audited by an independent registered public accounting firm, quarterly reports containing unaudited financial statements, current reports, proxy statements and other information with the SEC. You may inspect and copy these reports, proxy statements and other information without charge at the SEC’s website. You may also access, free of charge, our reports filed with the SEC (for example, our Annual Reports on Form 10-K, our Quarterly Reports on Form 10-Q and our Current Reports on Form 8-K and any amendments to those forms) through our website (investors.wmg.com). Reports filed with or furnished to the SEC will be available as soon as reasonably practicable after they are filed with or furnished to the SEC. None of the information contained on, or that may be accessed through our websites or any other website identified herein is part of, or incorporated into, this prospectus. All website addresses in this prospectus are intended to be inactive textual references only.
191
Table of Contents
INDEX TO CONSOLIDATED FINANCIAL STATEMENTS
Contents
| Audited Financial Statements: |
||||
| Report of Independent Registered Public Accounting Firm on Consolidated Financial Statements |
F-2 | |||
| Consolidated Balance Sheets as of September 30, 2019 and September 30, 2018 |
F-3 | |||
| F-4 | ||||
| F-5 | ||||
| F-6 | ||||
| F-7 | ||||
| F-8 | ||||
| F-49 | ||||
| Supplementary Information—Consolidating Financial Statements |
F-51 | |||
| Audited Consolidated Financial Statement Schedules: |
||||
| F-63 | ||||
| Unaudited Interim Financial Statements: |
||||
| Consolidated Balance Sheets as of March 31, 2020 and September 30, 2019 |
F-64 | |||
| Consolidated Statements of Operations for the Three and Six Months Ended March 31, 2020 and 2019 |
F-65 | |||
| F-66 | ||||
| Consolidated Statements of Cash Flows for the Six Months Ended March 31, 2020 and 2019 |
F-67 | |||
| Consolidated Statements of Deficit for the Three and Six Months Ended March 31, 2020 and 2019 |
F-68 | |||
| F-70 | ||||
| Supplementary Information—Consolidating Financial Statements |
F-93 |
F-1
Table of Contents
Report of Independent Registered Public Accounting Firm
To the Stockholders and Board of Directors of Warner Music Group Corp.:
Opinion on the Consolidated Financial Statements
We have audited the accompanying consolidated balance sheets of Warner Music Group Corp. and subsidiaries (the Company) as of September 30, 2019 and 2018, the related consolidated statements of operations, comprehensive income, cash flows, and (deficit) equity, for each of the years in the three-year period ended September 30, 2019, and the related notes, and the related supplementary information, and financial statement schedule II as listed in the accompanying index (collectively, the consolidated financial statements). In our opinion, the consolidated financial statements present fairly, in all material respects, the financial position of the Company as of September 30, 2019 and 2018, and the results of its operations and its cash flows for each of the years in the three-year period ended September 30, 2019, in conformity with U.S. generally accepted accounting principles.
Change in Accounting Principle
As discussed in Note 2 to the consolidated financial statements, the Company has changed its method of accounting for revenue recognition as of October 1, 2018 due to the adoption of ASC Topic 606, Revenue from Contracts with Customers.
Basis for Opinion
These consolidated financial statements are the responsibility of the Company’s management. Our responsibility is to express an opinion on these consolidated financial statements based on our audits. We are a public accounting firm registered with the Public Company Accounting Oversight Board (United States) (PCAOB) and are required to be independent with respect to the Company in accordance with the U.S. federal securities laws and the applicable rules and regulations of the Securities and Exchange Commission and the PCAOB.
We conducted our audits in accordance with the standards of the PCAOB. Those standards require that we plan and perform the audit to obtain reasonable assurance about whether the consolidated financial statements are free of material misstatement, whether due to error or fraud. The Company is not required to have, nor were we engaged to perform, an audit of its internal control over financial reporting. As part of our audits, we are required to obtain an understanding of internal control over financial reporting but not for the purpose of expressing an opinion on the effectiveness of the Company’s internal control over financial reporting. Accordingly, we express no such opinion.
Our audits included performing procedures to assess the risks of material misstatement of the consolidated financial statements, whether due to error or fraud, and performing procedures that respond to those risks. Such procedures included examining, on a test basis, evidence regarding the amounts and disclosures in the consolidated financial statements. Our audits also included evaluating the accounting principles used and significant estimates made by management, as well as evaluating the overall presentation of the consolidated financial statements. We believe that our audits provide a reasonable basis for our opinion.
/s/ KPMG LLP
We have served as the Company’s auditor since 2015.
New York, New York
November 27, 2019, except as to the earnings per share paragraph in Note 2 which is dated February 6, 2020, and except as to per share and share information and the common stock paragraph in Note 2 which is dated May 7, 2020
F-2
Table of Contents
Warner Music Group Corp.
| September 30, 2019 |
September 30, 2018 |
|||||||
| (in millions) | ||||||||
| Assets |
||||||||
| Current assets: |
||||||||
| Cash and equivalents |
$ | 619 | $ | 514 | ||||
| Accounts receivable, net of allowances of $17 million and $45 million |
775 | 447 | ||||||
| Inventories |
74 | 42 | ||||||
| Royalty advances expected to be recouped within one year |
170 | 123 | ||||||
| Prepaid and other current assets |
53 | 50 | ||||||
|
|
|
|
|
|||||
| Total current assets |
1,691 | 1,176 | ||||||
| Royalty advances expected to be recouped after one year |
208 | 153 | ||||||
| Property, plant and equipment, net |
300 | 229 | ||||||
| Goodwill |
1,761 | 1,692 | ||||||
| Intangible assets subject to amortization, net |
1,723 | 1,851 | ||||||
| Intangible assets not subject to amortization |
151 | 154 | ||||||
| Deferred tax assets, net |
38 | 11 | ||||||
| Other assets |
145 | 78 | ||||||
|
|
|
|
|
|||||
| Total assets |
$ | 6,017 | $ | 5,344 | ||||
|
|
|
|
|
|||||
| Liabilities and Equity |
||||||||
| Current liabilities: |
||||||||
| Accounts payable |
$ | 260 | $ | 281 | ||||
| Accrued royalties |
1,567 | 1,396 | ||||||
| Accrued liabilities |
492 | 423 | ||||||
| Accrued interest |
34 | 31 | ||||||
| Deferred revenue |
180 | 208 | ||||||
| Other current liabilities |
286 | 34 | ||||||
|
|
|
|
|
|||||
| Total current liabilities |
2,819 | 2,373 | ||||||
| Long-term debt |
2,974 | 2,819 | ||||||
| Deferred tax liabilities, net |
172 | 165 | ||||||
| Other noncurrent liabilities |
321 | 307 | ||||||
|
|
|
|
|
|||||
| Total liabilities |
$ | 6,286 | $ | 5,664 | ||||
|
|
|
|
|
|||||
| Equity: |
||||||||
| Class A common stock ($0.001 par value; 1,000,000,000 shares authorized; 0 and 0 shares issued and outstanding as of September 30, 2019 and September 30, 2018, respectively) |
$ | — | $ | — | ||||
| Class B common stock ($0.001 par value; 1,000,000,000 shares authorized; 505,830,022 and 501,991,944 shares issued and outstanding as of September 30, 2019 and September 30, 2018, respectively) |
1 | 1 | ||||||
| Additional paid-in capital |
1,127 | 1,127 | ||||||
| Accumulated deficit |
(1,177 | ) | (1,272 | ) | ||||
| Accumulated other comprehensive loss, net |
(240 | ) | (190 | ) | ||||
|
|
|
|
|
|||||
| Total Warner Music Group Corp. deficit |
(289 | ) | (334 | ) | ||||
| Noncontrolling interest |
20 | 14 | ||||||
|
|
|
|
|
|||||
| Total equity |
(269 | ) | (320 | ) | ||||
|
|
|
|
|
|||||
| Total liabilities and equity |
$ | 6,017 | $ | 5,344 | ||||
|
|
|
|
|
|||||
See accompanying notes
F-3
Table of Contents
Warner Music Group Corp.
Consolidated Statements of Operations
| Fiscal Year Ended September 30, 2019 |
Fiscal Year Ended September 30, 2018 |
Fiscal Year Ended September 30, 2017 |
||||||||||
| (in millions, except share and per share amounts) | ||||||||||||
| Revenues |
$ | 4,475 | $ | 4,005 | $ | 3,576 | ||||||
| Costs and expenses: |
||||||||||||
| Cost of revenue |
(2,401 | ) | (2,171 | ) | (1,931 | ) | ||||||
| Selling, general and administrative expenses (a) |
(1,510 | ) | (1,411 | ) | (1,222 | ) | ||||||
| Amortization expense |
(208 | ) | (206 | ) | (201 | ) | ||||||
|
|
|
|
|
|
|
|||||||
| Total costs and expenses |
(4,119 | ) | (3,788 | ) | (3,354 | ) | ||||||
|
|
|
|
|
|
|
|||||||
| Operating income |
356 | 217 | 222 | |||||||||
| Loss on extinguishment of debt |
(7 | ) | (31 | ) | (35 | ) | ||||||
| Interest expense, net |
(142 | ) | (138 | ) | (149 | ) | ||||||
| Other income (expense) |
60 | 394 | (40 | ) | ||||||||
|
|
|
|
|
|
|
|||||||
| Income (loss) before income taxes |
267 | 442 | (2 | ) | ||||||||
| Income tax (expense) benefit |
(9 | ) | (130 | ) | 151 | |||||||
|
|
|
|
|
|
|
|||||||
| Net income |
258 | 312 | 149 | |||||||||
| Less: Income attributable to noncontrolling interest |
(2 | ) | (5 | ) | (6 | ) | ||||||
|
|
|
|
|
|
|
|||||||
| Net income attributable to Warner Music Group Corp. |
$ | 256 | $ | 307 | $ | 143 | ||||||
|
|
|
|
|
|
|
|||||||
| (a) Includes depreciation expense of: |
$ | (61 | ) | $ | (55 | ) | $ | (50 | ) | |||
|
|
|
|
|
|
|
|||||||
| Net income per share attributable to Warner Music Group Corp.’s stockholders: |
||||||||||||
| Basic and Diluted |
$ | 0.51 | $ | 0.61 | $ | 0.29 | ||||||
| Weighted average common shares: |
||||||||||||
| Basic and Diluted |
501,991,944 | 502,630,835 | 503,392,885 | |||||||||
See accompanying notes
F-4
Table of Contents
Warner Music Group Corp.
Consolidated Statements of Comprehensive Income
| Fiscal Year Ended September 30, 2019 |
Fiscal Year Ended September 30, 2018 |
Fiscal Year Ended September 30, 2017 |
||||||||||
| (in millions) | ||||||||||||
| Net income |
$ | 258 | $ | 312 | $ | 149 | ||||||
| Other comprehensive (loss) income, net of tax: |
||||||||||||
| Foreign currency adjustment |
(34 | ) | (13 | ) | 30 | |||||||
| Deferred (loss) gain on derivative financial instruments |
(11 | ) | 3 | — | ||||||||
| Minimum pension liability |
(5 | ) | 1 | 7 | ||||||||
|
|
|
|
|
|
|
|||||||
| Other comprehensive (loss) income, net of tax |
(50 | ) | (9 | ) | 37 | |||||||
|
|
|
|
|
|
|
|||||||
| Total comprehensive income |
208 | 303 | 186 | |||||||||
| Less: Income attributable to noncontrolling interest |
(2 | ) | (5 | ) | (6 | ) | ||||||
|
|
|
|
|
|
|
|||||||
| Comprehensive income attributable to Warner Music Group Corp. |
$ | 206 | $ | 298 | $ | 180 | ||||||
|
|
|
|
|
|
|
|||||||
See accompanying notes
F-5
Table of Contents
Warner Music Group Corp.
Consolidated Statements of Cash Flows
| Fiscal Year Ended September 30, 2019 |
Fiscal Year Ended September 30, 2018 |
Fiscal Year Ended September 30, 2017 |
||||||||||
| (in millions) | ||||||||||||
| Cash flows from operating activities |
||||||||||||
| Net income |
$ | 258 | $ | 312 | $ | 149 | ||||||
| Adjustments to reconcile net income to net cash provided by operating activities: |
||||||||||||
| Depreciation and amortization |
269 | 261 | 251 | |||||||||
| Unrealized (gains) losses and remeasurement of foreign-denominated loans |
(28 | ) | (3 | ) | 24 | |||||||
| Deferred income taxes |
(68 | ) | 66 | (192 | ) | |||||||
| Loss on extinguishment of debt |
7 | 31 | 35 | |||||||||
| Net (gain) loss on divestitures and investments |
(20 | ) | (389 | ) | 17 | |||||||
| Non-cash interest expense |
6 | 6 | 8 | |||||||||
| Equity-based compensation expense |
50 | 62 | 70 | |||||||||
| Changes in operating assets and liabilities: |
||||||||||||
| Accounts receivable, net |
(90 | ) | (43 | ) | (60 | ) | ||||||
| Inventories |
3 | (3 | ) | 1 | ||||||||
| Royalty advances |
(110 | ) | 31 | 17 | ||||||||
| Accounts payable and accrued liabilities |
3 | 82 | 48 | |||||||||
| Royalty payables |
130 | 22 | 136 | |||||||||
| Accrued interest |
3 | (10 | ) | 3 | ||||||||
| Deferred revenue |
(4 | ) | (4 | ) | 22 | |||||||
| Other balance sheet changes |
(9 | ) | 4 | 6 | ||||||||
|
|
|
|
|
|
|
|||||||
| Net cash provided by operating activities |
400 | 425 | 535 | |||||||||
|
|
|
|
|
|
|
|||||||
| Cash flows from investing activities |
||||||||||||
| Acquisition of music publishing rights and music catalogs, net |
(41 | ) | (14 | ) | (16 | ) | ||||||
| Capital expenditures |
(104 | ) | (74 | ) | (44 | ) | ||||||
| Investments and acquisitions of businesses, net of cash received |
(231 | ) | (23 | ) | (139 | ) | ||||||
| Proceeds from the sale of investments |
— | 516 | 73 | |||||||||
|
|
|
|
|
|
|
|||||||
| Net cash (used in) provided by investing activities |
(376 | ) | 405 | (126 | ) | |||||||
|
|
|
|
|
|
|
|||||||
| Cash flows from financing activities |
||||||||||||
| Proceeds from issuance of Acquisition Corp. 4.125% Senior Secured Notes |
— | — | 380 | |||||||||
| Proceeds from issuance of Acquisition Corp. 4.875% Senior Secured Notes |
— | — | 250 | |||||||||
| Proceeds from issuance of Acquisition Corp. 5.500% Senior Notes |
— | 325 | — | |||||||||
| Proceeds from supplement of Acquisition Corp. Senior Term Loan Facility |
— | 320 | 22 | |||||||||
| Proceeds from issuance of Acquisition Corp. 3.625% Senior Secured Notes |
514 | — | — | |||||||||
| Repayment of Acquisition Corp. 4.125% Senior Secured Notes |
(40 | ) | — | — | ||||||||
| Repayment of Acquisition Corp. 4.875% Senior Secured Notes |
(30 | ) | — | — | ||||||||
| Repayment of Acquisition Corp. 5.625% Senior Secured Notes |
(247 | ) | — | (28 | ) | |||||||
| Repayment of Acquisition Corp. 6.000% Senior Secured Notes |
— | — | (450 | ) | ||||||||
| Repayment of Acquisition Corp. 6.250% Senior Secured Notes |
— | — | (173 | ) | ||||||||
| Repayment of and redemption deposit for Acquisition Corp. 6.750% Senior Notes |
— | (635 | ) | — | ||||||||
| Call premiums paid and deposit on early redemption of debt |
(5 | ) | (23 | ) | (27 | ) | ||||||
| Deferred financing costs paid |
(7 | ) | (12 | ) | (13 | ) | ||||||
| Distribution to noncontrolling interest holder |
(3 | ) | (5 | ) | (5 | ) | ||||||
| Dividends paid |
(94 | ) | (925 | ) | (84 | ) | ||||||
|
|
|
|
|
|
|
|||||||
| Net cash provided by (used in) financing activities |
88 | (955 | ) | (128 | ) | |||||||
|
|
|
|
|
|
|
|||||||
| Effect of exchange rate changes on cash and equivalents |
(7 | ) | (8 | ) | 7 | |||||||
|
|
|
|
|
|
|
|||||||
| Net increase (decrease) in cash and equivalents |
105 | (133 | ) | 288 | ||||||||
| Cash and equivalents at beginning of period |
514 | 647 | 359 | |||||||||
|
|
|
|
|
|
|
|||||||
| Cash and equivalents at end of period |
$ | 619 | $ | 514 | $ | 647 | ||||||
|
|
|
|
|
|
|
|||||||
See accompanying notes
F-6
Table of Contents
Warner Music Group Corp.
Consolidated Statements of (Deficit) Equity
| Class A Common Stock |
Class B Common Stock |
Additional Paid-in Capital |
Accumulated Deficit |
Accumulated Other Comprehensive Loss |
Total Warner Music Group Corp. Equity |
Noncontrolling Interest |
Total (Deficit) Equity |
|||||||||||||||||||||||||||||||||
| Shares | Value | Shares | Value | |||||||||||||||||||||||||||||||||||||
| (in millions, except share and share amounts) | ||||||||||||||||||||||||||||||||||||||||
| Balance at September 30, 2016 |
— | $ | — | 503,392,885 | $ | 1 | $ | 1,127 | $ | (715 | ) | $ | (218 | ) | $ | 195 | $ | 15 | $ | 210 | ||||||||||||||||||||
| Net income |
— | — | — | — | — | 143 | — | 143 | 6 | 149 | ||||||||||||||||||||||||||||||
| Dividends ($0.17 per share) |
— | — | — | — | — | (84 | ) | — | (84 | ) | — | (84 | ) | |||||||||||||||||||||||||||
| Other comprehensive income, net of tax |
— | — | — | — | — | — | 37 | 37 | — | 37 | ||||||||||||||||||||||||||||||
| Disposal of noncontrolling interest related to divestiture |
— | — | — | — | — | — | — | — | (3 | ) | (3 | ) | ||||||||||||||||||||||||||||
| Distribution to noncontrolling interest holders |
— | — | — | — | — | — | — | — | (5 | ) | (5 | ) | ||||||||||||||||||||||||||||
| Other |
— | — | — | — | — | 2 | — | 2 | 2 | 4 | ||||||||||||||||||||||||||||||
|
|
|
|
|
|
|
|
|
|
|
|
|
|
|
|
|
|
|
|
|
|||||||||||||||||||||
| Balance at September 30, 2017 |
— | $ | — | 503,392,885 | $ | 1 | $ | 1,127 | $ | (654 | ) | $ | (181 | ) | $ | 293 | $ | 15 | $ | 308 | ||||||||||||||||||||
|
|
|
|
|
|
|
|
|
|
|
|
|
|
|
|
|
|
|
|
|
|||||||||||||||||||||
| Net income |
— | — | — | — | — | 307 | — | 307 | 5 | 312 | ||||||||||||||||||||||||||||||
| Dividends ($1.84 per share) |
— | — | — | — | — | (925 | ) | — | (925 | ) | — | (925 | ) | |||||||||||||||||||||||||||
| Other comprehensive loss, net of tax |
— | — | — | — | — | — | (9 | ) | (9 | ) | — | (9 | ) | |||||||||||||||||||||||||||
| Distribution to noncontrolling interest holders |
— | — | — | — | — | — | — | — | (6 | ) | (6 | ) | ||||||||||||||||||||||||||||
| Other |
— | — | (1,400,941 | ) | — | — | — | — | — | — | — | |||||||||||||||||||||||||||||
|
|
|
|
|
|
|
|
|
|
|
|
|
|
|
|
|
|
|
|
|
|||||||||||||||||||||
| Balance at September 30, 2018 |
— | $ | — | 501,991,944 | $ | 1 | $ | 1,127 | $ | (1,272 | ) | $ | (190 | ) | $ | (334 | ) | $ | 14 | $ | (320 | ) | ||||||||||||||||||
|
|
|
|
|
|
|
|
|
|
|
|
|
|
|
|
|
|
|
|
|
|||||||||||||||||||||
| Cumulative effect of ASC 606 adoption |
— | — | — | — | — | 139 | — | 139 | 11 | 150 | ||||||||||||||||||||||||||||||
| Net income |
— | — | — | — | — | 256 | — | 256 | 2 | 258 | ||||||||||||||||||||||||||||||
| Dividends ($0.59 per share) |
— | — | — | — | — | (300 | ) | — | (300 | ) | — | (300 | ) | |||||||||||||||||||||||||||
| Other comprehensive loss, net of tax |
— | — | — | — | — | — | (50 | ) | (50 | ) | — | (50 | ) | |||||||||||||||||||||||||||
| Distribution to noncontrolling interest holders |
— | — | — | — | — | — | — | — | (3 | ) | (3 | ) | ||||||||||||||||||||||||||||
| Other |
— | — | 3,838,078 | — | — | — | — | — | (4 | ) | (4 | ) | ||||||||||||||||||||||||||||
|
|
|
|
|
|
|
|
|
|
|
|
|
|
|
|
|
|
|
|
|
|||||||||||||||||||||
| Balance at September 30, 2019 |
— | $ | — | 505,830,022 | $ | 1 | $ | 1,127 | $ | (1,177 | ) | $ | (240 | ) | $ | (289 | ) | $ | 20 | $ | (269 | ) | ||||||||||||||||||
|
|
|
|
|
|
|
|
|
|
|
|
|
|
|
|
|
|
|
|
|
|||||||||||||||||||||
See accompanying notes
F-7
Table of Contents
Warner Music Group Corp.
Notes to Consolidated Audited Financial Statements
1. Description of Business
Warner Music Group Corp. (the “Company”) was formed on November 21, 2003. The Company is the direct parent of WMG Holdings Corp. (“Holdings”), which is the direct parent of WMG Acquisition Corp. (“Acquisition Corp.”). Acquisition Corp. is one of the world’s major music entertainment companies.
Acquisition of Warner Music Group by Access Industries
Pursuant to the Agreement and Plan of Merger, dated as of May 6, 2011 (the “Merger Agreement”), by and among the Company, AI Entertainment Holdings LLC (formerly Airplanes Music LLC), a Delaware limited liability company (“Parent”) and an affiliate of Access Industries, Inc. (“Access”), and Airplanes Merger Sub, Inc., a Delaware corporation and a wholly owned subsidiary of Parent (“Merger Sub”), on July 20, 2011 (the “Merger Closing Date”), Merger Sub merged with and into the Company with the Company surviving as a wholly owned subsidiary of Parent (the “Merger”). In connection with the Merger, the Company delisted its common stock from the New York Stock Exchange (the “NYSE”). The Company continues to voluntarily file with the U.S. Securities and Exchange Commission (the “SEC”) current and periodic reports that would be required to be filed with the SEC pursuant to Section 15(d) of the Securities Exchange Act of 1934, as amended (the “Exchange Act”) as provided for in certain covenants contained in the instruments covering its outstanding indebtedness. All of the Company’s common stock is owned by affiliates of Access.
Recorded Music Operations
Our Recorded Music business primarily consists of the discovery and development of recording artists and the related marketing, promotion, distribution, sale and licensing of music created by such recording artists. We play an integral role in virtually all aspects of the recorded music value chain from discovering and developing talent to producing, distributing and selling music to marketing and promoting recording artists and their music.
In the United States, our Recorded Music business is conducted principally through our major record labels—Atlantic Records and Warner Records. In October 2018, we launched Elektra Music Group in the United States as a standalone label group, which comprises the Elektra, Fueled by Ramen and Roadrunner labels. Our Recorded Music business also includes Rhino Entertainment, a division that specializes in marketing our recorded music catalog through compilations, reissuances of previously released music and video titles and releasing previously unreleased material from our vault. We also conduct our Recorded Music business through a collection of additional record labels including Asylum, Big Beat, Canvasback, East West, Erato, FFRR, Nonesuch, Parlophone, Reprise, Sire, Spinnin’ Records, Warner Classics and Warner Music Nashville.
Outside the United States, our Recorded Music business is conducted in more than 60 countries through various subsidiaries, affiliates and non-affiliated licensees. Internationally, we engage in the same activities as in the United States: discovering and signing artists and distributing, selling, marketing and promoting their music. In most cases, we also market, promote, distribute and sell the music of those recording artists for whom our domestic record labels have international rights. In certain smaller markets, we license the right to distribute and sell our music to non-affiliated third-party record labels.
Our Recorded Music business’ distribution operations include Warner-Elektra-Atlantic Corporation (“WEA Corp.”), which markets, distributes and sells music and video products to retailers and wholesale distributors; Alternative Distribution Alliance (“ADA”), which markets, distributes and sells the products of independent labels to retail and wholesale distributors; and various distribution centers and ventures operated internationally.
In addition to our music being sold in physical retail outlets, our music is also sold in physical form to online physical retailers, such as Amazon.com, barnesandnoble.com and bestbuy.com, and distributed in digital
F-8
Table of Contents
form to an expanded universe of digital partners, including streaming services such as those of Amazon, Apple, Deezer, SoundCloud, Spotify, Tencent Music Entertainment Group and YouTube, radio services such as iHeart Radio and SiriusXM and download services such as Apple’s iTunes and Google Play.
We have integrated the marketing of digital content into all aspects of our business, including artists and repertoire (“A&R”) and distribution. Our business development executives work closely with A&R departments to ensure that while music is being produced, digital assets are also created with all distribution channels in mind, including streaming services, social networking sites, online portals and music-centered destinations. We also work side-by-side with our online and mobile partners to test new concepts. We believe existing and new digital businesses will be a significant source of growth and will provide new opportunities to successfully monetize our assets and create new revenue streams. The proportion of digital revenues attributable to each distribution channel varies by region and proportions may change as the introduction of new technologies continues. As one of the world’s largest music entertainment companies, we believe we are well positioned to take advantage of growth in digital distribution and emerging technologies to maximize the value of our assets.
We have diversified our revenues beyond our traditional businesses by entering into expanded-rights deals with recording artists in order to partner with such artists in other aspects of their careers. Under these agreements, we provide services to and participate in recording artists’ activities outside the traditional recorded music business such as touring, merchandising and sponsorships. We have built and acquired artist services capabilities and platforms for marketing and distributing this broader set of music-related rights and participating more widely in the monetization of the artist brands we help create. We believe that entering into expanded-rights deals and enhancing our artist services capabilities in areas such as merchandising, VIP ticketing, fan clubs, concert promotion and management has permitted us to diversify revenue streams and capitalize on other revenue opportunities. This provides for improved long-term relationships with our recording artists and allows us to more effectively connect recording artists and fans.
Music Publishing Operations
While Recorded Music is focused on marketing, promoting, distributing and licensing a particular recording of a musical composition, Music Publishing is an intellectual property business focused on generating revenue from uses of the musical composition itself. In return for promoting, placing, marketing and administering the creative output of a songwriter, or engaging in those activities for other rightsholders, our Music Publishing business garners a share of the revenues generated from use of the musical compositions.
The operations of our Music Publishing business are conducted principally through Warner Chappell Music, our global music publishing company headquartered in Los Angeles with operations in over 60 countries through various subsidiaries, affiliates and non-affiliated licensees. We own or control rights to more than 1.4 million musical compositions, including numerous pop hits, American standards, folk songs and motion picture and theatrical compositions. Assembled over decades, our award-winning catalog includes over 80,000 songwriters and composers and a diverse range of genres including pop, rock, jazz, classical, country, R&B, hip-hop, rap, reggae, Latin, folk, blues, symphonic, soul, Broadway, techno, alternative and gospel. Warner Chappell Music also administers the music and soundtracks of several third-party television and film producers and studios. We have an extensive production music catalog collectively branded as Warner Chappell Production Music.
2. Summary of Significant Accounting Policies
Basis of Presentation
The accompanying consolidated financial statements have been prepared in accordance with accounting principles generally accepted in the United States (“U.S. GAAP”). In the opinion of management, all adjustments (consisting of normal recurring accruals) considered necessary for a fair presentation have been included.
The Company maintains a 52-53 week fiscal year ending on the last Friday in each reporting period. The fiscal year ended September 30, 2019 ended on September 27, 2019, the fiscal year ended September 30, 2018
F-9
Table of Contents
ended on September 28, 2018 and the fiscal year ended September 30, 2017 ended on September 29, 2017. For convenience purposes, the Company continues to date its financial statements as of September 30.
Basis of Consolidation
The accompanying financial statements present the consolidated accounts of all entities in which the Company has a controlling voting interest and/or variable interest required to be consolidated in accordance with U.S. GAAP. All intercompany balances and transactions have been eliminated.
Financial Accounting Standards Board (“FASB”) Accounting Standards Codification (“ASC”) Topic 810, Consolidation (“ASC 810”) requires the Company first evaluate its investments to determine if any investments qualify as a variable interest entity (“VIE”). A VIE is consolidated if the Company is deemed to be the primary beneficiary of the VIE, which is the party involved with the VIE that has both (i) the power to control the most significant activities of the VIE and (ii) either the obligation to absorb losses or the right to receive benefits that could potentially be significant to the VIE. If an entity is not deemed to be a VIE, the Company consolidates the entity if the Company has a controlling voting interest.
Common Stock
On February 28, 2020, the Company created new classes of shares (Class A and Class B common stock), and all outstanding shares of the Company’s common stock were reclassified into shares of Class B common stock. The shares of the Company’s Class A common stock are entitled to one vote per share and the shares of the Company’s Class B common stock are entitled to 20 votes per share. Effective on February 28, 2020, there was a 477,242.614671815-for-1 stock split of the Company’s Class B common stock. This stock split has been retrospectively presented throughout the financial statements.
Earnings per Share
The consolidated statements of operations present basic and diluted earnings per share (“EPS”). Basic and diluted earnings (loss) per share is computed by dividing net income (loss) available to common stockholders by the weighted average number of outstanding common shares less shares issued for the exercise of the deferred equity units during the period. The deferred equity units are mandatorily redeemable and as such are excluded from the denominator of the basic and diluted EPS calculation. The Company did not have any dilutive securities for the periods ended September 30, 2019, September 30, 2018 and September 30, 2017.
Use of Estimates
The preparation of consolidated financial statements in conformity with U.S. GAAP requires management to make estimates and assumptions that affect the amounts reported in the Consolidated Financial Statements and the accompanying notes. Actual results could differ from those estimates.
Business Combinations
The Company accounts for its business acquisitions under the FASB ASC Topic 805, Business Combinations (“ASC 805”) guidance for business combinations. The total cost of acquisitions is allocated to the underlying identifiable net assets based on their respective estimated fair values. The excess of the purchase price over the estimated fair values of the net assets acquired is recorded as goodwill. Determining the fair value of assets acquired and liabilities assumed requires management’s judgment and often involves the use of significant estimates and assumptions, including assumptions with respect to future cash inflows and outflows, discount rates, asset lives and market multiples, among other items.
Cash and Equivalents
The Company considers all highly liquid investments with maturities of three months or less at the date of purchase to be cash equivalents. The Company includes checks outstanding at year end as a component of accounts payable, instead of a reduction in its cash balance where there is not a right of offset in the related bank accounts.
F-10
Table of Contents
Accounts Receivable
Credit is extended to customers based upon an evaluation of the customer’s financial condition. Accounts receivable are recorded at net realizable value.
Refund Liabilities and Allowance for Doubtful Accounts
Management’s estimate of Recorded Music physical products that will be returned, and the amount of receivables that will ultimately be collected is an area of judgment affecting reported revenues and operating income. In determining the estimate of physical product sales that will be returned, management analyzes vendor sales of product, historical return trends, current economic conditions, changes in customer demand and commercial acceptance of the Company’s products. Based on this information, management reserves a percentage of each dollar of physical product sales that provide the customer with the right of return. The provision for such sales returns is reflected as a reduction in the revenues from the related sale.
Similarly, the Company monitors customer credit risk related to accounts receivable. Significant judgments and estimates are involved in evaluating if such amounts will ultimately be fully collected. On an ongoing basis, the Company tracks customer exposure based on news reports, ratings agency information, reviews of customer financial data and direct dialogue with customers. Counterparties that are determined to be of a higher risk are evaluated to assess whether the payment terms previously granted to them should be modified. The Company also monitors payment levels from customers, and a provision for estimated uncollectible amounts is maintained based on such payment levels, historical experience, management’s views on trends in the overall receivable agings and, for larger accounts, analyses of specific risks on a customer-specific basis.
Concentration of Credit Risk
Customer credit risk represents the potential for financial loss if a customer is unwilling or unable to meet its agreed upon contractual payment obligations. As of September 30, 2019 and September 30, 2018, Spotify represented 13% and 18%, respectively, of the Company’s accounts receivable balance. No other single customer accounted for more than 10% of accounts receivable in either period. The Company, by policy, routinely assesses the financial strength of its customers. As such, the Company does not believe there is any significant collection risk.
In the Music Publishing business, the Company collects a significant portion of its royalties from copyright collecting societies around the world. Collecting societies and associations generally are not-for-profit organizations that represent composers, songwriters and music publishers. These organizations seek to protect the rights of their members by licensing, collecting license fees and distributing royalties for the use of the members’ works. Accordingly, the Company does not believe there is any significant collection risk from such societies.
Inventories
Inventories consist of merchandise, vinyl, CDs, DVDs and other related music products. Inventories are stated at the lower of cost or estimated realizable value. Cost is determined using first-in, first-out (“FIFO”) and average cost methods, which approximate cost under the FIFO method. Returned goods included in inventory are valued at estimated realizable value, but not in excess of cost.
Derivative and Financial Instruments
The Company accounts for these investments as required by the FASB ASC Topic 815, Derivatives and Hedging (“ASC 815”), which requires that all derivative instruments be recognized on the balance sheet at fair value. ASC 815 also provides that, for derivative instruments that qualify for hedge accounting, changes in the fair value are either (a) offset against the change in fair value of the hedged assets, liabilities or firm
F-11
Table of Contents
commitments through earnings or (b) recognized in equity until the hedged item is recognized in earnings, depending on whether the derivative is being used to hedge changes in fair value or cash flows. In addition, the ineffective portion of a derivative’s change in fair value is immediately recognized in earnings.
The carrying value of the Company’s financial instruments approximates fair value, except for certain differences relating to long-term, fixed-rate debt (see Note 17) and other financial instruments that are not significant. The fair value of financial instruments is generally determined by reference to market values resulting from trading on a national securities exchange or an over-the-counter market. In cases where quoted market prices are not available, fair value is based on estimates using present value or other valuation techniques.
Property, Plant and Equipment
Property, plant and equipment existing at the date of the Merger or acquired in conjunction with subsequent business combinations are recorded at fair value. All other additions are recorded at historical cost. Depreciation is calculated using the straight-line method based upon the estimated useful lives of depreciable assets as follows: five to seven years for furniture and fixtures, periods of up to five years for computer equipment and periods of up to thirteen years for machinery and equipment. Buildings are depreciated over periods of up to forty years. Leasehold improvements are depreciated over the life of the lease or estimated useful lives of the improvements, whichever period is shorter.
Accounting for Goodwill and Other Intangible Assets
In accordance with FASB ASC Topic 350, Intangibles—Goodwill and Other (“ASC 350”), the Company accounts for business combinations using the acquisition method of accounting and accordingly, the assets and liabilities of the acquired entities are recorded at their estimated fair values at the acquisition date. Goodwill represents the excess of the purchase price over the fair value of net assets, including the amount assigned to identifiable intangible assets. Pursuant to this guidance, the Company does not amortize the goodwill balance and instead, performs an annual impairment test to assess the fair value of goodwill over its carrying value. Identifiable intangible assets with finite lives are amortized over their useful lives.
Goodwill is tested annually for impairment as of July 1 and at any time upon the occurrence of certain events or changes in circumstances. The Company has the option to perform a qualitative assessment to determine if an impairment is more likely than not to have occurred. If the Company can support the conclusion that it is not more likely than not that the fair value of a reporting unit is less than its carrying amount, the Company would not need to perform the two-step impairment test for that reporting unit. If the Company cannot support such a conclusion or the Company does not elect to perform the qualitative assessment then the first step of the goodwill impairment test is used to identify potential impairment by comparing the fair value of a reporting unit with its carrying amount, including goodwill. If the estimated fair value of the reporting unit exceeds its carrying amount, its goodwill is not impaired and the second step of the impairment test is not necessary. If the carrying amount of the reporting unit exceeds its estimated fair value, then the second step of the goodwill impairment test must be performed. The second step of the goodwill impairment test compares the implied fair value of the reporting unit goodwill with its carrying amount to measure the amount of impairment, if any. The implied fair value of goodwill is determined in the same manner as the amount of goodwill recognized in a business combination. If the carrying amount of the reporting unit goodwill exceeds the implied fair value of that goodwill, an impairment is recognized in an amount equal to that excess.
The Company performs an annual impairment test of its indefinite-lived intangible assets as of July 1 of each fiscal year, unless events occur which trigger the need for an earlier impairment test. The Company has the option to perform a qualitative assessment to determine if an impairment is more likely than not to have occurred. In the qualitative assessment, the Company must evaluate the totality of qualitative factors, including any recent fair value measurements, that impact whether an indefinite-lived intangible asset other than goodwill has a carrying amount that more likely than not exceeds its fair value. The Company must proceed to conduct a
F-12
Table of Contents
quantitative analysis if the Company (i) determines that such an impairment is more likely than not to exist or (ii) forgoes the qualitative assessment entirely. Under the quantitative assessment, the impairment test for identifiable indefinite-lived intangible assets consists of a comparison of the estimated fair value of the intangible asset with its carrying value. If the carrying value of the intangible asset exceeds its fair value, then an impairment loss is recognized in an amount equal to that excess. The Company generally determines the fair value of an indefinite-lived intangible asset using a discounted cash flow (“DCF”) analysis, such as the relief from royalty method, which is used in estimating the fair value of the Company’s trademarks. Discount rate assumptions are based on an assessment of the risk inherent in the projected future cash flows generated by the respective intangible assets. Also subject to judgment are assumptions about royalty rates, which are based on the estimated rates at which similar trademarks are being licensed in the marketplace.
The impairment tests require management to make assumptions about future conditions impacting the value of the indefinite-lived intangible assets, including projected growth rates, cost of capital, effective tax rates, tax amortization periods, royalty rates, market share and others.
Valuation of Long-Lived Assets
The Company periodically reviews the carrying value of its long-lived assets, including finite-lived intangibles, property, plant and equipment and amortizable intangible assets, whenever events or changes in circumstances indicate that the carrying value may not be recoverable or that the lives assigned may no longer be appropriate. To the extent the estimated future cash inflows attributable to the asset, less estimated future cash outflows, are less than the carrying amount, an impairment loss is recognized in an amount equal to the difference between the carrying value of such asset and its fair value. Assets to be disposed of and for which there is a committed plan to dispose of the assets, whether through sale or abandonment, are reported at the lower of carrying value or fair value less costs to sell. If it is determined that events and circumstances warrant a revision to the remaining period of amortization, an asset’s remaining useful life would be changed, and the remaining carrying amount of the asset would be amortized prospectively over that revised remaining useful life.
Foreign Currency Translation
The financial position and operating results of substantially all foreign operations are consolidated using the local currency as the functional currency. Local currency assets and liabilities are translated at the rates of exchange on the balance sheet date, and local currency revenues and expenses are translated at average rates of exchange during the period. Resulting translation gains or losses are included in the accompanying consolidated statements of equity as a component of accumulated other comprehensive loss.
Revenues
Recorded Music
As required by FASB ASC Topic 606, Revenue from Contracts with Customers (“ASC 606”), the Company recognizes revenue when, or as, control of the promised services or goods is transferred to our customers and in an amount that reflects the consideration the Company is contractually due in exchange for those services or goods.
Revenues from the sale or license of Recorded Music products through digital distribution channels are typically recognized when usage occurs based on usage reports received from the customer. These licenses typically contain a single performance obligation, which is ongoing access to all intellectual property in an evolving content library, predicated on: (1) the business practice and contractual ability to remove specific content without a requirement to replace the content and without impact to minimum royalty guarantees and (2) the contracts not containing a specific listing of content subject to the license. For certain licenses where the consideration is fixed and the intellectual property being licensed is static, revenue is recognized at the point in time when control of the licensed content is transferred to the customer.
F-13
Table of Contents
Revenues from the sale of Recorded Music products through digital distribution channels are typically recognized when sale or usage occurs based on usage reports received from the customer. Revenues from the sale of physical Recorded Music products are recognized upon delivery, which occurs once the product has been shipped and control has been transferred. In accordance with industry practice and as is customary in many territories, certain products, such as CDs and DVDs, are sold to customers with the right to return unsold items. Revenues from such sales are generally recognized upon shipment based on gross sales less a provision for future estimated returns.
Music Publishing
Music Publishing revenues are earned from the receipt of royalties relating to the licensing of rights in musical compositions and the sale of published sheet music and songbooks. The receipt of royalties principally relates to amounts earned from the public performance of musical compositions, the mechanical reproduction of musical compositions on recorded media including digital formats and the use of musical compositions in synchronization with visual images. Music publishing royalties, except for synchronization royalties, generally are recognized when the sale or usage occurs. The most common form of consideration for publishing contracts is sales- and usage-based royalties. The collecting societies submit usage reports, typically with payment for royalties due, often on a quarterly or biannual reporting period, in arrears. Royalties are recognized as the sale or usage occurs based upon usage reports and, when these reports are not available, royalties are estimated based on historical data, such as recent royalties reported, company-specific information with respect to changes in repertoire, industry information and other relevant trends. Synchronization revenue is typically recognized as revenue when control of the license is transferred to the customer in accordance with ASC 606.
Royalty Advances and Royalty Costs
The Company regularly commits to and pays royalty advances to its recording artists and songwriters in respect of future sales. The Company accounts for these advances under the related guidance in FASB ASC Topic 928, Entertainment—Music (“ASC 928”). Under ASC 928, the Company capitalizes as assets certain advances that it believes are recoverable from future royalties to be earned by the recording artist or songwriter. Advances vary in both amount and expected life based on the underlying recording artist or songwriter.
The Company’s decision to capitalize an advance to a recording artist or songwriter as an asset requires significant judgment as to the recoverability of the advance. The recoverability is assessed upon initial commitment of the advance based upon the Company’s forecast of anticipated revenue from the sale of future and existing albums or musical compositions. In determining whether the advance is recoverable, the Company evaluates the current and past popularity of the recording artist or songwriter, the sales history of the recording artist or songwriter, the initial or expected commercial acceptability of the music, the current and past popularity of the genre of music that the product is designed to appeal to, and other relevant factors. Based upon this information, the Company expenses the portion of any advance that it believes is not recoverable. In most cases, advances to recording artists or songwriters without a history of success and evidence of current or past popularity will be expensed immediately. Significant advances are individually assessed for recoverability continuously and at minimum on a quarterly basis. As part of the ongoing assessment of recoverability, the Company monitors the projection of future sales based on the current environment, the recording artist’s or songwriter’s ability to meet their contractual obligations as well as the Company’s intent to support future album releases or musical compositions from the recording artist or songwriter. To the extent that a portion of an outstanding advance is no longer deemed recoverable, that amount will be expensed in the period the determination is made.
Advertising
As required by the FASB ASC Subtopic 720-35, Advertising Costs (“ASC 720-35”), advertising costs, including costs to produce music videos used for promotional purposes, are expensed as incurred. Advertising
F-14
Table of Contents
expense amounted to approximately $108 million, $104 million and $97 million for the fiscal years ended September 30, 2019, September 30, 2018 and September 30, 2017, respectively. Deferred advertising costs, which principally relate to advertisements that have been paid for but not been exhibited or services that have not been received, were not material for all periods presented.
Share-Based Compensation
The Company accounts for share-based payments as required by FASB ASC Topic 718, Compensation—Stock Compensation (“ASC 718”). ASC 718 requires all share-based payments to employees, including grants of employee stock options, to be recognized as compensation expense. Under the fair value recognition provision of ASC 718, equity classified share-based compensation cost is measured at the grant date based on the fair value of the award and is recognized as expense over the vesting period.
Under the recognition provision of ASC 718, liability classified share-based compensation costs are measured each reporting date until settlement. The Company’s policy is to measure share-based compensation costs using the intrinsic value method instead of fair value as it is not practical to estimate the volatility of its share price. During fiscal year 2013, the Company initiated a long-term incentive plan that has liability classification for share-based compensation awards and continues to be effective through September 30, 2019.
Income Taxes
Income taxes are provided using the asset and liability method presented by FASB ASC Topic 740, Income Taxes (“ASC 740”). Under this method, income taxes (i.e., deferred tax assets, deferred tax liabilities, taxes currently payable/refunds receivable and tax expense) are recorded based on amounts refundable or payable in the current fiscal year and include the results of any differences between U.S. GAAP and tax reporting. Deferred income taxes reflect the tax effect of net operating loss, capital loss and general business credit carryforwards and the net tax effects of temporary differences between the carrying amount of assets and liabilities for financial statements and income tax purposes, as determined under enacted tax laws and rates. Valuation allowances are established when management determines that it is more likely than not that some portion or the entire deferred tax asset will not be realized. The financial effect of changes in tax laws or rates is accounted for in the period of enactment. On December 22, 2017, the U.S. government enacted comprehensive tax legislation commonly referred to as the Tax Cuts and Jobs Act (the “Tax Act”). In accordance with ASC 740, the Company recorded the impacts in the period of enactment.
From time to time, the Company engages in transactions in which the tax consequences may be subject to uncertainty. Significant judgment is required in assessing and estimating the tax consequences of these transactions. The Company prepares and files tax returns based on its interpretation of tax laws and regulations. In the normal course of business, the Company’s tax returns are subject to examination by various taxing authorities. Such examinations may result in future tax and interest assessments by these taxing authorities. In determining the Company’s tax provision for financial reporting purposes, the Company establishes a reserve for uncertain tax positions unless such positions are determined to be more likely than not of being sustained upon examination based on their technical merits. There is considerable judgment involved in determining whether positions taken on the Company’s tax returns are more likely than not of being sustained.
New Accounting Pronouncements
Adoption of New Revenue Recognition Standard
In May 2014, the FASB issued guidance codified in ASC 606 which replaces the guidance in former ASC 605, Revenue Recognition, and ASC 928-605, Entertainment—Music. The amendment was the result of a joint effort by the FASB and the International Accounting Standards Board to improve financial reporting by creating common revenue recognition guidance for U.S. GAAP and international financial reporting standards (“IFRS”). The joint project clarifies the principles for recognizing revenue and develops a common revenue standard for U.S. GAAP and IFRS.
F-15
Table of Contents
The Company adopted ASC 606 on October 1, 2018, using the modified retrospective method to all contracts not completed as of the date of adoption. The reported results as of and for the fiscal year ended September 30, 2019 reflect the application of the new standard, while the reported results for the fiscal year ended September 30, 2018 have not been adjusted to reflect the new standard and were prepared under prior revenue recognition accounting guidance.
The adoption of ASC 606 resulted in a change in the timing of revenue recognition in the Company’s Music Publishing segment as well as international broadcast rights within the Company’s Recorded Music segment. Under the new revenue recognition rules, revenue is recorded based on best estimates available in the period of sale or usage whereas revenue was previously recorded when cash was received for both the licensing of publishing rights and international Recorded Music broadcast fees. Additionally, for certain licenses where the consideration is fixed and the intellectual property being licensed is static, revenue is recognized at the point in time when control of the licensed content is transferred to the customer. As a result of adopting ASC 606, the Company recorded a decrease to the opening accumulated deficit of approximately $139 million, net of tax, as of October 1, 2018. The Company also reclassified $28 million from accounts receivable to other current liabilities related to estimated refund liabilities for its physical sales.
The following table provides the cumulative effect of the changes made to the opening balance sheet, as of October 1, 2018, from the adoption of ASC 606 and which primarily relates to the accrual of licensing revenue in the period of sale or usage.
| September 30, 2018 |
Impact of Adoption |
October 1, 2018 |
||||||||||
| (in millions) | ||||||||||||
| Assets |
||||||||||||
| Accounts receivable, net |
$ | 447 | $ | 257 | $ | 704 | ||||||
|
|
|
|
|
|
|
|||||||
| Total current assets |
1,176 | 257 | 1,433 | |||||||||
| Other assets |
78 | 15 | 93 | |||||||||
|
|
|
|
|
|
|
|||||||
| Total assets |
$ | 5,344 | $ | 272 | $ | 5,616 | ||||||
|
|
|
|
|
|
|
|||||||
| Liabilities and Equity |
||||||||||||
| Accrued royalties |
$ | 1,396 | $ | 79 | $ | 1,475 | ||||||
| Accrued liabilities |
423 | (1 | ) | 422 | ||||||||
| Deferred revenue |
208 | (27 | ) | 181 | ||||||||
| Other current liabilities |
34 | 33 | 67 | |||||||||
|
|
|
|
|
|
|
|||||||
| Total current liabilities |
2,373 | 84 | 2,457 | |||||||||
| Deferred tax liabilities, net |
165 | 37 | 202 | |||||||||
| Other noncurrent liabilities |
307 | 1 | 308 | |||||||||
|
|
|
|
|
|
|
|||||||
| Total liabilities |
$ | 5,664 | $ | 122 | $ | 5,786 | ||||||
|
|
|
|
|
|
|
|||||||
| Equity: |
||||||||||||
| Accumulated deficit |
(1,272 | ) | 139 | (1,133 | ) | |||||||
| Noncontrolling interest |
14 | 11 | 25 | |||||||||
|
|
|
|
|
|
|
|||||||
| Total equity |
(320 | ) | 150 | (170 | ) | |||||||
|
|
|
|
|
|
|
|||||||
| Total liabilities and equity |
$ | 5,344 | $ | 272 | $ | 5,616 | ||||||
|
|
|
|
|
|
|
|||||||
F-16
Table of Contents
The disclosures of the impact of adoption on the consolidated statement of operations for the fiscal year ended September 30, 2019, the consolidated balance sheet as of September 30, 2019, and the consolidated statement of cash flows for the fiscal year ended September 30, 2019 are as follows:
| Fiscal Year Ended September 30, 2019 | ||||||||||||
| As Reported | Balances without adoption of ASC 606 |
Effect of Change | ||||||||||
| (in millions) | ||||||||||||
| Revenue |
$ | 4,475 | $ | 4,447 | $ | 28 | ||||||
|
|
|
|
|
|
|
|||||||
| Cost and expenses: |
||||||||||||
| Cost of revenue |
(2,401 | ) | (2,389 | ) | (12 | ) | ||||||
|
|
|
|
|
|
|
|||||||
| Operating income |
356 | 340 | 16 | |||||||||
|
|
|
|
|
|
|
|||||||
| Income before income taxes |
267 | 251 | 16 | |||||||||
| Income tax expense |
(9 | ) | (5 | ) | (4 | ) | ||||||
|
|
|
|
|
|
|
|||||||
| Net income |
258 | 246 | 12 | |||||||||
|
|
|
|
|
|
|
|||||||
| Less: Income attributable to noncontrolling interest |
(2 | ) | (4 | ) | 2 | |||||||
|
|
|
|
|
|
|
|||||||
| Net income attributable to Warner Music Group Corp. |
$ | 256 | $ | 242 | $ | 14 | ||||||
|
|
|
|
|
|
|
|||||||
| September 30, 2019 | ||||||||||||
| As Reported | Balances without adoption of ASC 606 |
Effect of Change | ||||||||||
| (in millions) | ||||||||||||
| Assets |
||||||||||||
| Accounts receivable, net |
$ | 775 | $ | 495 | $ | 280 | ||||||
|
|
|
|
|
|
|
|||||||
| Total current assets |
1,691 | 1,411 | 280 | |||||||||
| Other assets |
145 | 135 | 10 | |||||||||
| Deferred tax assets, net |
38 | 38 | — | |||||||||
|
|
|
|
|
|
|
|||||||
| Total assets |
$ | 6,017 | $ | 5,727 | $ | 290 | ||||||
|
|
|
|
|
|
|
|||||||
| Liabilities and Equity |
||||||||||||
| Accounts payable |
$ | 260 | $ | 261 | $ | (1 | ) | |||||
| Accrued royalties |
1,567 | 1,474 | 93 | |||||||||
| Accrued liabilities |
492 | 493 | (1 | ) | ||||||||
| Deferred revenue |
180 | 216 | (36 | ) | ||||||||
| Other current liabilities |
286 | 259 | 27 | |||||||||
|
|
|
|
|
|
|
|||||||
| Total current liabilities |
2,819 | 2,737 | 82 | |||||||||
| Deferred tax liabilities, net |
172 | 131 | 41 | |||||||||
| Other noncurrent liabilities |
321 | 317 | 4 | |||||||||
|
|
|
|
|
|
|
|||||||
| Total liabilities |
6,286 | 6,159 | 127 | |||||||||
|
|
|
|
|
|
|
|||||||
| Equity: |
||||||||||||
| Accumulated deficit |
(1,177 | ) | (1,331 | ) | 154 | |||||||
| Noncontrolling interest |
20 | 11 | 9 | |||||||||
|
|
|
|
|
|
|
|||||||
| Total equity |
(269 | ) | (432 | ) | 163 | |||||||
|
|
|
|
|
|
|
|||||||
| Total liabilities and equity |
$ | 6,017 | $ | 5,727 | $ | 290 | ||||||
|
|
|
|
|
|
|
|||||||
F-17
Table of Contents
| Fiscal Year Ended September 30, 2019 | ||||||||||||
| As Reported | Balances without adoption of ASC 606 |
Effect of Change | ||||||||||
| (in millions) | ||||||||||||
| Cash flows from operating activities |
||||||||||||
| Net income |
$ | 258 | $ | 246 | $ | 12 | ||||||
| Deferred income taxes |
(68 | ) | (72 | ) | 4 | |||||||
| Changes in operating assets and liabilities: |
||||||||||||
| Accounts receivable, net |
(90 | ) | (67 | ) | (23 | ) | ||||||
| Accounts payable and accrued liabilities |
3 | 1 | 2 | |||||||||
| Royalty advances |
(110 | ) | (124 | ) | 14 | |||||||
| Deferred revenue |
(4 | ) | 5 | (9 | ) | |||||||
| Other balance sheet changes |
(9 | ) | (9 | ) | — | |||||||
|
|
|
|
|
|
|
|||||||
| Net cash provided by operating activities |
400 | 400 | — | |||||||||
|
|
|
|
|
|
|
|||||||
| Effect of exchange rate changes on cash and equivalents |
(7 | ) | (7 | ) | — | |||||||
|
|
|
|
|
|
|
|||||||
| Net increase in cash and equivalents |
105 | 105 | — | |||||||||
| Cash and equivalents at beginning of period |
514 | 514 | — | |||||||||
|
|
|
|
|
|
|
|||||||
| Cash and equivalents at end of period |
$ | 619 | $ | 619 | $ | — | ||||||
|
|
|
|
|
|
|
|||||||
Recently Adopted Accounting Pronouncements
In January 2016, the FASB issued ASU 2016-01, Recognition and Measurement of Financial Assets and Financial Liabilities (“ASU 2016-01”). This ASU will require that equity investments, except those investments under the equity method of accounting, are measured at fair value with changes in fair value recognized in net income. The Company may elect to measure equity investments that do not have a readily determinable fair value at cost minus impairment, if any, plus or minus changes resulting from observable prices. The Company adopted ASU 2016-01 on October 1, 2018 and has elected to use the measurement alternative to measure its equity investments without readily determinable fair values. This guidance was applied prospectively and did not have a significant impact on the Company’s financial statements. For the fiscal year ended September 30, 2019, there were no observable price change events that were completed related to its equity investments without readily determinable fair values.
In August 2016, the FASB issued ASU 2016-15, Statement of Cash Flows: Classification of Certain Cash Receipts and Cash Payments (“ASU 2016-15”). This ASU provides specific guidance of how certain cash receipts and cash payments should be presented and classified in the statement of cash flows. ASU 2016-15 is effective for annual periods beginning after December 15, 2017, and interim periods within those years. The Company adopted ASU 2016-15 in the first quarter of fiscal 2019 and this adoption did not have a significant impact on the Company’s financial statements.
In October 2016, the FASB issued ASU 2016-16, Income Taxes: Intra-Entity Transfers of Assets Other Than Inventory (“ASU 2016-16”). This ASU requires the recognition of current and deferred income taxes for intra-entity asset transfers when the transaction occurs. ASU 2016-16 is effective for annual periods beginning after December 15, 2017, and interim periods within those years. The Company adopted ASU 2016-16 in the first quarter of fiscal 2019 and this adoption did not have a significant impact on the Company’s financial statements.
In January 2017, the FASB issued ASU 2017-01, Business Combinations (“ASU 2017-01”), to clarify the definition of a business, which establishes a process to determine when an integrated set of assets and activities can be deemed a business combination. The Company adopted ASU 2017-01 in the first quarter of fiscal 2019 and this adoption did not have a significant impact on the Company’s financial statements.
F-18
Table of Contents
In February 2018, FASB issued ASU 2018-02, Income Statement—Reporting Comprehensive Income (“ASU 2018-02”). This ASU allows a reclassification from accumulated other comprehensive income to accumulated deficit for stranded tax effects resulting from the Tax Act. ASU 2018-02 is effective for all entities for fiscal years beginning after December 15, 2018 and interim periods within those fiscal years. Early adoption is permitted, including adoption in any interim period. The Company adopted ASU 2018-02 in the first quarter of fiscal 2019 and this adoption did not have a significant impact on the Company’s financial statements.
Accounting Pronouncements Not Yet Adopted
In February 2016, the FASB issued ASU 2016-02, Leases (“ASU 2016-02”), which established a new ASC Topic 842 (“ASC 842”). This ASU establishes a right-of-use (“ROU”) model that requires a lessee to record a ROU asset and a lease liability on the balance sheet for all leases with terms longer than 12 months. Leases will be classified as either finance or operating, with classification affecting the pattern of expense recognition in the statement of operations. ASU 2016-02 will be effective for annual periods beginning after December 15, 2018, and interim periods within those years. Earlier adoption is permitted. In July 2018, the FASB issued ASU 2018-11, Leases – Targeted Improvements (“ASU 2018-11”), which allows for retrospective application with the recognition of a cumulative-effect adjustment to the opening balance of retained earnings in the period of adoption. Under this option, entities would not need to apply ASC 842 (along with its disclosure requirements) to the comparative prior periods presented.
The Company will adopt ASU 2016-02 as of October 1, 2019, using the optional transition method provided by ASU 2018-11. The Company is finalizing the evaluation of the adoption impact, but estimates the adoption of ASU 2016-02 will result in the recognition of ROU assets and lease liabilities of approximately $360 million upon adoption, primarily related to real estate leases. Additionally, the Company will include expanded disclosures related to the amount, timing and judgments of the Company’s accounting for leases.
Upon transition, the Company expects to elect the “package of three” practical expedient provided by ASC 842 and therefore will not (1) reassess whether any expired or existing contracts are or contain a lease, (2) reassess the lease classification for expired or existing leases and (3) reassess initial direct costs for any existing leases. Rather, the Company will retain the conclusions reached for these items under ASC 840.
In August 2017, the FASB issued ASU 2017-12, Targeted Improvements to Accounting for Hedging Activities (“ASU 2017-12”). This ASU improves certain aspects of the hedge accounting model including making more risk management strategies eligible for hedge accounting and simplifying the assessment of hedge effectiveness. ASU 2017-12 is effective for all annual periods beginning after December 15, 2018 and interim periods within those fiscal years. Early adoption is permitted and requires a prospective adoption with a cumulative-effect adjustment to accumulated deficit as of the beginning of the fiscal year of adoption for existing hedging relationships. The adoption of this standard is not expected to have a significant impact on the Company’s financial statements.
3. Revenue Recognition
For our operating segments, Recorded Music and Music Publishing, the Company accounts for a contract when it has legally enforceable rights and obligations and collectability of consideration is probable. The Company identifies the performance obligations and determines the transaction price associated with the contract, which is then allocated to each performance obligation, using management’s best estimate of standalone selling price for arrangements with multiple performance obligations. Revenue is recognized when, or as, control of the promised services or goods is transferred to the Company’s customers, and in an amount that reflects the consideration the Company is contractually due in exchange for those services or goods. An estimate of variable consideration is included in the transaction price if, in the Company’s judgment, it is probable that a significant future reversal of cumulative revenue under the contract will not occur. Certain of the Company’s arrangements include licenses of intellectual property with consideration in the form of sales- and usage-based royalties.
F-19
Table of Contents
Royalty revenue is recognized when the subsequent sale or usage occurs using the best estimates available of the amounts that will be received by the Company.
Disaggregation of Revenue
The Company’s revenue consists of the following categories, which aggregate into the segments – Recorded Music and Music Publishing:
| For the Fiscal Year Ended September 30, | ||||||||||||
| 2019 | 2018 | 2017 | ||||||||||
| (in millions) | ||||||||||||
| Revenue by Type |
||||||||||||
| Digital |
$ | 2,343 | $ | 2,019 | $ | 1,692 | ||||||
| Physical |
559 | 630 | 667 | |||||||||
|
|
|
|
|
|
|
|||||||
| Total Physical and Digital |
2,902 | 2,649 | 2,359 | |||||||||
| Artist services and expanded-rights |
629 | 389 | 385 | |||||||||
| Licensing |
309 | 322 | 276 | |||||||||
|
|
|
|
|
|
|
|||||||
| Total Recorded Music |
3,840 | 3,360 | 3,020 | |||||||||
| Performance |
183 | 212 | 197 | |||||||||
| Digital |
271 | 237 | 187 | |||||||||
| Mechanical |
55 | 72 | 65 | |||||||||
| Synchronization |
120 | 119 | 112 | |||||||||
| Other |
14 | 13 | 11 | |||||||||
|
|
|
|
|
|
|
|||||||
| Total Music Publishing |
643 | 653 | 572 | |||||||||
| Intersegment eliminations |
(8 | ) | (8 | ) | (16 | ) | ||||||
|
|
|
|
|
|
|
|||||||
| Total Revenues |
$ | 4,475 | $ | 4,005 | $ | 3,576 | ||||||
|
|
|
|
|
|
|
|||||||
| Revenue by Geographical Location |
||||||||||||
| U.S. Recorded Music |
$ | 1,656 | $ | 1,460 | $ | 1,329 | ||||||
| U.S. Music Publishing |
300 | 294 | 258 | |||||||||
|
|
|
|
|
|
|
|||||||
| Total U.S. |
1,956 | 1,754 | 1,587 | |||||||||
| International Recorded Music |
2,184 | 1,900 | 1,691 | |||||||||
| International Music Publishing |
343 | 359 | 314 | |||||||||
|
|
|
|
|
|
|
|||||||
| Total International |
2,527 | 2,259 | 2,005 | |||||||||
| Intersegment eliminations |
(8 | ) | (8 | ) | (16 | ) | ||||||
|
|
|
|
|
|
|
|||||||
| Total Revenues |
$ | 4,475 | $ | 4,005 | $ | 3,576 | ||||||
|
|
|
|
|
|
|
|||||||
Recorded Music
Recorded Music mainly involves selling, marketing, distribution and licensing of recorded music produced by the Company’s recording artists. Recorded Music revenues are derived from four main sources, which include digital, physical, artist services and expanded-rights and licensing.
Digital revenues are generated from the expanded universe of digital partners, including digital streaming services and download services. These licenses typically contain a single performance obligation, which is ongoing access to all intellectual property in an evolving content library, predicated on: (1) the business practice and contractual ability to remove specific content without a requirement to replace the content and without impact to minimum royalty guarantees and (2) the contracts not containing a specific listing of content subject to the license. Digital licensing contracts are generally long-term with consideration in the form of sales- and usage-based royalties that are typically received monthly. Certain contracts contain non-recoupable fixed fees or
F-20
Table of Contents
minimum guarantees, which are recoupable against royalties. Upon contract inception, the Company will assess whether a shortfall or breakage is expected (i.e., where the minimum guarantee will not be recouped through royalties) in order to determine timing of revenue recognition for the fixed fee or minimum guarantee.
For fixed fee and minimum guarantee contracts where breakage is expected, the total transaction price (fixed fee or minimum guarantee) is typically recognized on a straight-line basis or by other appropriate measures of progress over the contractual term. The Company updates its assessment of the transaction price each reporting period to see if anticipated royalty earnings exceed the minimum guarantee. For contracts where breakage is not expected, royalties are recognized as revenue as sales or usage occurs based upon the licensee’s usage reports and, when these reports are not available, revenue is based on historical data, industry information and other relevant trends.
Additionally, for certain licenses where the consideration is fixed and the intellectual property being licensed is static, revenue is recognized at the point in time when control of the licensed content is transferred to the customer.
Physical revenues are generated from the sale of physical products such as vinyl, CDs and DVDs. Revenues from the sale of physical Recorded Music products are recognized upon transfer of control to the customer, which typically occurs once the product has been shipped and the ability to direct use and obtain substantially all of the benefit from the asset have been transferred. In accordance with industry practice and as is customary in many territories, certain products, such as CDs and DVDs, are sold to customers with the right to return unsold items. Revenues from such sales are generally recognized upon shipment based on gross sales less a provision for future estimated returns.
Artist services and expanded-rights revenues are generated from artist services businesses and participations in expanded-rights associated with artists, including sponsorship, fan clubs, artist websites, merchandising, touring, concert promotion, ticketing and artist and brand management. Artist services and expanded-rights contracts are generally short term. Revenue is recognized as or when services are provided (e.g., at time of an artist’s event) assuming collectability is probable. In some cases, the Company is reliant on the artist to report revenue generating activities. For certain artist services and expanded-rights contracts, collectability is not considered probable until notification is received from the artist’s management.
Licensing revenues represent royalties or fees for the right to use sound recordings in combination with visual images such as in films or television programs, television commercials and video games. In certain territories, the Company may also receive royalties when sound recordings are performed publicly through broadcast of music on television, radio and cable and in public spaces such as shops, workplaces, restaurants, bars and clubs. Licensing contracts are generally short term. For fixed-fee contracts, revenue is recognized at the point in time when control of the licensed content is transferred to the customer. Royalty based contracts are recognized as the underlying sales or usage occurs.
Music Publishing
Music Publishing acts as a copyright owner and/or administrator of the musical compositions and generates revenues related to the exploitation of musical compositions (as opposed to recorded music). Music publishers generally receive royalties from the use of the musical compositions in public performances, digital and physical recordings and in combination with visual images. Music publishing revenues are derived from five main sources: mechanical, performance, synchronization, digital and other.
Performance revenues are received when the musical composition is performed publicly through broadcast of music on television, radio and cable, live performance at a concert or other venue (e.g., arena concerts and nightclubs) and performance of musical compositions in staged theatrical productions. Digital revenues are generated with respect to the musical compositions being embodied in recordings licensed to digital streaming
F-21
Table of Contents
services and digital download services and for digital performance. Mechanical revenues are generated with respect to the musical compositions embodied in recordings sold in any physical format or configuration such as vinyl, CDs and DVDs. Synchronization revenues represent the right to use the composition in combination with visual images such as in films or television programs, television commercials and video games as well as from other uses such as in toys or novelty items and merchandise. Other revenues represent earnings for use in printed sheet music and other uses. Digital and synchronization revenue recognition is similar for both Recorded Music and Music Publishing, therefore refer to the discussion within Recorded Music.
Included in these revenue streams, excluding synchronization and other, are licenses with performing rights organizations or collecting societies (e.g., ASCAP, BMI, SESAC and GEMA), which are long-term contracts containing a single performance obligation, which is ongoing access to all intellectual property in an evolving content library. The most common form of consideration for these contracts is sales- and usage-based royalties. The collecting societies submit usage reports, typically with payment for royalties due, often on a quarterly or biannual reporting period, in arears. Royalties are recognized as the sale or usage occurs based upon usage reports and, when these reports are not available, royalties are estimated based on historical data, such as recent royalties reported, company-specific information with respect to changes in repertoire, industry information and other relevant trends. Also included in these revenue streams are smaller, short-term contracts for specified content, which generally involve a fixed fee. For fixed-fee contracts, revenue is recognized at the point in time when control of the license is transferred to the customer.
The Company excludes from the measurement of transaction price all taxes assessed by governmental authorities that are both (i) imposed on and concurrent with a specific revenue-producing transaction and (ii) collected from customers.
Sales Returns and Uncollectible Accounts
In accordance with practice in the recorded music industry and as customary in many territories, certain physical revenue products (such as CDs and DVDs) are sold to customers with the right to return unsold items. Revenues from such sales are recognized when the products are shipped based on gross sales less a provision for future estimated returns.
In determining the estimate of physical product sales that will be returned, management analyzes vendor sales of product, historical return trends, current economic conditions, changes in customer demand and commercial acceptance of the Company’s products. Based on this information, management reserves a percentage of each dollar of physical product sales that provide the customer with the right of return and records an asset for the value of the returned goods and liability for the amounts expected to be refunded.
Similarly, management evaluates accounts receivables to determine if they will ultimately be collected. In performing this evaluation, significant judgments and estimates are involved, including an analysis of specific risks on a customer-by-customer basis for larger accounts and customers and a receivables aging analysis that determines the percent that has historically been uncollected by aged category. The time between the Company’s issuance of an invoice and payment due date is not significant; customer payments that are not collected in advance of the transfer of promised services or goods are generally due no later than 30 days from invoice date. Based on this information, management provides a reserve for the estimated amounts believed to be uncollectible.
Based on management’s analysis of sales returns, refund liabilities of $23 million and $28 million were established at September 30, 2019 and September 30, 2018, respectively.
Based on management’s analysis of uncollectible accounts, reserves of $17 million and $17 million were established at September 30, 2019 and September 30, 2018, respectively.
F-22
Table of Contents
Principal versus Agent Revenue Recognition
The Company reports revenue on a gross or net basis based on management’s assessment of whether the Company acts as a principal or agent in the transaction. The determination of whether the Company acts as a principal or an agent in a transaction is based on an evaluation of whether the Company controls the good or service before transfer to the customer. When the Company concludes that it controls the good or service before transfer to the customer, the Company is considered a principal in the transaction and records revenue on a gross basis. When the Company concludes that it does not control the good or service before transfer to the customer but arranges for another entity to provide the good or service, the Company acts as an agent and records revenue on a net basis in the amount it earns for its agency service.
In the normal course of business, the Company acts as an intermediary with respect to certain payments received from third parties. For example, the Company distributes music content on behalf of third-party record labels. Based on the above guidance, the Company records the distribution of content on behalf of third-party record labels on a gross basis, subject to the terms of the contract, as the Company controls the content before transfer to the customer. Conversely, recorded music compilations distributed by other record companies where the Company has a right to participate in the profits are recorded on a net basis.
Deferred Revenue
Deferred revenue principally relates to fixed fees and minimum guarantees received in advance of the Company’s performance or usage by the licensee. Reductions in deferred revenue are a result of the Company’s performance under the contract or usage by the licensee.
Deferred revenue increased $402 million during the twelve months ended September 30, 2019 related to cash received from customers for fixed fees and minimum guarantees in advance of performance, including amounts recognized in the period. Revenues of $159 million were recognized during the twelve months ended September 30, 2019 related to the balance of deferred revenue at October 1, 2018. There were no other significant changes to deferred revenue during the reporting period.
Performance Obligations
The Company recognized revenue of $51 million from performance obligations satisfied in previous periods for the twelve month period ended September 30, 2019.
Wholly and partially unsatisfied performance obligations represent future revenues not yet recorded under long-term intellectual property licensing contracts. Revenues expected to be recognized in the future related to performance obligations that are unsatisfied at September 30, 2019 are as follows (in millions):
| FY20 | FY21 | FY22 | Thereafter | Total | ||||||||||||||||
| (in millions) | ||||||||||||||||||||
| Remaining performance obligations |
$ | 142 | $ | 94 | $ | 7 | $ | — | $ | 243 | ||||||||||
|
|
|
|
|
|
|
|
|
|
|
|||||||||||
| Total |
$ | 142 | $ | 94 | $ | 7 | $ | — | $ | 243 | ||||||||||
|
|
|
|
|
|
|
|
|
|
|
|||||||||||
4. Acquisition of EMP
On October 10, 2018, Warner Music Group Germany Holding GmbH (“WMG Germany”), a limited liability company under the laws of Germany and an indirect subsidiary of Warner Music Group Corp., closed its previously announced acquisition (the “Acquisition”) of certain shares of E.M.P. Merchandising Handelsgesellschaft mbH, a limited liability company under the laws of Germany, all of the share capital of MIG Merchandising Investment GmbH, a limited liability company under the laws of Germany (“MIG”), certain shares of Large Popmarchandising BVBA, a limited liability company under the laws of Belgium (“Large”) and
F-23
Table of Contents
each of EMP Merchandising Handelsgesellschaft mbH and MIG’s direct and indirect subsidiaries (the “Subsidiaries” and, together with EMP Merchandising Handelsgesellschaft mbH, MIG and Large, “EMP”) from funds associated with Sycamore Partners, pursuant to the Sale and Purchase Agreement, dated as of September 11, 2018, by and between SP Merchandising Holding GmbH & Co. KG, a limited partnership under the laws of Germany, and WMG Germany (“Acquisition Agreement”). The cash consideration paid at closing of the Acquisition was approximately €166 million, which reflects an agreed enterprise value of EMP of approximately €155 million (equivalent to approximately $180 million), as adjusted for, among other items, net debt and estimates of working capital of EMP. The final purchase price paid was determined to be €165 million after finalization of purchase price adjustments, including working capital and other items.
The Acquisition was accounted for in accordance with ASC 805, using the acquisition method of accounting. The assets and liabilities of EMP, including identifiable intangible assets, have been measured at their fair value primarily using Level 3 inputs (see Note 17 for additional information on fair value inputs). Determining the fair value of the assets acquired and liabilities assumed requires judgment and involved the use of significant estimates and assumptions, including assumptions with respect to future cash inflows and outflows, discount rates, asset useful lives and market multiples, among other items. The use of different estimates and judgments could yield materially different results.
The excess of the purchase price, over the fair value of net assets acquired, including the amount assigned to identifiable intangible assets and deferred tax adjustments, has been recorded to goodwill. The resulting goodwill has been allocated to the Company’s Recorded Music reportable segment. The recognized goodwill will not be deductible for income tax purposes. Any impairment charges made in future periods associated with goodwill will not be tax deductible.
The table below presents (i) the Acquisition consideration as it relates to the acquisition of EMP by WMG Germany and (ii) the allocation of the purchase price to the estimated fair values of the assets acquired and liabilities assumed on the closing date of October 10, 2018 (in millions):
| Purchase Price |
€ | 155 | ||
| Working Capital |
10 | |||
|
|
|
|||
| Final Purchase Price |
€ | 165 | ||
| Foreign Currency Rate at October 10, 2018 |
1.15 | |||
| Final Purchase Price in U.S. dollars |
$ | 190 | ||
| Fair value of assets acquired and liabilities assumed |
||||
| Cash and equivalents |
$ | 7 | ||
| Accounts receivable, net |
3 | |||
| Inventories |
37 | |||
| Other current assets |
5 | |||
| Property plant and equipment |
32 | |||
| Intangible assets |
81 | |||
| Accounts payable |
(18 | ) | ||
| Other current liabilities |
(11 | ) | ||
| Deferred revenue |
(7 | ) | ||
| Deferred tax liabilities |
(25 | ) | ||
| Other noncurrent liabilities |
(3 | ) | ||
|
|
|
|||
| Fair value of assets acquired and liabilities assumed |
101 | |||
| Goodwill recorded |
89 | |||
|
|
|
|||
| Total purchase price allocated |
$ | 190 | ||
|
|
|
During fiscal 2019, the Company performed a preliminary allocation in the first and third quarters, which was finalized as of September 30, 2019. The acquisition accounting was based on final determinations of fair
F-24
Table of Contents
value and allocations of purchase price to the identifiable assets and liabilities acquired, including determination of the final working capital adjustment made pursuant to the mechanism set forth in the Acquisition Agreement.
Pro Forma Financial Information
The following unaudited pro forma information has been presented as if the Acquisition occurred on October 1, 2017. This information is based on historical results of operations, adjusted to give effect to pro forma events that are (i) directly attributable to the Acquisition; (ii) factually supportable; and (iii) expected to have a continuing impact on the Company’s combined results. The pro forma information as presented below is for informational purposes only and is not indicative of the results of operations that would have been achieved if the Acquisition had taken place at the beginning of fiscal 2018.
| Fiscal Year Ended September 30, 2019 |
Fiscal Year Ended September 30, 2018 |
|||||||
| (in millions) | ||||||||
| Revenue |
$ | 4,480 | $ | 4,239 | ||||
| Operating income |
356 | 215 | ||||||
| Net income attributable to Warner Music Group Corp. |
256 | 304 | ||||||
Actual results related to EMP included in the consolidated statement of operations for the twelve months ended September 30, 2019 relate to the transition period from October 10, 2018 to September 30, 2019 and consist of revenues of $240 million and operating income of $8 million.
5. Comprehensive (Loss) Income
Comprehensive (loss) income, which is reported in the accompanying consolidated statements of (deficit) equity, consists of net (loss) income and other gains and losses affecting equity that, under U.S. GAAP, are excluded from net (loss) income. For the Company, the components of other comprehensive loss primarily consist of foreign currency translation losses, minimum pension liabilities and deferred gains and losses on financial instruments designated as hedges under ASC 815, which include foreign exchange contracts. The following summary sets forth the changes in the components of accumulated other comprehensive loss, net of related tax benefit of $4 million:
| Foreign Currency Translation Loss |
Minimum Pension Liability Adjustment |
Deferred Gains (Losses) On Derivative Financial Instruments |
Accumulated Other Comprehensive Loss, net |
|||||||||||||
| (in millions) | ||||||||||||||||
| Balance at September 30, 2016 |
$ | (201 | ) | $ | (17 | ) | $ | — | $ | (218 | ) | |||||
| Other comprehensive income (a) |
30 | 8 | — | 38 | ||||||||||||
| Amounts reclassified from accumulated other comprehensive income |
— | (1 | ) | — | (1 | ) | ||||||||||
|
|
|
|
|
|
|
|
|
|||||||||
| Balance at September 30, 2017 |
$ | (171 | ) | $ | (10 | ) | $ | — | $ | (181 | ) | |||||
| Other comprehensive loss (a) |
(13 | ) | 1 | 3 | (9 | ) | ||||||||||
|
|
|
|
|
|
|
|
|
|||||||||
| Balance at September 30, 2018 |
$ | (184 | ) | $ | (9 | ) | $ | 3 | $ | (190 | ) | |||||
| Other comprehensive loss (a) |
(34 | ) | (5 | ) | (11 | ) | (50 | ) | ||||||||
|
|
|
|
|
|
|
|
|
|||||||||
| Balance at September 30, 2019 |
$ | (218 | ) | $ | (14 | ) | $ | (8 | ) | $ | (240 | ) | ||||
|
|
|
|
|
|
|
|
|
|||||||||
| (a) | Includes historical foreign currency translation related to certain intra-entity transactions that are no longer of a long-term investment nature of $0 million, $0 million and $(19) million during the fiscal years ended September 30, 2019, September 30, 2018 and September 30, 2017, respectively. |
F-25
Table of Contents
6. Property, Plant and Equipment
Property, plant and equipment consist of the following:
| September 30, 2019 |
September 30, 2018 |
|||||||
| (in millions) | ||||||||
| Land |
$ | 12 | $ | 11 | ||||
| Buildings and improvements |
186 | 109 | ||||||
| Furniture and fixtures |
25 | 11 | ||||||
| Computer hardware and software |
337 | 302 | ||||||
| Construction in progress |
20 | 42 | ||||||
| Machinery and equipment |
27 | 11 | ||||||
|
|
|
|
|
|||||
| Gross Property, Plant and Equipment |
$ | 607 | $ | 486 | ||||
| Less accumulated depreciation |
(307 | ) | (257 | ) | ||||
|
|
|
|
|
|||||
| Net Property, Plant and Equipment |
$ | 300 | $ | 229 | ||||
|
|
|
|
|
|||||
7. Goodwill and Intangible Assets
Goodwill
The following analysis details the changes in goodwill for each reportable segment:
| Recorded Music |
Music Publishing |
Total | ||||||||||
| (in millions) | ||||||||||||
| Balance at September 30, 2017 |
$ | 1,221 | $ | 464 | $ | 1,685 | ||||||
| Acquisitions |
12 | — | 12 | |||||||||
| Other adjustments |
(5 | ) | — | (5 | ) | |||||||
|
|
|
|
|
|
|
|||||||
| Balance at September 30, 2018 |
$ | 1,228 | $ | 464 | $ | 1,692 | ||||||
| Acquisitions |
89 | — | 89 | |||||||||
| Other adjustments |
(20 | ) | — | (20 | ) | |||||||
|
|
|
|
|
|
|
|||||||
| Balance at September 30, 2019 |
$ | 1,297 | $ | 464 | $ | 1,761 | ||||||
|
|
|
|
|
|
|
|||||||
The increase in goodwill during the fiscal year ended September 30, 2019 primarily relates to the EMP acquisition, which resulted in an increase in goodwill of $89 million. Please refer to Note 4 of our Consolidated Financial Statements for further discussion. The increase in goodwill during the fiscal year ended September 30, 2018 primarily relates to finalizing the purchase accounting allocation for the Spinnin’ Records acquisition, which resulted in an increase in goodwill of $10 million. The other adjustments during both the fiscal years ended September 30, 2019 and September 30, 2018 primarily represent foreign currency movements.
The Company performs its annual goodwill impairment test in accordance with ASC 350 during the fourth quarter of each fiscal year as of July 1. The Company may conduct an earlier review if events or circumstances occur that would suggest the carrying value of the Company’s goodwill may not be recoverable. The performance of the annual fiscal 2019 impairment analysis did not result in an impairment of the Company’s goodwill.
F-26
Table of Contents
Intangible Assets
Intangible assets consist of the following:
| Weighted- Average Useful Life |
September 30, 2019 |
September 30, 2018 |
||||||||||
| (in millions) | ||||||||||||
| Intangible assets subject to amortization: |
||||||||||||
| Recorded music catalog |
10 years | $ | 855 | $ | 870 | |||||||
| Music publishing copyrights |
26 years | 1,539 | 1,540 | |||||||||
| Artist and songwriter contracts |
13 years | 841 | 864 | |||||||||
| Trademarks |
18 years | 53 | 12 | |||||||||
| Other intangible assets |
7 years | 59 | 26 | |||||||||
|
|
|
|
|
|||||||||
| Total gross intangible assets subject to amortization |
3,347 | 3,312 | ||||||||||
| Accumulated amortization |
(1,624 | ) | (1,461 | ) | ||||||||
|
|
|
|
|
|||||||||
| Total net intangible assets subject to amortization |
1,723 | 1,851 | ||||||||||
| Intangible assets not subject to amortization: |
||||||||||||
| Trademarks and tradenames |
Indefinite | 151 | 154 | |||||||||
|
|
|
|
|
|||||||||
| Total net other intangible assets |
$ | 1,874 | $ | 2,005 | ||||||||
|
|
|
|
|
|||||||||
The Company performs its annual indefinite-lived intangible assets impairment test in accordance with ASC 350 during the fourth quarter of each fiscal year as of July 1. The Company may conduct an earlier review if events or circumstances occur that would suggest the carrying value of the Company’s indefinite-lived intangible assets may not be recoverable. The performance of the annual fiscal 2019 impairment analysis did not result in an impairment of the Company’s indefinite-lived intangible assets.
The intangible balances presented include the final purchase accounting allocations resulting from the acquisitions of EMP and Spinnin’ Records for the fiscal years ended September 30, 2019 and September 30, 2018, respectively.
Amortization
Based on the amount of intangible assets subject to amortization at September 30, 2019, the expected amortization for each of the next five fiscal years and thereafter are as follows:
| Fiscal Years Ended September 30, |
||||
| (in millions) | ||||
| 2020 |
$ | 182 | ||
| 2021 |
181 | |||
| 2022 |
173 | |||
| 2023 |
138 | |||
| 2024 |
107 | |||
| Thereafter |
942 | |||
|
|
|
|||
| $ | 1,723 | |||
|
|
|
|||
The life of all acquired intangible assets is evaluated based on the expected future cash flows associated with the asset. The expected amortization expense above reflects estimated useful lives assigned to the Company’s identifiable, finite-lived intangible assets primarily established in the accounting for the Merger and the PLG Acquisition.
F-27
Table of Contents
8. Debt
Debt Capitalization
Long-term debt, all of which was issued by Acquisition Corp., consists of the following:
| September 30, 2019 |
September 30, 2018 |
|||||||
| (in millions) | ||||||||
| Revolving Credit Facility (a) |
$ | — | $ | — | ||||
| Senior Term Loan Facility due 2023 (b) |
1,313 | 1,310 | ||||||
| 5.625% Senior Secured Notes due 2022 (c) |
— | 246 | ||||||
| 5.000% Senior Secured Notes due 2023 (d) |
298 | 297 | ||||||
| 4.125% Senior Secured Notes due 2024 (e) |
336 | 399 | ||||||
| 4.875% Senior Secured Notes due 2024 (f) |
218 | 247 | ||||||
| 3.625% Senior Secured Notes due 2026 (g) |
488 | — | ||||||
| 5.500% Senior Notes due 2026 (h) |
321 | 320 | ||||||
|
|
|
|
|
|||||
| Total long-term debt, including the current portion (i) |
$ | 2,974 | $ | 2,819 | ||||
|
|
|
|
|
|||||
| (a) | Reflects $180 million of commitments under the Revolving Credit Facility, less letters of credit outstanding of approximately $13 million and $8 million at September 30, 2019 and September 30, 2018, respectively. There were no loans outstanding under the Revolving Credit Facility at September 30, 2019 or September 30, 2018. |
| (b) | Principal amount of $1.326 billion less unamortized discount of $3 million and $4 million and unamortized deferred financing costs of $10 million and $12 million at September 30, 2019 and September 30, 2018, respectively. |
| (c) | On May 16, 2019, Acquisition Corp. redeemed the remaining $221 million of its outstanding 5.625% Senior Notes due 2022. The Company recorded a loss on extinguishment of debt of approximately $4 million as a result of the debt redemption, which represents the premium paid on early redemption and unamortized deferred financing costs. |
| (d) | Principal amount of $300 million less unamortized deferred financing costs of $2 million and $3 million at September 30, 2019 and September 30, 2018, respectively. |
| (e) | Face amount of €311 million and €345 million at September 30, 2019 and September 30, 2018, respectively. Above amounts represent the dollar equivalent of such note at September 30, 2019 and September 30, 2018. Principal amount of $340 million and $402 million less unamortized deferred financing costs of $4 million and $3 million at September 30, 2019 and September 30, 2018, respectively. |
| (f) | Principal amount of $220 million and $250 million less unamortized deferred financing costs of $2 million and $3 million at September 30, 2019 and September 30, 2018, respectively. |
| (g) | Face amount of €445 million at September 30, 2019. Above amounts represent the dollar equivalent of such note at September 30, 2019. Principal amount of $487 million, an additional issuance premium of $8 million, less unamortized deferred financing costs of $7 million at September 30, 2019. |
| (h) | Principal amount of $325 million less unamortized deferred financing costs of $4 million and $5 million at September 30, 2019 and September 30, 2018, respectively. |
| (i) | Principal amount of debt of $2.998 billion and $2.851 billion, an additional insurance premium of $8 million and nil, less unamortized discount of $3 million and $4 million and unamortized deferred financing costs of $29 million and $28 million at September 30, 2019 and September 30, 2018, respectively. |
December 2017 Senior Term Loan Credit Agreement Amendment
On December 6, 2017, Acquisition Corp. entered into an amendment (the “December 2017 Senior Term Loan Credit Agreement Amendment”) to the Senior Term Loan Credit Agreement, dated November 1, 2012,
F-28
Table of Contents
among Acquisition Corp., the guarantors party thereto, the lenders party thereto and Credit Suisse AG, as administrative agent, governing Acquisition Corp.’s senior secured term loan facility with Credit Suisse AG, as administrative agent, and the other financial institutions and lenders from time to time party thereto, to, among other things, reduce the pricing terms of its outstanding term loans, change certain incurrence thresholds governing the ability to incur debt and liens, change certain EBITDA add-backs and increase the thresholds above which the excess cash flow sweep is triggered. The Company recorded a loss on extinguishment of debt of approximately $1 million, which represented the discount and unamortized deferred financing costs related to the prior tranche of debt of the lenders that was replaced.
New Revolving Credit Agreement
On January 31, 2018, the Company entered into a new revolving credit agreement (the “Revolving Credit Agreement”) for its Revolving Credit Facility, and terminated its existing revolving credit agreement (the “Old Revolving Credit Agreement”). The Revolving Credit Agreement differs from the Old Revolving Credit Agreement in that it, among other things, reduces the interest rate margin applicable to the loans, extends the maturity date thereunder, provides for the option to increase the commitments under the Company’s then existing revolving credit agreement, provides for greater flexibility to amend and extend the Company’s then existing revolving credit agreement and create additional tranches thereunder, provides for greater flexibility over future amendments, increases the springing financial maintenance covenant to 4.75:1.00 and provides that the covenant shall not be tested unless at the end of a fiscal quarter the outstanding amount of loans and drawings under letters of credit which have not been reimbursed exceeds $54 million and aligns the other negative covenants with those of the Senior Term Loan Credit Agreement. References to “Revolving Credit Facility” below in this Note 8 are to our new revolving credit facility.
March 2018 Senior Term Loan Credit Agreement Amendment
On March 14, 2018, Acquisition Corp. incurred $320 million of supplemental term loans (the “Supplemental Term Loans”) pursuant to an increase supplement (the “March 2018 Senior Term Loan Credit Agreement Supplement”) to the Senior Term Loan Credit Agreement, dated November 1, 2012, among Acquisition Corp., the guarantors party thereto, the lenders party thereto and Credit Suisse AG, as administrative agent, governing Acquisition Corp.’s senior secured term loan facility with Credit Suisse AG, as administrative agent, and the other financial institutions and lenders from time to time party thereto (as amended, the “Senior Term Loan Credit Agreement”). The principal amount outstanding under the Senior Term Loan Credit Agreement including the Supplemental Term Loans is $1.326 billion.
Notes Offering
On March 14, 2018, Acquisition Corp. issued $325 million in aggregate principal amount of its 5.500% Senior Notes due 2026. Acquisition Corp. used the net proceeds to pay the consideration in the tender offer for its 6.750% Senior Notes due 2022 (the “6.750% Senior Notes”) and to redeem the remaining 6.750% Senior Notes as described below.
Tender Offer and Notes Redemption
On March 14, 2018, Acquisition Corp. accepted for purchase in connection with the tender offer for the 6.750% Senior Notes that had been validly tendered and not validly withdrawn at or prior to 5:00 p.m., New York City time on March 13, 2018 thereby reducing the aggregate principal amount of the 6.750% Senior Notes by $523 million. Acquisition Corp. then issued a notice of redemption on March 14, 2018 with respect to the remaining $112 million of 6.750% Senior Notes outstanding that were not accepted for payment pursuant to the tender offer. Following payment of the 6.750% Senior Notes tendered at or prior to the expiration time, Acquisition Corp. deposited with the Trustee funds of $119 million to satisfy all obligations under the applicable indenture governing the 6.750% Senior Notes, including call premiums and interest through the date of
F-29
Table of Contents
redemption on April 15, 2018, for the remaining 6.750% Senior Notes not accepted for purchase in the tender offer. On April 15, 2018, Acquisition Corp. redeemed the remaining outstanding 6.750% Senior Notes. The Company recorded a loss on extinguishment of debt in connection with the tender offer of approximately $23 million as a result of the partial debt redemption, which represents the premium paid on early redemption and unamortized deferred financing costs in March 2018. The Company incurred an additional loss on extinguishment of approximately $5 million in April 2018 related to the redemption on the remaining 6.750% Senior Notes, which represents the premium paid on early redemption and unamortized deferred financing costs.
June 2018 Senior Term Loan Credit Agreement Amendment
On June 7, 2018, Acquisition Corp. entered into an amendment (the “June 2018 Senior Term Loan Credit Agreement Amendment”) to the Senior Term Loan Credit Agreement, dated November 1, 2012, among Acquisition Corp., the guarantors party thereto, the lenders party thereto and Credit Suisse AG, as administrative agent, governing Acquisition Corp.’s senior secured term loan facility with Credit Suisse AG, as administrative agent, and the other financial institutions and lenders from time to time party thereto, to, among other things, reduce the pricing terms of its outstanding term loans, change certain incurrence thresholds governing the ability to incur debt and liens and exclude from the definition of “Senior Secured Indebtedness” certain liens that have junior lien priority on the collateral in relation to the outstanding term loans and the relevant guarantees, as applicable. The Company recorded a loss on extinguishment of debt of approximately $2 million, which represented the discount and unamortized deferred financing costs related to the prior tranche of debt of the lenders that was replaced.
3.625% Senior Secured Notes Offerings
On October 9, 2018, Acquisition Corp. issued and sold €250 million in aggregate principal amount of 3.625% Senior Secured Notes due 2026 (the “3.625% Secured Notes”). Net proceeds of the offering were used to pay the purchase price of the acquisition of EMP, to redeem €34.5 million of the 4.125% Secured Notes (as described below), purchase $30 million of the Company’s 4.875% Senior Secured Notes (as described above) on the open market and to redeem $26.55 million of the 5.625% Senior Secured Notes (as described below).
On April 30, 2019, Acquisition Corp. issued and sold €195 million in aggregate principal amount of additional 3.625% Senior Secured Notes due 2026 (the “Additional Notes”). The Additional Notes and the 3.625% Secured Notes were treated as the same series for all purposes under the indenture that governs the 3.625% Secured Notes and the Additional Notes. Net proceeds of the offering were used to redeem all of the 5.625% Secured Notes due 2022.
Partial Redemption of 4.125% Senior Secured Notes
On October 12, 2018, Acquisition Corp. redeemed €34.5 million aggregate principal amount of its 4.125% Senior Secured Notes due 2024 (the “4.125% Secured Notes”) using a portion of the proceeds from the offering of the 3.625% Secured Notes described above. The redemption price for the 4.125% Secured Notes was approximately €36.17 million, equivalent to 103% of the principal amount of the 4.125% Secured Notes, plus accrued but unpaid interest thereon to, but excluding, the redemption date, which was October 12, 2018. Following the partial redemption of the 4.125% Secured Notes, €310.5 million of the 4.125% Secured Notes remain outstanding. The Company recorded a loss on extinguishment of debt of approximately $2 million, which represents the premium paid on early redemption and unamortized deferred financing costs related to the partial redemption of this note.
Open Market Purchase
On October 9, 2018, Acquisition Corp. purchased, in the open market, $30 million aggregate principal amount of its outstanding 4.875% Senior Secured Notes due 2024 (the “4.875% Secured Notes”). The acquired
F-30
Table of Contents
notes were subsequently retired. Following retirement of the acquired notes, $220 million of the 4.875% Secured Notes remain outstanding. The Company recorded a loss on extinguishment of debt of less than $1 million, which represents the unamortized deferred financing costs related to the open market purchase.
Redemption of 5.625% Senior Secured Notes
On November 5, 2018, Acquisition Corp. redeemed $26.55 million aggregate principal amount of its 5.625% Senior Secured Notes due 2022 (the “5.625% Secured Notes”). The redemption price for the 5.625% Secured Notes was approximately $27.38 million, equivalent to 102.813% of the principal amount of the 5.625% Secured Notes, plus accrued but unpaid interest thereon to, but excluding, the redemption date, which was November 5, 2018. Following the partial redemption of the 5.625% Secured Notes, $220.95 million of the 5.625% Secured Notes remain outstanding. The Company recorded a loss on extinguishment of debt of approximately $1 million, which represents the premium paid on early redemption and unamortized deferred financing costs related to the partial redemption of this note.
On April 16, 2019, the Company issued a conditional notice of redemption for all of its 5.625% Secured Notes due 2022 currently outstanding. Settlement of the called 5.625% Secured Notes occurred on May 16, 2019. The Company recorded a loss on extinguishment of debt of approximately $4 million, which represents the premium paid on early redemption and unamortized deferred financing costs.
Interest Rates
The loans under the Revolving Credit Facility bear interest at Acquisition Corp.’s election at a rate equal to (i) the rate for deposits in the borrowing currency in the London interbank market (adjusted for maximum reserves) for the applicable interest period (“Revolving LIBOR”) subject to a zero floor, plus 1.75% per annum or (ii) the base rate, which is the highest of (x) the corporate base rate established by the administrative agent from time to time, (y) 0.50% in excess of the overnight federal funds rate and (z) the one-month Revolving LIBOR plus 1.0% per annum, plus, in each case, 0.75% per annum. If there is a payment default at any time, then the interest rate applicable to overdue principal will be the rate otherwise applicable to such loan plus 2.0% per annum. Default interest will also be payable on other overdue amounts at a rate of 2.0% per annum above the amount that would apply to an alternative base rate loan.
The loans under the Senior Term Loan Facility bear interest at Acquisition Corp.’s election at a rate equal to (i) the rate for deposits in U.S. dollars in the London interbank market (adjusted for maximum reserves) for the applicable interest period (“Term Loan LIBOR”) subject to a zero floor, plus 2.125% per annum or (ii) the base rate, which is the highest of (x) the corporate base rate established by the administrative agent as its prime rate in effect at its principal office in New York City from time to time, (y) 0.50% in excess of the overnight federal funds rate and (z) one-month Term Loan LIBOR, plus 1.00% per annum, plus, in each case, 1.125% per annum. If there is a payment default at any time, then the interest rate applicable to overdue principal and interest will be the rate otherwise applicable to such loan plus 2.0% per annum. Default interest will also be payable on other overdue amounts at a rate of 2.0% per annum above the amount that would apply to an alternative base rate loan.
The Company has entered into, and in the future may enter into, interest rate swaps to manage interest rate risk. Please refer to Note 14 of our Consolidated Financial Statements for further discussion.
Maturity of Senior Term Loan Facility
The loans outstanding under the Senior Term Loan Facility mature on November 1, 2023.
Maturity of Revolving Credit Facility
The maturity date of the Revolving Credit Facility is January 31, 2023.
F-31
Table of Contents
Maturities of Senior Notes and Senior Secured Notes
As of September 30, 2019, there are no scheduled maturities of notes until 2023, when $300 million is scheduled to mature. Thereafter, $1.372 billion is scheduled to mature.
Interest Expense, net
Total interest expense, net, was $142 million, $138 million and $149 million for the fiscal years ended September 30, 2019, September 30, 2018 and September 30, 2017, respectively. The weighted-average interest rate of the Company’s total debt was 4.3% at September 30, 2019, 4.7% at September 30, 2018 and 4.9% at September 30, 2017.
9. Income Taxes
On December 22, 2017, the U.S. government enacted comprehensive tax legislation commonly referred to as the Tax Cuts and Jobs Act (“Tax Act”). The Tax Act contains significant revisions to U.S. federal corporate income tax provisions, including, but not limited to, a reduction of the U.S. federal corporate statutory tax rate from 35% to 21%, a one-time transition tax on accumulated foreign earnings, an income inclusion of global intangible low-taxed income (“GILTI”), a deduction against foreign-derived intangible income (“FDII”) and a new minimum tax, the base erosion anti-abuse tax (“BEAT”). In accordance with ASC 740, the Company recorded the effects of the Tax Act during the three months ended December 31, 2017.
The reduction in U.S. federal corporate statutory tax rate from 35% to 21% was effective January 1, 2018. The Tax Act requires companies with a fiscal year that begins before and ends after the effective date of the rate change to calculate a blended tax rate based on the pro rata number of days in the fiscal year before and after the effective date. As a result, for the fiscal year ending September 30, 2018, the Company’s U.S. federal statutory income tax rate was 24.5%. For the fiscal year ending September 30, 2019, the Company was subject to the U.S. federal corporate statutory tax rate of 21%.
The reduction in the U.S. federal corporate statutory tax rate required the Company to adjust its U.S. deferred tax assets and liabilities using the newly enacted tax rate of 21%. As a result, the Company recorded a U.S. income tax expense of $23 million for the reduction of its net U.S. deferred tax assets for the fiscal year ended September 30, 2018.
The Company has not recorded any income tax liability related to the one-time transition tax on accumulated foreign earnings (“Transition Tax”) due to an overall deficit in accumulated foreign earnings. GILTI, FDII and BEAT are effective for the Company’s fiscal year ending September 30, 2019. The Company has elected to recognize the GILTI impact in the specific period in which it occurs.
The domestic and foreign pretax income (loss) from continuing operations is as follows:
| Fiscal Year Ended September 30, 2019 |
Fiscal Year Ended September 30, 2018 |
Fiscal Year Ended September 30, 2017 |
||||||||||
| (in millions) | ||||||||||||
| Domestic |
$ | 84 | $ | 347 | $ | (37 | ) | |||||
| Foreign |
183 | 95 | 35 | |||||||||
|
|
|
|
|
|
|
|||||||
| Total |
$ | 267 | $ | 442 | $ | (2 | ) | |||||
|
|
|
|
|
|
|
|||||||
F-32
Table of Contents
Current and deferred income tax expense (benefit) provided are as follows:
| Fiscal Year Ended September 30, 2019 |
Fiscal Year Ended September 30, 2018 |
Fiscal Year Ended September 30, 2017 |
||||||||||
| (in millions) | ||||||||||||
| Federal: |
||||||||||||
| Deferred |
(49 | ) | 91 | (169 | ) | |||||||
| Foreign: |
||||||||||||
| Current (a) |
74 | 58 | 41 | |||||||||
| Deferred |
(18 | ) | (26 | ) | (12 | ) | ||||||
| U.S. State: |
||||||||||||
| Current |
3 | 6 | 2 | |||||||||
| Deferred |
(1 | ) | 1 | (13 | ) | |||||||
|
|
|
|
|
|
|
|||||||
| Total |
$ | 9 | $ | 130 | $ | (151 | ) | |||||
|
|
|
|
|
|
|
|||||||
| (a) | Includes withholding taxes of $17 million, $15 million and $13 million for the fiscal years ended September 30, 2019, September 30, 2018 and September 30, 2017, respectively. |
The differences between the U.S. federal statutory income tax rate of 21.0%, 24.5% and 35.0% for the fiscal years ended September 30, 2019, September 30, 2018 and September 30, 2017, respectively, and income taxes provided are as follows:
| Fiscal Year Ended September 30, 2019 |
Fiscal Year Ended September 30, 2018 |
Fiscal Year Ended September 30, 2017 |
||||||||||
| (in millions) | ||||||||||||
| Taxes on income at the U.S. federal statutory rate |
$ | 56 | $ | 108 | $ | (1 | ) | |||||
| U.S. state and local taxes |
2 | 7 | 3 | |||||||||
| Foreign income taxed at different rates, including withholding taxes |
16 | 19 | 11 | |||||||||
| Increase in valuation allowance |
1 | 4 | 18 | |||||||||
| Release of valuation allowance |
(65 | ) | (14 | ) | (134 | ) | ||||||
| Change in tax rates |
(4 | ) | 23 | (1 | ) | |||||||
| Impact of GILTI and FDII |
(4 | ) | — | — | ||||||||
| Intergroup transfer |
— | (30 | ) | — | ||||||||
| Foreign currency losses on intra-entity loans |
— | — | (59 | ) | ||||||||
| Non-deductible long term incentive plan |
6 | 8 | 10 | |||||||||
| Other |
1 | 5 | 2 | |||||||||
|
|
|
|
|
|
|
|||||||
| Income tax expense (benefit) |
$ | 9 | $ | 130 | $ | (151 | ) | |||||
|
|
|
|
|
|
|
|||||||
During the fiscal year ended September 30, 2019, the Company recognized a U.S. tax benefit of $59 million related to the release of a U.S. deferred tax valuation allowance. During the fiscal year ended September 30, 2018, the Company recognized a U.S. tax expense of $23 million related to the reduction of net U.S. deferred tax assets as a result of the Tax Act. In addition, the Company recognized a net tax benefit of $30 million related to a prior-year intergroup transfer. During the fiscal year ended September 30, 2017, the Company released $125 million of the U.S. valuation allowance related to U.S. tax attributes and recognized a U.S. tax benefit of $59 million related to foreign currency losses on intra-entity loans. The foreign currency loss was previously reported in accumulated other comprehensive loss as the intra-entity loans were previously considered long-term in nature.
F-33
Table of Contents
For the fiscal years ended September 30, 2019 and September 30, 2018, the Company incurred losses in certain foreign territories and has offset the tax benefit associated with these losses with a valuation allowance as the Company has determined that it is more likely than not that these losses will not be utilized. For the fiscal year ended September 30, 2019, the Company released $59 million of the U.S. valuation allowance related to foreign tax credit carryforwards. Significant components of the Company’s net deferred tax liabilities are summarized below:
| September 30, 2019 |
September 30, 2018 |
|||||||
| (in millions) | ||||||||
| Deferred tax assets: |
||||||||
| Allowances and reserves |
$ | 27 | $ | 26 | ||||
| Employee benefits and compensation |
79 | 86 | ||||||
| Other accruals |
17 | 56 | ||||||
| Tax attribute carryforwards |
203 | 314 | ||||||
| Other |
3 | 4 | ||||||
|
|
|
|
|
|||||
| Total deferred tax assets |
329 | 486 | ||||||
| Valuation allowance |
(91 | ) | (206 | ) | ||||
|
|
|
|
|
|||||
| Net deferred tax assets |
238 | 280 | ||||||
|
|
|
|
|
|||||
| Deferred tax liabilities: |
||||||||
| Intangible assets |
(372 | ) | (434 | ) | ||||
|
|
|
|
|
|||||
| Total deferred tax liabilities |
(372 | ) | (434 | ) | ||||
|
|
|
|
|
|||||
| Net deferred tax liabilities |
$ | (134 | ) | $ | (154 | ) | ||
|
|
|
|
|
|||||
During the three months ended September 30, 2019, the Company concluded that the positive evidence relating to the utilization of foreign tax credits outweighs the negative evidence with respect to a portion of the valuation allowance relating to its foreign tax credit carryovers. This positive evidence includes the utilization of the remaining net operating loss carryforward during the fiscal year ended September 30, 2019, the utilization of current year and carryforward foreign tax credits for the first time during the fiscal year ended September 30, 2019, projections of sufficient future taxable income and foreign source income and the reversal of future taxable temporary differences. As a result, the Company concluded that it is more likely than not that a substantial portion of the Company’s deferred tax assets relating to foreign tax credit carryforwards will be realized. Consequently, the Company released $59 million of its $133 million valuation allowance at September 30, 2018 relating to such deferred tax assets and recognized a corresponding U.S. tax benefit of $59 million during the quarter ended September 30, 2019.
Proposed regulations issued by the Internal Revenue Service in November 2018 may result in an increase in the amount of foreign tax credit carryforwards that are more likely than not to be realized and thus result in a further release of the Company’s valuation allowance for foreign tax credit carryforwards and a corresponding U.S. tax benefit in the period in which such regulations are enacted.
Of the valuation allowance of $91 million at September 30, 2019, $49 million relates to U.S. tax attributes, of which $33 million relates to foreign tax credit carryforwards, $12 million relates to U.S. state net operating loss carryforwards and $4 million relates to outside basis differences in investments.
At September 30, 2019, the Company has no remaining U.S. federal tax net operating loss carryforwards. The Company also has tax net operating loss carryforwards, with no expiration date, in the U.K., France and Spain of $11 million, $88 million and $32 million, respectively, and other tax net operating loss carryforwards in state, local and foreign jurisdictions that expire in various periods. In addition, the Company has foreign tax credit carryforwards for U.S. tax purposes of $120 million. The U.S. foreign tax credits will begin to expire in fiscal year 2020.
F-34
Table of Contents
Deferred income taxes have not been recorded on indefinitely reinvested earnings of certain foreign subsidiaries of approximately $206 million at September 30, 2019. Distribution of these earnings may result in foreign withholding taxes and U.S. state taxes. However, variables existing if and when remittance occurs make it impracticable to estimate the amount of the ultimate tax liability, if any, on these accumulated foreign earnings.
The Company classifies interest and penalties related to uncertain tax position as a component of income tax expense. As of September 30, 2019 and September 30, 2018, the Company had accrued $3 million and $2 million of interest and penalties, respectively.
A reconciliation of the beginning and ending amount of unrecognized tax benefits, including interest and penalties, are as follows (in millions):
| Balance at September 30, 2016 |
$ | 30 | ||
|
|
|
|||
| Additions for current year tax positions |
2 | |||
| Additions for prior year tax positions |
1 | |||
| Subtractions for prior year tax positions |
(14 | ) | ||
|
|
|
|||
| Balance at September 30, 2017 |
$ | 19 | ||
|
|
|
|||
| Additions for current year tax positions |
3 | |||
| Additions for prior year tax positions |
3 | |||
| Subtractions for prior year tax positions |
(7 | ) | ||
|
|
|
|||
| Balance at September 30, 2018 |
$ | 18 | ||
|
|
|
|||
| Additions for prior year tax positions |
1 | |||
| Subtractions for prior year tax positions |
(7 | ) | ||
|
|
|
|||
| Balance at September 30, 2019 |
$ | 12 | ||
|
|
|
Included in the total unrecognized tax benefits at September 30, 2019 and September 30, 2018 are $12 million and $18 million, respectively, that if recognized, would reduce the effective income tax rate. The Company’s gross unrecognized tax benefits decreased during the fiscal year ended September 30, 2019 by $7 million primarily due to a tax settlement in Germany and statute lapses. The Company has determined that is reasonably possible that its existing reserve for uncertain tax positions as of September 30, 2019 could decrease by up to approximately $1 million related to various ongoing audits and settlement discussions in various foreign jurisdictions.
The Company and its subsidiaries file income tax returns in the U.S. and various foreign jurisdictions. The Company has completed tax audits in the U.S. for tax years ended through September 30, 2013, in the U.K. for the tax years ended through September 30, 2016, in Canada for tax years ended through September 30, 2013, in Germany for the tax years ended through September 30, 2009 and in Japan for the tax years ended through September 30, 2012. The Company is at various stages in the tax audit process in certain foreign and local jurisdictions.
10. Employee Benefit Plans
Certain international employees, such as those in Germany and Japan, participate in locally sponsored defined benefit plans, which are not considered to be material either individually or in the aggregate and have a combined projected benefit obligation of approximately $82 million and $73 million as of September 30, 2019 and September 30, 2018, respectively. Pension benefits under the plans are based on formulas that reflect the employees’ years of service and compensation levels during their employment period. The Company had unfunded pension liabilities relating to these plans of approximately $56 million and $50 million recorded in its balance sheets as of September 30, 2019 and September 30, 2018, respectively. The Company uses a September 30 measurement date for its plans. For each of the fiscal years ended September 30, 2019, September 30, 2018 and September 30, 2017, pension expense amounted to $4 million.
F-35
Table of Contents
Certain employees also participate in defined contribution plans. The Company’s contributions to the defined contribution plans are based upon a percentage of the employees’ elected contributions. The Company’s defined contribution plan expense amounted to approximately $6 million for the fiscal year ended September 30, 2019, $5 million for the fiscal year ended September 30, 2018 and $5 million for the fiscal year ended September 30, 2017.
11. Share-Based Compensation Plans
Effective January 1, 2013, eligible individuals were invited to participate in the Senior Management Free Cash Flow Plan (as amended, the “Plan”). Eligible individuals include any employee, consultant or officer of the Company or any of its affiliates, who is selected by the Company’s Compensation Committee to participate in the Plan. In 2017, the Company’s Compensation Committee invited two additional employees to participate in the Plan. Under the Plan, participants are allocated a specific portion of the Company’s free cash flow to use to purchase the equivalent of Company stock through the acquisition of deferred equity units. Participants also receive a grant of profit interests in a purposely established LLC holding company (the “LLC”) that represent an economic entitlement to future appreciation over an equivalent number of shares of Company stock (“matching units”). The Company’s board of directors authorized the issuance of up to 39,225,429.54 shares of the Company’s common stock pursuant to the Plan, 19,612,714.77 in respect of deferred equity units and 19,612,714.77 in respect of matching units, as adjusted in accordance with the Plan. The LLC currently owns approximately 28,685,481 issued and outstanding shares. Each deferred equity unit is equivalent to a share of Company stock. The Company credits units to active participants each Plan year at the time that annual free cash flow bonuses for such Plan year are determined (although certain participants have already received their complete allocations) and may grant unallocated units under the Plan to certain members of current or future management. At the time that annual free cash flow bonuses for such Plan year are determined, a participant is credited a number of deferred equity units based on their respective allocation divided by the grant date intrinsic value and an equal number of the related matching units is vested. The redemption price of the deferred equity units equals the fair market value of a share of the Company’s stock on the date of the settlement and the redemption price for the matching units equals the excess, if any, of the then fair market value of one Company share over the grant date intrinsic value of one share.
The Company accounts for share-based payments as required by ASC 718. ASC 718 requires all share-based payments to employees to be recognized as compensation expense. Under the recognition provision of ASC 718, liability classified share-based compensation costs are measured each reporting date until settlement. The Company’s policy is to measure share-based compensation costs to employees using the intrinsic value method instead of fair value as it is not practical to estimate the volatility of its share price on the grant date.
The intrinsic value method utilized by the Company is based on the estimated fair value of equity divided by the number of shares outstanding to determine a price per share. The Company’s estimated fair value of equity is derived from a discounted cash flow model with adjustments for non-operating assets, less the estimated fair value of debt.
For accounting purposes, the grant date was established at the point the Company and the participant reached a mutual understanding of the key terms and conditions, in this case the date at which the participant accepted the invitation to participate in the Plan. For accounting purposes, deferred equity units are deemed to generally vest between one and seven years and matching equity units granted under the Plan are deemed to vest two years after the allocation to the participant’s account. The deferred and matching equity units have cash settlement dates that began in December 2018. Upon the scheduled settlement in December 2018, the Company settled 209,773.90 deferred equity units, including special deferred equity units, in cash totaling approximately $1 million, 4,127,959.63 in Company shares (which were contributed to the LLC in exchange for Class A units of the LLC) with an estimated value of $26 million and 217,312.42 matching equity units in cash totaling approximately $1 million. The deferred units will be settled at the participant’s election for cash equal to the fair market value of one company share or a company share. The matching units will be settled
F-36
Table of Contents
for cash equal to the redemption price or company shares of equivalent value. At the end of the applicable redemption period, all outstanding units become mandatorily redeemable at the then redemption price. Due to this mandatory redemption clause, the Company has classified the awards under the Plan as liability awards. As of September 30, 2019, total liabilities for the vested portion of the plan is $211 million, of which $108 million is eligible for redemption in fiscal 2020 and, therefore a current liability. Dividend distributions, if any, are also paid out on vested deferred equity units and are calculated on the same basis as the Company’s common shares. The Company has applied a graded (tranche-by-tranche) attribution method and expenses share-based compensation on an accelerated basis over the vesting period of the share award.
The following is a summary of the Company’s share awards:
| Deferred Equity Units |
Matching Equity Units |
Deferred Equity Units Weighted- Average Intrinsic Value |
Matching Equity Units Weighted- Average Intrinsic Value |
Deferred Equity Units Weighted- Average Grant- Date Intrinsic Value |
Matching Equity Units Weighted- Average Grant- Date Intrinsic Value |
|||||||||||||||||||
| Unvested units at September 30, 2017 |
6,204,154 | 17,180,734 | $ | 5.07 | $ | 2.33 | $ | 2.93 | $ | — | ||||||||||||||
| Granted |
— | — | — | — | — | — | ||||||||||||||||||
| Vested |
(3,340,698 | ) | (4,295,184 | ) | 6.37 | 4.06 | 2.79 | — | ||||||||||||||||
| Forfeited |
— | — | — | — | — | — | ||||||||||||||||||
|
|
|
|
|
|
|
|
|
|
|
|
|
|||||||||||||
| Unvested units at September 30, 2018 |
2,863,456 | 12,885,551 | $ | 6.37 | $ | 3.50 | $ | 3.12 | $ | — | ||||||||||||||
|
|
|
|
|
|
|
|
|
|
|
|
|
|||||||||||||
| Granted |
— | — | — | — | — | — | ||||||||||||||||||
| Vested |
(962,709 | ) | (6,204,154 | ) | 7.71 | 5.10 | 3.09 | — | ||||||||||||||||
| Forfeited |
— | — | — | — | — | — | ||||||||||||||||||
|
|
|
|
|
|
|
|
|
|
|
|
|
|||||||||||||
| Unvested units at September 30, 2019 |
1,900,747 | 6,681,397 | $ | 7.71 | $ | 4.60 | $ | 3.13 | $ | — | ||||||||||||||
|
|
|
|
|
|
|
|
|
|
|
|
|
|||||||||||||
The weighted-average grant date intrinsic value of deferred equity unit awards for the fiscal year ended September 30, 2019 was $3.13. The fair value of these deferred equity units at September 30, 2019 was $7.71. The weighted-average grant date intrinsic value of deferred equity unit awards for the fiscal year ended September 30, 2018 was $3.12. The fair value of these deferred equity units at September 30, 2018 was $6.37. The weighted-average grant date intrinsic value of deferred equity unit awards for the fiscal year ended September 30, 2017 was $2.93. The fair value of these deferred equity units at September 30, 2017 was $5.07.
Compensation Expense
The Company recognized non-cash share-based compensation expense of $50 million, free cash flow compensation expense of $15 million and dividend expense related to the equity units of $7 million for the fiscal year ended September 30, 2019. The Company recognized non-cash share-based compensation expense of $62 million, free cash flow compensation expense of $19 million and dividend expense related to the equity units of $27 million for the fiscal year ended September 30, 2018. The Company recognized non-cash share-based compensation expense of $70 million, free cash flow compensation expense of $30 million and dividend expense related to the equity units of $2 million for the fiscal year ended September 30, 2017.
In addition, at September 30, 2019, September 30, 2018 and September 30, 2017, the Company had approximately $16 million, $18 million and $34 million, respectively, of unrecognized compensation costs related to its unvested share awards. As of September 30, 2019, the remaining weighted-average period over which total compensation related to unvested awards is expected to be recognized is 1 year.
F-37
Table of Contents
12. Related Party Transactions
Management Agreement
Upon completion of the Merger, the Company and Holdings entered into the Management Agreement, dated as of the Merger Closing Date, pursuant to which Access provides the Company and its subsidiaries with financial, investment banking, management, advisory and other services. Pursuant to the Management Agreement, the Company pays to Access an annual fee and reimburses Access for certain expenses incurred performing services under the agreement. The annual fee is payable quarterly. The Company and Holdings agreed to indemnify Access and certain of its affiliates against all liabilities arising out of performance of the Management Agreement.
Such costs incurred by the Company were approximately $11 million, $16 million and $9 million for the fiscal years ended September 30, 2019, September 30, 2018 and September 30, 2017, respectively. Such amounts have been included as a component of selling, general and administrative expense in the accompanying consolidated statements of operations.
Lease Arrangements with Related Parties
On March 29, 2019, an affiliate of Access acquired the Ford Factory Building, located on 777 S. Santa Fe Avenue in Los Angeles, California from an unaffiliated third party. The building is the Company’s new Los Angeles, California headquarters and as such, the Company is the sole tenant of the building acquired by Access. The existing lease agreement was assumed by Access upon purchase of the building and was not modified as a result of the purchase. Rental payments by the Company under the existing lease total approximately $12 million per year, subject to annual fixed increases. The remaining lease term is approximately 11 years, after which the Company may exercise a single option to extend the term of the lease for 10 years thereafter.
On July 15, 2016, a subsidiary of the Company, Warner Music Inc., entered into a license agreement with Cooper Investment Partners LLC, for the use of office space in the Company’s corporate headquarters at 1633 Broadway, New York, New York. The license fee of $16,967.21 per month, was based on the per foot lease costs to the Company of its headquarters space, which represented market terms. For the fiscal year ended September 30, 2019, an immaterial amount was recorded as rental income. The space is occupied by Cooper Investment Partners LLC, which is a private equity fund that pursues a wide range of investment opportunities. Mr. Cooper, CEO and director of the Company, is the Managing Partner of Cooper Investment Partners LLC.
On August 13, 2015, a subsidiary of the Company, Warner Music Inc., entered into a license agreement with Access for the use of office space in the Company’s corporate headquarters at 1633 Broadway, New York, New York. The license fee of $2,775 per month, plus an IT support fee of $1,000 per month, was based on the per foot lease costs to the Company of its headquarters space, which represented market terms. For the fiscal year ended September 30, 2019, an immaterial amount was recorded as rental income. The space is occupied by The Blavatnik Archive, which is dedicated to the discovery and preservation of historically distinctive and visually compelling artifacts, images and stories that contribute to the study of 20th century Jewish, WWI and WWII history.
On July 29, 2014, AI Wrights Holdings Limited, an affiliate of Access, entered into a lease and related agreements with Warner Chappell Music Limited and WMG Acquisition (UK) Limited, subsidiaries of the Company, for the lease of 27 Wrights Lane, Kensington, London. The Company had been the tenant of the building which Access acquired. Subsequent to the change in ownership, the parties entered into the lease and related agreements pursuant to which, on January 1, 2015, the rent was increased to £3,460,250 per year and the term was extended for an additional five years from December 24, 2020 to December 24, 2025, with a market rate rent review beginning December 25, 2020.
F-38
Table of Contents
License Agreements with Deezer
Access owns a controlling equity interest in Deezer S.A., which was formerly known as Odyssey Music Group (“Odyssey”), a French company that controls and operates a music streaming service, formerly through Odyssey’s subsidiary, Blogmusik SAS (“Blogmusik”), under the name Deezer (“Deezer”), and is represented on Deezer S.A.’s Board of Directors. Subsidiaries of the Company have been a party to license arrangements with Deezer since 2008, which provide for the use of the Company’s sound recordings on Deezer’s ad-supported and subscription streaming services worldwide (excluding Japan) in exchange for fees paid by Deezer. The Company has also authorized Deezer to include the Company’s sound recordings in Deezer’s streaming services where such services are offered as a bundle with third-party services or products (e.g., telco services or hardware products), for which Deezer is also required to make payments to the Company. Deezer paid to the Company an aggregate amount of approximately $49 million in connection with the foregoing arrangements during the fiscal year ended September 30, 2019. In addition, in connection with these arrangements, (i) the Company was issued, and currently holds, warrants to purchase shares of Deezer S.A. and (ii) the Company purchased a small number of shares of Deezer S.A., which collectively represent a small minority interest in Deezer S.A. The Company also has various publishing agreements with Deezer. Warner Chappell has licenses with Deezer for use of repertoire on the service in Europe, which the Company refers to as a PEDL license (referencing the Company’s Pan European Digital Licensing initiative), and for territories in Latin America. For the PEDL and Latin American licenses for the fiscal year ended September 30, 2019, Deezer paid the Company an additional approximately $1 million. Deezer also licenses other publishing rights controlled by Warner Chappell through statutory licenses or through various collecting societies.
Investment in Tencent Music Entertainment Group
On October 1, 2018, WMG China LLC (“WMG China”), an affiliate of the Company, entered into a share subscription agreement with Tencent Music Entertainment Group pursuant to which WMG China agreed to purchase 37,162,288 ordinary shares of Tencent Music Entertainment Group for $100 million. WMG China is 80% owned by AI New Holdings 5 LLC, an affiliate of Access, and 20% owned by the Company. On October 3, 2018, WMG China acquired the shares pursuant to the share subscription agreement.
Music Publishing Agreement
Val Blavatnik (the son of our director and controlling shareholder, Len Blavatnik) entered into a music publishing contract with Warner-Tamerlane Publishing Corp., dated September 7, 2018, pursuant to which, in fiscal 2019, he was paid $162,500 in advances recoupable from royalties otherwise payable to him from the licensing of musical compositions written or co-written by him.
Loan Agreement with Max Lousada
On April 16, 2018, the Company loaned $227,000 to Mr. Lousada in exchange for a promissory note. Mr. Lousada was obligated to repay this loan upon the earliest of specified events, including April 30, 2019, termination of his employment, the event of a default (as specified therein) or if the Company or one of its affiliates becomes an issuer of publicly traded stock. Mr. Lousada repaid this loan prior to April 30, 2019.
13. Commitments and Contingencies
Leases
The Company occupies various facilities and uses certain equipment under operating leases. Net rent expense was approximately $84 million, $80 million and $62 million for the fiscal years ended September 30, 2019, September 30, 2018 and September 30, 2017, respectively.
F-39
Table of Contents
At September 30, 2019, future minimum payments under non-cancelable operating leases are as follows:
| Years |
Operating Leases |
|||
| (in millions) | ||||
| 2020 |
$ | 52 | ||
| 2021 |
49 | |||
| 2022 |
48 | |||
| 2023 |
47 | |||
| 2024 |
45 | |||
| Thereafter |
207 | |||
|
|
|
|||
| Total |
$ | 448 | ||
|
|
|
|||
The future minimum payments reflect the amounts owed under lease arrangements and do not include any fair market value adjustments that would have been recorded as a result of the Merger.
Talent Advances
The Company routinely enters into long-term commitments with recording artists, songwriters and publishers for the future delivery of music. Such commitments generally become due only upon delivery and Company acceptance of albums from the recording artists or future musical compositions from songwriters and publishers. Additionally, such commitments are typically cancelable at the Company’s discretion, generally without penalty. Based on contractual obligations and the Company’s expected release schedule, aggregate firm commitments to such talent approximated $428 million and $340 million as of September 30, 2019 and September 30, 2018, respectively.
Other
Other off-balance sheet, firm commitments, which primarily include minimum funding commitments to investees, amounted to approximately $10 million and $4 million at September 30, 2019 and September 30, 2018, respectively.
Litigation
SiriusXM
On September 11, 2013, the Company joined with Capitol Records, LLC, Sony Music Entertainment, UMG Recordings, Inc. and ABKCO Music & Records, Inc. in a lawsuit brought in California Superior Court against SiriusXM Radio Inc., alleging copyright infringement for SiriusXM’s use of pre-1972 sound recordings under California law. A nation-wide settlement was reached on June 17, 2015 pursuant to which SiriusXM paid the plaintiffs, in the aggregate, $210 million on July 29, 2015 and the plaintiffs dismissed their lawsuit with prejudice. The settlement resolved all past claims as to SiriusXM’s use of pre-1972 recordings owned or controlled by the plaintiffs and enabled SiriusXM, without any additional payment, to reproduce, perform and broadcast such recordings in the United States through December 31, 2017. The allocation of the settlement proceeds among the plaintiffs was determined and the settlement proceeds were distributed accordingly. This resulted in a cash distribution to the Company of $33 million of which $28 million was recognized in revenue during the 2016 fiscal year and $4 million was recognized in revenue during the 2017 fiscal year. The balance of $1 million was recognized in the first quarter of the 2018 fiscal year. The Company is sharing its allocation of the settlement proceeds with its artists on the same basis as statutory revenue from SiriusXM is shared, i.e., the artist share of our allocation will be paid to artists by SoundExchange.
As part of the settlement, plaintiffs agreed to negotiate in good faith to grant SiriusXM a license to publicly perform the plaintiffs’ pre-1972 sound recordings for the five-year period running from January 1, 2018 to
F-40
Table of Contents
December 31, 2022. Pursuant to the settlement, if the parties were unable to reach an agreement on license terms, the royalty rate for each license would be determined by binding arbitration on a willing buyer/willing seller standard. On December 21, 2017, SiriusXM commenced a single arbitration against all of the plaintiffs in California through JAMS to determine the rate for the five-year period. On May 1, 2018, the Company filed a lawsuit against SiriusXM in New York state court to stay the California arbitration and to compel a separate arbitration in New York solely between SiriusXM and the Company. On August 23, 2018, the Company filed a Stipulation of Discontinuance without Prejudice as to the New York state court action after SiriusXM agreed to participate in a separate arbitration with the Company in New York if the parties were unable to reach an agreement on pre-1972 license terms. On March 28, 2019, the Company and SiriusXM entered into an agreement granting SiriusXM a license to publicly perform the Company’s pre-1972 sound recordings for the five-year period running from January 1, 2018 to December 31, 2022.
Other Matters
In addition to the matter discussed above, the Company is involved in various litigation and regulatory proceedings arising in the normal course of business. Where it is determined, in consultation with counsel based on litigation and settlement risks, that a loss is probable and estimable in a given matter, the Company establishes an accrual. In the currently pending proceedings, the amount of accrual is not material. An estimate of the reasonably possible loss or range of loss in excess of the amounts already accrued cannot be made at this time due to various factors typical in contested proceedings, including (1) the results of ongoing discovery; (2) uncertain damage theories and demands; (3) a less than complete factual record; (4) uncertainty concerning legal theories and their resolution by courts or regulators; and (5) the unpredictable nature of the opposing party and its demands. However, the Company cannot predict with certainty the outcome of any litigation or the potential for future litigation. As such, the Company continuously monitors these proceedings as they develop and adjusts any accrual or disclosure as needed. Regardless of the outcome, litigation could have an adverse impact on the Company, including the Company’s brand value, because of defense costs, diversion of management resources and other factors and it could have a material effect on the Company’s results of operations for a given reporting period.
14. Derivative Financial Instruments
The Company uses derivative financial instruments, primarily foreign currency forward exchange contracts and interest rate swaps, for the purposes of managing foreign currency exchange rate risk and interest rate risk on expected future cash flows. However, the Company may choose not to hedge certain exposures for a variety of reasons including, but not limited to, accounting considerations and the prohibitive economic cost of hedging particular exposures. There can be no assurance the hedges will offset more than a portion of the financial impact resulting from movements in foreign currency exchange or interest rates.
The Company enters into foreign currency forward exchange contracts primarily to hedge the risk that unremitted or future royalties and license fees owed to its U.S. companies for the sale or licensing of U.S.-based music and merchandise abroad may be adversely affected by changes in foreign currency exchange rates. The Company focuses on managing the level of exposure to the risk of foreign currency exchange rate fluctuations on its major currencies, which include the Euro, British pound sterling, Japanese yen, Canadian dollar, Swedish krona, Australian dollar, Brazilian real, Korean won and Norwegian krone. The foreign currency forward exchange contracts related to royalties are designated and qualify as cash flow hedges under the criteria prescribed in ASC 815. The Company records these contracts at fair value on its balance sheet and gains or losses on these contracts are deferred in equity (as a component of comprehensive loss). These deferred gains and losses are recognized in income in the period in which the related royalties and license fees being hedged are received and recognized in income. However, to the extent that any of these contracts are not considered to be perfectly effective in offsetting the change in the value of the royalties and license fees being hedged, any changes in fair value relating to the ineffective portion of these contracts are immediately recognized in the consolidated statement of operations.
F-41
Table of Contents
The Company may at times choose to hedge foreign currency risk associated with financing transactions such as third-party debt and other balance sheet items. The foreign currency forward exchange contracts related to balance sheet items denominated in foreign currency are reviewed on a contract-by-contract basis and are designated accordingly. If these foreign currency forward exchange contracts do not qualify for hedge accounting, then the Company records these contracts at fair value on its balance sheet and the related gains and losses are immediately recognized in the consolidated statement of operations where there is an equal and offsetting entry related to the underlying exposure.
The Company has entered into, and in the future may enter into, interest rate swaps to manage interest rate risk. These instruments may offset a portion of changes in income or expense, or changes in fair value of the Company’s long-term debt. The interest rate swap instruments are designated and qualify as cash flow hedges under the criteria prescribed in ASC 815. The Company records these contracts at fair value on its balance sheet and gains or losses on these contracts are deferred in equity (as a component of comprehensive loss).
The fair value of foreign currency forward exchange contracts is determined by using observable market transactions of spot and forward rates (i.e., Level 2 inputs) which is discussed further in Note 17. Additionally, netting provisions are provided for in existing International Swap and Derivative Association Inc. agreements in situations where the Company executes multiple contracts with the same counterparty. As a result, net assets or liabilities resulting from foreign exchange derivatives subject to these netting agreements are classified within other current assets or other current liabilities in the Company’s consolidated balance sheets.
The Company’s hedged interest rate transactions as of September 30, 2019 are expected to be recognized within five years. The fair value of interest rate swaps is based on dealer quotes of market rates (i.e., Level 2 inputs) which is discussed further in Note 17. Interest income or expense related to interest rate swaps is recognized in interest income, net in the same period as the related expense is recognized. The ineffective portions of interest rate swaps are recognized in other income/(expense), net in the period measured.
The Company monitors its positions with, and the credit quality of, the financial institutions that are party to any of its financial transactions.
As of September 30, 2019, the Company had no outstanding hedge contracts and no deferred gains or losses in comprehensive loss related to foreign exchange hedging. As of September 30, 2018, the Company had no outstanding hedge contracts and no deferred gains or losses in comprehensive loss related to foreign exchange hedging.
As of September 30, 2019, the Company had outstanding $820 million in pay-fixed receive-variable interest rate swaps with $8 million of unrealized deferred losses in comprehensive income related to the interest rate swaps. As of September 30, 2018, the Company had outstanding $320 million in pay-fixed receive-variable interest rate swaps with $3 million of unrealized deferred gains in comprehensive income related to the interest rate swaps.
The pre-tax losses of the Company’s derivative interest rate swaps designated as cash flow hedges recorded in other comprehensive income and the Consolidated Statement of Comprehensive Income during the twelve months ended September 30, 2019 was $11 million, net. The pre-tax gains of the Company’s derivative interest rate swaps designated as cash flow hedges recorded in other comprehensive income and the Consolidated Statement of Comprehensive Income during the twelve months ended September 30, 2018 was $4 million.
F-42
Table of Contents
The following is a summary of amounts recorded in the Consolidated Balance Sheets pertaining to the Company’s designated cash flows hedges at September 30, 2019 and September 30, 2018:
| September 30, 2019 (a) |
September 30, 2018 (b) |
|||||||
| (in millions) | ||||||||
| Other noncurrent assets |
$ | 2 | $ | 4 | ||||
| Other noncurrent liabilities |
(13 | ) | — | |||||
| (a) | $2 million and $13 million of interest rate swaps in asset and liability positions, respectively. |
| (b) | $4 million of interest rate swap in an asset position. |
15. Segment Information
As discussed more fully in Note 1, based on the nature of its products and services, the Company classifies its business interests into two fundamental operations: Recorded Music and Music Publishing, which also represent the reportable segments of the Company. Information as to each of these operations is set forth below. The Company evaluates performance based on several factors, of which the primary financial measure is operating income (loss) before non-cash depreciation of tangible assets and non-cash amortization of intangible assets (“OIBDA”). The Company has supplemented its analysis of OIBDA results by segment with an analysis of operating income (loss) by segment.
F-43
Table of Contents
The accounting policies of the Company’s business segments are the same as those described in the summary of significant accounting policies included elsewhere herein. The Company accounts for intersegment sales at fair value as if the sales were to third parties. While intercompany transactions are treated like third-party transactions to determine segment performance, the revenues (and corresponding expenses recognized by the segment that is counterparty to the transaction) are eliminated in consolidation, and therefore, do not themselves impact consolidated results.
| Recorded Music | Music Publishing |
Corporate expenses and eliminations |
Total | |||||||||||||
| (in millions) | ||||||||||||||||
| 2019 |
||||||||||||||||
| Revenues |
$ | 3,840 | $ | 643 | $ | (8 | ) | $ | 4,475 | |||||||
| Operating income (loss) |
439 | 92 | (175 | ) | 356 | |||||||||||
| Amortization of intangible assets |
139 | 69 | — | 208 | ||||||||||||
| Depreciation of property, plant and equipment |
45 | 5 | 11 | 61 | ||||||||||||
|
|
|
|
|
|
|
|
|
|||||||||
| OIBDA |
623 | 166 | (164 | ) | 625 | |||||||||||
| Total assets |
2,217 | 2,581 | 1,219 | 6,017 | ||||||||||||
| Capital expenditures |
29 | 3 | 72 | 104 | ||||||||||||
| 2018 |
||||||||||||||||
| Revenues |
$ | 3,360 | $ | 653 | $ | (8 | ) | $ | 4,005 | |||||||
| Operating income (loss) |
307 | 84 | (174 | ) | 217 | |||||||||||
| Amortization of intangible assets |
138 | 68 | — | 206 | ||||||||||||
| Depreciation of property, plant and equipment |
35 | 7 | 13 | 55 | ||||||||||||
|
|
|
|
|
|
|
|
|
|||||||||
| OIBDA |
480 | 159 | (161 | ) | 478 | |||||||||||
| Total assets |
1,999 | 2,423 | 922 | 5,344 | ||||||||||||
| Capital expenditures |
20 | 3 | 51 | 74 | ||||||||||||
| 2017 |
||||||||||||||||
| Revenues |
$ | 3,020 | $ | 572 | $ | (16 | ) | $ | 3,576 | |||||||
| Operating income (loss) |
283 | 81 | (142 | ) | 222 | |||||||||||
| Amortization of intangible assets |
136 | 65 | — | 201 | ||||||||||||
| Depreciation of property, plant and equipment |
32 | 6 | 12 | 50 | ||||||||||||
|
|
|
|
|
|
|
|
|
|||||||||
| OIBDA |
451 | 152 | (130 | ) | 473 | |||||||||||
| Capital expenditures |
21 | 5 | 18 | 44 | ||||||||||||
Revenues relating to operations in different geographical areas are set forth below for the fiscal years ended September 30, 2019, September 30, 2018 and September 30, 2017. Total assets relating to operations in different geographical areas are set forth below as of September 30, 2019 and September 30, 2018.
| 2019 | 2018 | 2017 | ||||||||||||||||||
| Revenue | Long-lived Assets |
Revenue | Long-lived Assets |
Revenue | ||||||||||||||||
| (in millions) | ||||||||||||||||||||
| United States |
$ | 1,956 | $ | 201 | $ | 1,754 | $ | 156 | $ | 1,587 | ||||||||||
| United Kingdom |
596 | 20 | 593 | 23 | 522 | |||||||||||||||
| All other territories |
1,923 | 79 | 1,658 | 50 | 1,467 | |||||||||||||||
|
|
|
|
|
|
|
|
|
|
|
|||||||||||
| Total |
$ | 4,475 | $ | 300 | $ | 4,005 | $ | 229 | $ | 3,576 | ||||||||||
|
|
|
|
|
|
|
|
|
|
|
|||||||||||
F-44
Table of Contents
Customer Concentration
In the fiscal year ended September 30, 2019, the Company had two customers, Spotify and Apple, that individually represented 10% or more of total revenues, whereby Spotify represented 14%, and Apple represented 13% of total revenues. In the fiscal year ended September 30, 2018, the Company had two customers, Apple and Spotify, that individually represented 10% or more of total revenues, whereby Apple represented 15%, and Spotify represented 14% of total revenues. In the fiscal year ended September 30, 2017, the Company had one customer, Apple, that individually represented 14% of total revenues. These customers’ revenues are included in both the Company’s Recorded Music and Music Publishing segments and the Company expects that the Company’s license agreements with these customers will be renewed in the normal course of business.
16. Additional Financial Information
Cash Interest and Taxes
The Company made interest payments of approximately $138 million, $148 million and $138 million during the fiscal years ended September 30, 2019, September 30, 2018 and September 30, 2017, respectively. The Company paid approximately $63 million, $49 million and $40 million of foreign income and withholding taxes, net of refunds, for the fiscal years ended September 30, 2019, September 30, 2018 and September 30, 2017, respectively.
Dividends
The Company’s ability to pay dividends is restricted by covenants in the indentures governing its notes and in the credit agreements for the Senior Term Loan Facility and the Revolving Credit Facility.
On September 23, 2019, the Company’s board of directors declared a cash dividend of $206.25 million which was paid to stockholders on October 4, 2019 and recorded as an accrual as of September 30, 2019. For fiscal year 2019, the Company paid an aggregate of $93.75 million in cash dividends to stockholders. For fiscal year 2018, the Company paid an aggregate of $925 million in cash dividends to stockholders, which reflected proceeds from the sale of Spotify shares acquired in the ordinary course of business. For fiscal year 2017, the Company paid an aggregate of $84 million in cash dividends to stockholders.
In the first quarter of fiscal year 2019, the Company instituted a regular quarterly dividend policy whereby it intends to pay a modest regular quarterly dividend in each fiscal quarter and a variable dividend for the fourth fiscal quarter in an amount commensurate with cash expected to be generated from operations in such fiscal year, in each case, after taking into account other potential uses for cash, including acquisitions, investment in our business and repayment of indebtedness. The declaration of each dividend will continue to be at the discretion of the Board.
Spotify Share Sale
During the fiscal year ended September 30, 2018, the Company sold all of its shares of common stock in Spotify Technology S.A. (“Spotify”) for cash proceeds of $504 million. In February 2016, the Company publicly announced that it would pay royalties in connection with these proceeds. The sale of shares resulted in an estimated pre-tax gain, net of the estimated royalty expense and other related costs, of $382 million, which was recorded as other income (expense) for the fiscal year ended September 30, 2018. As of September 30, 2018, the estimated royalty expense and other related costs had been accrued, and were subsequently paid. The processing of the royalty expense resulted in advance recoveries of previously expensed royalty advances. The Company calculated the advance recoveries to be $12 million, and recorded these advance recoveries as a credit within operating expense for the fiscal year ended September 30, 2018. The Company also recorded estimated tax expense of $77 million associated with the net income on the sale of shares in fiscal year ended September 30, 2018.
F-45
Table of Contents
Additionally, the cash proceeds received in connection with the sale of shares have been reflected as an investing activity on the statement of cash flows within proceeds from the sale of investments for the fiscal year ended September 30, 2018.
17. Fair Value Measurements
ASC 820, Fair Value Measurement (“ASC 820”) defines fair value as the price that would be received upon sale of an asset or paid upon transfer of a liability in an orderly transaction between market participants at the measurement date and in the principal or most advantageous market for that asset or liability. The fair value should be calculated based on assumptions that market participants would use in pricing the asset or liability, not on assumptions specific to the entity.
In addition to defining fair value, ASC 820 expands the disclosure requirements around fair value and establishes a fair value hierarchy for valuation inputs. The hierarchy prioritizes the inputs into three levels based on the extent to which inputs used in measuring fair value are observable in the market. Each fair value measurement is reported in one of the three levels which is determined by the lowest level input that is significant to the fair value measurement in its entirety. These levels are:
| • | Level 1—inputs are based upon unadjusted quoted prices for identical instruments traded in active markets. |
| • | Level 2—inputs are based upon quoted prices for similar instruments in active markets, quoted prices for identical or similar instruments in markets that are not active and model-based valuation techniques for which all significant assumptions are observable in the market or can be corroborated by observable market data for substantially the full term of the assets or liabilities. |
| • | Level 3—inputs are generally unobservable and typically reflect management’s estimates of assumptions that market participants would use in pricing the asset or liability. The fair values are therefore determined using model-based techniques that include option pricing models, discounted cash flow models and similar techniques. |
F-46
Table of Contents
In accordance with the fair value hierarchy, described above, the following table shows the fair value of the Company’s financial instruments that are required to be measured at fair value as of September 30, 2019 and September 30, 2018.
| Fair Value Measurements as of September 30, 2019 | ||||||||||||||||
| (Level 1) | (Level 2) | (Level 3) | Total | |||||||||||||
| (in millions) | ||||||||||||||||
| Other Current Liabilities: |
||||||||||||||||
| Contractual Obligations (a) |
$ | — | $ | — | $ | (9 | ) | $ | (9 | ) | ||||||
| Other Non-Current Assets: |
||||||||||||||||
| Equity Method Investment (c) |
— | 40 | — | 40 | ||||||||||||
| Interest Rate Swap (b) |
— | 2 | — | 2 | ||||||||||||
| Other Non-Current Liabilities: |
||||||||||||||||
| Interest Rate Swap (b) |
— | (13 | ) | — | (13 | ) | ||||||||||
|
|
|
|
|
|
|
|
|
|||||||||
| Total |
$ | — | $ | 29 | $ | (9 | ) | $ | 20 | |||||||
|
|
|
|
|
|
|
|
|
|||||||||
| Fair Value Measurements as of September 30, 2018 | ||||||||||||||||
| (Level 1) | (Level 2) | (Level 3) | Total | |||||||||||||
| (in millions) | ||||||||||||||||
| Other Current Liabilities: |
||||||||||||||||
| Contractual Obligations (a) |
$ | — | $ | — | $ | (2 | ) | $ | (2 | ) | ||||||
| Other Noncurrent Assets |
||||||||||||||||
| Interest Rate Swaps |
— | 4 | — | 4 | ||||||||||||
| Other Non-Current Liabilities: |
||||||||||||||||
| Contractual Obligations (a) |
— | — | (6 | ) | (6 | ) | ||||||||||
|
|
|
|
|
|
|
|
|
|||||||||
| Total |
$ | — | $ | 4 | $ | (8 | ) | $ | (4 | ) | ||||||
|
|
|
|
|
|
|
|
|
|||||||||
| (a) | This represents purchase obligations and contingent consideration related to the Company’s various acquisitions. This is based on a probability weighted performance approach and it is adjusted to fair value on a recurring basis and any adjustments are included as a component of operating income in the consolidated statements of operations. These amounts were mainly calculated using unobservable inputs such as future earnings performance of the Company’s various acquisitions and the expected timing of the payment. |
| (b) | The fair value of the interest rate swaps is based on dealer quotes of market forward rates and reflects the amount that the Company would receive or pay as of September 30, 2019 for contracts involving the same attributes and maturity dates. |
| (c) | The fair value of equity method investment represents an equity method investment acquired during the fiscal year ended September 30, 2019 whereby the Company has elected the fair value option under ASC 825, Financial Instruments (“ASC 825”). The valuation is based upon quoted prices in active markets and model-based valuation techniques to determine fair value. |
The following table reconciles the beginning and ending balances of net assets and liabilities classified as Level 3:
| Total | ||||
| (in millions) | ||||
| Balance at September 30, 2018 |
$ | (8 | ) | |
| Additions |
(2 | ) | ||
| Payments |
1 | |||
|
|
|
|||
| Balance at September 30, 2019 |
$ | (9 | ) | |
|
|
|
|||
| F-47 |
Table of Contents
The majority of the Company’s non-financial instruments, which include goodwill, intangible assets, inventories and property, plant and equipment, are not required to be re-measured to fair value on a recurring basis. These assets are evaluated for impairment if certain triggering events occur. If such evaluation indicates that impairment exists, the asset is written down to its fair value. In addition, an impairment analysis is performed at least annually for goodwill and indefinite-lived intangible assets.
Equity Investments Without Readily Determinable Fair Value
The Company evaluates its equity investments without readily determinable fair values for impairment if factors indicate that a significant decrease in value has occurred. Beginning in October 2018, the Company prospectively adopted a new accounting standard on the accounting for equity investments that do not have readily determinable fair values. Refer to Note 2, “Summary of Significant Accounting Policies,” for further details. Under the new standard, the Company has elected to use the measurement alternative to fair value that will allow these investments to be recorded at cost, less impairment, and adjusted for subsequent observable price changes. The Company did not record any impairment charges on these investments during the fiscal year ended September 30, 2019. In addition, there were no observable price changes events that were completed during the fiscal year ended September 30, 2019.
Fair Value of Debt
Based on the level of interest rates prevailing at September 30, 2019, the fair value of the Company’s debt was $3.080 billion. Based on the level of interest rates prevailing at September 30, 2018, the fair value of the Company’s debt was $2.862 billion. The fair value of the Company’s debt instruments are determined using quoted market prices from less active markets or by using quoted market prices for instruments with identical terms and maturities; both approaches are considered a Level 2 measurement.
| F-48 |
Table of Contents
WARNER MUSIC GROUP CORP.
2019 QUARTERLY FINANCIAL INFORMATION
(unaudited)
The following table sets forth the quarterly information for Warner Music Group Corp.
| Three months ended | ||||||||||||||||
| September 30, 2019 |
June 30, 2019 | March 31, 2019 | December 31, 2018 |
|||||||||||||
| (in millions) | ||||||||||||||||
| Revenues |
$ | 1,124 | $ | 1,058 | $ | 1,090 | $ | 1,203 | ||||||||
| Costs and expenses: |
||||||||||||||||
| Cost of revenue |
(639 | ) | (577 | ) | (559 | ) | (626 | ) | ||||||||
| Selling, general and administrative expenses (a) |
(408 | ) | (372 | ) | (354 | ) | (376 | ) | ||||||||
| Amortization expense |
(48 | ) | (51 | ) | (55 | ) | (54 | ) | ||||||||
|
|
|
|
|
|
|
|
|
|||||||||
| Total costs and expenses |
(1,095 | ) | (1,000 | ) | (968 | ) | (1,056 | ) | ||||||||
|
|
|
|
|
|
|
|
|
|||||||||
| Operating income |
29 | 58 | 122 | 147 | ||||||||||||
| Loss on extinguishment of debt |
— | (4 | ) | — | (3 | ) | ||||||||||
| Interest expense, net |
(34 | ) | (36 | ) | (36 | ) | (36 | ) | ||||||||
| Other income (expense) |
19 | (16 | ) | 29 | 28 | |||||||||||
|
|
|
|
|
|
|
|
|
|||||||||
| Income before income taxes |
14 | 2 | 115 | 136 | ||||||||||||
| Income tax benefit (expense) |
77 | 12 | (48 | ) | (50 | ) | ||||||||||
|
|
|
|
|
|
|
|
|
|||||||||
| Net income |
91 | 14 | 67 | 86 | ||||||||||||
| Less: Income attributable to noncontrolling interest |
(1 | ) | (1 | ) | — | — | ||||||||||
|
|
|
|
|
|
|
|
|
|||||||||
| Net income attributable to Warner Music Group Corp. |
$ | 90 | $ | 13 | $ | 67 | $ | 86 | ||||||||
|
|
|
|
|
|
|
|
|
|||||||||
| (a) Includes depreciation expense of: |
$ | (18 | ) | $ | (15 | ) | $ | (14 | ) | $ | (14 | ) | ||||
|
|
|
|
|
|
|
|
|
|||||||||
Quarterly operating results can be disproportionately affected by a particularly strong or weak quarter. Therefore, these quarterly operating results are not necessarily indicative of the results that may be expected for the full fiscal year.
F-49
Table of Contents
WARNER MUSIC GROUP CORP.
2018 QUARTERLY FINANCIAL INFORMATION
(unaudited)
The following table sets forth the quarterly information for Warner Music Group Corp.
| Three months ended | ||||||||||||||||
| September 30, 2018 |
June 30, 2018 |
March 31, 2018 |
December 31, 2017 |
|||||||||||||
| (in millions) | ||||||||||||||||
| Revenues |
$ | 1,039 | $ | 958 | $ | 963 | $ | 1,045 | ||||||||
| Costs and expenses: |
||||||||||||||||
| Cost of revenue |
(583 | ) | (531 | ) | (488 | ) | (569 | ) | ||||||||
| Selling, general and administrative expenses (a) |
(398 | ) | (343 | ) | (337 | ) | (333 | ) | ||||||||
| Amortization expense |
(42 | ) | (56 | ) | (55 | ) | (53 | ) | ||||||||
|
|
|
|
|
|
|
|
|
|||||||||
| Total costs and expenses |
(1,023 | ) | (930 | ) | (880 | ) | (955 | ) | ||||||||
|
|
|
|
|
|
|
|
|
|||||||||
| Operating income |
16 | 28 | 83 | 90 | ||||||||||||
| Loss on extinguishment of debt |
— | (7 | ) | (23 | ) | (1 | ) | |||||||||
| Interest expense, net |
(33 | ) | (33 | ) | (36 | ) | (36 | ) | ||||||||
| Other income (expense) |
2 | 394 | (6 | ) | 4 | |||||||||||
|
|
|
|
|
|
|
|
|
|||||||||
| (Loss) income before income taxes |
(15 | ) | 382 | 18 | 57 | |||||||||||
| Income tax benefit (expense) |
2 | (61 | ) | (19 | ) | (52 | ) | |||||||||
|
|
|
|
|
|
|
|
|
|||||||||
| Net (loss) income |
(13 | ) | 321 | (1 | ) | 5 | ||||||||||
| Less: Income attributable to noncontrolling interest |
(1 | ) | (1 | ) | (2 | ) | (1 | ) | ||||||||
|
|
|
|
|
|
|
|
|
|||||||||
| Net (loss) income attributable to Warner Music Group Corp. |
$ | (14 | ) | $ | 320 | $ | (3 | ) | $ | 4 | ||||||
|
|
|
|
|
|
|
|
|
|||||||||
| (a) Includes depreciation expense of: |
$ | (14 | ) | $ | (15 | ) | $ | (14 | ) | $ | (12 | ) | ||||
|
|
|
|
|
|
|
|
|
|||||||||
Quarterly operating results can be disproportionately affected by a particularly strong or weak quarter. Therefore, these quarterly operating results are not necessarily indicative of the results that may be expected for the full fiscal year.
F-50
Table of Contents
WARNER MUSIC GROUP CORP.
Consolidating Financial Statements
The Company is the direct parent of Holdings, which is the direct parent of Acquisition Corp. As of September 30, 2019 Acquisition Corp. had issued and outstanding the 5.000% Senior Secured Notes due 2023, the 4.125% Senior Secured Notes due 2024, the 4.875% Senior Secured Notes due 2024, the 3.625% Senior Secured Notes due 2026 and the 5.500% Senior Notes due 2026 (together, the “Acquisition Corp. Notes”).
The Acquisition Corp. Notes are guaranteed by the Company and, in addition, are guaranteed by all of Acquisition Corp.’s domestic wholly-owned subsidiaries. The secured notes are guaranteed on a senior secured basis and the unsecured notes are guaranteed on an unsecured senior basis. The Company’s guarantee of the Acquisition Corp. Notes is full and unconditional. The guarantee of the Acquisition Corp. Notes by Acquisition Corp.’s domestic wholly-owned subsidiaries is full, unconditional and joint and several. The following condensed consolidating financial statements are also presented for the information of the holders of the Acquisition Corp. Notes and present the results of operations, financial position and cash flows of (i) Acquisition Corp., which is the issuer of the Acquisition Corp. Notes, (ii) the guarantor subsidiaries of Acquisition Corp., (iii) the non-guarantor subsidiaries of Acquisition Corp. and (iv) the eliminations necessary to arrive at the information for Acquisition Corp. on a consolidated basis. Investments in consolidated subsidiaries are presented under the equity method of accounting. There are no restrictions on Acquisition Corp.’s ability to obtain funds from any of its wholly-owned subsidiaries through dividends, loans or advances.
The Company and Holdings are holding companies that conduct substantially all of their business operations through Acquisition Corp. Accordingly, the ability of the Company and Holdings to obtain funds from their subsidiaries is restricted by the indentures for the Acquisition Corp. Notes and the credit agreements for the Acquisition Corp. Senior Credit Facilities, including the Revolving Credit Facility and the Senior Term Loan Facility.
F-51
Table of Contents
Consolidating Balance Sheet
September 30, 2019
| WMG Acquisition Corp. (issuer) |
Guarantor Subsidiaries |
Non- Guarantor Subsidiaries |
Eliminations | WMG Acquisition Corp. Consolidated |
WMG Holdings Corp. |
Warner Music Group Corp. |
Eliminations | Warner Music Group Corp. Consolidated |
||||||||||||||||||||||||||||
| (in millions) | ||||||||||||||||||||||||||||||||||||
| Assets |
||||||||||||||||||||||||||||||||||||
| Current assets: |
||||||||||||||||||||||||||||||||||||
| Cash and equivalents |
$ | — | $ | 386 | $ | 233 | $ | — | $ | 619 | $ | — | $ | — | $ | — | $ | 619 | ||||||||||||||||||
| Accounts receivable, net |
— | 334 | 441 | — | 775 | — | — | — | 775 | |||||||||||||||||||||||||||
| Inventories |
— | 11 | 63 | — | 74 | — | — | — | 74 | |||||||||||||||||||||||||||
| Royalty advances expected to be recouped within one year |
— | 112 | 58 | — | 170 | — | — | — | 170 | |||||||||||||||||||||||||||
| Prepaid and other current assets |
— | 12 | 41 | — | 53 | — | — | — | 53 | |||||||||||||||||||||||||||
|
|
|
|
|
|
|
|
|
|
|
|
|
|
|
|
|
|
|
|||||||||||||||||||
| Total current assets |
— | 855 | 836 | — | 1,691 | — | — | — | 1,691 | |||||||||||||||||||||||||||
| Due from (to) parent companies |
458 | (531 | ) | 73 | — | — | — | — | — | — | ||||||||||||||||||||||||||
| Investments in and advances to consolidated subsidiaries |
2,272 | 2,567 | — | (4,839 | ) | — | 878 | 878 | (1,756 | ) | — | |||||||||||||||||||||||||
| Royalty advances expected to be recouped after one year |
— | 137 | 71 | — | 208 | — | — | — | 208 | |||||||||||||||||||||||||||
| Property, plant and equipment, net |
— | 200 | 100 | — | 300 | — | — | — | 300 | |||||||||||||||||||||||||||
| Goodwill |
— | 1,370 | 391 | — | 1,761 | — | — | — | 1,761 | |||||||||||||||||||||||||||
| Intangible assets subject to amortization, net |
— | 884 | 839 | — | 1,723 | — | — | — | 1,723 | |||||||||||||||||||||||||||
| Intangible assets not subject to amortization |
— | 71 | 80 | — | 151 | — | — | — | 151 | |||||||||||||||||||||||||||
| Deferred tax assets, net |
— | 30 | 8 | — | 38 | — | — | — | 38 | |||||||||||||||||||||||||||
| Other assets |
7 | 115 | 23 | — | 145 | — | — | — | 145 | |||||||||||||||||||||||||||
|
|
|
|
|
|
|
|
|
|
|
|
|
|
|
|
|
|
|
|||||||||||||||||||
| Total assets |
$ | 2,737 | $ | 5,698 | $ | 2,421 | $ | (4,839 | ) | $ | 6,017 | $ | 878 | $ | 878 | $ | (1,756 | ) | $ | 6,017 | ||||||||||||||||
|
|
|
|
|
|
|
|
|
|
|
|
|
|
|
|
|
|
|
|||||||||||||||||||
| Liabilities and Equity |
||||||||||||||||||||||||||||||||||||
| Current liabilities: |
||||||||||||||||||||||||||||||||||||
| Accounts payable |
$ | — | $ | 160 | $ | 100 | $ | — | $ | 260 | $ | — | $ | — | $ | — | $ | 260 | ||||||||||||||||||
| Accrued royalties |
4 | 813 | 750 | — | 1,567 | — | — | — | 1,567 | |||||||||||||||||||||||||||
| Accrued liabilities |
— | 266 | 226 | — | 492 | — | — | — | 492 | |||||||||||||||||||||||||||
| Accrued interest |
34 | — | — | — | 34 | — | — | — | 34 | |||||||||||||||||||||||||||
| Deferred revenue |
— | 42 | 138 | — | 180 | — | — | — | 180 | |||||||||||||||||||||||||||
| Other current liabilities |
— | 221 | 65 | — | 286 | — | — | — | 286 | |||||||||||||||||||||||||||
|
|
|
|
|
|
|
|
|
|
|
|
|
|
|
|
|
|
|
|||||||||||||||||||
| Total current liabilities |
38 | 1,502 | 1,279 | — | 2,819 | — | — | — | 2,819 | |||||||||||||||||||||||||||
| Long-term debt |
2,974 | — | — | — | 2,974 | — | — | — | 2,974 | |||||||||||||||||||||||||||
| Deferred tax liabilities, net |
— | — | 172 | — | 172 | — | — | — | 172 | |||||||||||||||||||||||||||
| Other noncurrent liabilities |
14 | 200 | 107 | — | 321 | — | — | — | 321 | |||||||||||||||||||||||||||
|
|
|
|
|
|
|
|
|
|
|
|
|
|
|
|
|
|
|
|||||||||||||||||||
| Total liabilities |
3,026 | 1,702 | 1,558 | — | 6,286 | — | — | — | 6,286 | |||||||||||||||||||||||||||
|
|
|
|
|
|
|
|
|
|
|
|
|
|
|
|
|
|
|
|||||||||||||||||||
| Total Warner Music Group Corp. (deficit) equity |
(289 | ) | 3,992 | 847 | (4,839 | ) | (289 | ) | 878 | 878 | (1,756 | ) | (289 | ) | ||||||||||||||||||||||
| Noncontrolling interest |
— | 4 | 16 | — | 20 | — | — | — | 20 | |||||||||||||||||||||||||||
|
|
|
|
|
|
|
|
|
|
|
|
|
|
|
|
|
|
|
|||||||||||||||||||
| Total equity |
(289 | ) | 3,996 | 863 | (4,839 | ) | (269 | ) | 878 | 878 | (1,756 | ) | (269 | ) | ||||||||||||||||||||||
|
|
|
|
|
|
|
|
|
|
|
|
|
|
|
|
|
|
|
|||||||||||||||||||
| Total liabilities and equity |
$ | 2,737 | $ | 5,698 | $ | 2,421 | $ | (4,839 | ) | $ | 6,017 | $ | 878 | $ | 878 | $ | (1,756 | ) | $ | 6,017 | ||||||||||||||||
|
|
|
|
|
|
|
|
|
|
|
|
|
|
|
|
|
|
|
|||||||||||||||||||
| F-52 |
Table of Contents
Consolidating Balance Sheet
September 30, 2018
| WMG Acquisition Corp. (issuer) |
Guarantor Subsidiaries |
Non- Guarantor Subsidiaries |
Eliminations | WMG Acquisition Corp. Consolidated |
WMG Holdings Corp. |
Warner Music Group Corp. |
Eliminations | Warner Music Group Corp. Consolidated |
||||||||||||||||||||||||||||
| (in millions) | ||||||||||||||||||||||||||||||||||||
| Assets |
||||||||||||||||||||||||||||||||||||
| Current assets: |
||||||||||||||||||||||||||||||||||||
| Cash and equivalents |
$ | — | $ | 169 | $ | 345 | $ | — | $ | 514 | $ | — | $ | — | $ | — | $ | 514 | ||||||||||||||||||
| Accounts receivable, net |
— | 262 | 185 | — | 447 | — | — | — | 447 | |||||||||||||||||||||||||||
| Inventories |
— | 18 | 24 | — | 42 | — | — | — | 42 | |||||||||||||||||||||||||||
| Royalty advances expected to be recouped within one year |
— | 79 | 44 | — | 123 | — | — | — | 123 | |||||||||||||||||||||||||||
| Prepaid and other current assets |
— | 15 | 35 | — | 50 | — | — | — | 50 | |||||||||||||||||||||||||||
|
|
|
|
|
|
|
|
|
|
|
|
|
|
|
|
|
|
|
|||||||||||||||||||
| Total current assets |
— | 543 | 633 | — | 1,176 | — | — | — | 1,176 | |||||||||||||||||||||||||||
| Due from (to) parent companies |
488 | (214 | ) | (274 | ) | — | — | — | — | — | — | |||||||||||||||||||||||||
| Investments in and advances to consolidated subsidiaries |
2,018 | 2,192 | — | (4,210 | ) | — | 675 | 675 | (1,350 | ) | — | |||||||||||||||||||||||||
| Royalty advances expected to be recouped after one year |
— | 93 | 60 | — | 153 | — | — | — | 153 | |||||||||||||||||||||||||||
| Property, plant and equipment, net |
— | 155 | 74 | — | 229 | — | — | — | 229 | |||||||||||||||||||||||||||
| Goodwill |
— | 1,370 | 322 | — | 1,692 | — | — | — | 1,692 | |||||||||||||||||||||||||||
| Intangible assets subject to amortization, net |
— | 956 | 895 | — | 1,851 | — | — | — | 1,851 | |||||||||||||||||||||||||||
| Intangible assets not subject to amortization |
— | 71 | 83 | — | 154 | — | — | — | 154 | |||||||||||||||||||||||||||
| Deferred tax assets, net |
— | — | 11 | — | 11 | — | — | — | 11 | |||||||||||||||||||||||||||
| Other assets |
12 | 55 | 11 | — | 78 | — | — | — | 78 | |||||||||||||||||||||||||||
|
|
|
|
|
|
|
|
|
|
|
|
|
|
|
|
|
|
|
|||||||||||||||||||
| Total assets |
$ | 2,518 | $ | 5,221 | $ | 1,815 | $ | (4,210 | ) | $ | 5,344 | $ | 675 | $ | 675 | $ | (1,350 | ) | $ | 5,344 | ||||||||||||||||
|
|
|
|
|
|
|
|
|
|
|
|
|
|
|
|
|
|
|
|||||||||||||||||||
| Liabilities and Equity |
||||||||||||||||||||||||||||||||||||
| Current liabilities: |
||||||||||||||||||||||||||||||||||||
| Accounts payable |
$ | — | $ | 200 | $ | 81 | $ | — | $ | 281 | $ | — | $ | — | $ | — | $ | 281 | ||||||||||||||||||
| Accrued royalties |
— | 869 | 527 | — | 1,396 | — | — | — | 1,396 | |||||||||||||||||||||||||||
| Accrued liabilities |
— | 195 | 228 | — | 423 | — | — | — | 423 | |||||||||||||||||||||||||||
| Accrued interest |
31 | — | — | — | 31 | — | — | — | 31 | |||||||||||||||||||||||||||
| Deferred revenue |
— | 94 | 114 | — | 208 | — | — | — | 208 | |||||||||||||||||||||||||||
| Other current liabilities |
— | 2 | 32 | — | 34 | — | — | — | 34 | |||||||||||||||||||||||||||
|
|
|
|
|
|
|
|
|
|
|
|
|
|
|
|
|
|
|
|||||||||||||||||||
| Total current liabilities |
31 | 1,360 | 982 | — | 2,373 | — | — | — | 2,373 | |||||||||||||||||||||||||||
| Long-term debt |
2,819 | — | — | — | 2,819 | — | — | — | 2,819 | |||||||||||||||||||||||||||
| Deferred tax liabilities, net |
— | 3 | 162 | — | 165 | — | — | — | 165 | |||||||||||||||||||||||||||
| Other noncurrent liabilities |
2 | 197 | 108 | — | 307 | — | — | — | 307 | |||||||||||||||||||||||||||
|
|
|
|
|
|
|
|
|
|
|
|
|
|
|
|
|
|
|
|||||||||||||||||||
| Total liabilities |
2,852 | 1,560 | 1,252 | — | 5,664 | — | — | — | 5,664 | |||||||||||||||||||||||||||
|
|
|
|
|
|
|
|
|
|
|
|
|
|
|
|
|
|
|
|||||||||||||||||||
| Total Warner Music Group Corp. (deficit) equity |
(334 | ) | 3,656 | 554 | (4,210 | ) | (334 | ) | 675 | 675 | (1,350 | ) | (334 | ) | ||||||||||||||||||||||
| Noncontrolling interest |
— | 5 | 9 | — | 14 | — | — | — | 14 | |||||||||||||||||||||||||||
|
|
|
|
|
|
|
|
|
|
|
|
|
|
|
|
|
|
|
|||||||||||||||||||
| Total equity |
(334 | ) | 3,661 | 563 | (4,210 | ) | (320 | ) | 675 | 675 | (1,350 | ) | (320 | ) | ||||||||||||||||||||||
|
|
|
|
|
|
|
|
|
|
|
|
|
|
|
|
|
|
|
|||||||||||||||||||
| Total liabilities and equity |
$ | 2,518 | $ | 5,221 | $ | 1,815 | $ | (4,210 | ) | $ | 5,344 | $ | 675 | $ | 675 | $ | (1,350 | ) | $ | 5,344 | ||||||||||||||||
|
|
|
|
|
|
|
|
|
|
|
|
|
|
|
|
|
|
|
|||||||||||||||||||
| F-53 |
Table of Contents
Consolidating Statement of Operations
For The Fiscal Year Ended September 30, 2019
| WMG Acquisition Corp. (issuer) |
Guarantor Subsidiaries |
Non- Guarantor Subsidiaries |
Eliminations | WMG Acquisition Corp. Consolidated |
WMG Holdings Corp. |
Warner Music Group Corp. |
Eliminations | Warner Music Group Corp. Consolidated |
||||||||||||||||||||||||||||
| (in millions) | ||||||||||||||||||||||||||||||||||||
| Revenues |
$ | — | $ | 2,041 | $ | 2,804 | $ | (370 | ) | $ | 4,475 | $ | — | $ | — | $ | — | $ | 4,475 | |||||||||||||||||
| Costs and expenses: |
||||||||||||||||||||||||||||||||||||
| Cost of revenue |
— | (1,109 | ) | (1,603 | ) | 311 | (2,401 | ) | — | — | — | (2,401 | ) | |||||||||||||||||||||||
| Selling, general and administrative expenses |
— | (765 | ) | (804 | ) | 59 | (1,510 | ) | — | — | — | (1,510 | ) | |||||||||||||||||||||||
| Amortization of intangible assets |
— | (97 | ) | (111 | ) | — | (208 | ) | — | — | — | (208 | ) | |||||||||||||||||||||||
|
|
|
|
|
|
|
|
|
|
|
|
|
|
|
|
|
|
|
|||||||||||||||||||
| Total costs and expenses |
— | (1,971 | ) | (2,518 | ) | 370 | (4,119 | ) | — | — | — | (4,119 | ) | |||||||||||||||||||||||
|
|
|
|
|
|
|
|
|
|
|
|
|
|
|
|
|
|
|
|||||||||||||||||||
| Operating income |
— | 70 | 286 | — | 356 | — | — | — | 356 | |||||||||||||||||||||||||||
| Loss on extinguishment of debt |
(7 | ) | — | — | — | (7 | ) | — | — | — | (7 | ) | ||||||||||||||||||||||||
| Interest expense, net |
(71 | ) | (50 | ) | (21 | ) | — | (142 | ) | — | — | — | (142 | ) | ||||||||||||||||||||||
| Equity gains from consolidated subsidiaries |
311 | 185 | — | (496 | ) | — | 256 | 256 | (512 | ) | — | |||||||||||||||||||||||||
| Other income (expense), net |
32 | 56 | (28 | ) | — | 60 | — | — | — | 60 | ||||||||||||||||||||||||||
|
|
|
|
|
|
|
|
|
|
|
|
|
|
|
|
|
|
|
|||||||||||||||||||
| Income before income taxes |
265 | 261 | 237 | (496 | ) | 267 | 256 | 256 | (512 | ) | 267 | |||||||||||||||||||||||||
| Income tax (expense) benefit |
(9 | ) | 12 | (51 | ) | 39 | (9 | ) | — | — | — | (9 | ) | |||||||||||||||||||||||
|
|
|
|
|
|
|
|
|
|
|
|
|
|
|
|
|
|
|
|||||||||||||||||||
| Net income |
256 | 273 | 186 | (457 | ) | 258 | 256 | 256 | (512 | ) | 258 | |||||||||||||||||||||||||
| Less: Income attributable to noncontrolling interest |
— | — | (2 | ) | — | (2 | ) | — | — | — | (2 | ) | ||||||||||||||||||||||||
|
|
|
|
|
|
|
|
|
|
|
|
|
|
|
|
|
|
|
|||||||||||||||||||
| Net income attributable to Warner Music Group Corp. |
$ | 256 | $ | 273 | $ | 184 | $ | (457 | ) | $ | 256 | $ | 256 | $ | 256 | $ | (512 | ) | $ | 256 | ||||||||||||||||
|
|
|
|
|
|
|
|
|
|
|
|
|
|
|
|
|
|
|
|||||||||||||||||||
| F-54 |
Table of Contents
Consolidating Statement of Operations
For The Fiscal Year Ended September 30, 2018
| WMG Acquisition Corp. (issuer) |
Guarantor Subsidiaries |
Non- Guarantor Subsidiaries |
Eliminations | WMG Acquisition Corp. Consolidated |
WMG Holdings Corp. |
Warner Music Group Corp. |
Eliminations | Warner Music Group Corp. Consolidated |
||||||||||||||||||||||||||||
| (in millions) | ||||||||||||||||||||||||||||||||||||
| Revenues |
$ | — | $ | 2,284 | $ | 2,245 | $ | (524 | ) | $ | 4,005 | $ | — | $ | — | $ | — | $ | 4,005 | |||||||||||||||||
| Costs and expenses: |
||||||||||||||||||||||||||||||||||||
| Cost of revenue |
— | (1,090 | ) | (1,442 | ) | 361 | (2,171 | ) | — | — | — | (2,171 | ) | |||||||||||||||||||||||
| Selling, general and administrative expenses |
— | (1,040 | ) | (534 | ) | 163 | (1,411 | ) | — | — | — | (1,411 | ) | |||||||||||||||||||||||
| Amortization of intangible assets |
— | (96 | ) | (110 | ) | — | (206 | ) | — | — | — | (206 | ) | |||||||||||||||||||||||
|
|
|
|
|
|
|
|
|
|
|
|
|
|
|
|
|
|
|
|||||||||||||||||||
| Total costs and expenses |
— | (2,226 | ) | (2,086 | ) | 524 | (3,788 | ) | — | — | — | (3,788 | ) | |||||||||||||||||||||||
|
|
|
|
|
|
|
|
|
|
|
|
|
|
|
|
|
|
|
|||||||||||||||||||
| Operating income |
— | 58 | 159 | — | 217 | — | — | — | 217 | |||||||||||||||||||||||||||
| Loss on extinguishment of debt |
(31 | ) | — | — | — | (31 | ) | — | — | — | (31 | ) | ||||||||||||||||||||||||
| Interest (expense) income, net |
(116 | ) | 4 | (26 | ) | — | (138 | ) | — | — | — | (138 | ) | |||||||||||||||||||||||
| Equity gains from consolidated subsidiaries |
207 | 122 | — | (329 | ) | — | 307 | 307 | (614 | ) | — | |||||||||||||||||||||||||
| Other income, net |
377 | 7 | 10 | — | 394 | — | — | — | 394 | |||||||||||||||||||||||||||
|
|
|
|
|
|
|
|
|
|
|
|
|
|
|
|
|
|
|
|||||||||||||||||||
| Income before income taxes |
437 | 191 | 143 | (329 | ) | 442 | 307 | 307 | (614 | ) | 442 | |||||||||||||||||||||||||
| Income tax expense |
(130 | ) | (130 | ) | (39 | ) | 169 | (130 | ) | — | — | — | (130 | ) | ||||||||||||||||||||||
|
|
|
|
|
|
|
|
|
|
|
|
|
|
|
|
|
|
|
|||||||||||||||||||
| Net income |
307 | 61 | 104 | (160 | ) | 312 | 307 | 307 | (614 | ) | 312 | |||||||||||||||||||||||||
| Less: Income attributable to noncontrolling interest |
— | (1 | ) | (4 | ) | — | (5 | ) | — | — | — | (5 | ) | |||||||||||||||||||||||
|
|
|
|
|
|
|
|
|
|
|
|
|
|
|
|
|
|
|
|||||||||||||||||||
| Net income attributable to Warner Music Group Corp. |
$ | 307 | $ | 60 | $ | 100 | $ | (160 | ) | $ | 307 | $ | 307 | $ | 307 | $ | (614 | ) | $ | 307 | ||||||||||||||||
|
|
|
|
|
|
|
|
|
|
|
|
|
|
|
|
|
|
|
|||||||||||||||||||
| F-55 |
Table of Contents
Consolidating Statement of Operations
For The Fiscal Year Ended September 30, 2017
| WMG Acquisition Corp. (issuer) |
Guarantor Subsidiaries |
Non- Guarantor Subsidiaries |
Eliminations | WMG Acquisition Corp. Consolidated |
WMG Holdings Corp. |
Warner Music Group Corp. |
Eliminations | Warner Music Group Corp. Consolidated |
||||||||||||||||||||||||||||
| (in millions) | ||||||||||||||||||||||||||||||||||||
| Revenues |
$ | — | $ | 1,978 | $ | 2,008 | $ | (410 | ) | $ | 3,576 | $ | — | $ | — | $ | — | $ | 3,576 | |||||||||||||||||
| Costs and expenses: |
||||||||||||||||||||||||||||||||||||
| Cost of revenue |
— | (922 | ) | (1,275 | ) | 266 | (1,931 | ) | — | — | — | (1,931 | ) | |||||||||||||||||||||||
| Selling, general and administrative expenses |
(1 | ) | (900 | ) | (464 | ) | 143 | (1,222 | ) | — | — | — | (1,222 | ) | ||||||||||||||||||||||
| Amortization of intangible assets |
— | (100 | ) | (101 | ) | — | (201 | ) | — | — | — | (201 | ) | |||||||||||||||||||||||
|
|
|
|
|
|
|
|
|
|
|
|
|
|
|
|
|
|
|
|||||||||||||||||||
| Total costs and expenses |
(1 | ) | (1,922 | ) | (1,840 | ) | 409 | (3,354 | ) | — | — | — | (3,354 | ) | ||||||||||||||||||||||
|
|
|
|
|
|
|
|
|
|
|
|
|
|
|
|
|
|
|
|||||||||||||||||||
| Operating income (loss) |
(1 | ) | 56 | 168 | (1 | ) | 222 | — | — | — | 222 | |||||||||||||||||||||||||
| Loss on extinguishment of debt |
(35 | ) | — | — | — | (35 | ) | — | — | — | (35 | ) | ||||||||||||||||||||||||
| Interest (expense) income, net |
(95 | ) | 2 | (56 | ) | — | (149 | ) | — | — | — | (149 | ) | |||||||||||||||||||||||
| Equity gains from consolidated subsidiaries |
124 | 87 | — | (210 | ) | 1 | 143 | 143 | (286 | ) | 1 | |||||||||||||||||||||||||
| Other expense, net |
(1 | ) | (17 | ) | (23 | ) | — | (41 | ) | — | — | — | (41 | ) | ||||||||||||||||||||||
|
|
|
|
|
|
|
|
|
|
|
|
|
|
|
|
|
|
|
|||||||||||||||||||
| (Loss) income before income taxes |
(8 | ) | 128 | 89 | (211 | ) | (2 | ) | 143 | 143 | (286 | ) | (2 | ) | ||||||||||||||||||||||
| Income tax benefit (expense) |
151 | 154 | (30 | ) | (124 | ) | 151 | — | — | — | 151 | |||||||||||||||||||||||||
|
|
|
|
|
|
|
|
|
|
|
|
|
|
|
|
|
|
|
|||||||||||||||||||
| Net income |
143 | 282 | 59 | (335 | ) | 149 | 143 | 143 | (286 | ) | 149 | |||||||||||||||||||||||||
| Less: Income attributable to noncontrolling interest |
— | (1 | ) | (5 | ) | — | (6 | ) | — | — | — | (6 | ) | |||||||||||||||||||||||
|
|
|
|
|
|
|
|
|
|
|
|
|
|
|
|
|
|
|
|||||||||||||||||||
| Net income attributable to Warner Music Group Corp. |
$ | 143 | $ | 281 | $ | 54 | $ | (335 | ) | $ | 143 | $ | 143 | $ | 143 | $ | (286 | ) | $ | 143 | ||||||||||||||||
|
|
|
|
|
|
|
|
|
|
|
|
|
|
|
|
|
|
|
|||||||||||||||||||
| F-56 |
Table of Contents
Consolidating Statement of Comprehensive Income
For The Fiscal Year Ended September 30, 2019
| WMG Acquisition Corp. (issuer) |
Guarantor Subsidiaries |
Non- Guarantor Subsidiaries |
Eliminations | WMG Acquisition Corp. Consolidated |
WMG Holdings Corp. |
Warner Music Group Corp. |
Eliminations | Warner Music Group Corp. Consolidated |
||||||||||||||||||||||||||||
| (in millions) | ||||||||||||||||||||||||||||||||||||
| Net income |
$ | 256 | $ | 273 | $ | 186 | $ | (457 | ) | $ | 258 | $ | 256 | $ | 256 | $ | (512 | ) | $ | 258 | ||||||||||||||||
| Other comprehensive (loss) income, net of tax: |
||||||||||||||||||||||||||||||||||||
| Foreign currency adjustment |
(34 | ) | — | 34 | (34 | ) | (34 | ) | (36 | ) | (36 | ) | 72 | (34 | ) | |||||||||||||||||||||
| Deferred loss on derivative financial instruments |
(11 | ) | — | (11 | ) | 11 | (11 | ) | (11 | ) | (11 | ) | 22 | (11 | ) | |||||||||||||||||||||
| Minimum pension liability |
(5 | ) | — | — | — | (5 | ) | (5 | ) | (5 | ) | 10 | (5 | ) | ||||||||||||||||||||||
|
|
|
|
|
|
|
|
|
|
|
|
|
|
|
|
|
|
|
|||||||||||||||||||
| Other comprehensive (loss) income, net of tax |
(50 | ) | — | 23 | (23 | ) | (50 | ) | (52 | ) | (52 | ) | 104 | (50 | ) | |||||||||||||||||||||
|
|
|
|
|
|
|
|
|
|
|
|
|
|
|
|
|
|
|
|||||||||||||||||||
| Total comprehensive income |
206 | 273 | 209 | (480 | ) | 208 | 204 | 204 | (408 | ) | 208 | |||||||||||||||||||||||||
| Less: Income attributable to noncontrolling interest |
— | — | (2 | ) | — | (2 | ) | — | — | — | (2 | ) | ||||||||||||||||||||||||
|
|
|
|
|
|
|
|
|
|
|
|
|
|
|
|
|
|
|
|||||||||||||||||||
| Comprehensive income attributable to Warner Music Group Corp. |
$ | 206 | $ | 273 | $ | 207 | $ | (480 | ) | $ | 206 | $ | 204 | $ | 204 | $ | (408 | ) | $ | 206 | ||||||||||||||||
|
|
|
|
|
|
|
|
|
|
|
|
|
|
|
|
|
|
|
|||||||||||||||||||
| F-57 |
Table of Contents
Consolidating Statement of Comprehensive Income
For The Fiscal Year Ended September 30, 2018
| WMG Acquisition Corp. (issuer) |
Guarantor Subsidiaries |
Non- Guarantor Subsidiaries |
Eliminations | WMG Acquisition Corp. Consolidated |
WMG Holdings Corp. |
Warner Music Group Corp. |
Eliminations | Warner Music Group Corp. Consolidated |
||||||||||||||||||||||||||||
| (in millions) | ||||||||||||||||||||||||||||||||||||
| Net income |
$ | 307 | $ | 61 | $ | 104 | $ | (160 | ) | $ | 312 | $ | 307 | $ | 307 | $ | (614 | ) | $ | 312 | ||||||||||||||||
| Other comprehensive (loss) income, net of tax: |
||||||||||||||||||||||||||||||||||||
| Foreign currency adjustment |
(13 | ) | — | 13 | (13 | ) | (13 | ) | (13 | ) | (13 | ) | 26 | (13 | ) | |||||||||||||||||||||
| Deferred gain on derivative financial instruments |
3 | — | 3 | (3 | ) | 3 | 3 | 3 | (6 | ) | 3 | |||||||||||||||||||||||||
| Minimum pension liability |
1 | — | 1 | (1 | ) | 1 | 1 | 1 | (2 | ) | 1 | |||||||||||||||||||||||||
|
|
|
|
|
|
|
|
|
|
|
|
|
|
|
|
|
|
|
|||||||||||||||||||
| Other comprehensive (loss) income, net of tax |
(9 | ) | — | 17 | (17 | ) | (9 | ) | (9 | ) | (9 | ) | 18 | (9 | ) | |||||||||||||||||||||
|
|
|
|
|
|
|
|
|
|
|
|
|
|
|
|
|
|
|
|||||||||||||||||||
| Total comprehensive income |
298 | 61 | 121 | (177 | ) | 303 | 298 | 298 | (596 | ) | 303 | |||||||||||||||||||||||||
| Less: Income attributable to noncontrolling interest |
— | (1 | ) | (4 | ) | — | (5 | ) | — | — | — | (5 | ) | |||||||||||||||||||||||
|
|
|
|
|
|
|
|
|
|
|
|
|
|
|
|
|
|
|
|||||||||||||||||||
| Comprehensive income attributable to Warner Music Group Corp. |
$ | 298 | $ | 60 | $ | 117 | $ | (177 | ) | $ | 298 | $ | 298 | $ | 298 | $ | (596 | ) | $ | 298 | ||||||||||||||||
|
|
|
|
|
|
|
|
|
|
|
|
|
|
|
|
|
|
|
|||||||||||||||||||
| F-58 |
Table of Contents
Consolidating Statement of Comprehensive Income
For The Fiscal Year Ended September 30, 2017
| WMG Acquisition Corp. (issuer) |
Guarantor Subsidiaries |
Non- Guarantor Subsidiaries |
Eliminations | WMG Acquisition Corp. Consolidated |
WMG Holdings Corp. |
Warner Music Group Corp. |
Eliminations | Warner Music Group Corp. Consolidated |
||||||||||||||||||||||||||||
| (in millions) | ||||||||||||||||||||||||||||||||||||
| Net income |
$ | 143 | $ | 282 | $ | 59 | $ | (335 | ) | $ | 149 | $ | 143 | $ | 143 | $ | (286 | ) | $ | 149 | ||||||||||||||||
| Other comprehensive income (loss), net of tax: |
||||||||||||||||||||||||||||||||||||
| Foreign currency adjustment |
30 | — | (30 | ) | 30 | 30 | 32 | 32 | (64 | ) | 30 | |||||||||||||||||||||||||
| Deferred loss on derivative financial instruments |
— | (1 | ) | — | 1 | — | — | — | — | — | ||||||||||||||||||||||||||
| Minimum pension liability |
7 | — | 7 | (7 | ) | 7 | 7 | 7 | (14 | ) | 7 | |||||||||||||||||||||||||
|
|
|
|
|
|
|
|
|
|
|
|
|
|
|
|
|
|
|
|||||||||||||||||||
| Other comprehensive income (loss), net of tax |
37 | (1 | ) | (23 | ) | 24 | 37 | 39 | 39 | (78 | ) | 37 | ||||||||||||||||||||||||
|
|
|
|
|
|
|
|
|
|
|
|
|
|
|
|
|
|
|
|||||||||||||||||||
| Total comprehensive income |
180 | 281 | 36 | (311 | ) | 186 | 182 | 182 | (364 | ) | 186 | |||||||||||||||||||||||||
| Less: Income attributable to noncontrolling interest |
— | (1 | ) | (5 | ) | — | (6 | ) | — | — | — | (6 | ) | |||||||||||||||||||||||
|
|
|
|
|
|
|
|
|
|
|
|
|
|
|
|
|
|
|
|||||||||||||||||||
| Comprehensive income attributable to Warner Music Group Corp. |
$ | 180 | $ | 280 | $ | 31 | $ | (311 | ) | $ | 180 | $ | 182 | $ | 182 | $ | (364 | ) | $ | 180 | ||||||||||||||||
|
|
|
|
|
|
|
|
|
|
|
|
|
|
|
|
|
|
|
|||||||||||||||||||
| F-59 |
Table of Contents
Consolidating Statement of Cash Flows
For The Fiscal Year Ended September 30, 2019
| WMG Acquisition Corp. (issuer) |
Guarantor Subsidiaries |
Non- Guarantor Subsidiaries |
Eliminations | WMG Acquisition Corp. Consolidated |
WMG Holdings Corp. |
Warner Music Group Corp. |
Eliminations | Warner Music Group Corp. Consolidated |
||||||||||||||||||||||||||||
| (in millions) | ||||||||||||||||||||||||||||||||||||
| Cash flows from operating activities |
||||||||||||||||||||||||||||||||||||
| Net income |
$ | 256 | $ | 273 | $ | 186 | $ | (457 | ) | $ | 258 | $ | 256 | $ | 256 | $ | (512 | ) | $ | 258 | ||||||||||||||||
| Adjustments to reconcile net income to net cash provided by operating activities: |
||||||||||||||||||||||||||||||||||||
| Depreciation and amortization |
— | 138 | 131 | — | 269 | — | — | — | 269 | |||||||||||||||||||||||||||
| Unrealized (gains) losses and remeasurement of foreign-denominated loans |
(43 | ) | — | 15 | — | (28 | ) | — | — | — | (28 | ) | ||||||||||||||||||||||||
| Deferred income taxes |
— | — | (68 | ) | — | (68 | ) | — | — | — | (68 | ) | ||||||||||||||||||||||||
| Loss on extinguishment of debt |
7 | — | — | — | 7 | — | — | — | 7 | |||||||||||||||||||||||||||
| Net gain on divestitures and investments |
— | (18 | ) | (2 | ) | — | (20 | ) | — | — | — | (20 | ) | |||||||||||||||||||||||
| Non-cash interest expense |
6 | — | — | — | 6 | — | — | — | 6 | |||||||||||||||||||||||||||
| Equity-based compensation expense |
— | 50 | — | — | 50 | — | — | — | 50 | |||||||||||||||||||||||||||
| Equity gains, including distributions |
(311 | ) | (185 | ) | — | 496 | — | (256 | ) | (256 | ) | 512 | — | |||||||||||||||||||||||
| Changes in operating assets and liabilities: |
||||||||||||||||||||||||||||||||||||
| Accounts receivable, net |
— | 10 | (100 | ) | — | (90 | ) | — | — | — | (90 | ) | ||||||||||||||||||||||||
| Inventories |
— | 7 | (4 | ) | — | 3 | — | — | — | 3 | ||||||||||||||||||||||||||
| Royalty advances |
— | (77 | ) | (33 | ) | — | (110 | ) | — | — | — | (110 | ) | |||||||||||||||||||||||
| Accounts payable and accrued liabilities |
— | 315 | (273 | ) | (39 | ) | 3 | — | — | — | 3 | |||||||||||||||||||||||||
| Royalty payables |
— | (68 | ) | 198 | — | 130 | — | — | — | 130 | ||||||||||||||||||||||||||
| Accrued interest |
3 | — | — | — | 3 | — | — | — | 3 | |||||||||||||||||||||||||||
| Deferred revenue |
— | (53 | ) | 49 | — | (4 | ) | — | — | — | (4 | ) | ||||||||||||||||||||||||
| Other balance sheet changes |
8 | (41 | ) | 24 | — | (9 | ) | — | — | — | (9 | ) | ||||||||||||||||||||||||
|
|
|
|
|
|
|
|
|
|
|
|
|
|
|
|
|
|
|
|||||||||||||||||||
| Net cash (used in) provided by operating activities |
(74 | ) | 351 | 123 | — | 400 | — | — | — | 400 | ||||||||||||||||||||||||||
|
|
|
|
|
|
|
|
|
|
|
|
|
|
|
|
|
|
|
|||||||||||||||||||
| Cash flows from investing activities |
||||||||||||||||||||||||||||||||||||
| Acquisition of music publishing rights and music catalogs, net |
— | (24 | ) | (17 | ) | — | (41 | ) | — | — | — | (41 | ) | |||||||||||||||||||||||
| Capital expenditures |
— | (85 | ) | (19 | ) | — | (104 | ) | — | — | — | (104 | ) | |||||||||||||||||||||||
| Investments and acquisitions of businesses, net of cash received |
— | (42 | ) | (189 | ) | — | (231 | ) | — | — | — | (231 | ) | |||||||||||||||||||||||
| Advance to Issuer |
(111 | ) | — | — | 111 | — | — | — | — | — | ||||||||||||||||||||||||||
|
|
|
|
|
|
|
|
|
|
|
|
|
|
|
|
|
|
|
|||||||||||||||||||
| Net cash used in investing activities |
(111 | ) | (151 | ) | (225 | ) | 111 | (376 | ) | — | — | — | (376 | ) | ||||||||||||||||||||||
|
|
|
|
|
|
|
|
|
|
|
|
|
|
|
|
|
|
|
|||||||||||||||||||
| Cash flows from financing activities |
||||||||||||||||||||||||||||||||||||
| Dividend by Acquisition Corp. to Holdings Corp. |
— | (94 | ) | — | — | (94 | ) | — | — | — | (94 | ) | ||||||||||||||||||||||||
| Proceeds from issuance of Acquisition Corp. 3.625% Senior Notes due 2026 |
514 | — | — | — | 514 | — | — | — | 514 | |||||||||||||||||||||||||||
| Repayment of Acquisition Corp. 4.125% Senior Secured Notes |
(40 | ) | — | — | — | (40 | ) | — | — | — | (40 | ) | ||||||||||||||||||||||||
| Repayment of Acquisition Corp. 4.875% Senior Secured Notes |
(30 | ) | — | — | — | (30 | ) | — | — | — | (30 | ) | ||||||||||||||||||||||||
| Repayment of Acquisition Corp. 5.625% Senior Secured Notes |
(247 | ) | — | — | — | (247 | ) | — | — | — | (247 | ) | ||||||||||||||||||||||||
| Call premiums paid on early redemption of debt |
(5 | ) | — | — | — | (5 | ) | — | — | — | (5 | ) | ||||||||||||||||||||||||
| Deferred financing costs paid |
(7 | ) | — | — | — | (7 | ) | — | — | — | (7 | ) | ||||||||||||||||||||||||
| Distribution to noncontrolling interest holder |
— | — | (3 | ) | — | (3 | ) | — | — | — | (3 | ) | ||||||||||||||||||||||||
| Change in due to (from) issuer |
— | 111 | — | (111 | ) | — | — | — | — | — | ||||||||||||||||||||||||||
|
|
|
|
|
|
|
|
|
|
|
|
|
|
|
|
|
|
|
|||||||||||||||||||
| Net cash provided by (used in) financing activities |
185 | 17 | (3 | ) | (111 | ) | 88 | — | — | — | 88 | |||||||||||||||||||||||||
|
|
|
|
|
|
|
|
|
|
|
|
|
|
|
|
|
|
|
|||||||||||||||||||
| Effect of exchange rate changes on cash and equivalents |
— | — | (7 | ) | — | (7 | ) | — | — | — | (7 | ) | ||||||||||||||||||||||||
|
|
|
|
|
|
|
|
|
|
|
|
|
|
|
|
|
|
|
|||||||||||||||||||
| Net increase (decrease) in cash and equivalents |
— | 217 | (112 | ) | — | 105 | — | — | — | 105 | ||||||||||||||||||||||||||
| Cash and equivalents at beginning of period |
— | 169 | 345 | — | 514 | — | — | — | 514 | |||||||||||||||||||||||||||
|
|
|
|
|
|
|
|
|
|
|
|
|
|
|
|
|
|
|
|||||||||||||||||||
| Cash and equivalents at end of period |
$ | — | $ | 386 | $ | 233 | $ | — | $ | 619 | $ | — | $ | — | $ | — | $ | 619 | ||||||||||||||||||
|
|
|
|
|
|
|
|
|
|
|
|
|
|
|
|
|
|
|
|||||||||||||||||||
| F-60 |
Table of Contents
Consolidating Statement of Cash Flows
For The Fiscal Year Ended September 30, 2018
| WMG Acquisition Corp. (issuer) |
Guarantor Subsidiaries |
Non- Guarantor Subsidiaries |
Eliminations | WMG Acquisition Corp. Consolidated |
WMG Holdings Corp. |
Warner Music Group Corp. |
Eliminations | Warner Music Group Corp. Consolidated |
||||||||||||||||||||||||||||
| (in millions) | ||||||||||||||||||||||||||||||||||||
| Cash flows from operating activities |
||||||||||||||||||||||||||||||||||||
| Net income |
$ | 307 | $ | 61 | $ | 104 | $ | (160 | ) | $ | 312 | $ | 307 | $ | 307 | $ | (614 | ) | $ | 312 | ||||||||||||||||
| Adjustments to reconcile net income to net cash provided by operating activities: |
||||||||||||||||||||||||||||||||||||
| Depreciation and amortization |
— | 136 | 125 | — | 261 | — | — | — | 261 | |||||||||||||||||||||||||||
| Unrealized gains/losses and remeasurement of foreign-denominated loans |
(3 | ) | — | — | — | (3 | ) | — | — | — | (3 | ) | ||||||||||||||||||||||||
| Deferred income taxes |
— | — | 66 | — | 66 | — | — | — | 66 | |||||||||||||||||||||||||||
| Loss on extinguishment of debt |
31 | — | — | — | 31 | — | — | — | 31 | |||||||||||||||||||||||||||
| Net loss (gain) on divestitures and investments |
(504 | ) | 78 | 37 | — | (389 | ) | — | — | — | (389 | ) | ||||||||||||||||||||||||
| Non-cash interest expense |
6 | — | — | — | 6 | — | — | — | 6 | |||||||||||||||||||||||||||
| Equity-based compensation expense |
— | 62 | — | — | 62 | — | — | — | 62 | |||||||||||||||||||||||||||
| Equity losses (gains), including distributions |
(207 | ) | (122 | ) | — | 329 | — | (307 | ) | (307 | ) | 614 | — | |||||||||||||||||||||||
| Changes in operating assets and liabilities: |
||||||||||||||||||||||||||||||||||||
| Accounts receivable, net |
— | (48 | ) | 5 | — | (43 | ) | — | — | — | (43 | ) | ||||||||||||||||||||||||
| Inventories |
— | (5 | ) | 2 | — | (3 | ) | — | — | — | (3 | ) | ||||||||||||||||||||||||
| Royalty advances |
— | 24 | 7 | — | 31 | — | — | — | 31 | |||||||||||||||||||||||||||
| Accounts payable and accrued liabilities |
— | 449 | (198 | ) | (169 | ) | 82 | — | — | — | 82 | |||||||||||||||||||||||||
| Royalty payables |
— | 48 | (26 | ) | — | 22 | — | — | — | 22 | ||||||||||||||||||||||||||
| Accrued interest |
(10 | ) | — | — | — | (10 | ) | — | — | — | (10 | ) | ||||||||||||||||||||||||
| Deferred revenue |
— | (48 | ) | 44 | — | (4 | ) | — | — | — | (4 | ) | ||||||||||||||||||||||||
| Other balance sheet changes |
— | 89 | (85 | ) | — | 4 | — | — | — | 4 | ||||||||||||||||||||||||||
|
|
|
|
|
|
|
|
|
|
|
|
|
|
|
|
|
|
|
|||||||||||||||||||
| Net cash (used in) provided by operating activities |
(380 | ) | 724 | 81 | — | 425 | — | — | — | 425 | ||||||||||||||||||||||||||
|
|
|
|
|
|
|
|
|
|
|
|
|
|
|
|
|
|
|
|||||||||||||||||||
| Cash flows from investing activities |
||||||||||||||||||||||||||||||||||||
| Acquisition of music publishing rights, net |
— | (11 | ) | (3 | ) | — | (14 | ) | — | — | — | (14 | ) | |||||||||||||||||||||||
| Capital expenditures |
— | (60 | ) | (14 | ) | — | (74 | ) | — | — | — | (74 | ) | |||||||||||||||||||||||
| Investments and acquisitions of businesses, net |
— | (17 | ) | (6 | ) | — | (23 | ) | — | — | — | (23 | ) | |||||||||||||||||||||||
| Divestitures, net |
504 | 12 | — | — | 516 | — | — | — | 516 | |||||||||||||||||||||||||||
| Advance to Issuer |
(99 | ) | — | — | 99 | — | — | — | — | — | ||||||||||||||||||||||||||
|
|
|
|
|
|
|
|
|
|
|
|
|
|
|
|
|
|
|
|||||||||||||||||||
| Net cash provided by (used in) investing activities |
405 | (76 | ) | (23 | ) | 99 | 405 | — | — | — | 405 | |||||||||||||||||||||||||
|
|
|
|
|
|
|
|
|
|
|
|
|
|
|
|
|
|
|
|||||||||||||||||||
| Cash flows from financing activities |
||||||||||||||||||||||||||||||||||||
| Dividend by Acquisition Corp. to Holdings Corp. |
— | (925 | ) | — | — | (925 | ) | — | — | — | (925 | ) | ||||||||||||||||||||||||
| Proceeds from issuance of Acquisition Corp. 5.500% Senior Notes |
325 | — | — | — | 325 | — | — | — | 325 | |||||||||||||||||||||||||||
| Proceeds from issuance of Acquisition Corp. Senior Term Loan Facility |
320 | — | — | — | 320 | — | — | — | 320 | |||||||||||||||||||||||||||
| Repayment of Acquisition Corp. 6.750% Senior Secured Notes |
(635 | ) | — | — | — | (635 | ) | — | — | — | (635 | ) | ||||||||||||||||||||||||
| Call premiums paid on early redemption of debt |
(23 | ) | — | — | — | (23 | ) | — | — | — | (23 | ) | ||||||||||||||||||||||||
| Deferred financing costs paid |
(12 | ) | — | — | — | (12 | ) | — | — | — | (12 | ) | ||||||||||||||||||||||||
| Distribution to noncontrolling interest holder |
— | — | (5 | ) | — | (5 | ) | — | — | — | (5 | ) | ||||||||||||||||||||||||
| Change in due (from) to issuer |
— | 99 | — | (99 | ) | — | — | — | — | — | ||||||||||||||||||||||||||
|
|
|
|
|
|
|
|
|
|
|
|
|
|
|
|
|
|
|
|||||||||||||||||||
| Net cash used in financing activities |
(25 | ) | (826 | ) | (5 | ) | (99 | ) | (955 | ) | — | — | — | (955 | ) | |||||||||||||||||||||
|
|
|
|
|
|
|
|
|
|
|
|
|
|
|
|
|
|
|
|||||||||||||||||||
| Effect of exchange rate changes on cash and equivalents |
— | — | (8 | ) | — | (8 | ) | — | — | — | (8 | ) | ||||||||||||||||||||||||
|
|
|
|
|
|
|
|
|
|
|
|
|
|
|
|
|
|
|
|||||||||||||||||||
| Net increase in cash and equivalents |
— | (178 | ) | 45 | — | (133 | ) | — | — | — | (133 | ) | ||||||||||||||||||||||||
| Cash and equivalents at beginning of period |
— | 347 | 300 | — | 647 | — | — | — | 647 | |||||||||||||||||||||||||||
|
|
|
|
|
|
|
|
|
|
|
|
|
|
|
|
|
|
|
|||||||||||||||||||
| Cash and equivalents at end of period |
$ | — | $ | 169 | $ | 345 | $ | — | $ | 514 | $ | — | $ | — | $ | — | $ | 514 | ||||||||||||||||||
|
|
|
|
|
|
|
|
|
|
|
|
|
|
|
|
|
|
|
|||||||||||||||||||
| F-61 |
Table of Contents
Consolidating Statement of Cash Flows
For The Fiscal Year Ended September 30, 2017
| WMG Acquisition Corp. (issuer) |
Guarantor Subsidiaries |
Non- Guarantor Subsidiaries |
Eliminations | WMG Acquisition Corp. Consolidated |
WMG Holdings Corp. |
Warner Music Group Corp. |
Eliminations | Warner Music Group Corp. Consolidated |
||||||||||||||||||||||||||||
| (in millions) | ||||||||||||||||||||||||||||||||||||
| Cash flows from operating activities |
||||||||||||||||||||||||||||||||||||
| Net income |
$ | 143 | $ | 282 | $ | 59 | $ | (335 | ) | $ | 149 | $ | 143 | $ | 143 | $ | (286 | ) | $ | 149 | ||||||||||||||||
| Adjustments to reconcile net income to net cash provided by operating activities: |
||||||||||||||||||||||||||||||||||||
| Depreciation and amortization |
— | 137 | 114 | — | 251 | — | — | — | 251 | |||||||||||||||||||||||||||
| Unrealized gains/losses and remeasurement of foreign-denominated loans |
27 | — | (3 | ) | — | 24 | — | — | — | 24 | ||||||||||||||||||||||||||
| Deferred income taxes |
2 | — | (194 | ) | — | (192 | ) | — | — | — | (192 | ) | ||||||||||||||||||||||||
| Loss on extinguishment of debt |
35 | — | — | — | 35 | — | — | — | 35 | |||||||||||||||||||||||||||
| Net loss (gain) on divestitures and investments |
— | 33 | (16 | ) | — | 17 | — | — | — | 17 | ||||||||||||||||||||||||||
| Non-cash interest expense |
8 | — | — | — | 8 | — | — | — | 8 | |||||||||||||||||||||||||||
| Equity-based compensation expense |
— | 70 | — | — | 70 | — | — | — | 70 | |||||||||||||||||||||||||||
| Equity losses (gains), including distributions |
(124 | ) | (86 | ) | — | 210 | — | (143 | ) | (143 | ) | 286 | — | |||||||||||||||||||||||
| Changes in operating assets and liabilities: |
||||||||||||||||||||||||||||||||||||
| Accounts receivable, net |
— | (37 | ) | (23 | ) | — | (60 | ) | — | — | — | (60 | ) | |||||||||||||||||||||||
| Inventories |
— | 2 | (1 | ) | — | 1 | — | — | — | 1 | ||||||||||||||||||||||||||
| Royalty advances |
— | 2 | 15 | — | 17 | — | — | — | 17 | |||||||||||||||||||||||||||
| Accounts payable and accrued liabilities |
(120 | ) | (4 | ) | 47 | 125 | 48 | — | — | — | 48 | |||||||||||||||||||||||||
| Royalty payables |
— | 126 | 10 | — | 136 | — | — | — | 136 | |||||||||||||||||||||||||||
| Accrued interest |
3 | — | — | — | 3 | — | — | — | 3 | |||||||||||||||||||||||||||
| Deferred revenue |
— | (6 | ) | 28 | — | 22 | — | — | — | 22 | ||||||||||||||||||||||||||
| Other balance sheet changes |
5 | (204 | ) | 205 | — | 6 | — | — | — | 6 | ||||||||||||||||||||||||||
|
|
|
|
|
|
|
|
|
|
|
|
|
|
|
|
|
|
|
|||||||||||||||||||
| Net cash (used in) provided by operating activities |
(21 | ) | 315 | 241 | — | 535 | — | — | — | 535 | ||||||||||||||||||||||||||
|
|
|
|
|
|
|
|
|
|
|
|
|
|
|
|
|
|
|
|||||||||||||||||||
| Cash flows from investing activities |
||||||||||||||||||||||||||||||||||||
| Acquisition of music publishing rights, net |
— | (9 | ) | (7 | ) | — | (16 | ) | — | — | — | (16 | ) | |||||||||||||||||||||||
| Capital expenditures |
— | (31 | ) | (13 | ) | — | (44 | ) | — | — | — | (44 | ) | |||||||||||||||||||||||
| Investments and acquisitions of businesses, net |
— | (6 | ) | (133 | ) | — | (139 | ) | — | — | — | (139 | ) | |||||||||||||||||||||||
| Divestitures, net |
— | 42 | 31 | — | 73 | — | — | — | 73 | |||||||||||||||||||||||||||
| Advance to Issuer |
60 | — | — | (60 | ) | — | — | — | — | — | ||||||||||||||||||||||||||
|
|
|
|
|
|
|
|
|
|
|
|
|
|
|
|
|
|
|
|||||||||||||||||||
| Net cash provided by (used in) investing activities |
60 | (4 | ) | (122 | ) | (60 | ) | (126 | ) | — | — | — | (126 | ) | ||||||||||||||||||||||
|
|
|
|
|
|
|
|
|
|
|
|
|
|
|
|
|
|
|
|||||||||||||||||||
| Cash flows from financing activities |
||||||||||||||||||||||||||||||||||||
| Dividend by Acquisition Corp. to Holdings Corp. |
— | (84 | ) | — | — | (84 | ) | 84 | — | — | — | |||||||||||||||||||||||||
| Proceeds from issuance of Acquisition Corp. 4.125% Senior Secured Notes |
380 | — | — | — | 380 | — | — | — | 380 | |||||||||||||||||||||||||||
| Proceeds from issuance of Acquisition Corp. 4.875% Senior Secured Notes |
250 | — | — | — | 250 | — | — | — | 250 | |||||||||||||||||||||||||||
| Proceeds from issuance of Acquisition Corp. Senior Term Loan Facility |
22 | — | — | — | 22 | — | — | — | 22 | |||||||||||||||||||||||||||
| Repayment of Acquisition Corp. 6.000% Senior Secured Notes |
(450 | ) | — | — | — | (450 | ) | — | — | — | (450 | ) | ||||||||||||||||||||||||
| Repayment of Acquisition Corp. 6.250% Senior Secured Notes |
(173 | ) | — | — | — | (173 | ) | — | — | — | (173 | ) | ||||||||||||||||||||||||
| Repayment of Acquisition Corp. 5.625% Senior Secured Notes |
(28 | ) | — | — | — | (28 | ) | — | — | — | (28 | ) | ||||||||||||||||||||||||
| Call premiums paid on early redemption of debt |
(27 | ) | — | — | — | (27 | ) | — | — | — | (27 | ) | ||||||||||||||||||||||||
| Deferred financing costs paid |
(13 | ) | — | — | — | (13 | ) | — | — | — | (13 | ) | ||||||||||||||||||||||||
| Distribution to noncontrolling interest holder |
— | — | (5 | ) | — | (5 | ) | — | — | — | (5 | ) | ||||||||||||||||||||||||
| Dividends paid |
— | — | — | — | — | (84 | ) | — | — | (84 | ) | |||||||||||||||||||||||||
| Change in due (from) to issuer |
— | (60 | ) | — | 60 | — | — | — | — | — | ||||||||||||||||||||||||||
|
|
|
|
|
|
|
|
|
|
|
|
|
|
|
|
|
|
|
|||||||||||||||||||
| Net cash (used in) provided by financing activities |
(39 | ) | (144 | ) | (5 | ) | 60 | (128 | ) | — | — | — | (128 | ) | ||||||||||||||||||||||
|
|
|
|
|
|
|
|
|
|
|
|
|
|
|
|
|
|
|
|||||||||||||||||||
| Effect of exchange rate changes on cash and equivalents |
— | — | 7 | — | 7 | — | — | — | 7 | |||||||||||||||||||||||||||
|
|
|
|
|
|
|
|
|
|
|
|
|
|
|
|
|
|
|
|||||||||||||||||||
| Net increase in cash and equivalents |
— | 167 | 121 | — | 288 | — | — | — | 288 | |||||||||||||||||||||||||||
| Cash and equivalents at beginning of period |
— | 180 | 179 | — | 359 | — | — | — | 359 | |||||||||||||||||||||||||||
|
|
|
|
|
|
|
|
|
|
|
|
|
|
|
|
|
|
|
|||||||||||||||||||
| Cash and equivalents at end of period |
$ | — | $ | 347 | $ | 300 | $ | — | $ | 647 | $ | — | $ | — | $ | — | $ | 647 | ||||||||||||||||||
|
|
|
|
|
|
|
|
|
|
|
|
|
|
|
|
|
|
|
|||||||||||||||||||
| F-62 |
Table of Contents
WARNER MUSIC GROUP CORP.
Schedule II—Valuation and Qualifying Accounts
| Description |
Balance at Beginning of Period |
Additions Charged to Cost and Expenses |
Deductions | Balance at End of Period |
||||||||||||
| (in millions) | ||||||||||||||||
| Year Ended September 30, 2019 |
||||||||||||||||
| Allowance for doubtful accounts |
$ | 18 | $ | 3 | $ | (4 | ) | $ | 17 | |||||||
| Reserves for sales returns |
28 | 88 | (93 | ) | 23 | |||||||||||
| Allowance for deferred tax asset |
206 | 4 | (119 | ) | 91 | |||||||||||
| Year Ended September 30, 2018 |
||||||||||||||||
| Allowance for doubtful accounts |
$ | 18 | $ | 4 | $ | (4 | ) | $ | 18 | |||||||
| Reserves for sales returns |
33 | 108 | (113 | ) | 28 | |||||||||||
| Allowance for deferred tax asset |
193 | 33 | (20 | ) | 206 | |||||||||||
| Year Ended September 30, 2017 |
||||||||||||||||
| Allowance for doubtful accounts |
$ | 19 | $ | 3 | $ | (4 | ) | $ | 18 | |||||||
| Reserves for sales returns |
33 | 119 | (119 | ) | 33 | |||||||||||
| Allowance for deferred tax asset |
310 | 23 | (140 | ) | 193 | |||||||||||
F-63
Table of Contents
Consolidated Balance Sheets (Unaudited)
| March 31, 2020 |
September 30, 2019 |
|||||||
| (in millions, except share data) | ||||||||
| Assets |
||||||||
| Current assets: |
||||||||
| Cash and equivalents |
$ | 484 | $ | 619 | ||||
| Accounts receivable, net of allowances of $21 million and $17 million |
763 | 775 | ||||||
| Inventories |
65 | 74 | ||||||
| Royalty advances expected to be recouped within one year |
189 | 170 | ||||||
| Prepaid and other current assets |
82 | 53 | ||||||
|
|
|
|
|
|||||
| Total current assets |
1,583 | 1,691 | ||||||
| Royalty advances expected to be recouped after one year |
232 | 208 | ||||||
| Property, plant and equipment, net |
294 | 300 | ||||||
| Operating lease right-of-use assets, net |
281 | — | ||||||
| Goodwill |
1,761 | 1,761 | ||||||
| Intangible assets subject to amortization, net |
1,644 | 1,723 | ||||||
| Intangible assets not subject to amortization |
151 | 151 | ||||||
| Deferred tax assets, net |
55 | 38 | ||||||
| Other assets |
123 | 145 | ||||||
|
|
|
|
|
|||||
| Total assets |
$ | 6,124 | $ | 6,017 | ||||
|
|
|
|
|
|||||
| Liabilities and Deficit |
||||||||
| Current liabilities: |
||||||||
| Accounts payable |
$ | 246 | $ | 260 | ||||
| Accrued royalties |
1,591 | 1,567 | ||||||
| Accrued liabilities |
564 | 492 | ||||||
| Accrued interest |
34 | 34 | ||||||
| Operating lease liabilities, current |
39 | — | ||||||
| Deferred revenue |
167 | 180 | ||||||
| Other current liabilities |
91 | 286 | ||||||
|
|
|
|
|
|||||
| Total current liabilities |
2,732 | 2,819 | ||||||
| Long-term debt |
2,983 | 2,974 | ||||||
| Operating lease liabilities, noncurrent |
312 | — | ||||||
| Deferred tax liabilities, net |
154 | 172 | ||||||
| Other noncurrent liabilities |
228 | 321 | ||||||
|
|
|
|
|
|||||
| Total liabilities |
$ | 6,409 | $ | 6,286 | ||||
|
|
|
|
|
|||||
| Equity: |
||||||||
| Common A stock ($0.001 par value; 1,000,000,000 shares authorized; 0 and 0 shares issued and outstanding as of March 31, 2020 and September 30, 2019, respectively) |
$ | — | $ | — | ||||
| Common B stock ($0.001 par value; 1,000,000,000 shares authorized; 510,000,000 and 505,830,022 issued and outstanding as of March 31, 2020 and September 30, 2019, respectively) |
1 | 1 | ||||||
| Additional paid-in capital |
1,127 | 1,127 | ||||||
| Accumulated deficit |
(1,166 | ) | (1,177 | ) | ||||
| Accumulated other comprehensive loss, net |
(268 | ) | (240 | ) | ||||
|
|
|
|
|
|||||
| Total Warner Music Group Corp. deficit |
(306 | ) | (289 | ) | ||||
| Noncontrolling interest |
21 | 20 | ||||||
|
|
|
|
|
|||||
| Total deficit |
(285 | ) | (269 | ) | ||||
|
|
|
|
|
|||||
| Total liabilities and deficit |
$ | 6,124 | $ | 6,017 | ||||
|
|
|
|
|
|||||
See accompanying notes
F-64
Table of Contents
Consolidated Statements of Operations (Unaudited)
| Three Months Ended March 31, |
Six Months Ended March 31, |
|||||||||||||||
| 2020 | 2019 | 2020 | 2019 | |||||||||||||
| (in millions, except share and per share data) | ||||||||||||||||
| Revenue |
$ | 1,071 | $ | 1,090 | $ | 2,327 | $ | 2,293 | ||||||||
| Costs and expenses: |
||||||||||||||||
| Cost of revenue |
(535 | ) | (559 | ) | (1,200 | ) | (1,185 | ) | ||||||||
| Selling, general and administrative expenses (a) |
(538 | ) | (354 | ) | (917 | ) | (730 | ) | ||||||||
| Amortization expense |
(47 | ) | (55 | ) | (94 | ) | (109 | ) | ||||||||
|
|
|
|
|
|
|
|
|
|||||||||
| Total costs and expenses |
(1,120 | ) | (968 | ) | (2,211 | ) | (2,024 | ) | ||||||||
|
|
|
|
|
|
|
|
|
|||||||||
| Operating (loss) income |
(49 | ) | 122 | 116 | 269 | |||||||||||
| Loss on extinguishment of debt |
— | — | — | (3 | ) | |||||||||||
| Interest expense, net |
(33 | ) | (36 | ) | (66 | ) | (72 | ) | ||||||||
| Other (expense) income |
(4 | ) | 29 | (9 | ) | 57 | ||||||||||
|
|
|
|
|
|
|
|
|
|||||||||
| (Loss) income before income taxes |
(86 | ) | 115 | 41 | 251 | |||||||||||
| Income tax benefit (expense) |
12 | (48 | ) | 7 | (98 | ) | ||||||||||
|
|
|
|
|
|
|
|
|
|||||||||
| Net (loss) income |
(74 | ) | 67 | 48 | 153 | |||||||||||
| Less: Income attributable to noncontrolling interest |
— | — | (2 | ) | — | |||||||||||
|
|
|
|
|
|
|
|
|
|||||||||
| Net (loss) income attributable to Warner Music Group Corp. |
$ | (74 | ) | $ | 67 | $ | 46 | $ | 153 | |||||||
|
|
|
|
|
|
|
|
|
|||||||||
| (a) Includes depreciation expense: |
$ | (14 | ) | $ | (14 | ) | $ | (38 | ) | $ | (28 | ) | ||||
|
|
|
|
|
|
|
|
|
|||||||||
| Net (loss) income per share attributable to Warner Music Group Corp.’s stockholders: |
||||||||||||||||
| Basic and Diluted |
$ | (0.15 | ) | $ | 0.13 | $ | 0.09 | $ | 0.30 | |||||||
|
|
|
|
|
|
|
|
|
|||||||||
| Weighted average common shares: |
||||||||||||||||
| Basic and Diluted |
501,991,944 | 501,991,944 | 501,991,944 | 501,991,944 | ||||||||||||
See accompanying notes
F-65
Table of Contents
Consolidated Statements of Comprehensive Income (Unaudited)
| Three Months Ended March 31, |
Six Months Ended March 31, |
|||||||||||||||
| 2020 | 2019 | 2020 | 2019 | |||||||||||||
| (in millions) | ||||||||||||||||
| Net (loss) income |
$ | (74 | ) | $ | 67 | $ | 48 | $ | 153 | |||||||
| Other comprehensive loss, net of tax: |
||||||||||||||||
| Foreign currency adjustment |
(15 | ) | (10 | ) | (8 | ) | (26 | ) | ||||||||
| Deferred loss on derivative financial instruments |
(23 | ) | (3 | ) | (20 | ) | (9 | ) | ||||||||
|
|
|
|
|
|
|
|
|
|||||||||
| Other comprehensive loss, net of tax |
(38 | ) | (13 | ) | (28 | ) | (35 | ) | ||||||||
|
|
|
|
|
|
|
|
|
|||||||||
| Total comprehensive (loss) income |
(112 | ) | 54 | 20 | 118 | |||||||||||
| Less: Income attributable to noncontrolling interest |
— | — | (2 | ) | — | |||||||||||
|
|
|
|
|
|
|
|
|
|||||||||
| Comprehensive (loss) income attributable to Warner Music Group Corp. |
$ | (112 | ) | $ | 54 | $ | 18 | $ | 118 | |||||||
|
|
|
|
|
|
|
|
|
|||||||||
See accompanying notes
F-66
Table of Contents
Consolidated Statements of Cash Flows (Unaudited)
| Six Months Ended March 31, |
||||||||
| 2020 | 2019 | |||||||
| (in millions) | ||||||||
| Cash flows from operating activities |
||||||||
| Net income |
$ | 48 | $ | 153 | ||||
| Adjustments to reconcile net income to net cash provided by operating activities: |
||||||||
| Depreciation and amortization |
132 | 137 | ||||||
| Unrealized gains and remeasurement of foreign-denominated loans and foreign currency forward exchange contracts |
(7 | ) | (24 | ) | ||||
| Deferred income taxes |
(31 | ) | 27 | |||||
| Loss on extinguishment of debt |
— | 3 | ||||||
| Net loss (gain) on divestitures and investments |
15 | (32 | ) | |||||
| Non-cash interest expense |
3 | 3 | ||||||
| Equity-based compensation expense |
160 | 14 | ||||||
| Changes in operating assets and liabilities: |
||||||||
| Accounts receivable, net |
6 | (90 | ) | |||||
| Inventories |
9 | 13 | ||||||
| Royalty advances |
(47 | ) | (61 | ) | ||||
| Accounts payable and accrued liabilities |
(109 | ) | (100 | ) | ||||
| Royalty payables |
38 | 46 | ||||||
| Accrued interest |
— | 1 | ||||||
| Operating lease liabilities |
(2 | ) | — | |||||
| Deferred revenue |
(14 | ) | (19 | ) | ||||
| Other balance sheet changes |
(37 | ) | 28 | |||||
|
|
|
|
|
|||||
| Net cash provided by operating activities |
164 | 99 | ||||||
|
|
|
|
|
|||||
| Cash flows from investing activities |
||||||||
| Acquisition of music publishing rights and music catalogs, net |
(18 | ) | (16 | ) | ||||
| Capital expenditures |
(28 | ) | (59 | ) | ||||
| Investments and acquisitions of businesses, net of cash received |
(5 | ) | (218 | ) | ||||
|
|
|
|
|
|||||
| Net cash used in investing activities |
(51 | ) | (293 | ) | ||||
|
|
|
|
|
|||||
| Cash flows from financing activities |
||||||||
| Proceeds from issuance of Acquisition Corp. 3.625% Senior Secured Notes |
— | 287 | ||||||
| Repayment of Acquisition Corp. 4.125% Senior Secured Notes |
— | (40 | ) | |||||
| Repayment of Acquisition Corp. 4.875% Senior Secured Notes |
— | (30 | ) | |||||
| Repayment of Acquisition Corp. 5.625% Senior Secured Notes |
— | (27 | ) | |||||
| Call premiums paid and deposit on early redemption of debt |
— | (2 | ) | |||||
| Deferred financing costs paid |
— | (4 | ) | |||||
| Distribution to noncontrolling interest holder |
(1 | ) | (2 | ) | ||||
| Dividends paid |
(244 | ) | (31 | ) | ||||
|
|
|
|
|
|||||
| Net cash (used in) provided by financing activities |
(245 | ) | 151 | |||||
|
|
|
|
|
|||||
| Effect of exchange rate changes on cash and equivalents |
(3 | ) | (1 | ) | ||||
|
|
|
|
|
|||||
| Net decrease in cash and equivalents |
(135 | ) | (44 | ) | ||||
| Cash and equivalents at beginning of period |
619 | 514 | ||||||
|
|
|
|
|
|||||
| Cash and equivalents at end of period |
$ | 484 | $ | 470 | ||||
|
|
|
|
|
|||||
See accompanying notes
F-67
Table of Contents
Consolidated Statements of Deficit (Unaudited)
Six Months Ended March 31, 2020
| Class A Common Stock |
Class B Common Stock |
Additional Paid-in Capital |
Accumulated Deficit |
Accumulated Other Comprehensive Loss |
Total Warner Music Group Corp. Deficit |
Noncontrolling Interest |
Total Deficit |
|||||||||||||||||||||||||||||||||
| Shares | Value | Shares | Value | |||||||||||||||||||||||||||||||||||||
| (in millions, except share and per share data) | ||||||||||||||||||||||||||||||||||||||||
| Balance at September 30, 2019 |
— | $ | — | 505,830,022 | $ | 1 | $ | 1,127 | $ | (1,177 | ) | $ | (240 | ) | $ | (289 | ) | $ | 20 | $ | (269 | ) | ||||||||||||||||||
| Cumulative effect of ASC 842 adoption |
— | — | — | — | — | 7 | — | 7 | — | 7 | ||||||||||||||||||||||||||||||
| Cumulative effect of ASC 718 accounting policy change |
— | — | — | — | — | 33 | — | 33 | — | 33 | ||||||||||||||||||||||||||||||
| Net income |
— | — | — | — | — | 46 | — | 46 | 2 | 48 | ||||||||||||||||||||||||||||||
| Other comprehensive loss, net of tax |
— | — | — | — | — | — | (28 | ) | (28 | ) | — | (28 | ) | |||||||||||||||||||||||||||
| Dividends ($0.15 per share) |
— | — | — | — | — | (75 | ) | — | (75 | ) | — | (75 | ) | |||||||||||||||||||||||||||
| Distribution to noncontrolling interest holders |
— | — | — | — | — | — | — | — | (1 | ) | (1 | ) | ||||||||||||||||||||||||||||
| Other |
— | — | 4,169,978 | — | — | — | — | — | — | — | ||||||||||||||||||||||||||||||
|
|
|
|
|
|
|
|
|
|
|
|
|
|
|
|
|
|
|
|
|
|||||||||||||||||||||
| Balance at March 31, 2020 |
— | $ | — | 510,000,000 | $ | 1 | $ | 1,127 | $ | (1,166 | ) | $ | (268 | ) | $ | (306 | ) | $ | 21 | $ | (285 | ) | ||||||||||||||||||
|
|
|
|
|
|
|
|
|
|
|
|
|
|
|
|
|
|
|
|
|
|||||||||||||||||||||
Three Months Ended March 31, 2020
| Class A Common Stock |
Class B Common Stock |
Additional Paid-in Capital |
Accumulated Deficit |
Accumulated Other Comprehensive Loss |
Total Warner Music Group Corp. Deficit |
Noncontrolling Interest |
Total Deficit |
|||||||||||||||||||||||||||||||||
| Shares | Value | Shares | Value | |||||||||||||||||||||||||||||||||||||
| (in millions, except share and per share data) | ||||||||||||||||||||||||||||||||||||||||
| Balance at December 31, 2019 |
— | $ | — | 510,000,000 | $ | 1 | $ | 1,127 | $ | (1,088 | ) | $ | (230 | ) | $ | (190 | ) | $ | 21 | $ | (169 | ) | ||||||||||||||||||
| Cumulative effect of ASC 718 accounting policy change |
— | — | — | — | — | 33 | — | 33 | — | 33 | ||||||||||||||||||||||||||||||
| Net loss |
— | — | — | — | — | (74 | ) | — | (74 | ) | — | (74 | ) | |||||||||||||||||||||||||||
| Other comprehensive loss, net of tax |
— | — | — | — | — | — | (38 | ) | (38 | ) | — | (38 | ) | |||||||||||||||||||||||||||
| Dividends ($0.07 per share) |
— | — | — | — | — | (37 | ) | — | (37 | ) | — | (37 | ) | |||||||||||||||||||||||||||
| Distribution to noncontrolling interest holders |
— | — | — | — | — | — | — | — | — | — | ||||||||||||||||||||||||||||||
| Other |
— | — | — | — | — | — | — | — | — | — | ||||||||||||||||||||||||||||||
|
|
|
|
|
|
|
|
|
|
|
|
|
|
|
|
|
|
|
|
|
|||||||||||||||||||||
| Balance at March 31, 2020 |
— | $ | — | 510,000,000 | $ | 1 | $ | 1,127 | $ | (1,166 | ) | $ | (268 | ) | $ | (306 | ) | $ | 21 | $ | (285 | ) | ||||||||||||||||||
|
|
|
|
|
|
|
|
|
|
|
|
|
|
|
|
|
|
|
|
|
|||||||||||||||||||||
F-68
Table of Contents
Six Months Ended March 31, 2019
| Class A Common Stock |
Class B Common Stock |
Additional Paid-in Capital |
Accumulated Deficit |
Accumulated Other Comprehensive Loss |
Total Warner Music Group Corp. Deficit |
Noncontrolling Interest |
Total Deficit |
|||||||||||||||||||||||||||||||||
| Shares | Value | Shares | Value | |||||||||||||||||||||||||||||||||||||
| (in millions, except share and per share data) | ||||||||||||||||||||||||||||||||||||||||
| Balance at September 30, 2018 |
— | $ | — | 501,991,944 | $ | 1 | $ | 1,127 | $ | (1,272 | ) | $ | (190 | ) | $ | (334 | ) | $ | 14 | $ | (320 | ) | ||||||||||||||||||
| Cumulative effect of ASC 606 adoption |
— | — | — | — | — | 139 | — | 139 | 11 | 150 | ||||||||||||||||||||||||||||||
| Net income |
— | — | — | — | — | 153 | — | 153 | — | 153 | ||||||||||||||||||||||||||||||
| Other comprehensive loss, net of tax |
— | — | — | — | — | — | (35 | ) | (35 | ) | — | (35 | ) | |||||||||||||||||||||||||||
| Dividends ($0.12 per share) |
— | — | — | — | — | (63 | ) | — | (63 | ) | — | (63 | ) | |||||||||||||||||||||||||||
| Distribution to noncontrolling interest holders |
— | — | — | — | — | — | — | — | (2 | ) | (2 | ) | ||||||||||||||||||||||||||||
| Other |
— | — | 3,838,078 | — | — | — | — | — | (3 | ) | (3 | ) | ||||||||||||||||||||||||||||
|
|
|
|
|
|
|
|
|
|
|
|
|
|
|
|
|
|
|
|
|
|||||||||||||||||||||
| Balance at March 31, 2019 |
— | $ | — | 505,830,022 | $ | 1 | $ | 1,127 | $ | (1,043 | ) | $ | (225 | ) | $ | (140 | ) | $ | 20 | $ | (120 | ) | ||||||||||||||||||
|
|
|
|
|
|
|
|
|
|
|
|
|
|
|
|
|
|
|
|
|
|||||||||||||||||||||
Three Months Ended March 31, 2019
| Class A Common Stock |
Class B Common Stock |
Additional Paid-in Capital |
Accumulated Deficit |
Accumulated Other Comprehensive Loss |
Total Warner Music Group Corp. Deficit |
Noncontrolling Interest |
Total Deficit |
|||||||||||||||||||||||||||||||||
| Shares | Value | Shares | Value | |||||||||||||||||||||||||||||||||||||
| (in millions, except share and per share data) | ||||||||||||||||||||||||||||||||||||||||
| Balance at December 31, 2018 |
— | $ | — | 505,830,022 | $ | 1 | $ | 1,127 | $ | (1,078 | ) | $ | (212 | ) | $ | (162 | ) | $ | 23 | $ | (139 | ) | ||||||||||||||||||
| Net income |
— | — | — | — | — | 67 | — | 67 | — | 67 | ||||||||||||||||||||||||||||||
| Other comprehensive loss, net of tax |
— | — | — | — | — | — | (13 | ) | (13 | ) | — | (13 | ) | |||||||||||||||||||||||||||
| Dividends ($0.06 per share) |
— | — | — | — | — | (32 | ) | — | (32 | ) | — | (32 | ) | |||||||||||||||||||||||||||
| Distribution to noncontrolling interest holders |
— | — | — | — | — | — | — | — | — | — | ||||||||||||||||||||||||||||||
| Other |
— | — | — | — | — | — | — | — | (3 | ) | (3 | ) | ||||||||||||||||||||||||||||
|
|
|
|
|
|
|
|
|
|
|
|
|
|
|
|
|
|
|
|
|
|||||||||||||||||||||
| Balance at March 31, 2019 |
— | $ | — | 505,830,022 | $ | 1 | $ | 1,127 | $ | (1,043 | ) | $ | (225 | ) | $ | (140 | ) | $ | 20 | $ | (120 | ) | ||||||||||||||||||
|
|
|
|
|
|
|
|
|
|
|
|
|
|
|
|
|
|
|
|
|
|||||||||||||||||||||
See accompanying notes
F-69
Table of Contents
Notes to Consolidated Interim Financial Statements (Unaudited)
1. Description of Business
Warner Music Group Corp. (the “Company”) was formed on November 21, 2003. The Company is the direct parent of WMG Holdings Corp. (“Holdings”), which is the direct parent of WMG Acquisition Corp. (“Acquisition Corp.”). Acquisition Corp. is one of the world’s major music entertainment companies.
Acquisition of Warner Music Group by Access Industries
Pursuant to the Agreement and Plan of Merger, dated as of May 6, 2011 (the “Merger Agreement”), by and among the Company, AI Entertainment Holdings LLC (formerly Airplanes Music LLC), a Delaware limited liability company (“Parent”) and an affiliate of Access Industries, Inc. (“Access”), and Airplanes Merger Sub, Inc., a Delaware corporation and a wholly owned subsidiary of Parent (“Merger Sub”), on July 20, 2011 (the “Merger Closing Date”), Merger Sub merged with and into the Company with the Company surviving as a wholly owned subsidiary of Parent (the “Merger”). In connection with the Merger, the Company delisted its common stock from the New York Stock Exchange (the “NYSE”).
The Company continues to voluntarily file with the U.S. Securities and Exchange Commission (the “SEC”) current and periodic reports that would be required to be filed with the SEC pursuant to Section 15(d) of the Securities Exchange Act of 1934, as amended (the “Exchange Act”) as provided for in certain covenants contained in the instruments covering its outstanding indebtedness. All of the Company’s common stock is owned by affiliates of Access.
On February 6, 2020, the Company filed a Form S-1 registration statement with the SEC for an initial public offering (“IPO”). The completion of the proposed IPO will depend on, among other things, the SEC review process and customary regulatory approvals, as well as market conditions. There can be no assurance that the proposed IPO will occur.
Recorded Music Operations
Our Recorded Music business primarily consists of the discovery and development of recording artists and the related marketing, promotion, distribution, sale and licensing of music created by such recording artists. We play an integral role in virtually all aspects of the recorded music value chain from discovering and developing talent to producing, distributing and selling music to marketing and promoting recording artists and their music.
In the United States, our Recorded Music business is conducted principally through our major record labels—Atlantic Records and Warner Records. In October 2018, we launched Elektra Music Group in the United States as a standalone label group, which comprises the Elektra, Fueled by Ramen and Roadrunner labels. Our Recorded Music business also includes Rhino Entertainment, a division that specializes in marketing our recorded music catalog through compilations, reissuances of previously released music and video titles and releasing previously unreleased material from our vault. We also conduct our Recorded Music business through a collection of additional record labels including Asylum, Big Beat, Canvasback, East West, Erato, FFRR, Nonesuch, Parlophone, Reprise, Sire, Spinnin’, Warner Classics and Warner Music Nashville.
Outside the United States, our Recorded Music business is conducted in more than 70 countries through various subsidiaries, affiliates and non-affiliated licensees. Internationally, we engage in the same activities as in the United States: discovering and signing artists and distributing, selling, marketing and promoting their music. In most cases, we also market, promote, distribute and sell the music of those recording artists for whom our domestic record labels have international rights. In certain smaller markets, we license the right to distribute and sell our music to non-affiliated third-party record labels.
F-70
Table of Contents
Our Recorded Music business’ distribution operations include Warner-Elektra-Atlantic Corporation (“WEA Corp.”), which markets, distributes and sells music and video products to retailers and wholesale distributors; Alternative Distribution Alliance (“ADA”), which markets, distributes and sells the products of independent labels to retail and wholesale distributors; and various distribution centers and ventures operated internationally.
In addition to our music being sold in physical retail outlets, our music is also sold in physical form to online physical retailers, such as Amazon.com, barnesandnoble.com and bestbuy.com, and distributed in digital form to an expanded universe of digital partners, including streaming services such as those of Amazon, Apple, Deezer, SoundCloud, Spotify, Tencent Music Entertainment Group and YouTube, radio services such as iHeart Radio and SiriusXM and download services.
We have integrated the marketing of digital content into all aspects of our business, including artist and repertoire (“A&R”) and distribution. Our business development executives work closely with A&R departments to ensure that while music is being produced, digital assets are also created with all distribution channels in mind, including streaming services, social networking sites, online portals and music-centered destinations. We also work side-by-side with our online and mobile partners to test new concepts. We believe existing and new digital businesses will be a significant source of growth and will provide new opportunities to successfully monetize our assets and create new revenue streams. The proportion of digital revenues attributable to each distribution channel varies by region and proportions may change as the introduction of new technologies continues. As one of the world’s largest music entertainment companies, we believe we are well positioned to take advantage of growth in digital distribution and emerging technologies to maximize the value of our assets.
We have diversified our revenues beyond our traditional businesses by entering into expanded-rights deals with recording artists in order to partner with such artists in other aspects of their careers. Under these agreements, we provide services to and participate in recording artists’ activities outside the traditional recorded music business such as touring, merchandising and sponsorships. We have built and acquired artist services capabilities and platforms for marketing and distributing this broader set of music-related rights and participating more widely in the monetization of the artist brands we help create. We believe that entering into expanded-rights deals and enhancing our artist services capabilities in areas such as merchandising, VIP ticketing, fan clubs, concert promotion and management has permitted us to diversify revenue streams and capitalize on other revenue opportunities. This provides for improved long-term relationships with our recording artists and allows us to more effectively connect recording artists and fans.
Music Publishing Operations
While Recorded Music is focused on marketing, promoting, distributing and licensing a particular recording of a musical composition, Music Publishing is an intellectual property business focused on generating revenue from uses of the musical composition itself. In return for promoting, placing, marketing and administering the creative output of a songwriter, or engaging in those activities for other rightsholders, our Music Publishing business garners a share of the revenues generated from use of the musical compositions.
The operations of our Music Publishing business are conducted principally through Warner Chappell Music, our global music publishing company headquartered in Los Angeles with operations in over 70 countries through various subsidiaries, affiliates, and non-affiliated licensees and sub-publishers. We own or control rights to more than 1.4 million musical compositions, including numerous pop hits, American standards, folk songs and motion picture and theatrical compositions. Assembled over decades, our award-winning catalog includes over 80,000 songwriters and composers and a diverse range of genres including pop, rock, jazz, classical, country, R&B, hip-hop, rap, reggae, Latin, folk, blues, symphonic, soul, Broadway, techno, alternative and gospel. Warner Chappell Music also administers the music and soundtracks of several third-party television and film producers and studios. We have an extensive production music catalog collectively branded as Warner Chappell Production Music.
F-71
Table of Contents
2. Summary of Significant Accounting Policies
Interim Financial Statements
The accompanying unaudited consolidated financial statements have been prepared in accordance with United States generally accepted accounting principles (“U.S. GAAP”) for interim financial information and with the instructions to Form 10-Q and Article 10 of Regulation S-X. Accordingly, they do not include all the information and notes required by U.S. GAAP for complete financial statements. In the opinion of management, all adjustments (consisting of normal recurring accruals) considered necessary for a fair presentation have been included. Operating results for the three and six months ended March 31, 2020 are not necessarily indicative of the results that may be expected for the fiscal year ending September 30, 2020.
The consolidated balance sheet at September 30, 2019 has been derived from the audited consolidated financial statements at that date but does not include all the information and notes required by U.S. GAAP for complete financial statements.
For further information, refer to the consolidated financial statements and notes thereto included in our Annual Report on Form 10-K for the fiscal year ended September 30, 2019 (File No. 001-32502).
Basis of Consolidation
The accompanying financial statements present the consolidated accounts of all entities in which the Company has a controlling voting interest and/or variable interest required to be consolidated in accordance with U.S. GAAP. All intercompany balances and transactions have been eliminated.
Financial Accounting Standards Board (“FASB”) Accounting Standards Codification (“ASC”) Topic 810, Consolidation (“ASC 810”) requires the Company first evaluate its investments to determine if any investments qualify as a variable interest entity (“VIE”). A VIE is consolidated if the Company is deemed to be the primary beneficiary of the VIE, which is the party involved with the VIE that has both (i) the power to control the most significant activities of the VIE and (ii) either the obligation to absorb losses or the right to receive benefits that could potentially be significant to the VIE. If an entity is not deemed to be a VIE, the Company consolidates the entity if the Company has a controlling voting interest.
The Company maintains a 52-53 week fiscal year ending on the last Friday in each reporting period. As such, all references to March 31, 2020 and March 31, 2019 relate to the periods ended March 27, 2020 and March 29, 2019, respectively. For convenience purposes, the Company continues to date its second-quarter financial statements as of March 31. The fiscal year ended September 30, 2019 ended on September 27, 2019.
The Company has performed a review of all subsequent events through the date the financial statements were issued and has determined that no additional disclosures are necessary.
Common Stock
On February 28, 2020, the Company amended its certificate of incorporation to increase its authorized capital stock to 2,100,000,000 shares, consisting of 1,000,000,000 shares of Class A common stock, par value $0.001 per share, 1,000,000,000 shares of Class B common stock, par value $0.001 per share, and 100,000,000 shares of preferred stock, par value $1.00 per share. In addition, the February 28, 2020 amendment to the Company’s certificate of incorporation also gave effect to the reclassification and 477,242.614671815-for-1 stock split of the Company’s existing common stock outstanding into 510,000,000 shares of Class B common stock. This stock split has been retrospectively presented throughout the interim financial statements.
Earnings per Share
The consolidated statements of operations present basic and diluted earnings per share (“EPS”). Basic and diluted earnings (loss) per share is computed by dividing net income (loss) available to common stockholders by
F-72
Table of Contents
the weighted average number of outstanding common shares less shares issued for the exercise of the deferred equity units. The deferred equity units are mandatorily redeemable and as such are excluded from the denominator of the basic and diluted EPS calculation. The Company did not have any dilutive securities for the three and six months ended March 31, 2020 and March 31, 2019.
Share-Based Compensation
The Company accounts for share-based payments as required by ASC 718, Compensation—Stock Compensation (“ASC 718”). Under the recognition provision of ASC 718, the Company’s liability classified share-based compensation costs are measured each reporting date until settlement. In February 2020, the Company filed a Form S-1 registration statement with the SEC for a proposed IPO, which required a change in accounting policy during the quarter from the intrinsic value method to fair value method in determining the basis of measurement of its share-based compensation liability.
In determining fair value, the Company utilized an option pricing model for those awards with an option-like pay-off, which includes various inputs for volatility, term to exit, discount for lack of marketability, expected dividend yield and risk-free rates. For awards with an equity-like pay-off, inputs for discount of lack of marketability and non-performance risk were considered. The Company continued to use an income approach using a discounted cash flow model to determine its per-share value input within the model. As a result of this change in accounting policy, the Company recorded a decrease to its share-based compensation liability of $38 million, which resulted in a decrease of $33 million, net of tax, to accumulated deficit as of March 31, 2020.
Income Taxes
The Company uses the estimated annual effective tax rate method in computing its interim tax provision. Certain items, including those deemed to be unusual and infrequent are excluded from the estimated annual effective tax rate. In such cases, the actual tax expense or benefit is reported in the same period as the related item. Certain tax effects are also not reflected in the estimated annual effective tax rate, primarily certain changes in the realizability of deferred tax assets and uncertain tax positions.
New Accounting Pronouncements
Recently Adopted Accounting Pronouncements
In February 2016, the FASB issued ASU 2016-02, Leases (“ASU 2016-02”), which established a new ASC Topic 842 (“ASC 842”) that introduces a right-of-use (“ROU”) model that requires a lessee to record a ROU asset and a lease liability on the balance sheet for all leases with terms longer than 12 months. Leases are classified as either finance or operating, with classification affecting the pattern of expense recognition in the statement of operations. In July 2018, the FASB issued ASU 2018-11, Leases — Targeted Improvements (“ASU 2018-11”), which allows for retrospective application with the recognition of a cumulative-effect adjustment to the opening balance of retained earnings in the period of adoption. Under this option, entities do not need to apply ASC 842 (along with its disclosure requirements) to the comparative prior periods presented. The Company adopted ASU 2016-02 on October 1, 2019, using the modified retrospective transition method provided by ASU 2018-11. The adoption of ASU 2016-02 resulted in the recognition of operating lease liabilities of $366 million and ROU assets of $297 million, which is net of the historical deferred rent liability balance of $69 million, primarily related to real estate leases. The Company also recorded a decrease to opening accumulated deficit of $7 million, net of taxes, related to previously deferred gains related to sale-leaseback transactions.
Upon transition, the Company adopted the “package of three” practical expedient provided by ASC 842 and therefore has not (1) reassessed whether any expired or existing contracts are or contain a lease, (2) reassessed the lease classification for expired or existing leases and (3) reassessed initial direct costs for any existing leases. Rather, the Company will retain the conclusions reached for these items under ASC 840.
F-73
Table of Contents
In August 2017, the FASB issued ASU 2017-12, Targeted Improvements to Accounting for Hedging Activities (“ASU 2017-12”). This ASU improves certain aspects of the hedge accounting model including making more risk management strategies eligible for hedge accounting and simplifying the assessment of hedge effectiveness. ASU 2017-12 is effective for all annual periods beginning after December 15, 2018 and interim periods within those fiscal years. Early adoption is permitted and requires a prospective adoption with a cumulative-effect adjustment to accumulated deficit as of the beginning of the fiscal year of adoption for existing hedging relationships. The Company adopted ASU 2017-12 in the first quarter of fiscal 2020 and this adoption did not have a significant impact on the Company’s financial statements.
Accounting Pronouncements Not Yet Adopted
In June 2016, the FASB issued ASU 2016-13, Financial Instruments—Credit Losses: Measurement of Credit Losses on Financial Instruments (“ASU 2016-13”). ASU 2016-13 requires that expected credit losses relating to financial assets measured on an amortized cost basis and available-for-sale debt securities be recorded through an allowance for credit losses. ASU 2016-13 limits the amount of credit losses to be recognized for available-for-sale debt securities to the amount by which carrying value exceeds fair value and also requires the reversal of previously recognized credit losses if fair value increases. ASU 2016-13 will be effective for annual periods beginning after December 15, 2019, and interim periods within those fiscal years. Earlier adoption is permitted. The Company is evaluating the impact of the adoption of this standard on its consolidated financial statements.
In December 2019, the FASB issued ASU 2019-12, Simplifying the Accounting for Income Taxes (“ASU 2019-12”). This ASU eliminates certain exceptions to the general principles in ASC 740, Income Taxes. Specifically, it eliminates the exception to (1) the incremental approach for intraperiod tax allocation when there is a loss from continuing operations, and income or a gain from other items; (2) the requirement to recognize a deferred tax liability for equity method investments when a foreign subsidiary becomes an equity method investment; (3) the ability not to recognize a deferred tax liability for a foreign subsidiary when a foreign equity method investment becomes a subsidiary; and (4) the general methodology for calculating income taxes in an interim period when a year-to-date loss exceeds the anticipated loss for the year. ASU 2019-12 also simplifies U.S. GAAP by making other changes. ASU 2019-12 will be effective for the annual periods beginning after December 15, 2021, and for interim periods beginning after December 15, 2022. Earlier adoption is permitted. The Company is evaluating the impact of the adoption of this standard on its consolidated financial statements.
3. Revenue Recognition
For our operating segments, Recorded Music and Music Publishing, the Company accounts for a contract when it has legally enforceable rights and obligations and collectability of consideration is probable. The Company identifies the performance obligations and determines the transaction price associated with the contract, which is then allocated to each performance obligation, using management’s best estimate of standalone selling price for arrangements with multiple performance obligations. Revenue is recognized when, or as, control of the promised services or goods is transferred to the Company’s customers, and in an amount that reflects the consideration the Company is contractually due in exchange for those services or goods. An estimate of variable consideration is included in the transaction price if, in the Company’s judgment, it is probable that a significant future reversal of cumulative revenue under the contract will not occur. Certain of the Company’s arrangements include licenses of intellectual property with consideration in the form of sales- and usage-based royalties. Royalty revenue is recognized when the subsequent sale or usage occurs using the best estimates available of the amounts that will be received by the Company.
F-74
Table of Contents
Disaggregation of Revenue
The Company’s revenue consists of the following categories, which aggregate into the segments – Recorded Music and Music Publishing:
| For the Three Months Ended March 31, |
For the Six Months Ended March 31, |
|||||||||||||||
| 2020 | 2019 | 2020 | 2019 | |||||||||||||
| (in millions) | (in millions) | |||||||||||||||
| Revenue by Type |
||||||||||||||||
| Digital |
$ | 626 | $ | 597 | $ | 1,259 | $ | 1,160 | ||||||||
| Physical |
94 | 130 | 278 | 361 | ||||||||||||
|
|
|
|
|
|
|
|
|
|||||||||
| Total Digital and Physical |
720 | 727 | 1,537 | 1,521 | ||||||||||||
| Artist services and expanded-rights |
115 | 134 | 303 | 300 | ||||||||||||
| Licensing |
72 | 72 | 151 | 153 | ||||||||||||
|
|
|
|
|
|
|
|
|
|||||||||
| Total Recorded Music |
907 | 933 | 1,991 | 1,974 | ||||||||||||
| Performance |
41 | 46 | 87 | 99 | ||||||||||||
| Digital |
74 | 65 | 147 | 130 | ||||||||||||
| Mechanical |
15 | 13 | 30 | 28 | ||||||||||||
| Synchronization |
34 | 31 | 70 | 60 | ||||||||||||
| Other |
2 | 3 | 5 | 6 | ||||||||||||
|
|
|
|
|
|
|
|
|
|||||||||
| Total Music Publishing |
166 | 158 | 339 | 323 | ||||||||||||
| Intersegment eliminations |
(2 | ) | (1 | ) | (3 | ) | (4 | ) | ||||||||
|
|
|
|
|
|
|
|
|
|||||||||
| Total Revenues |
$ | 1,071 | $ | 1,090 | $ | 2,327 | $ | 2,293 | ||||||||
|
|
|
|
|
|
|
|
|
|||||||||
| Revenue by Geographical Location |
||||||||||||||||
| U.S. Recorded Music |
$ | 380 | $ | 410 | $ | 833 | $ | 841 | ||||||||
| U.S. Music Publishing |
87 | 75 | 168 | 148 | ||||||||||||
|
|
|
|
|
|
|
|
|
|||||||||
| Total U.S. |
467 | 485 | 1,001 | 989 | ||||||||||||
| International Recorded Music |
527 | 523 | 1,158 | 1,133 | ||||||||||||
| International Music Publishing |
79 | 83 | 171 | 175 | ||||||||||||
|
|
|
|
|
|
|
|
|
|||||||||
| Total International |
606 | 606 | 1,329 | 1,308 | ||||||||||||
| Intersegment eliminations |
(2 | ) | (1 | ) | (3 | ) | (4 | ) | ||||||||
|
|
|
|
|
|
|
|
|
|||||||||
| Total Revenues |
$ | 1,071 | $ | 1,090 | $ | 2,327 | $ | 2,293 | ||||||||
|
|
|
|
|
|
|
|
|
|||||||||
Recorded Music
Recorded Music mainly involves selling, marketing, distribution and licensing of recorded music produced by the Company’s recording artists. Recorded Music revenues are derived from four main sources, which include digital, physical, artist services and expanded-rights and licensing.
Digital revenues are generated from the expanded universe of digital partners, including digital streaming services and download services. These licenses typically contain a single performance obligation, which is ongoing access to all intellectual property in an evolving content library, predicated on: (1) the business practice and contractual ability to remove specific content without a requirement to replace the content and without impact to minimum royalty guarantees and (2) the contracts not containing a specific listing of content subject to the license. Digital licensing contracts are generally long-term with consideration in the form of sales- and usage-based royalties that are typically received monthly. Certain contracts contain non-recoupable fixed fees or minimum guarantees, which are recoupable against royalties. Upon contract inception, the Company will assess
F-75
Table of Contents
whether a shortfall or breakage is expected (i.e., where the minimum guarantee will not be recouped through royalties) in order to determine timing of revenue recognition for the fixed fee or minimum guarantee.
For fixed fee and minimum guarantee contracts where breakage is expected, the total transaction price (fixed fee or minimum guarantee) is recognized proportionately over the contract term using an appropriate measure of progress which is typically based on the Company’s digital partner’s subscribers or streaming activity as these are measures of access to an evolving catalog, or on a straight-line basis. The Company updates its assessment of the transaction price each reporting period to see if anticipated royalty earnings exceed the minimum guarantee. For contracts where breakage is not expected, royalties are recognized as revenue as sales or usage occurs based upon the licensee’s usage reports and, when these reports are not available, revenue is based on historical data, industry information and other relevant trends.
Additionally, for certain licenses where the consideration is fixed and the intellectual property being licensed is static, revenue is recognized at the point in time when control of the licensed content is transferred to the customer.
Physical revenues are generated from the sale of physical products such as vinyl, CDs and DVDs. Revenues from the sale of physical Recorded Music products are recognized upon transfer of control to the customer, which typically occurs once the product has been shipped and the ability to direct use and obtain substantially all of the benefit from the asset have been transferred. In accordance with industry practice and as is customary in many territories, certain products, such as CDs and DVDs, are sold to customers with the right to return unsold items. Revenues from such sales are generally recognized upon shipment based on gross sales less a provision for future estimated returns.
Artist services and expanded-rights revenues are generated from artist services businesses and participations in expanded-rights associated with artists, including sponsorship, fan clubs, artist websites, merchandising, touring, concert promotion, ticketing and artist and brand management. Artist services and expanded-rights contracts are generally short term. Revenue is recognized as or when services are provided (e.g., at time of an artist’s event) assuming collectability is probable. In some cases, the Company is reliant on the artist to report revenue generating activities. For certain artist services and expanded-rights contracts, collectability is not considered probable until notification is received from the artist’s management.
Licensing revenues represent royalties or fees for the right to use sound recordings in combination with visual images such as in films or television programs, television commercials and video games. In certain territories, the Company may also receive royalties when sound recordings are performed publicly through broadcast of music on television, radio and cable and in public spaces such as shops, workplaces, restaurants, bars and clubs. Licensing contracts are generally short term. For fixed-fee contracts, revenue is recognized at the point in time when control of the licensed content is transferred to the customer. Royalty based contracts are recognized as the underlying sales or usage occurs.
Music Publishing
Music Publishing acts as a copyright owner and/or administrator of the musical compositions and generates revenues related to the exploitation of musical compositions (as opposed to recorded music). Music publishers generally receive royalties from the use of the musical compositions in public performances, digital and physical recordings and in combination with visual images. Music publishing revenues are derived from five main sources: mechanical, performance, synchronization, digital and other.
Performance revenues are received when the musical composition is performed publicly through broadcast of music on television, radio and cable, live performance at a concert or other venue (e.g., arena concerts and nightclubs) and performance of musical compositions in staged theatrical productions. Digital revenues are generated with respect to the musical compositions being embodied in recordings licensed to digital streaming
F-76
Table of Contents
services and digital download services and for digital performance. Mechanical revenues are generated with respect to the musical compositions embodied in recordings sold in any physical format or configuration such as vinyl, CDs and DVDs. Synchronization revenues represent the right to use the composition in combination with visual images such as in films or television programs, television commercials and video games as well as from other uses such as in toys or novelty items and merchandise. Other revenues represent earnings for use in printed sheet music and other uses. Digital and synchronization revenue recognition is similar for both Recorded Music and Music Publishing, therefore refer to the discussion within Recorded Music.
Included in these revenue streams, excluding synchronization and other, are licenses with performing rights organizations or collecting societies (e.g., ASCAP, BMI, SESAC and GEMA), which are long-term contracts containing a single performance obligation, which is ongoing access to all intellectual property in an evolving content library. The most common form of consideration for these contracts is sales- and usage-based royalties. The collecting societies submit usage reports, typically with payment for royalties due, often on a quarterly or biannual reporting period, in arrears. Royalties are recognized as the sale or usage occurs based upon usage reports and, when these reports are not available, royalties are estimated based on historical data, such as recent royalties reported, company-specific information with respect to changes in repertoire, industry information and other relevant trends. Also included in these revenue streams are smaller, short-term contracts for specified content, which generally involve a fixed fee. For fixed-fee contracts, revenue is recognized at the point in time when control of the license is transferred to the customer.
The Company excludes from the measurement of transaction price all taxes assessed by governmental authorities that are both (i) imposed on and concurrent with a specific revenue-producing transaction and (ii) collected from customers.
Sales Returns and Uncollectible Accounts
In accordance with practice in the recorded music industry and as customary in many territories, certain physical revenue products (such as CDs and DVDs) are sold to customers with the right to return unsold items. Revenues from such sales are recognized when the products are shipped based on gross sales less a provision for future estimated returns.
In determining the estimate of physical product sales that will be returned, management analyzes vendor sales of product, historical return trends, current economic conditions, changes in customer demand and commercial acceptance of the Company’s products. Based on this information, management reserves a percentage of each dollar of physical product sales that provide the customer with the right of return and records an asset for the value of the returned goods and liability for the amounts expected to be refunded.
Similarly, management evaluates accounts receivables to determine if they will ultimately be collected. In performing this evaluation, significant judgments and estimates are involved, including an analysis of specific risks on a customer-by-customer basis for larger accounts and customers and a receivables aging analysis that determines the percent that has historically been uncollected by aged category. The time between the Company’s issuance of an invoice and payment due date is not significant; customer payments that are not collected in advance of the transfer of promised services or goods are generally due no later than 30 days from invoice date. Based on this information, management provides a reserve for the estimated amounts believed to be uncollectible.
Based on management’s analysis of sales returns, refund liabilities of $23 million and $23 million were established at March 31, 2020 and September 30, 2019, respectively.
Based on management’s analysis of uncollectible accounts, reserves of $21 million and $17 million were established at March 31, 2020 and September 30, 2019, respectively.
F-77
Table of Contents
Principal versus Agent Revenue Recognition
The Company reports revenue on a gross or net basis based on management’s assessment of whether the Company acts as a principal or agent in the transaction. The determination of whether the Company acts as a principal or an agent in a transaction is based on an evaluation of whether the Company controls the good or service before transfer to the customer. When the Company concludes that it controls the good or service before transfer to the customer, the Company is considered a principal in the transaction and records revenue on a gross basis. When the Company concludes that it does not control the good or service before transfer to the customer but arranges for another entity to provide the good or service, the Company acts as an agent and records revenue on a net basis in the amount it earns for its agency service.
In the normal course of business, the Company acts as an intermediary with respect to certain payments received from third parties. For example, the Company distributes music content on behalf of third-party record labels. Based on the above guidance, the Company records the distribution of content on behalf of third-party record labels on a gross basis, subject to the terms of the contract, as the Company controls the content before transfer to the customer. Conversely, recorded music compilations distributed by other record companies where the Company has a right to participate in the profits are recorded on a net basis.
Deferred Revenue
Deferred revenue principally relates to fixed fees and minimum guarantees received in advance of the Company’s performance or usage by the licensee. Reductions in deferred revenue are a result of the Company’s performance under the contract or usage by the licensee.
Deferred revenue increased by $172 million during the six months ended March 31, 2020 related to cash received from customers for fixed fees and minimum guarantees in advance of performance, including amounts recognized in the period. Revenues of $100 million were recognized during the six months ended March 31, 2020 related to the balance of deferred revenue at September 30, 2019. There were no other significant changes to deferred revenue during the reporting period.
Performance Obligations
The Company recognized revenue of $30 million and $35 million from performance obligations satisfied in previous periods for the six months ended March 31, 2020 and March 31, 2019, respectively.
Wholly and partially unsatisfied performance obligations represent future revenues not yet recorded under long-term intellectual property licensing contracts containing fixed fees, advances and minimum guarantees. Revenues expected to be recognized in the future related to performance obligations that are unsatisfied at March 31, 2020 are as follows:
| Rest of FY20 | FY21 | FY22 | Thereafter | Total | ||||||||||||||||
| (in millions) | ||||||||||||||||||||
| Remaining performance obligations |
$ | 360 | $ | 767 | $ | 59 | $ | — | $ | 1,186 | ||||||||||
|
|
|
|
|
|
|
|
|
|
|
|||||||||||
| Total |
$ | 360 | $ | 767 | $ | 59 | $ | — | $ | 1,186 | ||||||||||
|
|
|
|
|
|
|
|
|
|
|
|||||||||||
F-78
Table of Contents
4. Comprehensive Income
Comprehensive income, which is reported in the accompanying consolidated statements of deficit, consists of net income and other gains and losses affecting equity that, under U.S. GAAP, are excluded from net income. For the Company, the components of other comprehensive income primarily consist of foreign currency translation gains and losses, minimum pension liabilities, and deferred gains and losses on financial instruments designated as hedges under ASC 815, Derivatives and Hedging, which include foreign exchange contracts. The following summary sets forth the changes in the components of accumulated other comprehensive loss, net of related tax benefit of approximately $6 million:
| Foreign Currency Translation Loss (a) |
Minimum Pension Liability Adjustment |
Deferred Gains (Losses) On Derivative Financial Instruments |
Accumulated Other Comprehensive Loss, net |
|||||||||||||
| (in millions) | ||||||||||||||||
| Balance at September 30, 2019 |
$ | (218 | ) | $ | (14 | ) | $ | (8 | ) | $ | (240 | ) | ||||
| Other comprehensive loss |
(8 | ) | — | (20 | ) | (28 | ) | |||||||||
|
|
|
|
|
|
|
|
|
|||||||||
| Balance at March 31, 2020 |
$ | (226 | ) | $ | (14 | ) | $ | (28 | ) | $ | (268 | ) | ||||
|
|
|
|
|
|
|
|
|
|||||||||
| (a) | Includes historical foreign currency translation related to certain intra-entity transactions. |
5. Leases
The Company’s lease portfolio consists operating real estate leases for its corporate offices and, to a lesser extent, storage and other equipment. Under ASC 842, a contract is or contains a lease when (1) an explicitly or implicitly identified asset has been deployed in the contract and (2) the customer obtains substantially all of the economic benefits from the use of that underlying asset and directs how and for what purpose the asset is used during the term of the contract. The Company determines if an arrangement is or contains a lease at inception of the contract. For all leases (finance and operating), other than those that qualify for the short-term recognition exemption, the Company will recognize on the balance sheet a lease liability for its obligation to make lease payments arising from the lease and a corresponding ROU asset representing its right to use the underlying asset over the period of use based on the present value of lease payments over the lease term as of the lease commencement date. ROU assets are adjusted for initial direct costs, lease payments made and incentives. As the rates implicit in our leases are not readily determinable, the Company uses its incremental borrowing rate based on the information available at the lease commencement date in determining the present value of lease payments. This rate is based on the estimated rate of interest for collateralized borrowing over a similar term of the lease payments. The lease term used to calculate the lease liability will include options to extend or terminate the lease when the option to extend or terminate is at the Company’s discretion and it is reasonably certain that the Company will exercise the option. Fixed payments are recognized as lease expense on a straight-line basis over the lease term. For leases with a term of one year or less (“short-term leases”), the lease payments are recognized in the consolidated statement of operations on a straight-line basis over the lease term.
ASC 842 requires that only limited types of variable payments be included in the determination of lease payments, which affects lease classification and measurement. Variable lease costs, if any, are recognized as incurred and such costs are excluded from lease balances recorded on the consolidated balance sheet. The initial measurement of the lease liability and ROU asset are determined based on both the fixed lease payments and any variable lease payments that depend on an index or a rate (such as the Consumer Price Index or a market interest rate). The Company initially measures these variable lease payments using the index or rate at lease commencement (i.e., the spot or gross index or rate applied to the base rental amount). All other variable lease payments are recognized in the period in which the payments are incurred.
F-79
Table of Contents
The Company’s operating ROU assets are included in operating lease right-of-use assets and the Company’s current and non-current operating lease liabilities are included in operating lease liabilities, current and operating lease liabilities, noncurrent, respectively, in the Company’s balance sheet.
Operating lease liabilities are amortized using the effective interest method. That is, in each period, the liability will be increased to reflect the interest that is accrued on the related liability by using the appropriate discount rate and decreased by the lease payments made during the period. The subsequent measurement of the ROU asset is linked to the amount recognized as the lease liability. Accordingly, the ROU asset is measured as the lease liability adjusted by (1) accrued or prepaid rents (i.e., the aggregate difference between the cash payment and straight-line lease cost), (2) remaining unamortized initial direct costs and lease incentives, and (3) impairments of the ROU asset. Operating lease costs are included in Selling, general and administrative expenses.
For lease agreements that contain both lease and non-lease components, the Company has elected the practical expedient provided by ASC 842 that permits the accounting for these components as a single lease component (rather than separating the lease from the non-lease components and accounting for the components individually).
The Company enters into operating leases for buildings, office equipment, production equipment, warehouses, and other types of equipment. Our leases have remaining lease terms of 1 year to 11 years, some of which include options to extend the leases for up to 10 years, and some of which include options to terminate the leases within 1 year.
Among the Company’s operating leases are its leases for the Ford Factory Building, located at 777 S. Santa Fe Avenue in Los Angeles, California, and for 27 Wrights Lane, Kensington, London. The landlord for both leases is an affiliate of Access. As of March 31, 2020, the aggregate lease liability related to these leases was $139 million.
There are no restrictions or covenants, such as those relating to dividends or incurring additional financial obligations, relating to our lease portfolio, and residual value guarantees are not significant.
The components of lease expense were as follows:
| Three Months Ended March 31, 2020 |
Six Months Ended March 31, 2020 |
|||||||
| (in millions) | ||||||||
| Lease Cost |
||||||||
| Operating lease cost |
$ | 12 | $ | 26 | ||||
| Short-term lease cost |
— | — | ||||||
| Variable lease cost |
2 | 5 | ||||||
| Sublease income |
— | — | ||||||
|
|
|
|
|
|||||
| Total lease cost |
$ | 14 | $ | 31 | ||||
|
|
|
|
|
|||||
Supplemental cash flow information related to leases was as follows:
| Six Months Ended March 31, 2020 |
||||
| (in millions) | ||||
| Cash paid for amounts included in the measurement of operating lease liabilities |
$ | 28 | ||
| Right-of-use assets obtained in exchange for operating lease obligations |
9 | |||
F-80
Table of Contents
Supplemental balance sheet information related to leases was as follows:
| March 31, 2020 |
||||
| (in millions) | ||||
| Operating Leases |
||||
| Operating lease right-of-use assets |
$ | 281 | ||
| Operating lease liabilities, current |
$ | 39 | ||
| Operating lease liabilities, noncurrent |
312 | |||
|
|
|
|||
| Total operating lease liabilities |
$ | 351 | ||
|
|
|
|||
| Weighted Average Remaining Lease Term |
||||
| Operating leases |
9 years | |||
| Weighted Average Discount Rate |
||||
| Operating leases |
4.57 | % | ||
Maturities of lease liabilities were as follows:
| Years |
Operating Leases |
|||
| (in millions) | ||||
| 2020 |
$ | 40 | ||
| 2021 |
53 | |||
| 2022 |
50 | |||
| 2023 |
47 | |||
| 2024 |
47 | |||
| Thereafter |
190 | |||
|
|
|
|||
| Total lease payments |
427 | |||
| Less imputed interest |
(76 | ) | ||
|
|
|
|||
| Total |
$ | 351 | ||
|
|
|
|||
As of March 31, 2020, there have been no leases entered into that have not yet commenced.
6. Goodwill and Intangible Assets
Goodwill
The following analysis details the changes in goodwill for each reportable segment:
| Recorded Music |
Music Publishing |
Total | ||||||||||
| (in millions) | ||||||||||||
| Balance at September 30, 2019 |
$ | 1,297 | $ | 464 | $ | 1,761 | ||||||
| Acquisitions |
— | — | — | |||||||||
| Other adjustments |
— | — | — | |||||||||
|
|
|
|
|
|
|
|||||||
| Balance at March 31, 2020 |
$ | 1,297 | $ | 464 | $ | 1,761 | ||||||
|
|
|
|
|
|
|
|||||||
The Company performs its annual goodwill impairment test in accordance with ASC 350, Intangibles—Goodwill and Other (“ASC 350”) during the fourth quarter of each fiscal year as of July 1. The Company may conduct an earlier review if events or circumstances occur that would suggest the carrying value of the Company’s goodwill may not be recoverable. No indicators of impairment were identified during the current period that required the Company to perform an interim assessment or recoverability test.
F-81
Table of Contents
Intangible Assets
Intangible assets consist of the following:
| Weighted- |
March 31, 2020 |
September 30, 2019 |
||||||||
| (in millions) | ||||||||||
| Intangible assets subject to amortization: |
||||||||||
| Recorded music catalog |
10 years | $ | 851 | $ | 855 | |||||
| Music publishing copyrights |
26 years | 1,551 | 1,539 | |||||||
| Artist and songwriter contracts |
13 years | 835 | 841 | |||||||
| Trademarks |
18 years | 53 | 53 | |||||||
| Other intangible assets |
7 years | 62 | 59 | |||||||
|
|
|
|
|
|||||||
| Total gross intangible asset subject to amortization |
3,352 | 3,347 | ||||||||
| Accumulated amortization |
(1,708 | ) | (1,624 | ) | ||||||
|
|
|
|
|
|||||||
| Total net intangible assets subject to amortization |
1,644 | 1,723 | ||||||||
| Intangible assets not subject to amortization: |
||||||||||
| Trademarks and tradenames |
Indefinite | 151 | 151 | |||||||
|
|
|
|
|
|||||||
| Total net intangible assets |
$ | 1,795 | $ | 1,874 | ||||||
|
|
|
|
|
|||||||
7. Debt
Debt Capitalization
Long-term debt, all of which was issued by Acquisition Corp., consists of the following:
| March 31, 2020 |
September 30, 2019 |
|||||||
| (in millions) | ||||||||
| Revolving Credit Facility (a) |
$ | — | $ | — | ||||
| Senior Term Loan Facility due 2023 (b) |
1,315 | 1,313 | ||||||
| 5.000% Senior Secured Notes due 2023 (c) |
298 | 298 | ||||||
| 4.125% Senior Secured Notes due 2024 (d) |
339 | 336 | ||||||
| 4.875% Senior Secured Notes due 2024 (e) |
218 | 218 | ||||||
| 3.625% Senior Secured Notes due 2026 (f) |
492 | 488 | ||||||
| 5.500% Senior Notes due 2026 (g) |
321 | 321 | ||||||
|
|
|
|
|
|||||
| Total long-term debt, including the current portion (h) |
$ | 2,983 | $ | 2,974 | ||||
|
|
|
|
|
|||||
| (a) | Reflects $180 million of commitments under the Revolving Credit Facility, less letters of credit outstanding of approximately $13 million at both March 31, 2020 and September 30, 2019. There were no loans outstanding under the Revolving Credit Facility at March 31, 2020 or September 30, 2019. On April 3, 2020, Acquisition Corp. entered into an amendment to the Revolving Credit Facility which, among other things, increased the commitments under the Revolving Credit Facility from an aggregate principal amount of $180 million to an aggregate principal amount of $300 million. For a more detailed description of the changes effected by the amendment, see Note 14. |
| (b) | Principal amount of $1.326 billion at both March 31, 2020 and September 30, 2019 less unamortized discount of $3 million and $3 million and unamortized deferred financing costs of $8 million and $10 million at March 31, 2020 and September 30, 2019, respectively. |
| (c) | Principal amount of $300 million less unamortized deferred financing costs of $2 million at both March 31, 2020 and September 30, 2019, respectively. |
F-82
Table of Contents
| (d) | Face amount of €311 million at both March 31, 2020 and September 30, 2019. Above amounts represent the dollar equivalent of such note at March 31, 2020 and September 30, 2019. Principal amount of $342 million and $340 million less unamortized deferred financing costs of $3 million and $4 million at March 31, 2020 and September 30, 2019, respectively. |
| (e) | Principal amount of $220 million less unamortized deferred financing costs of $2 million at both March 31, 2020 and September 30, 2019, respectively. |
| (f) | Face amount of €445 million at both March 31, 2020 and September 30, 2019. Above amounts represent the dollar equivalent of such note at March 31, 2020 and September 30, 2019. Principal amount of $491 million and $487 million at March 31, 2020 and September 30, 2019, respectively, an additional issuance premium of $7 million, less unamortized deferred financing costs of $6 million at both March 31, 2020 and September 30, 2019. |
| (g) | Principal amount of $325 million less unamortized deferred financing costs of $4 million at both March 31, 2020 and September 30, 2019. |
| (h) | Principal amount of debt of $3.004 billion and $2.998 billion, an additional issuance premium of $7 million and $8 million, less unamortized discount of $3 million and $3 million and unamortized deferred financing costs of $25 million and $29 million at March 31, 2020 and September 30, 2019, respectively. |
3.625% Senior Secured Notes Offerings
On October 9, 2018, Acquisition Corp. issued and sold €250 million in aggregate principal amount of 3.625% Senior Secured Notes due 2026 (the “3.625% Secured Notes”). Net proceeds of the offering were used to pay the purchase price of the acquisition of EMP, to redeem €34.5 million of the 4.125% Secured Notes (as described below), purchase $30 million of the Company’s 4.875% Senior Secured Notes (as described above) on the open market and to redeem $26.55 million of the 5.625% Senior Secured Notes (as described below).
On April 30, 2019, Acquisition Corp. issued and sold €195 million in aggregate principal amount of additional 3.625% Senior Secured Notes due 2026 (the “Additional Notes”). The Additional Notes and the 3.625% Secured Notes were treated as the same series for all purposes under the indenture that governs the 3.625% Secured Notes and the Additional Notes. Net proceeds of the offering were used to redeem all of the 5.625% Secured Notes due 2022.
Partial Redemption of 4.125% Senior Secured Notes
On October 12, 2018, Acquisition Corp. redeemed €34.5 million aggregate principal amount of its 4.125% Senior Secured Notes due 2024 (the “4.125% Secured Notes”) using a portion of the proceeds from the offering of the 3.625% Secured Notes described above. The redemption price for the 4.125% Secured Notes was approximately €36.17 million, equivalent to 103% of the principal amount of the 4.125% Secured Notes, plus accrued but unpaid interest thereon to, but excluding, the redemption date, which was October 12, 2018. Following the partial redemption of the 4.125% Secured Notes, €310.5 million of the 4.125% Secured Notes remain outstanding. The Company recorded a loss on extinguishment of debt of approximately $2 million, which represents the premium paid on early redemption and unamortized deferred financing costs related to the partial redemption of this note.
Open Market Purchase
On October 9, 2018, Acquisition Corp. purchased, in the open market, $30 million aggregate principal amount of its outstanding 4.875% Senior Secured Notes due 2024 (the “4.875% Secured Notes”). The acquired notes were subsequently retired. Following retirement of the acquired notes, $220 million of the 4.875% Secured Notes remain outstanding. The Company recorded a loss on extinguishment of debt of less than $1 million, which represents the unamortized deferred financing costs related to the open market purchase.
F-83
Table of Contents
Redemption of 5.625% Senior Secured Notes
On November 5, 2018, Acquisition Corp. redeemed $26.55 million aggregate principal amount of its 5.625% Senior Secured Notes due 2022 (the “5.625% Secured Notes”). The redemption price for the 5.625% Secured Notes was approximately $27.38 million, equivalent to 102.813% of the principal amount of the 5.625% Secured Notes, plus accrued but unpaid interest thereon to, but excluding, the redemption date, which was November 5, 2018. Following the partial redemption of the 5.625% Secured Notes, $220.95 million of the 5.625% Secured Notes remain outstanding. The Company recorded a loss on extinguishment of debt of approximately $1 million, which represents the premium paid on early redemption and unamortized deferred financing costs related to the partial redemption of this note.
On April 16, 2019, the Company issued a conditional notice of redemption for all of its 5.625% Secured Notes due 2022 currently outstanding. Settlement of the called 5.625% Secured Notes occurred on May 16, 2019. The Company recorded a loss on extinguishment of debt of approximately $4 million, which represents the premium paid on early redemption and unamortized deferred financing costs.
Interest Rates
The loans under the Revolving Credit Facility bear interest at Acquisition Corp.’s election at a rate equal to (i) the rate for deposits in the borrowing currency in the London interbank market (adjusted for maximum reserves) for the applicable interest period (“Revolving LIBOR”) subject to a zero floor, plus 1.75% per annum in the case of Initial Revolving Loans (as defined in the Revolving Credit Agreement), or 1.875% per annum in the case of 2020 Revolving Loans (as defined in the Revolving Credit Agreement), or (ii) the base rate, which is the highest of (x) the corporate base rate established by the administrative agent from time to time, (y) 0.50% in excess of the overnight federal funds rate and (z) the one-month Revolving LIBOR plus 1.0% per annum, plus, in each case, 0.75% per annum in the case of Initial Revolving Loans, or 0.875% per annum in the case of 2020 Revolving Loans; provided that, in respect of 2020 Revolving Loans, the applicable margin with respect to such loans is subject to adjustment as set forth in the pricing grid in the Revolving Credit Agreement. Based on the Senior Secured Indebtedness to EBITDA Ratio of 3.22x at March 31, 2020, the applicable margin for Eurodollar loans would be 1.625% instead of 1.875% and the applicable margin for ABR loans would be 0.625% instead of 0.875% in the case of 2020 Revolving Loans. If there is a payment default at any time, then the interest rate applicable to overdue principal will be the rate otherwise applicable to such loan plus 2.0% per annum. Default interest will also be payable on other overdue amounts at a rate of 2.0% per annum above the amount that would apply to an alternative base rate loan.
The loans under the Senior Term Loan Facility bear interest at Acquisition Corp.’s election at a rate equal to (i) the rate for deposits in U.S. dollars in the London interbank market (adjusted for maximum reserves) for the applicable interest period (“Term Loan LIBOR”) subject to a zero floor, plus 2.125% per annum or (ii) the base rate, which is the highest of (x) the corporate base rate established by the administrative agent as its prime rate in effect at its principal office in New York City from time to time, (y) 0.50% in excess of the overnight federal funds rate and (z) one-month Term Loan LIBOR, plus 1.00% per annum, plus, in each case, 1.125% per annum. If there is a payment default at any time, then the interest rate applicable to overdue principal and interest will be the rate otherwise applicable to such loan plus 2.0% per annum. Default interest will also be payable on other overdue amounts at a rate of 2.0% per annum above the amount that would apply to an alternative base rate loan.
The Company has entered into, and in the future may enter into, interest rate swaps to manage interest rate risk. Please refer to Note 10 of our consolidated financial statements for further discussion.
Maturity of Senior Term Loan Facility
The loans outstanding under the Senior Term Loan Facility mature on November 1, 2023.
F-84
Table of Contents
Maturity of Revolving Credit Facility
As of March 31, 2020, the maturity date of the Revolving Credit Facility was January 31, 2023. On April 3, 2020, Acquisition Corp. entered into an amendment to the Revolving Credit Facility which, among other things, extended the final maturity date of the Revolving Credit Facility from January 31, 2023 to April 3, 2025. For a more detailed description of the changes effected by the amendment, see Note 14.
Maturities of Senior Notes and Senior Secured Notes
As of March 31, 2020, there are no scheduled maturities of notes until 2023, when $300 million is scheduled to mature. Thereafter, $1.378 billion is scheduled to mature.
Interest Expense, net
Total interest expense, net was $33 million and $36 million for the three months ended March 31, 2020 and March 31, 2019, respectively. Total interest expense was $66 million and $72 million for the six months ended March 31, 2020 and March 31, 2019. The weighted-average interest rate of the Company’s total debt was 4.2% at March 31, 2020, 4.3% at September 30, 2019 and 4.7% at March 31, 2019.
8. Commitments and Contingencies
From time to time the Company is involved in claims and legal proceedings that arise in the ordinary course of business. The Company is currently subject to several such claims and legal proceedings. Based on currently available information, the Company does not believe that resolution of pending matters will have a material adverse effect on its financial condition, cash flows or results of operations. However, litigation is subject to inherent uncertainties, and there can be no assurances that the Company’s defenses will be successful or that any such lawsuit or claim would not have a material adverse impact on the Company’s business, financial condition, cash flows and results of operations in a particular period. Any claims or proceedings against the Company, whether meritorious or not, can have an adverse impact because of defense costs, diversion of management and operational resources, negative publicity and other factors.
9. Income Taxes
On December 22, 2017, the U.S. government enacted comprehensive tax legislation commonly referred to as the Tax Cuts and Jobs Act (“Tax Act”). The Tax Act significantly revised the U.S. federal corporate income tax provisions, including, but not limited to, an income inclusion of global intangible low-taxed income (“GILTI”), a deduction against foreign-derived intangible income (“FDII”) and a new minimum tax, the base erosion anti-abuse tax (“BEAT”). GILTI, FDII and BEAT were effective for the Company’s fiscal year ending September 30, 2019. The Company has elected to recognize the GILTI impact in the specific period in which it occurs.
As a result of final regulations regarding the interest expense allocation rules issued by the Internal Revenue Service in December 2019, the Company concluded that it is more likely than not that the entire amount of the Company’s deferred tax assets relating to foreign tax credit carryforwards will be realized. Consequently, the Company released its $33 million valuation allowance at September 30, 2019 relating to such deferred tax assets and recognized a corresponding U.S. tax benefit of $33 million during the quarter ended December 31, 2019. The Company will continue to weigh the evidence including the projections of sufficient future taxable income, foreign source income and the reversal of future taxable temporary differences to assess the future realization of our foreign tax credits.
For the three and six months ended March 31, 2020, the Company recorded an income tax benefit of $12 million and $7 million, respectively. The income tax benefit of $12 million for the three months ended March 31, 2020 is lower than the expected tax benefit at the statutory tax rate of 21% primarily due to non-deductible expenses of our Senior Management Free Cash Flow Plan. The income tax benefit of $7 million for
F-85
Table of Contents
the six months ended March 31, 2020 is lower than the expected tax at the statutory tax rate of 21% primarily due to tax benefit of the valuation allowance release relating to foreign tax credit carryforwards and FDII, offset by non-deductible expenses of our Senior Management Free Cash Flow Plan, U.S. state and local taxes, foreign income taxed at rates higher than the U.S. statutory tax rate, withholding taxes and foreign losses with no tax benefit.
For the three and six months ended March 31, 2019, the Company recorded an income tax expense of $48 million and $98 million, respectively. The income tax expense for the three and six months ended March 31, 2019 is higher than the expected tax at the statutory tax rate of 21% primarily due to GILTI, non-deductible expenses of our Senior Management Free Cash Flow Plan, U.S. state and local taxes, foreign income taxed at rates higher than the U.S. statutory tax rate, withholding taxes and foreign losses with no tax benefit offset by the tax benefit of a reduction in foreign income tax rates.
The Company has determined that it is reasonably possible that the gross unrecognized tax benefits as of March 31, 2020 could decrease by up to approximately $1 million related to various ongoing audits and settlement discussions in various foreign jurisdictions during the next twelve months.
10. Derivative Financial Instruments
The Company uses derivative financial instruments, primarily foreign currency forward exchange contracts and interest rate swaps, for the purposes of managing foreign currency exchange rate risk and interest rate risk on expected future cash flows. However, the Company may choose not to hedge certain exposures for a variety of reasons including, but not limited to, accounting considerations and the prohibitive economic cost of hedging particular exposures. There can be no assurance the hedges will offset more than a portion of the financial impact resulting from movements in foreign currency exchange or interest rates.
The Company enters into foreign currency forward exchange contracts primarily to hedge the risk that unremitted or future royalties and license fees owed to its U.S. companies for the sale or licensing of U.S.-based music and merchandise abroad may be adversely affected by changes in foreign currency exchange rates. The Company focuses on managing the level of exposure to the risk of foreign currency exchange rate fluctuations on its major currencies, which include the Euro, British pound sterling, Japanese yen, Canadian dollar, Swedish krona, Australian dollar, Brazilian real, Korean won and Norwegian krone. The Company also may at times choose to hedge foreign currency risk associated with financing transactions such as third-party debt and other balance sheet items. The Company’s foreign currency forward exchange contracts have not been designated as hedges under the criteria prescribed in ASC 815. The Company records these contracts at fair value on its balance sheet and the related gains and losses are immediately recognized in the consolidated statement of operations where there is an offsetting entry related to the underlying exposure.
In prior periods, certain foreign currency forward exchange contracts were designated and qualified as cash flow hedges under the criteria prescribed in ASC 815. The Company recorded these contracts at fair value on its balance sheet and gains or losses on these contracts were deferred in equity (as a component of comprehensive loss). These deferred gains and losses were recognized in income in the period in which the related royalties and license fees being hedged were received and recognized in income. However, to the extent that any of these contracts were not considered to be perfectly effective in offsetting the change in the value of the royalties and license fees being hedged, any changes in fair value relating to the ineffective portion of these contracts were immediately recognized in the consolidated statement of operations.
The Company has entered into, and in the future may enter into, interest rate swaps to manage interest rate risk. These instruments may offset a portion of changes in income or expense, or changes in fair value of the Company’s long-term debt. The interest rate swap instruments are designated and qualify as cash flow hedges under the criteria prescribed in ASC 815. The Company records these contracts at fair value on its balance sheet and gains or losses on these contracts are deferred in equity (as a component of comprehensive loss).
F-86
Table of Contents
The fair value of foreign currency forward exchange contracts is determined by using observable market transactions of spot and forward rates (i.e., Level 2 inputs) which is discussed further in Note 13. Additionally, netting provisions are provided for in existing International Swap and Derivative Association Inc. agreements in situations where the Company executes multiple contracts with the same counterparty. As a result, net assets or liabilities resulting from foreign exchange derivatives subject to these netting agreements are classified within other current assets or other current liabilities in the Company’s consolidated balance sheets.
The Company’s hedged interest rate transactions as of March 31, 2020 are expected to be recognized within 4 years. The fair value of interest rate swaps is based on dealer quotes of market rates (i.e., Level 2 inputs) which is discussed further in Note 13. Interest income or expense related to interest rate swaps is recognized in interest income, net in the same period as the related expense is recognized. The ineffective portions of interest rate swaps are recognized in other income/(expense), net in the period measured.
The Company monitors its positions with, and the credit quality of, the financial institutions that are party to any of its financial transactions.
As of March 31, 2020, the Company had outstanding hedge contracts for the sale of $243 million and the purchase of $142 million of foreign currencies at fixed rates that will be settled by September 2020. As of March 31, 2020, the Company had no unrealized deferred gains or losses in comprehensive loss related to foreign exchange hedging. As of September 30, 2019, the Company had no outstanding hedge contracts and no deferred gains or losses in comprehensive loss related to foreign exchange hedging.
As of March 31, 2020, the Company had outstanding $820 million in pay-fixed receive-variable interest rate swaps with $28 million of unrealized deferred losses in comprehensive income related to the interest rate swaps. As of September 30, 2019, the Company had outstanding $820 million in pay-fixed receive-variable interest rate swaps with $8 million of unrealized deferred losses in comprehensive income related to the interest rate swaps.
The Company recorded realized pre-tax losses of $2 million and unrealized pre-tax gains of $3 million related to its foreign currency forward exchange contracts in the consolidated statement of operations as other (expense) income for the six months ended March 31, 2020. The Company recorded realized pre-tax gains of $1 million and unrealized pre-tax gains of $4 million related to its foreign currency forward exchange contracts in the consolidated statement of operations as other income for the six months ended March 31, 2019. The unrealized pre-tax losses of the Company’s foreign exchange forward contracts recorded in other comprehensive income were $2 million for the six months ended March 31, 2019.
The unrealized pre-tax losses of the Company’s derivative interest rate swaps designated as cash flow hedges recorded in other comprehensive income during the six months ended March 31, 2020 were $25 million. The unrealized pre-tax losses of the Company’s derivative interest rate swaps designated as cash flow hedges recorded in other comprehensive income during the six months ended March 31, 2019 were $9 million.
The following is a summary of amounts recorded in the consolidated balance sheets pertaining to the Company’s derivative instruments at March 31, 2020 and September 30, 2019:
| March 31, 2020 (a) |
September 30, 2019 (b) |
|||||||
| (in millions) | ||||||||
| Other current assets |
$ | 3 | $ | — | ||||
| Other current liabilities |
— | — | ||||||
| Other noncurrent assets |
— | 2 | ||||||
| Other noncurrent liabilities |
(36 | ) | (13 | ) | ||||
| (a) | $8 million and $5 million of foreign exchange derivative contracts in asset and liability positions, respectively, and $36 million of interest rate swaps in liability positions. |
| (b) | $2 million and $13 million of interest rate swaps in asset and liability positions, respectively. |
F-87
Table of Contents
11. Segment Information
As discussed more fully in Note 1, based on the nature of its products and services, the Company classifies its business interests into two fundamental operations: Recorded Music and Music Publishing, which also represent the reportable segments of the Company. Information as to each of these operations is set forth below. The Company evaluates performance based on several factors, of which the primary financial measure is operating income (loss) before non-cash depreciation of tangible assets and non-cash amortization of intangible assets (“OIBDA”). The Company has supplemented its analysis of OIBDA results by segment with an analysis of operating income (loss) by segment.
The accounting policies of the Company’s business segments are the same as those described in the summary of significant accounting policies included elsewhere herein. The Company accounts for intersegment sales at fair value as if the sales were to third parties. While intercompany transactions are treated like third-party transactions to determine segment performance, the revenues (and corresponding expenses recognized by the segment that is counterparty to the transaction) are eliminated in consolidation, and therefore, do not themselves impact consolidated results.
| Recorded Music |
Music Publishing |
Corporate expenses and eliminations |
Total | |||||||||||||
| Three Months Ended | (in millions) | |||||||||||||||
| March 31, 2020 |
||||||||||||||||
| Revenues |
$ | 907 | $ | 166 | $ | (2 | ) | $ | 1,071 | |||||||
| Operating income (loss) |
36 | 30 | (115 | ) | (49 | ) | ||||||||||
| Amortization of intangible assets |
30 | 17 | — | 47 | ||||||||||||
| Depreciation of property, plant and equipment |
10 | 1 | 3 | 14 | ||||||||||||
|
|
|
|
|
|
|
|
|
|||||||||
| OIBDA |
76 | 48 | (112 | ) | 12 | |||||||||||
| March 31, 2019 |
||||||||||||||||
| Revenues |
$ | 933 | $ | 158 | $ | (1 | ) | $ | 1,090 | |||||||
| Operating income (loss) |
134 | 27 | (39 | ) | 122 | |||||||||||
| Amortization of intangible assets |
37 | 18 | — | 55 | ||||||||||||
| Depreciation of property, plant and equipment |
9 | 2 | 3 | 14 | ||||||||||||
|
|
|
|
|
|
|
|
|
|||||||||
| OIBDA |
180 | 47 | (36 | ) | 191 | |||||||||||
| Recorded Music |
Music Publishing |
Corporate expenses and eliminations |
Total | |||||||||||||
| Six Months Ended | (in millions) | |||||||||||||||
| March 31, 2020 |
||||||||||||||||
| Revenues |
$ | 1,991 | $ | 339 | $ | (3 | ) | $ | 2,327 | |||||||
| Operating income (loss) |
227 | 44 | (155 | ) | 116 | |||||||||||
| Amortization of intangible assets |
59 | 35 | — | 94 | ||||||||||||
| Depreciation of property, plant and equipment |
31 | 2 | 5 | 38 | ||||||||||||
|
|
|
|
|
|
|
|
|
|||||||||
| OIBDA |
317 | 81 | (150 | ) | 248 | |||||||||||
| March 31, 2019 |
||||||||||||||||
| Revenues |
$ | 1,974 | $ | 323 | $ | (4 | ) | $ | 2,293 | |||||||
| Operating income (loss) |
297 | 49 | (77 | ) | 269 | |||||||||||
| Amortization of intangible assets |
75 | 34 | — | 109 | ||||||||||||
| Depreciation of property, plant and equipment |
19 | 3 | 6 | 28 | ||||||||||||
|
|
|
|
|
|
|
|
|
|||||||||
| OIBDA |
391 | 86 | (71 | ) | 406 | |||||||||||
F-88
Table of Contents
12. Additional Financial Information
Cash Interest and Taxes
The Company made interest payments of approximately $21 million and $28 million during the three months ended March 31, 2020 and March 31, 2019, respectively. The Company made interest payments of approximately $65 million and $70 million during the six months ended March 31, 2020 and March 31, 2019, respectively. The Company paid approximately $20 million and $11 million of income and withholding taxes, net of refunds, for the three months ended March 31, 2020 and March 31, 2019, respectively. The Company paid approximately $40 million and $18 million of income and withholding taxes, net of refunds, during the six months ended March 31, 2020 and March 31, 2019, respectively.
Dividends
The Company’s ability to pay dividends is restricted by covenants in the indentures governing its notes and in the credit agreements for the Senior Term Loan Facility and the Revolving Credit Facility.
In the first quarter of fiscal year 2019, the Company instituted a regular quarterly dividend policy whereby it intends to pay a modest regular quarterly dividend in each of the first three fiscal quarters and a variable dividend for the fourth fiscal quarter in an amount commensurate with cash expected to be generated from operations in such fiscal year, in each case, after taking into account other potential uses for cash, including acquisitions, investment in our business and repayment of indebtedness. The declaration of each dividend will continue to be at the discretion of the Company’s board of directors.
On March 25, 2020, the Company’s board of directors declared a cash dividend of $37.5 million which was paid to stockholders on April 17, 2020 and recorded as an accrual as of March 31, 2020. On September 23, 2019, the Company’s board of directors declared a cash dividend of $206 million which was paid to stockholders on October 4, 2019 and recorded as an accrual as of September 30, 2019. On March 26, 2019, the Company’s board of directors declared a cash dividend of $31.25 million which was accrued as of March 31, 2019 and paid to stockholders on April 5, 2019.
Depreciation Expense
During the six months ended March 31, 2020, the Company recorded depreciation expense of $38 million, which included a one-time charge of $10 million representing the difference between the net book value of a building and its expected recoverable value.
COVID-19 Pandemic
On March 11, 2020, the COVID-19 outbreak was declared a global pandemic by the World Health Organization. Government-imposed mandates limiting public assembly and requiring that non-essential businesses close have adversely impacted the Company’s operations, including touring and physical product distribution, for the three and six months ended March 31, 2020. It is unclear how long the government-imposed mandates and restrictions will last and to what extent the global pandemic will impact demand for the Company’s music and related services, even after federal, state, local and foreign governmental restrictions are lifted over time.
The Company is not presently aware of any events or circumstances arising from the global pandemic that would require us to update any estimates, judgments or materially revise the carrying value of our assets or liabilities. The Company’s estimates may change, however, as new events occur and additional information is obtained, and any such changes will be recognized in the consolidated financial statements. Actual results could differ from estimates, and any such differences may be material to our consolidated financial statements.
F-89
Table of Contents
13. Fair Value Measurements
ASC 820, Fair Value Measurement (“ASC 820”) defines fair value as the price that would be received upon sale of an asset or paid upon transfer of a liability in an orderly transaction between market participants at the measurement date and in the principal or most advantageous market for that asset or liability. The fair value should be calculated based on assumptions that market participants would use in pricing the asset or liability, not on assumptions specific to the entity.
In addition to defining fair value, ASC 820 expands the disclosure requirements around fair value and establishes a fair value hierarchy for valuation inputs. The hierarchy prioritizes the inputs into three levels based on the extent to which inputs used in measuring fair value are observable in the market. Each fair value measurement is reported in one of the three levels which is determined by the lowest level input that is significant to the fair value measurement in its entirety. These levels are:
| • | Level 1—inputs are based upon unadjusted quoted prices for identical instruments traded in active markets. |
| • | Level 2—inputs are based upon quoted prices for similar instruments in active markets, quoted prices for identical or similar instruments in markets that are not active and model-based valuation techniques for which all significant assumptions are observable in the market or can be corroborated by observable market data for substantially the full term of the assets or liabilities. |
| • | Level 3—inputs are generally unobservable and typically reflect management’s estimates of assumptions that market participants would use in pricing the asset or liability. The fair values are therefore determined using model-based techniques that include option pricing models, discounted cash flow models and similar techniques. |
In accordance with the fair value hierarchy, described above, the following tables show the fair value of the Company’s financial instruments that are required to be measured at fair value as of March 31, 2020 and September 30, 2019.
| Fair Value Measurements as of March 31, 2020 | ||||||||||||||||
| (Level 1) | (Level 2) | (Level 3) | Total | |||||||||||||
| (in millions) | ||||||||||||||||
| Other Current Assets: |
||||||||||||||||
| Foreign Currency Forward Exchange Contracts (a) |
$ | — | $ | 3 | $ | — | $ | 3 | ||||||||
| Other Noncurrent Assets: |
||||||||||||||||
| Equity Method Investment (d) |
— | 28 | — | 28 | ||||||||||||
| Other Noncurrent Liabilities: |
||||||||||||||||
| Interest Rate Swap (c) |
— | (36 | ) | — | (36 | ) | ||||||||||
|
|
|
|
|
|
|
|
|
|||||||||
| Total |
$ | — | $ | (5 | ) | $ | — | $ | (5 | ) | ||||||
|
|
|
|
|
|
|
|
|
|||||||||
| Fair Value Measurements as of September 30, 2019 | ||||||||||||||||
| (Level 1) | (Level 2) | (Level 3) | Total | |||||||||||||
| (in millions) | ||||||||||||||||
| Other Current Liabilities: |
||||||||||||||||
| Contractual Obligations (b) |
$ | — | $ | — | $ | (9 | ) | $ | (9 | ) | ||||||
| Other Noncurrent Assets: |
||||||||||||||||
| Equity Method Investment (d) |
— | 40 | — | 40 | ||||||||||||
| Interest Rate Swap |
— | 2 | — | 2 | ||||||||||||
| Other Noncurrent Liabilities: |
||||||||||||||||
| Interest Rate Swap |
— | (13 | ) | — | (13 | ) | ||||||||||
|
|
|
|
|
|
|
|
|
|||||||||
| Total |
$ | — | $ | 29 | $ | (9 | ) | $ | 20 | |||||||
|
|
|
|
|
|
|
|
|
|||||||||
F-90
Table of Contents
| (a) | The fair value of foreign currency forward exchange contracts is based on dealer quotes of market forward rates and reflects the amount that the Company would receive or pay at their maturity dates for contracts involving the same currencies and maturity dates. |
| (b) | This represents purchase obligations and contingent consideration related to the Company’s various acquisitions. This is based on a probability weighted performance approach and it is adjusted to fair value on a recurring basis and any adjustments are included as a component of operating income in the statement of operations. These amounts were mainly calculated using unobservable inputs such as future earnings performance of the Company’s various acquisitions and the expected timing of the payment. |
| (c) | The fair value of the interest rate swaps is based on dealer quotes of market forward rates and reflects the amount that the Company would receive or pay as of March 31, 2020 for contracts involving the same attributes and maturity dates. |
| (d) | The fair value of equity method investment represents an equity method investment acquired in fiscal 2019 whereby the Company has elected the fair value option under ASC 825, Financial Instruments (“ASC 825”). The valuation is based upon quoted prices in active markets and model-based valuation techniques to determine fair value. |
The following table reconciles the beginning and ending balances of net assets and liabilities classified as Level 3:
| Total | ||||
| (in millions) | ||||
| Balance at September 30, 2019 |
$ | (9 | ) | |
| Additions |
— | |||
| Reductions |
7 | |||
| Payments |
2 | |||
|
|
|
|||
| Balance at March 31, 2020 |
$ | — | ||
|
|
|
|||
The majority of the Company’s non-financial instruments, which include goodwill, intangible assets, inventories, and property, plant and equipment, are not required to be re-measured to fair value on a recurring basis. These assets are evaluated for impairment if certain triggering events occur. If such evaluation indicates that impairment exists, the asset is written down to its fair value. In addition, an impairment analysis is performed at least annually for goodwill and indefinite-lived intangible assets.
Equity Investments Without Readily Determinable Fair Value
The Company evaluates its equity investments without readily determinable fair values for impairment if factors indicate that a significant decrease in value has occurred. The Company has elected to use the measurement alternative to fair value that will allow these investments to be recorded at cost, less impairment, and adjusted for subsequent observable price changes. The Company did not record any impairment charges on these investments during the three and six months ended March 31, 2020. In addition, there were no observable price changes events that were completed during the three and six months ended March 31, 2020.
Fair Value of Debt
Based on the level of interest rates prevailing at March 31, 2020, the fair value of the Company’s debt was $2.890 billion. Based on the level of interest rates prevailing at September 30, 2019, the fair value of the Company’s debt was $3.080 billion. The fair value of the Company’s debt instruments is determined using quoted market prices from less active markets or by using quoted market prices for instruments with identical terms and maturities; both approaches are considered a Level 2 measurement.
F-91
Table of Contents
14. Subsequent Events
On April 3, 2020, Acquisition Corp. entered into an amendment (the “Second Amendment”) to the Revolving Credit Agreement, dated January 31, 2018 (as amended by the amendment dated October 9, 2019), among Acquisition Corp., the several banks and other financial institutions party thereto and Credit Suisse AG, as administrative agent, governing Acquisition Corp.’s senior secured revolving credit facility (the “Revolving Credit Facility”) with Credit Suisse AG, as administrative agent, and the other financial institutions and lenders from time to time party thereto. The Second Amendment (among other changes) (i) increases the commitments under the Revolving Credit Facility from an aggregate principal amount of $180 million to an aggregate principal amount of $300 million, (ii) extends the final maturity date of the Revolving Credit Facility from January 31, 2023 to April 3, 2025, (iii) reduces the interest margin applicable to the loans upon achievement of certain leverage ratios based on a leverage-based pricing grid, (iv) reduces the commitment fee based on a leverage-based pricing grid and limits commitment fees to be paid only on unused amounts of commitments, (v) increases the maximum letter of credit exposure permitted under the Revolving Credit Facility from $50 million to $90 million, (vi) increases the springing financial maintenance covenant from a Senior Secured Indebtedness to EBITDA Ratio of 4.75:1.00 to a Senior Secured Indebtedness to EBITDA Ratio of 5.00:1.00 and provides that the covenant shall not be tested unless at the end of a fiscal quarter the outstanding amount of loans and drawings under letters of credit which have not been reimbursed exceeds $105 million, (vii) adds covenant suspension upon achievement of an investment grade rating or a Total Indebtedness to EBITDA Ratio of 3.25:1.00, and (viii) adds certain exceptions and increases certain baskets in connection with Acquisition Corp.’s negative covenants, including those related to the incurrence of indebtedness, liens and restricted payments.
F-92
Table of Contents
Supplementary Information
Consolidating Financial Statements
The Company is the direct parent of Holdings, which is the direct parent of Acquisition Corp. As of March 31, 2020 Acquisition Corp. had issued and outstanding the 5.000% Senior Secured Notes due 2023, the 4.125% Senior Secured Notes due 2024, the 4.875% Senior Secured Notes due 2024, the 3.625% Senior Secured Notes due 2026 and the 5.500% Senior Notes due 2026 (together, the “Acquisition Corp. Notes”).
The Acquisition Corp. Notes are guaranteed by the Company and, in addition, are guaranteed by all of Acquisition Corp.’s domestic wholly-owned subsidiaries. The secured notes are guaranteed on a senior secured basis and the unsecured notes are guaranteed on an unsecured senior basis. The Company’s guarantee of the Acquisition Corp. Notes is full and unconditional. The guarantee of the Acquisition Corp. Notes by Acquisition Corp.’s domestic wholly-owned subsidiaries is full, unconditional and joint and several. The following condensed consolidating financial statements are also presented for the information of the holders of the Acquisition Corp. Notes and present the results of operations, financial position and cash flows of (i) Acquisition Corp., which is the issuer of the Acquisition Corp. Notes, (ii) the guarantor subsidiaries of Acquisition Corp., (iii) the non-guarantor subsidiaries of Acquisition Corp. and (iv) the eliminations necessary to arrive at the information for Acquisition Corp. on a consolidated basis. Investments in consolidated subsidiaries are presented under the equity method of accounting. There are no restrictions on Acquisition Corp.’s ability to obtain funds from any of its wholly-owned subsidiaries through dividends, loans or advances.
The Company and Holdings are holding companies that conduct substantially all of their business operations through Acquisition Corp. Accordingly, the ability of the Company and Holdings to obtain funds from their subsidiaries is restricted by the indentures for the Acquisition Corp. Notes and the credit agreements for the Acquisition Corp. Senior Credit Facilities, including the Revolving Credit Facility and the Senior Term Loan Facility.
F-93
Table of Contents
Consolidating Balance Sheet (Unaudited)
March 31, 2020
| WMG Acquisition Corp. (issuer) |
Guarantor Subsidiaries |
Non- Guarantor Subsidiaries |
Eliminations | WMG Acquisition Corp. Consolidated |
WMG Holdings Corp. |
Warner Music Group Corp. |
Eliminations | Warner Music Group Corp. Consolidated |
||||||||||||||||||||||||||||
| (in millions) | ||||||||||||||||||||||||||||||||||||
| Assets |
||||||||||||||||||||||||||||||||||||
| Current assets: |
||||||||||||||||||||||||||||||||||||
| Cash and equivalents |
$ | — | $ | 271 | $ | 213 | $ | — | $ | 484 | $ | — | $ | — | $ | — | $ | 484 | ||||||||||||||||||
| Accounts receivable, net |
— | 322 | 441 | — | 763 | — | — | — | 763 | |||||||||||||||||||||||||||
| Inventories |
— | 11 | 54 | — | 65 | — | — | — | 65 | |||||||||||||||||||||||||||
| Royalty advances expected to be recouped within one year |
— | 123 | 66 | — | 189 | — | — | — | 189 | |||||||||||||||||||||||||||
| Prepaid and other current assets |
— | 17 | 65 | — | 82 | — | — | — | 82 | |||||||||||||||||||||||||||
|
|
|
|
|
|
|
|
|
|
|
|
|
|
|
|
|
|
|
|||||||||||||||||||
| Total current assets |
— | 744 | 839 | — | 1,583 | — | — | — | 1,583 | |||||||||||||||||||||||||||
| Due from (to) parent companies |
454 | (655 | ) | 201 | — | — | — | — | — | — | ||||||||||||||||||||||||||
| Investments in and advances to consolidated subsidiaries |
2,293 | 2,813 | — | (5,106 | ) | — | 692 | 692 | (1,384 | ) | — | |||||||||||||||||||||||||
| Royalty advances expected to be recouped after one year |
— | 151 | 81 | — | 232 | — | — | — | 232 | |||||||||||||||||||||||||||
| Property, plant and equipment, net |
— | 194 | 100 | — | 294 | — | — | — | 294 | |||||||||||||||||||||||||||
| Operating lease right-of-use assets, net |
— | 208 | 73 | — | 281 | — | — | — | 281 | |||||||||||||||||||||||||||
| Goodwill |
— | 1,369 | 392 | — | 1,761 | — | — | — | 1,761 | |||||||||||||||||||||||||||
| Intangible assets subject to amortization, net |
— | 855 | 789 | — | 1,644 | — | — | — | 1,644 | |||||||||||||||||||||||||||
| Intangible assets not subject to amortization |
— | 71 | 80 | — | 151 | — | — | — | 151 | |||||||||||||||||||||||||||
| Deferred tax assets, net |
— | 47 | 8 | — | 55 | — | — | — | 55 | |||||||||||||||||||||||||||
| Other assets |
3 | 92 | 28 | — | 123 | — | — | — | 123 | |||||||||||||||||||||||||||
|
|
|
|
|
|
|
|
|
|
|
|
|
|
|
|
|
|
|
|||||||||||||||||||
| Total assets |
$ | 2,750 | $ | 5,889 | $ | 2,591 | $ | (5,106 | ) | $ | 6,124 | $ | 692 | $ | 692 | $ | (1,384 | ) | $ | 6,124 | ||||||||||||||||
|
|
|
|
|
|
|
|
|
|
|
|
|
|
|
|
|
|
|
|||||||||||||||||||
| Liabilities and Equity |
||||||||||||||||||||||||||||||||||||
| Current liabilities: |
||||||||||||||||||||||||||||||||||||
| Accounts payable |
$ | 1 | $ | 153 | $ | 92 | $ | — | $ | 246 | $ | — | $ | — | $ | — | $ | 246 | ||||||||||||||||||
| Accrued royalties |
— | 773 | 818 | — | 1,591 | — | — | — | 1,591 | |||||||||||||||||||||||||||
| Accrued liabilities |
— | 367 | 197 | — | 564 | — | — | — | 564 | |||||||||||||||||||||||||||
| Accrued interest |
34 | — | — | — | 34 | — | — | — | 34 | |||||||||||||||||||||||||||
| Operating lease liabilities, current |
— | 22 | 17 | — | 39 | — | — | — | 39 | |||||||||||||||||||||||||||
| Deferred revenue |
— | 56 | 111 | — | 167 | — | — | — | 167 | |||||||||||||||||||||||||||
| Other current liabilities |
— | 42 | 49 | — | 91 | — | — | — | 91 | |||||||||||||||||||||||||||
|
|
|
|
|
|
|
|
|
|
|
|
|
|
|
|
|
|
|
|||||||||||||||||||
| Total current liabilities |
35 | 1,413 | 1,284 | — | 2,732 | — | — | — | 2,732 | |||||||||||||||||||||||||||
| Long-term debt |
2,983 | — | — | — | 2,983 | — | — | — | 2,983 | |||||||||||||||||||||||||||
| Operating lease liabilities, noncurrent |
— | 252 | 60 | — | 312 | — | — | — | 312 | |||||||||||||||||||||||||||
| Deferred tax liabilities, net |
— | — | 154 | — | 154 | — | — | — | 154 | |||||||||||||||||||||||||||
| Other noncurrent liabilities |
38 | 95 | 96 | (1 | ) | 228 | — | — | — | 228 | ||||||||||||||||||||||||||
|
|
|
|
|
|
|
|
|
|
|
|
|
|
|
|
|
|
|
|||||||||||||||||||
| Total liabilities |
3,056 | 1,760 | 1,594 | (1 | ) | 6,409 | — | — | — | 6,409 | ||||||||||||||||||||||||||
|
|
|
|
|
|
|
|
|
|
|
|
|
|
|
|
|
|
|
|||||||||||||||||||
| Total Warner Music Group Corp. (deficit) equity |
(306 | ) | 4,125 | 980 | (5,105 | ) | (306 | ) | 692 | 692 | (1,384 | ) | (306 | ) | ||||||||||||||||||||||
| Noncontrolling interest |
— | 4 | 17 | — | 21 | — | — | — | 21 | |||||||||||||||||||||||||||
|
|
|
|
|
|
|
|
|
|
|
|
|
|
|
|
|
|
|
|||||||||||||||||||
| Total equity |
(306 | ) | 4,129 | 997 | (5,105 | ) | (285 | ) | 692 | 692 | (1,384 | ) | (285 | ) | ||||||||||||||||||||||
|
|
|
|
|
|
|
|
|
|
|
|
|
|
|
|
|
|
|
|||||||||||||||||||
| Total liabilities and equity |
$ | 2,750 | $ | 5,889 | $ | 2,591 | $ | (5,106 | ) | $ | 6,124 | $ | 692 | $ | 692 | $ | (1,384 | ) | $ | 6,124 | ||||||||||||||||
|
|
|
|
|
|
|
|
|
|
|
|
|
|
|
|
|
|
|
|||||||||||||||||||
F-94
Table of Contents
Consolidating Balance Sheet
September 30, 2019
| WMG Acquisition Corp. (issuer) |
Guarantor Subsidiaries |
Non- Guarantor Subsidiaries |
Eliminations | WMG Acquisition Corp. Consolidated |
WMG Holdings Corp. |
Warner Music Group Corp. |
Eliminations | Warner Music Group Corp. Consolidated |
||||||||||||||||||||||||||||
| (in millions) | ||||||||||||||||||||||||||||||||||||
| Assets |
||||||||||||||||||||||||||||||||||||
| Current assets: |
||||||||||||||||||||||||||||||||||||
| Cash and equivalents |
$ | — | $ | 386 | $ | 233 | $ | — | $ | 619 | $ | — | $ | — | $ | — | $ | 619 | ||||||||||||||||||
| Accounts receivable, net |
— | 334 | 441 | — | 775 | — | — | — | 775 | |||||||||||||||||||||||||||
| Inventories |
— | 11 | 63 | — | 74 | — | — | — | 74 | |||||||||||||||||||||||||||
| Royalty advances expected to be recouped within one year |
— | 112 | 58 | — | 170 | — | — | — | 170 | |||||||||||||||||||||||||||
| Prepaid and other current assets |
— | 12 | 41 | — | 53 | — | — | — | 53 | |||||||||||||||||||||||||||
|
|
|
|
|
|
|
|
|
|
|
|
|
|
|
|
|
|
|
|||||||||||||||||||
| Total current assets |
— | 855 | 836 | — | 1,691 | — | — | — | 1,691 | |||||||||||||||||||||||||||
| Due from (to) parent companies |
458 | (531 | ) | 73 | — | — | — | — | — | — | ||||||||||||||||||||||||||
| Investments in and advances to consolidated subsidiaries |
2,272 | 2,567 | — | (4,839 | ) | — | 878 | 878 | (1,756 | ) | — | |||||||||||||||||||||||||
| Royalty advances expected to be recouped after one year |
— | 137 | 71 | — | 208 | — | — | — | 208 | |||||||||||||||||||||||||||
| Property, plant and equipment, net |
— | 200 | 100 | — | 300 | — | — | — | 300 | |||||||||||||||||||||||||||
| Goodwill |
— | 1,370 | 391 | — | 1,761 | — | — | — | 1,761 | |||||||||||||||||||||||||||
| Intangible assets subject to amortization, net |
— | 884 | 839 | — | 1,723 | — | — | — | 1,723 | |||||||||||||||||||||||||||
| Intangible assets not subject to amortization |
— | 71 | 80 | — | 151 | — | — | — | 151 | |||||||||||||||||||||||||||
| Deferred tax assets, net |
— | 30 | 8 | — | 38 | — | — | — | 38 | |||||||||||||||||||||||||||
| Other assets |
7 | 115 | 23 | — | 145 | — | — | — | 145 | |||||||||||||||||||||||||||
|
|
|
|
|
|
|
|
|
|
|
|
|
|
|
|
|
|
|
|||||||||||||||||||
| Total assets |
$ | 2,737 | $ | 5,698 | $ | 2,421 | $ | (4,839 | ) | $ | 6,017 | $ | 878 | $ | 878 | $ | (1,756 | ) | $ | 6,017 | ||||||||||||||||
|
|
|
|
|
|
|
|
|
|
|
|
|
|
|
|
|
|
|
|||||||||||||||||||
| Liabilities and Equity |
||||||||||||||||||||||||||||||||||||
| Current liabilities: |
||||||||||||||||||||||||||||||||||||
| Accounts payable |
$ | — | $ | 160 | $ | 100 | $ | — | $ | 260 | $ | — | $ | — | $ | — | $ | 260 | ||||||||||||||||||
| Accrued royalties |
4 | 813 | 750 | — | 1,567 | — | — | — | 1,567 | |||||||||||||||||||||||||||
| Accrued liabilities |
— | 266 | 226 | — | 492 | — | — | — | 492 | |||||||||||||||||||||||||||
| Accrued interest |
34 | — | — | — | 34 | — | — | — | 34 | |||||||||||||||||||||||||||
| Deferred revenue |
— | 42 | 138 | — | 180 | — | — | — | 180 | |||||||||||||||||||||||||||
| Other current liabilities |
— | 221 | 65 | — | 286 | — | — | — | 286 | |||||||||||||||||||||||||||
|
|
|
|
|
|
|
|
|
|
|
|
|
|
|
|
|
|
|
|||||||||||||||||||
| Total current liabilities |
38 | 1,502 | 1,279 | — | 2,819 | — | — | — | 2,819 | |||||||||||||||||||||||||||
| Long-term debt |
2,974 | — | — | — | 2,974 | — | — | — | 2,974 | |||||||||||||||||||||||||||
| Deferred tax liabilities, net |
— | — | 172 | — | 172 | — | — | — | 172 | |||||||||||||||||||||||||||
| Other noncurrent liabilities |
14 | 200 | 107 | — | 321 | — | — | — | 321 | |||||||||||||||||||||||||||
|
|
|
|
|
|
|
|
|
|
|
|
|
|
|
|
|
|
|
|||||||||||||||||||
| Total liabilities |
3,026 | 1,702 | 1,558 | — | 6,286 | — | — | — | 6,286 | |||||||||||||||||||||||||||
|
|
|
|
|
|
|
|
|
|
|
|
|
|
|
|
|
|
|
|||||||||||||||||||
| Total Warner Music Group Corp. (deficit) equity |
(289 | ) | 3,992 | 847 | (4,839 | ) | (289 | ) | 878 | 878 | (1,756 | ) | (289 | ) | ||||||||||||||||||||||
| Noncontrolling interest |
— | 4 | 16 | — | 20 | — | — | — | 20 | |||||||||||||||||||||||||||
|
|
|
|
|
|
|
|
|
|
|
|
|
|
|
|
|
|
|
|||||||||||||||||||
| Total equity |
(289 | ) | 3,996 | 863 | (4,839 | ) | (269 | ) | 878 | 878 | (1,756 | ) | (269 | ) | ||||||||||||||||||||||
|
|
|
|
|
|
|
|
|
|
|
|
|
|
|
|
|
|
|
|||||||||||||||||||
| Total liabilities and equity |
$ | 2,737 | $ | 5,698 | $ | 2,421 | $ | (4,839 | ) | $ | 6,017 | $ | 878 | $ | 878 | $ | (1,756 | ) | $ | 6,017 | ||||||||||||||||
|
|
|
|
|
|
|
|
|
|
|
|
|
|
|
|
|
|
|
|||||||||||||||||||
F-95
Table of Contents
Consolidating Statement of Operations (Unaudited)
For The Three Months Ended March 31, 2020
| WMG Acquisition Corp. (issuer) |
Guarantor Subsidiaries |
Non- Guarantor Subsidiaries |
Eliminations | WMG Acquisition Corp. Consolidated |
WMG Holdings Corp. |
Warner Music Group Corp. |
Eliminations | Warner Music Group Corp. Consolidated |
||||||||||||||||||||||||||||
| (in millions) | ||||||||||||||||||||||||||||||||||||
| Revenue |
$ | — | $ | 484 | $ | 662 | $ | (75 | ) | $ | 1,071 | $ | — | $ | — | $ | — | $ | 1,071 | |||||||||||||||||
| Costs and expenses: |
||||||||||||||||||||||||||||||||||||
| Cost of revenue |
— | (248 | ) | (369 | ) | 82 | (535 | ) | — | — | — | (535 | ) | |||||||||||||||||||||||
| Selling, general and administrative expenses |
— | (360 | ) | (171 | ) | (7 | ) | (538 | ) | — | — | — | (538 | ) | ||||||||||||||||||||||
| Amortization of intangible assets |
— | (21 | ) | (26 | ) | — | (47 | ) | — | — | — | (47 | ) | |||||||||||||||||||||||
|
|
|
|
|
|
|
|
|
|
|
|
|
|
|
|
|
|
|
|||||||||||||||||||
| Total costs and expenses |
— | (629 | ) | (566 | ) | 75 | (1,120 | ) | — | — | — | (1,120 | ) | |||||||||||||||||||||||
|
|
|
|
|
|
|
|
|
|
|
|
|
|
|
|
|
|
|
|||||||||||||||||||
| Operating (loss) income |
— | (145 | ) | 96 | — | (49 | ) | — | — | — | (49 | ) | ||||||||||||||||||||||||
| Interest (expense) income, net |
(31 | ) | 1 | (3 | ) | — | (33 | ) | — | — | — | (33 | ) | |||||||||||||||||||||||
| Equity gains from equity method investments |
(46 | ) | 62 | — | (16 | ) | — | (75 | ) | (75 | ) | 150 | — | |||||||||||||||||||||||
| Other (expense) income, net |
(9 | ) | 3 | 2 | — | (4 | ) | — | — | — | (4 | ) | ||||||||||||||||||||||||
|
|
|
|
|
|
|
|
|
|
|
|
|
|
|
|
|
|
|
|||||||||||||||||||
| Income (loss) before income taxes |
(86 | ) | (79 | ) | 95 | (16 | ) | (86 | ) | (75 | ) | (75 | ) | 150 | (86 | ) | ||||||||||||||||||||
| Income tax benefit (expense) |
12 | 20 | (19 | ) | (1 | ) | 12 | — | — | — | 12 | |||||||||||||||||||||||||
|
|
|
|
|
|
|
|
|
|
|
|
|
|
|
|
|
|
|
|||||||||||||||||||
| Net (loss) income |
(74 | ) | (59 | ) | 76 | (17 | ) | (74 | ) | (75 | ) | (75 | ) | 150 | (74 | ) | ||||||||||||||||||||
| Less: Income attributable to noncontrolling interest |
— | — | — | — | — | — | — | — | — | |||||||||||||||||||||||||||
|
|
|
|
|
|
|
|
|
|
|
|
|
|
|
|
|
|
|
|||||||||||||||||||
| Net (loss) income attributable to Warner Music Group Corp. |
$ | (74 | ) | $ | (59 | ) | $ | 76 | $ | (17 | ) | $ | (74 | ) | $ | (75 | ) | $ | (75 | ) | $ | 150 | $ | (74 | ) | |||||||||||
|
|
|
|
|
|
|
|
|
|
|
|
|
|
|
|
|
|
|
|||||||||||||||||||
F-96
Table of Contents
Consolidating Statement of Operations (Unaudited)
For The Three Months Ended March 31, 2019
| WMG Acquisition Corp. (issuer) |
Guarantor Subsidiaries |
Non- Guarantor Subsidiaries |
Eliminations | WMG Acquisition Corp. Consolidated |
WMG Holdings Corp. |
Warner Music Group Corp. |
Eliminations | Warner Music Group Corp. Consolidated |
||||||||||||||||||||||||||||
| (in millions) | ||||||||||||||||||||||||||||||||||||
| Revenue |
$ | — | $ | 461 | $ | 672 | $ | (43 | ) | $ | 1,090 | $ | — | $ | — | $ | — | $ | 1,090 | |||||||||||||||||
| Costs and expenses: |
||||||||||||||||||||||||||||||||||||
| Cost of revenue |
— | (214 | ) | (391 | ) | 46 | (559 | ) | — | — | — | (559 | ) | |||||||||||||||||||||||
| Selling, general and administrative expenses |
— | (186 | ) | (166 | ) | (2 | ) | (354 | ) | — | — | — | (354 | ) | ||||||||||||||||||||||
| Amortization of intangible assets |
— | (25 | ) | (30 | ) | — | (55 | ) | — | — | — | (55 | ) | |||||||||||||||||||||||
|
|
|
|
|
|
|
|
|
|
|
|
|
|
|
|
|
|
|
|||||||||||||||||||
| Total costs and expenses |
— | (425 | ) | (587 | ) | 44 | (968 | ) | — | — | — | (968 | ) | |||||||||||||||||||||||
|
|
|
|
|
|
|
|
|
|
|
|
|
|
|
|
|
|
|
|||||||||||||||||||
| Operating income |
— | 36 | 85 | 1 | 122 | — | — | — | 122 | |||||||||||||||||||||||||||
| Loss on extinguishment of debt |
— | — | — | — | — | — | — | — | — | |||||||||||||||||||||||||||
| Interest (expense) income, net |
(31 | ) | 1 | (6 | ) | — | (36 | ) | — | — | — | (36 | ) | |||||||||||||||||||||||
| Equity gains from equity method investments |
130 | 34 | — | (164 | ) | — | 67 | 67 | (134 | ) | — | |||||||||||||||||||||||||
| Other income (expense), net |
16 | 51 | (38 | ) | — | 29 | — | — | — | 29 | ||||||||||||||||||||||||||
|
|
|
|
|
|
|
|
|
|
|
|
|
|
|
|
|
|
|
|||||||||||||||||||
| Income before income taxes |
115 | 122 | 41 | (163 | ) | 115 | 67 | 67 | (134 | ) | 115 | |||||||||||||||||||||||||
| Income tax expense |
(48 | ) | (49 | ) | (26 | ) | 75 | (48 | ) | — | — | — | (48 | ) | ||||||||||||||||||||||
|
|
|
|
|
|
|
|
|
|
|
|
|
|
|
|
|
|
|
|||||||||||||||||||
| Net income |
67 | 73 | 15 | (88 | ) | 67 | 67 | 67 | (134 | ) | 67 | |||||||||||||||||||||||||
| Less: Income attributable to noncontrolling interest |
— | — | — | — | — | — | — | — | — | |||||||||||||||||||||||||||
|
|
|
|
|
|
|
|
|
|
|
|
|
|
|
|
|
|
|
|||||||||||||||||||
| Net income attributable to Warner Music Group Corp. |
$ | 67 | $ | 73 | $ | 15 | $ | (88 | ) | $ | 67 | $ | 67 | $ | 67 | $ | (134 | ) | $ | 67 | ||||||||||||||||
|
|
|
|
|
|
|
|
|
|
|
|
|
|
|
|
|
|
|
|||||||||||||||||||
F-97
Table of Contents
Consolidating Statement of Operations (Unaudited)
For The Six Months Ended March 31, 2020
| WMG Acquisition Corp. (issuer) |
Guarantor Subsidiaries |
Non- Guarantor Subsidiaries |
Eliminations | WMG Acquisition Corp. Consolidated |
WMG Holdings Corp. |
Warner Music Group Corp. |
Eliminations | Warner Music Group Corp. Consolidated |
||||||||||||||||||||||||||||
| (in millions) | ||||||||||||||||||||||||||||||||||||
| Revenue |
$ | — | $ | 1,058 | $ | 1,466 | $ | (197 | ) | $ | 2,327 | $ | — | $ | — | $ | — | $ | 2,327 | |||||||||||||||||
| Costs and expenses: |
||||||||||||||||||||||||||||||||||||
| Cost of revenue |
— | (555 | ) | (816 | ) | 171 | (1,200 | ) | — | — | — | (1,200 | ) | |||||||||||||||||||||||
| Selling, general and administrative expenses |
— | (537 | ) | (406 | ) | 26 | (917 | ) | — | — | — | (917 | ) | |||||||||||||||||||||||
| Amortization of intangible assets |
— | (43 | ) | (51 | ) | — | (94 | ) | — | — | — | (94 | ) | |||||||||||||||||||||||
|
|
|
|
|
|
|
|
|
|
|
|
|
|
|
|
|
|
|
|||||||||||||||||||
| Total costs and expenses |
— | (1,135 | ) | (1,273 | ) | 197 | (2,211 | ) | — | — | — | (2,211 | ) | |||||||||||||||||||||||
|
|
|
|
|
|
|
|
|
|
|
|
|
|
|
|
|
|
|
|||||||||||||||||||
| Operating (loss) income |
— | (77 | ) | 193 | — | 116 | — | — | — | 116 | ||||||||||||||||||||||||||
| Interest (expense) income, net |
(62 | ) | 1 | (5 | ) | — | (66 | ) | — | — | — | (66 | ) | |||||||||||||||||||||||
| Equity gains from equity method investments |
108 | 148 | — | (256 | ) | — | 45 | 45 | (90 | ) | — | |||||||||||||||||||||||||
| Other (expense) income, net |
(7 | ) | 4 | (6 | ) | — | (9 | ) | — | — | — | (9 | ) | |||||||||||||||||||||||
|
|
|
|
|
|
|
|
|
|
|
|
|
|
|
|
|
|
|
|||||||||||||||||||
| Income before income taxes |
39 | 76 | 182 | (256 | ) | 41 | 45 | 45 | (90 | ) | 41 | |||||||||||||||||||||||||
| Income tax benefit (expense) |
7 | 19 | (42 | ) | 23 | 7 | — | — | — | 7 | ||||||||||||||||||||||||||
|
|
|
|
|
|
|
|
|
|
|
|
|
|
|
|
|
|
|
|||||||||||||||||||
| Net income |
46 | 95 | 140 | (233 | ) | 48 | 45 | 45 | (90 | ) | 48 | |||||||||||||||||||||||||
| Less: Income attributable to noncontrolling interest |
— | — | (2 | ) | — | (2 | ) | — | — | — | (2 | ) | ||||||||||||||||||||||||
|
|
|
|
|
|
|
|
|
|
|
|
|
|
|
|
|
|
|
|||||||||||||||||||
| Net income attributable to Warner Music Group Corp. |
$ | 46 | $ | 95 | $ | 138 | $ | (233 | ) | $ | 46 | $ | 45 | $ | 45 | $ | (90 | ) | $ | 46 | ||||||||||||||||
|
|
|
|
|
|
|
|
|
|
|
|
|
|
|
|
|
|
|
|||||||||||||||||||
F-98
Table of Contents
Consolidating Statement of Operations (Unaudited)
For The Six Months Ended March 31, 2019
| WMG Acquisition Corp. (issuer) |
Guarantor Subsidiaries |
Non- Guarantor Subsidiaries |
Eliminations | WMG Acquisition Corp. Consolidated |
WMG Holdings Corp. |
Warner Music Group Corp. |
Eliminations | Warner Music Group Corp. Consolidated |
||||||||||||||||||||||||||||
| (in millions) | ||||||||||||||||||||||||||||||||||||
| Revenue |
$ | — | $ | 942 | $ | 1,526 | $ | (175 | ) | $ | 2,293 | $ | — | $ | — | $ | — | $ | 2,293 | |||||||||||||||||
| Costs and expenses: |
||||||||||||||||||||||||||||||||||||
| Cost of revenue |
— | (437 | ) | (896 | ) | 148 | (1,185 | ) | — | — | — | (1,185 | ) | |||||||||||||||||||||||
| Selling, general and administrative expenses |
— | (375 | ) | (383 | ) | 28 | (730 | ) | — | — | — | (730 | ) | |||||||||||||||||||||||
| Amortization of intangible assets |
— | (50 | ) | (59 | ) | — | (109 | ) | — | — | — | (109 | ) | |||||||||||||||||||||||
|
|
|
|
|
|
|
|
|
|
|
|
|
|
|
|
|
|
|
|||||||||||||||||||
| Total costs and expenses |
— | (862 | ) | (1,338 | ) | 176 | (2,024 | ) | — | — | — | (2,024 | ) | |||||||||||||||||||||||
|
|
|
|
|
|
|
|
|
|
|
|
|
|
|
|
|
|
|
|||||||||||||||||||
| Operating income |
— | 80 | 188 | 1 | 269 | — | — | — | 269 | |||||||||||||||||||||||||||
| Loss on extinguishment of debt |
(3 | ) | — | — | — | (3 | ) | — | — | — | (3 | ) | ||||||||||||||||||||||||
| Interest (expense) income, net |
(62 | ) | 2 | (12 | ) | — | (72 | ) | — | — | — | (72 | ) | |||||||||||||||||||||||
| Equity gains from equity method investments |
302 | 143 | — | (445 | ) | — | 153 | 153 | (306 | ) | — | |||||||||||||||||||||||||
| Other income (expense), net |
14 | 70 | (27 | ) | — | 57 | — | — | — | 57 | ||||||||||||||||||||||||||
|
|
|
|
|
|
|
|
|
|
|
|
|
|
|
|
|
|
|
|||||||||||||||||||
| Income before income taxes |
251 | 295 | 149 | (444 | ) | 251 | 153 | 153 | (306 | ) | 251 | |||||||||||||||||||||||||
| Income tax expense |
(98 | ) | (94 | ) | (50 | ) | 144 | (98 | ) | — | — | — | (98 | ) | ||||||||||||||||||||||
|
|
|
|
|
|
|
|
|
|
|
|
|
|
|
|
|
|
|
|||||||||||||||||||
| Net income |
153 | 201 | 99 | (300 | ) | 153 | 153 | 153 | (306 | ) | 153 | |||||||||||||||||||||||||
| Less: Income attributable to noncontrolling interest |
— | — | — | — | — | — | — | — | — | |||||||||||||||||||||||||||
|
|
|
|
|
|
|
|
|
|
|
|
|
|
|
|
|
|
|
|||||||||||||||||||
| Net income attributable to Warner Music Group Corp. |
$ | 153 | $ | 201 | $ | 99 | $ | (300 | ) | $ | 153 | $ | 153 | $ | 153 | $ | (306 | ) | $ | 153 | ||||||||||||||||
|
|
|
|
|
|
|
|
|
|
|
|
|
|
|
|
|
|
|
|||||||||||||||||||
F-99
Table of Contents
Consolidating Statement of Comprehensive Income (Unaudited)
For The Three Months Ended March 31, 2020
| WMG Acquisition Corp. (issuer) |
Guarantor Subsidiaries |
Non- Guarantor Subsidiaries |
Eliminations | WMG Acquisition Corp. Consolidated |
WMG Holdings Corp. |
Warner Music Group Corp. |
Eliminations | Warner Music Group Corp. Consolidated |
||||||||||||||||||||||||||||
| (in millions) | ||||||||||||||||||||||||||||||||||||
| Net (loss) income |
$ | (74 | ) | $ | (59 | ) | $ | 76 | $ | (17 | ) | $ | (74 | ) | $ | (75 | ) | $ | (75 | ) | $ | 150 | $ | (74 | ) | |||||||||||
| Other comprehensive loss, net of tax: |
||||||||||||||||||||||||||||||||||||
| Foreign currency adjustment |
(15 | ) | — | 15 | (15 | ) | (15 | ) | (15 | ) | (15 | ) | 30 | (15 | ) | |||||||||||||||||||||
| Deferred loss on derivative financial instruments |
(23 | ) | — | (23 | ) | 23 | (23 | ) | (23 | ) | (23 | ) | 46 | (23 | ) | |||||||||||||||||||||
|
|
|
|
|
|
|
|
|
|
|
|
|
|
|
|
|
|
|
|||||||||||||||||||
| Other comprehensive loss, net of tax |
(38 | ) | — | (8 | ) | 8 | (38 | ) | (38 | ) | (38 | ) | 76 | (38 | ) | |||||||||||||||||||||
|
|
|
|
|
|
|
|
|
|
|
|
|
|
|
|
|
|
|
|||||||||||||||||||
| Total comprehensive (loss) income |
(112 | ) | (59 | ) | 68 | (9 | ) | (112 | ) | (113 | ) | (113 | ) | 226 | (112 | ) | ||||||||||||||||||||
| Less: Income attributable to noncontrolling interest |
— | — | — | — | — | — | — | — | — | |||||||||||||||||||||||||||
|
|
|
|
|
|
|
|
|
|
|
|
|
|
|
|
|
|
|
|||||||||||||||||||
| Comprehensive (loss) income attributable to Warner Music Group Corp. |
$ | (112 | ) | $ | (59 | ) | $ | 68 | $ | (9 | ) | $ | (112 | ) | $ | (113 | ) | $ | (113 | ) | $ | 226 | $ | (112 | ) | |||||||||||
|
|
|
|
|
|
|
|
|
|
|
|
|
|
|
|
|
|
|
|||||||||||||||||||
F-100
Table of Contents
Consolidating Statement of Comprehensive Income (Unaudited)
For The Three Months Ended March 31, 2019
| WMG Acquisition Corp. (issuer) |
Guarantor Subsidiaries |
Non- Guarantor Subsidiaries |
Eliminations | WMG Acquisition Corp. Consolidated |
WMG Holdings Corp. |
Warner Music Group Corp. |
Eliminations | Warner Music Group Corp. Consolidated |
||||||||||||||||||||||||||||
| (in millions) | ||||||||||||||||||||||||||||||||||||
| Net income |
$ | 67 | $ | 73 | $ | 15 | $ | (88 | ) | $ | 67 | $ | 67 | $ | 67 | $ | (134 | ) | $ | 67 | ||||||||||||||||
| Other comprehensive (loss) income, net of tax: |
||||||||||||||||||||||||||||||||||||
| Foreign currency adjustment |
(10 | ) | — | 10 | (10 | ) | (10 | ) | (13 | ) | (13 | ) | 26 | (10 | ) | |||||||||||||||||||||
| Deferred loss on derivative financial instruments |
(3 | ) | — | — | — | (3 | ) | (3 | ) | (3 | ) | 6 | (3 | ) | ||||||||||||||||||||||
|
|
|
|
|
|
|
|
|
|
|
|
|
|
|
|
|
|
|
|||||||||||||||||||
| Other comprehensive (loss) income, net of tax |
(13 | ) | — | 10 | (10 | ) | (13 | ) | (16 | ) | (16 | ) | 32 | (13 | ) | |||||||||||||||||||||
|
|
|
|
|
|
|
|
|
|
|
|
|
|
|
|
|
|
|
|||||||||||||||||||
| Total comprehensive income |
54 | 73 | 25 | (98 | ) | 54 | 51 | 51 | (102 | ) | 54 | |||||||||||||||||||||||||
| Less: Income attributable to noncontrolling interest |
— | — | — | — | — | — | — | — | — | |||||||||||||||||||||||||||
|
|
|
|
|
|
|
|
|
|
|
|
|
|
|
|
|
|
|
|||||||||||||||||||
| Comprehensive income attributable to Warner Music Group Corp. |
$ | 54 | $ | 73 | $ | 25 | $ | (98 | ) | $ | 54 | $ | 51 | $ | 51 | $ | (102 | ) | $ | 54 | ||||||||||||||||
|
|
|
|
|
|
|
|
|
|
|
|
|
|
|
|
|
|
|
|||||||||||||||||||
F-101
Table of Contents
Consolidating Statement of Comprehensive Income (Unaudited)
For The Six Months Ended March 31, 2020
| WMG Acquisition Corp. (issuer) |
Guarantor Subsidiaries |
Non- Guarantor Subsidiaries |
Eliminations | WMG Acquisition Corp. Consolidated |
WMG Holdings Corp. |
Warner Music Group Corp. |
Eliminations | Warner Music Group Corp. Consolidated |
||||||||||||||||||||||||||||
| (in millions) | ||||||||||||||||||||||||||||||||||||
| Net income |
$ | 46 | $ | 95 | $ | 140 | $ | (233 | ) | $ | 48 | $ | 45 | $ | 45 | $ | (90 | ) | $ | 48 | ||||||||||||||||
| Other comprehensive loss, net of tax: |
||||||||||||||||||||||||||||||||||||
| Foreign currency adjustment |
(8 | ) | — | 8 | (8 | ) | (8 | ) | 28 | 28 | (56 | ) | (8 | ) | ||||||||||||||||||||||
| Deferred loss on derivative financial instruments |
(20 | ) | — | (20 | ) | 20 | (20 | ) | (8 | ) | (8 | ) | 16 | (20 | ) | |||||||||||||||||||||
|
|
|
|
|
|
|
|
|
|
|
|
|
|
|
|
|
|
|
|||||||||||||||||||
| Other comprehensive loss, net of tax |
(28 | ) | — | (12 | ) | 12 | (28 | ) | 25 | 25 | (50 | ) | (28 | ) | ||||||||||||||||||||||
|
|
|
|
|
|
|
|
|
|
|
|
|
|
|
|
|
|
|
|||||||||||||||||||
| Total comprehensive income |
18 | 95 | 128 | (221 | ) | 20 | 70 | 70 | (140 | ) | 20 | |||||||||||||||||||||||||
| Less: Income attributable to noncontrolling interest |
— | — | (2 | ) | — | (2 | ) | — | — | — | (2 | ) | ||||||||||||||||||||||||
|
|
|
|
|
|
|
|
|
|
|
|
|
|
|
|
|
|
|
|||||||||||||||||||
| Comprehensive income attributable to Warner Music Group Corp. |
$ | 18 | $ | 95 | $ | 126 | $ | (221 | ) | $ | 18 | $ | 70 | $ | 70 | $ | (140 | ) | $ | 18 | ||||||||||||||||
|
|
|
|
|
|
|
|
|
|
|
|
|
|
|
|
|
|
|
|||||||||||||||||||
F-102
Table of Contents
Consolidating Statement of Comprehensive Income (Unaudited)
For The Six Months Ended March 31, 2019
| WMG Acquisition Corp. (issuer) |
Guarantor Subsidiaries |
Non- Guarantor Subsidiaries |
Eliminations | WMG Acquisition Corp. Consolidated |
WMG Holdings Corp. |
Warner Music Group Corp. |
Eliminations | Warner Music Group Corp. Consolidated |
||||||||||||||||||||||||||||
| (in millions) | ||||||||||||||||||||||||||||||||||||
| Net income |
$ | 153 | $ | 201 | $ | 99 | $ | (300 | ) | $ | 153 | $ | 153 | $ | 153 | $ | (306 | ) | $ | 153 | ||||||||||||||||
| Other comprehensive (loss) income, net of tax: |
||||||||||||||||||||||||||||||||||||
| Foreign currency adjustment |
(26 | ) | — | 26 | (26 | ) | (26 | ) | (29 | ) | (29 | ) | 58 | (26 | ) | |||||||||||||||||||||
| Deferred loss on derivative financial instruments |
(9 | ) | — | (2 | ) | 2 | (9 | ) | (9 | ) | (9 | ) | 18 | (9 | ) | |||||||||||||||||||||
|
|
|
|
|
|
|
|
|
|
|
|
|
|
|
|
|
|
|
|||||||||||||||||||
| Other comprehensive (loss) income, net of tax |
(35 | ) | — | 24 | (24 | ) | (35 | ) | (38 | ) | (38 | ) | 76 | (35 | ) | |||||||||||||||||||||
|
|
|
|
|
|
|
|
|
|
|
|
|
|
|
|
|
|
|
|||||||||||||||||||
| Total comprehensive income |
118 | 201 | 123 | (324 | ) | 118 | 115 | 115 | (230 | ) | 118 | |||||||||||||||||||||||||
| Less: Income attributable to noncontrolling interest |
— | — | — | — | — | — | — | — | — | |||||||||||||||||||||||||||
|
|
|
|
|
|
|
|
|
|
|
|
|
|
|
|
|
|
|
|||||||||||||||||||
| Comprehensive income attributable to Warner Music Group Corp. |
$ | 118 | $ | 201 | $ | 123 | $ | (324 | ) | $ | 118 | $ | 115 | $ | 115 | $ | (230 | ) | $ | 118 | ||||||||||||||||
|
|
|
|
|
|
|
|
|
|
|
|
|
|
|
|
|
|
|
|||||||||||||||||||
F-103
Table of Contents
Consolidating Statement of Cash Flows (Unaudited)
For The Six Months Ended March 31, 2020
| WMG Acquisition Corp. (issuer) |
Guarantor Subsidiaries |
Non- Guarantor Subsidiaries |
Eliminations | WMG Acquisition Corp. Consolidated |
WMG Holdings Corp. |
Warner Music Group Corp. |
Eliminations | Warner Music Group Corp. Consolidated |
||||||||||||||||||||||||||||
| (in millions) | ||||||||||||||||||||||||||||||||||||
| Cash flows from operating activities |
||||||||||||||||||||||||||||||||||||
| Net income |
$ | 46 | $ | 95 | $ | 140 | $ | (233 | ) | $ | 48 | $ | 45 | $ | 45 | $ | (90 | ) | $ | 48 | ||||||||||||||||
| Adjustments to reconcile net income to net cash provided by operating activities: |
||||||||||||||||||||||||||||||||||||
| Depreciation and amortization |
— | 74 | 58 | — | 132 | — | — | — | 132 | |||||||||||||||||||||||||||
| Unrealized gains and remeasurement of foreign-denominated loans and foreign currency forward exchange contracts |
6 | (3 | ) | (10 | ) | — | (7 | ) | — | — | — | (7 | ) | |||||||||||||||||||||||
| Deferred income taxes |
— | — | (31 | ) | — | (31 | ) | — | — | — | (31 | ) | ||||||||||||||||||||||||
| Net loss on investments |
— | 15 | — | — | 15 | — | — | — | 15 | |||||||||||||||||||||||||||
| Non-cash interest expense |
3 | — | — | — | 3 | — | — | — | 3 | |||||||||||||||||||||||||||
| Equity-based compensation expense |
— | 160 | — | — | 160 | — | — | — | 160 | |||||||||||||||||||||||||||
| Equity gains, including distributions |
(108 | ) | (148 | ) | — | 256 | — | (45 | ) | (45 | ) | 90 | — | |||||||||||||||||||||||
| Changes in operating assets and liabilities: |
||||||||||||||||||||||||||||||||||||
| Accounts receivable, net |
— | 11 | (5 | ) | — | 6 | — | — | — | 6 | ||||||||||||||||||||||||||
| Inventories |
— | — | 9 | — | 9 | — | — | — | 9 | |||||||||||||||||||||||||||
| Royalty advances |
— | (26 | ) | (21 | ) | — | (47 | ) | — | — | — | (47 | ) | |||||||||||||||||||||||
| Accounts payable and accrued liabilities |
— | 80 | (166 | ) | (23 | ) | (109 | ) | — | — | — | (109 | ) | |||||||||||||||||||||||
| Royalty payables |
— | (42 | ) | 80 | — | 38 | — | — | — | 38 | ||||||||||||||||||||||||||
| Accrued interest |
— | — | — | — | — | — | — | — | — | |||||||||||||||||||||||||||
| Operating lease liabilities |
— | (2 | ) | — | — | (2 | ) | — | — | — | (2 | ) | ||||||||||||||||||||||||
| Deferred revenue |
— | 13 | (27 | ) | — | (14 | ) | — | — | — | (14 | ) | ||||||||||||||||||||||||
| Other balance sheet changes |
4 | (18 | ) | (23 | ) | — | (37 | ) | — | — | — | (37 | ) | |||||||||||||||||||||||
|
|
|
|
|
|
|
|
|
|
|
|
|
|
|
|
|
|
|
|||||||||||||||||||
| Net cash (used in) provided by operating activities |
(49 | ) | 209 | 4 | — | 164 | — | — | — | 164 | ||||||||||||||||||||||||||
|
|
|
|
|
|
|
|
|
|
|
|
|
|
|
|
|
|
|
|||||||||||||||||||
| Cash flows from investing activities |
||||||||||||||||||||||||||||||||||||
| Acquisition of music publishing rights and music catalogs, net |
— | (12 | ) | (6 | ) | — | (18 | ) | — | — | — | (18 | ) | |||||||||||||||||||||||
| Capital expenditures |
— | (18 | ) | (10 | ) | — | (28 | ) | — | — | — | (28 | ) | |||||||||||||||||||||||
| Investments and acquisitions of businesses, net of cash received |
— | (1 | ) | (4 | ) | — | (5 | ) | — | — | — | (5 | ) | |||||||||||||||||||||||
| Advances from issuer |
49 | — | — | (49 | ) | — | — | — | — | — | ||||||||||||||||||||||||||
|
|
|
|
|
|
|
|
|
|
|
|
|
|
|
|
|
|
|
|||||||||||||||||||
| Net cash provided by (used in) investing activities |
49 | (31 | ) | (20 | ) | (49 | ) | (51 | ) | — | — | — | (51 | ) | ||||||||||||||||||||||
|
|
|
|
|
|
|
|
|
|
|
|
|
|
|
|
|
|
|
|||||||||||||||||||
| Cash flows from financing activities |
||||||||||||||||||||||||||||||||||||
| Dividend by Acquisition Corp. to Holdings Corp. |
— | (244 | ) | — | — | (244 | ) | — | — | — | (244 | ) | ||||||||||||||||||||||||
| Distribution to noncontrolling interest holder |
— | — | (1 | ) | — | (1 | ) | — | — | — | (1 | ) | ||||||||||||||||||||||||
| Change in due (from) to issuer |
— | (49 | ) | — | 49 | — | — | — | — | — | ||||||||||||||||||||||||||
|
|
|
|
|
|
|
|
|
|
|
|
|
|
|
|
|
|
|
|||||||||||||||||||
| Net cash used in financing activities |
— | (293 | ) | (1 | ) | 49 | (245 | ) | — | — | — | (245 | ) | |||||||||||||||||||||||
|
|
|
|
|
|
|
|
|
|
|
|
|
|
|
|
|
|
|
|||||||||||||||||||
| Effect of exchange rate changes on cash and equivalents |
— | — | (3 | ) | — | (3 | ) | — | — | — | (3 | ) | ||||||||||||||||||||||||
|
|
|
|
|
|
|
|
|
|
|
|
|
|
|
|
|
|
|
|||||||||||||||||||
| Net decrease in cash and equivalents |
— | (115 | ) | (20 | ) | — | (135 | ) | — | — | — | (135 | ) | |||||||||||||||||||||||
| Cash and equivalents at beginning of period |
— | 386 | 233 | — | 619 | — | — | — | 619 | |||||||||||||||||||||||||||
|
|
|
|
|
|
|
|
|
|
|
|
|
|
|
|
|
|
|
|||||||||||||||||||
| Cash and equivalents at end of period |
$ | — | $ | 271 | $ | 213 | $ | — | $ | 484 | $ | — | $ | — | $ | — | $ | 484 | ||||||||||||||||||
|
|
|
|
|
|
|
|
|
|
|
|
|
|
|
|
|
|
|
|||||||||||||||||||
F-104
Table of Contents
Consolidating Statement of Cash Flows (Unaudited)
For The Six Months Ended March 31, 2019
| WMG Acquisition Corp. (issuer) |
Guarantor Subsidiaries |
Non- Guarantor Subsidiaries |
Eliminations | WMG Acquisition Corp. Consolidated |
WMG Holdings Corp. |
Warner Music Group Corp. |
Eliminations | Warner Music Group Corp. Consolidated |
||||||||||||||||||||||||||||
| (in millions) | ||||||||||||||||||||||||||||||||||||
| Cash flows from operating activities |
||||||||||||||||||||||||||||||||||||
| Net income |
$ | 153 | $ | 201 | $ | 99 | $ | (300 | ) | $ | 153 | $ | 153 | $ | 153 | $ | (306 | ) | $ | 153 | ||||||||||||||||
| Adjustments to reconcile net income to net cash provided by operating activities: |
||||||||||||||||||||||||||||||||||||
| Depreciation and amortization |
— | 68 | 69 | — | 137 | — | — | — | 137 | |||||||||||||||||||||||||||
| Unrealized gains and remeasurement of foreign-denominated loans and foreign currency forward exchange contracts |
(20 | ) | (5 | ) | — | 1 | (24 | ) | — | — | — | (24 | ) | |||||||||||||||||||||||
| Deferred income taxes |
— | — | 27 | — | 27 | — | — | — | 27 | |||||||||||||||||||||||||||
| Loss on extinguishment of debt |
3 | — | — | — | 3 | — | — | — | 3 | |||||||||||||||||||||||||||
| Net gain on investments |
— | (30 | ) | (2 | ) | — | (32 | ) | — | — | — | (32 | ) | |||||||||||||||||||||||
| Non-cash interest expense |
3 | — | — | — | 3 | — | — | — | 3 | |||||||||||||||||||||||||||
| Equity-based compensation expense |
— | 14 | — | — | 14 | — | — | — | 14 | |||||||||||||||||||||||||||
| Equity gains, including distributions |
(302 | ) | (143 | ) | — | 445 | — | (153 | ) | (153 | ) | 306 | — | |||||||||||||||||||||||
| Changes in operating assets and liabilities: |
||||||||||||||||||||||||||||||||||||
| Accounts receivable, net |
— | (16 | ) | (74 | ) | — | (90 | ) | — | — | — | (90 | ) | |||||||||||||||||||||||
| Inventories |
— | 4 | 9 | — | 13 | — | — | — | 13 | |||||||||||||||||||||||||||
| Royalty advances |
— | (37 | ) | (24 | ) | — | (61 | ) | — | — | — | (61 | ) | |||||||||||||||||||||||
| Accounts payable and accrued liabilities |
— | 218 | (172 | ) | (146 | ) | (100 | ) | — | — | — | (100 | ) | |||||||||||||||||||||||
| Royalty payables |
6 | (93 | ) | 133 | — | 46 | — | — | — | 46 | ||||||||||||||||||||||||||
| Accrued interest |
1 | — | — | — | 1 | — | — | — | 1 | |||||||||||||||||||||||||||
| Deferred revenue |
— | (44 | ) | 25 | — | (19 | ) | — | — | — | (19 | ) | ||||||||||||||||||||||||
| Other balance sheet changes |
4 | 41 | (17 | ) | — | 28 | — | — | — | 28 | ||||||||||||||||||||||||||
|
|
|
|
|
|
|
|
|
|
|
|
|
|
|
|
|
|
|
|||||||||||||||||||
| Net cash (used in) provided by operating activities |
(152 | ) | 178 | 73 | — | 99 | — | — | — | 99 | ||||||||||||||||||||||||||
|
|
|
|
|
|
|
|
|
|
|
|
|
|
|
|
|
|
|
|||||||||||||||||||
| Cash flows from investing activities |
||||||||||||||||||||||||||||||||||||
| Acquisition of music publishing rights, net |
— | (11 | ) | (5 | ) | — | (16 | ) | — | — | — | (16 | ) | |||||||||||||||||||||||
| Capital expenditures |
— | (50 | ) | (9 | ) | — | (59 | ) | — | — | — | (59 | ) | |||||||||||||||||||||||
| Investments and acquisitions of businesses, net of cash received |
— | (26 | ) | (192 | ) | — | (218 | ) | — | — | — | (218 | ) | |||||||||||||||||||||||
| Proceeds from the sale of investments |
— | — | — | — | — | — | — | — | — | |||||||||||||||||||||||||||
| Advances from issuer |
(24 | ) | — | — | 24 | — | — | — | — | — | ||||||||||||||||||||||||||
|
|
|
|
|
|
|
|
|
|
|
|
|
|
|
|
|
|
|
|||||||||||||||||||
| Net cash used in investing activities |
(24 | ) | (87 | ) | (206 | ) | 24 | (293 | ) | — | — | — | (293 | ) | ||||||||||||||||||||||
|
|
|
|
|
|
|
|
|
|
|
|
|
|
|
|
|
|
|
|||||||||||||||||||
| Cash flows from financing activities |
||||||||||||||||||||||||||||||||||||
| Dividend by Acquisition Corp. to Holdings Corp. |
— | (31 | ) | — | — | (31 | ) | — | — | — | (31 | ) | ||||||||||||||||||||||||
| Proceeds from issuance of Acquisition Corp. 3.625% Senior Notes due 2026 |
287 | — | — | — | 287 | — | — | — | 287 | |||||||||||||||||||||||||||
| Repayment of Acquisition Corp. 4.125% Senior Secured Notes |
(40 | ) | — | — | — | (40 | ) | — | — | — | (40 | ) | ||||||||||||||||||||||||
| Repayment of Acquisition Corp. 4.875% Senior Secured Notes |
(30 | ) | — | — | — | (30 | ) | — | — | — | (30 | ) | ||||||||||||||||||||||||
| Repayment of Acquisition Corp. 5.625% Senior Secured Notes |
(27 | ) | — | — | — | (27 | ) | — | — | — | (27 | ) | ||||||||||||||||||||||||
| Call premiums paid on and redemption deposit for early redemption of debt |
(2 | ) | — | — | — | (2 | ) | — | — | — | (2 | ) | ||||||||||||||||||||||||
| Deferred financing costs paid |
(4 | ) | — | — | — | (4 | ) | — | — | — | (4 | ) | ||||||||||||||||||||||||
| Distribution to noncontrolling interest holder |
— | (1 | ) | (1 | ) | — | (2 | ) | — | — | — | (2 | ) | |||||||||||||||||||||||
| Change in due to (from) issuer |
— | 24 | — | (24 | ) | — | — | — | — | — | ||||||||||||||||||||||||||
|
|
|
|
|
|
|
|
|
|
|
|
|
|
|
|
|
|
|
|||||||||||||||||||
| Net cash provided by (used in) financing activities |
184 | (8 | ) | (1 | ) | (24 | ) | 151 | — | — | — | 151 | ||||||||||||||||||||||||
|
|
|
|
|
|
|
|
|
|
|
|
|
|
|
|
|
|
|
|||||||||||||||||||
| Effect of exchange rate changes on cash and equivalents |
— | — | (1 | ) | — | (1 | ) | — | — | — | (1 | ) | ||||||||||||||||||||||||
|
|
|
|
|
|
|
|
|
|
|
|
|
|
|
|
|
|
|
|||||||||||||||||||
| Net increase (decrease) in cash and equivalents |
8 | 83 | (135 | ) | — | (44 | ) | — | — | — | (44 | ) | ||||||||||||||||||||||||
| Cash and equivalents at beginning of period |
— | 169 | 345 | — | 514 | — | — | — | 514 | |||||||||||||||||||||||||||
|
|
|
|
|
|
|
|
|
|
|
|
|
|
|
|
|
|
|
|||||||||||||||||||
| Cash and equivalents at end of period |
$ | 8 | $ | 252 | $ | 210 | $ | — | $ | 470 | $ | — | $ | — | $ | — | $ | 470 | ||||||||||||||||||
|
|
|
|
|
|
|
|
|
|
|
|
|
|
|
|
|
|
|
|||||||||||||||||||
F-105
Table of Contents

Uproxx songkick emp warner music Nordics warner music Nashville warner music latin America warner music japan warner music france warner music central Europe warner music asia warner music entertainment warner music warner classics arts music warner chappell production music warner chappell music
Table of Contents
70,000,000 Shares

Warner Music Group Corp.
Class A Common Stock
| Morgan Stanley | Credit Suisse | Goldman Sachs & Co. LLC | BofA Securities | Citigroup | J.P. Morgan | |||||
| Barclays | Evercore ISI | Guggenheim Securities | Macquarie Capital | Nomura | RBC Capital Markets | |||||
| SunTrust Robinson Humphrey | CIBC Capital Markets | HSBC | SOCIETE GENERALE | LionTree | The Raine Group | |||||
| AmeriVet Securities | Bancroft Capital | Blaylock Van, LLC | C.L. King & Associates |
Loop Capital Markets | ||||
| Roberts & Ryan | Ramirez & Co., Inc. | Siebert Williams Shank | Telsey Advisory Group |
Tigress Financial Partners | ||||
, 2020
Through and including , 2020 (the 25th day after the date of this prospectus), all dealers that buy, sell or trade our Class A common stock, whether or not participating in this offering, may be required to deliver a prospectus. This is in addition to the dealers’ obligation to deliver a prospectus when acting as underwriters and with respect to their unsold allotments or subscriptions.
Table of Contents
PART II
INFORMATION NOT REQUIRED IN PROSPECTUS
| Item 13. | Other Expenses of Issuance and Distribution. |
The following table sets forth the estimated expenses payable by us in connection with the sale and distribution of the securities registered hereby, other than underwriting discounts or commissions. All amounts are estimates except for the SEC registration fee and the FINRA filing fee.
| SEC Registration Fee |
$ | 271,672 | ||
| FINRA Filing Fee |
$ | 225,500 | ||
| Listing Fee |
$ | 295,000 | ||
| Printing Fees and Expenses |
$ | 925,000 | ||
| Accounting Fees and Expenses |
$ | 768,000 | ||
| Legal Fees and Expenses |
$ | 4,027,500 | ||
| Blue Sky Fees and Expenses |
$ | 15,000 | ||
| Transfer Agent Fees and Expenses |
$ | 10,000 | ||
| Miscellaneous |
$ | 200,000 | ||
|
|
|
|||
| Total: |
$ | 6,737,672 | ||
|
|
|
| Item 14. | Indemnification of Directors and Officers. |
Warner Music Group Corp. is incorporated under the laws of the State of Delaware.
Section 145(a) of the DGCL provides that a corporation may indemnify any person who was or is a party or is threatened to be made a party to any threatened, pending or completed action, suit or proceeding, whether civil, criminal, administrative or investigative (other than an action by or in the right of the corporation) by reason of the fact that the person is or was a director, officer, employee or agent of the corporation, or is or was serving at the request of the corporation as a director, officer, employee or agent of another corporation, partnership, joint venture, trust or other enterprise, against expenses (including attorneys’ fees), judgments, fines and amounts paid in settlement actually and reasonably incurred by the person in connection with such action, suit or proceeding if the person acted in good faith and in a manner the person reasonably believed to be in or not opposed to the best interests of the corporation, and, with respect to any criminal action or proceeding, had no reasonable cause to believe the person’s conduct was unlawful.
Section 145(b) of the DGCL provides that a corporation may indemnify any person who was or is a party or is threatened to be made a party to any threatened, pending or completed action or suit by or in the right of the corporation to procure a judgment in its favor by reason of the fact that the person is or was a director, officer, employee or agent of the corporation, or is or was serving at the request of the corporation as a director, officer, employee or agent of another corporation, partnership, joint venture, trust or other enterprise, against expenses (including attorneys’ fees) actually and reasonably incurred by the person in connection with the defense or settlement of such action or suit if the person acted in good faith and in a manner the person reasonably believed to be in or not opposed to the best interests of the corporation and except that no indemnification shall be made in respect of any claim, issue or matter as to which such person shall have been adjudged to be liable to the corporation unless and only to the extent that the Delaware Court of Chancery or the court in which such action or suit was brought shall determine upon application that, despite the adjudication of liability but in view of all of the circumstances of the case, such person is fairly and reasonably entitled to indemnity for such expenses which the Delaware Court of Chancery or such other court shall deem proper.
Section 145(c) of the DGCL provides that to the extent that a present or former director or officer of a corporation has been successful on the merits or otherwise in defense of any action, suit or proceeding referred to
II-1
Table of Contents
in subsections (a) and (b) of Section 145 of the DGCL, or in defense of any claim, issue or matter therein, such person shall be indemnified against expenses (including attorneys’ fees) actually and reasonably incurred by such person in connection therewith.
Section 145(e) of the DGCL provides that expenses (including attorneys’ fees) incurred by an officer or director of the corporation in defending any civil, criminal, administrative or investigative action, suit or proceeding may be paid by the corporation in advance of the final disposition of such action, suit or proceeding upon receipt of an undertaking by or on behalf of such director or officer to repay such amount if it shall ultimately be determined that such person is not entitled to be indemnified by the corporation as authorized in Section 145 of the DGCL. Such expenses, including attorneys’ fees, incurred by former directors and officers or other employees and agents of the corporation or by persons serving at the request of the corporation as directors, officers, employees or agents of another corporation, partnership, joint venture, trust or other enterprise may be so paid upon such terms and conditions, if any, as the corporation deems appropriate.
Section 145(g) of the DGCL specifically allows a Delaware corporation to purchase liability insurance on behalf of its directors and officers and to insure against potential liability of such directors and officers regardless of whether the corporation would have the power to indemnify such directors and officers under Section 145 of the DGCL.
Section 102(b)(7) of the DGCL permits a Delaware corporation to include a provision in its certificate of incorporation eliminating or limiting the personal liability of directors to the corporation or its stockholders for monetary damages for breach of fiduciary duty as a director. This provision, however, may not eliminate or limit a director’s liability (1) for breach of the director’s duty of loyalty to the corporation or its stockholders; (2) for acts or omissions not in good faith or involving intentional misconduct or a knowing violation of law; (3) under Section 174 of the DGCL, which provides for liability of directors for unlawful payments of dividends or unlawful stock purchases, redemptions or other distributions; or (4) for any transaction from which the director derived an improper personal benefit.
Section 174 of the DGCL provides, among other things, that a director who willfully and negligently approves of an unlawful payment of dividends or an unlawful stock purchase or redemption may be held liable for such actions. A director who was either absent when the unlawful actions were approved or dissented at the time may avoid liability by causing his or her dissent to such actions to be entered in the books containing the minutes of the meetings of the board of directors at the time the action occurred or immediately after the absent director receives notice of the unlawful acts.
Our amended and restated certificate of incorporation will contain provisions permitted under the DGCL relating to the liability of directors. These provisions will eliminate a director’s personal liability for monetary damages resulting from a breach of fiduciary duty, except in circumstances involving:
| • | any breach of the director’s duty of loyalty; |
| • | acts or omissions not in good faith or which involve intentional misconduct or a knowing violation of the law; |
| • | unlawful payments of dividends or unlawful stock purchases, redemptions or other distributions; or |
| • | any transaction from which the director derives an improper personal benefit. |
Our amended and restated certificate of incorporation and our amended and restated by-laws will require us to indemnify and advance expenses to our directors and officers to the fullest extent not prohibited by the DGCL and other applicable law, except in the case of a proceeding instituted by the director without the approval of our Board. Our amended and restated certificate of incorporation and our amended and restated by-laws will provide that we are required to indemnify our directors and officers, to the fullest extent permitted by law, for all judgments, fines, settlements, legal fees and other expenses incurred in connection with pending or threatened
II-2
Table of Contents
legal proceedings because of the director’s or officer’s positions with us or another entity that the director or officer serves at our request, subject to various conditions, and to advance funds to our directors and officers to enable them to defend against such proceedings. To receive indemnification, the director or officer must have acted in good faith and in what was reasonably believed to be our best interest and, with respect to any criminal proceeding, had no reasonable cause to believe his or her conduct was unlawful.
Indemnification Agreements
Prior to the consummation of this offering, we will enter into indemnification agreements with our directors. The indemnification agreements will provide the directors with contractual rights to the indemnification and expense advancement rights provided under our amended and restated by-laws, as well as contractual rights to additional indemnification as provided in the indemnification agreements.
The indemnification agreements will provide for the advancement or payment of all expenses to the indemnitee and for reimbursement to us if it is found that such indemnitee is not entitled to such indemnification under applicable law and our amended and restated certificate of incorporation and amended and restated by-laws.
Directors’ and Officers’ Liability Insurance
We have obtained directors’ and officers’ liability insurance that insures against certain liabilities that our directors and officers and the directors and officers of our subsidiaries may, in such capacities, incur.
| Item 15. | Recent Sales of Unregistered Securities. |
None.
| Item 16. | Exhibits and Financial Statement Schedules. |
(a) Exhibits.
The Exhibits to this Registration Statement on Form S-1 are listed in the Exhibit Index which precedes the signature pages to this Registration Statement and is herein incorporated by reference.
(b) Financial Statement Schedules:
Schedule II—Valuation of Qualifying Accounts beginning on page F-63.
| Item 17. | Undertakings. |
| (a) | Insofar as indemnification for liabilities arising under the Securities Act of 1933 may be permitted to directors, officers and controlling persons of the registrant pursuant to the foregoing provisions, or otherwise, the registrant has been advised that in the opinion of the U.S. Securities and Exchange Commission such indemnification is against public policy as expressed in the Act and is, therefore, unenforceable. In the event that a claim for indemnification against such liabilities (other than the payment by the registrant of expenses incurred or paid by a director, officer or controlling person of the registrant in the successful defense of any action, suit or proceeding) is asserted by such director, officer or controlling person in connection with the securities being registered, the registrant will, unless in the opinion of its counsel the matter has been settled by controlling precedent, submit to a court of appropriate jurisdiction the question of whether such indemnification by it is against public policy as expressed in the Act and will be governed by the final adjudication of such issue. |
II-3
Table of Contents
| (b) | The undersigned registrant hereby undertakes that: |
| (1) | For purposes of determining any liability under the Securities Act of 1933, the information omitted from the form of prospectus filed as part of this registration statement in reliance upon Rule 430A and contained in a form of prospectus filed by the registrant pursuant to Rule 424(b)(1) or (4) or 497(h) under the Securities Act shall be deemed to be part of this registration statement as of the time it was declared effective. |
| (2) | For the purpose of determining any liability under the Securities Act of 1933, each post-effective amendment that contains a form of prospectus shall be deemed to be a new registration statement relating to the securities offered therein, and the offering of such securities at that time shall be deemed to be the initial bona fide offering thereof. |
II-4
Table of Contents
EXHIBIT INDEX
In reviewing the agreements included as exhibits to this Registration Statement on Form S-1, please remember that they are included to provide you with information regarding their terms. The agreements contain representations and warranties by each of the parties to the applicable agreement. These representations and warranties were made for the benefit of the other parties to the applicable agreement and (i) were not intended to be treated as categorical statements of fact, but rather as a way of allocating the risk to one of the parties if those statements prove to be inaccurate; (ii) may have been qualified in such agreement by disclosures that were made to the other party in connection with the negotiation of the applicable agreement, which disclosures are not necessarily reflected in the agreement; (iii) may apply contract standards of “materiality” that are different from “materiality” under applicable securities laws; and (iv) were made only as of the date of the applicable agreement or such other date or dates as may be specified in the agreement and are subject to more recent developments. Additional information about Warner Music Group Corp., its subsidiaries and affiliates may be found elsewhere in this Registration Statement on Form S-1.
II-5
Table of Contents
II-6
Table of Contents
II-7
Table of Contents
| * | Filed herewith. |
| (1) | Filed previously on February 6, 2020. |
| (2) | Filed previously on May 7, 2020. |
| † | Identifies each management contract or compensatory plan or arrangement in which directors and/or executive officers are eligible to participate. |
II-8
Table of Contents
Pursuant to the requirements of the Securities Act of 1933, as amended, Warner Music Group Corp. has duly caused this registration statement to be signed on its behalf by the undersigned, thereunto duly authorized, in the City of New York, State of New York on May 26, 2020.
| WARNER MUSIC GROUP CORP. | ||
| By: | /s/ Stephen Cooper | |
| Name: Stephen Cooper | ||
| Title: Chief Executive Officer | ||
Pursuant to the requirements of the Securities Act of 1933, as amended, this registration statement has been signed on May 26, 2020 by the following persons in the capacities indicated.
| Signature |
Title | |
| * |
Chief Executive Officer; Director (Principal Executive Officer) | |
| Stephen Cooper | ||
| * Eric Levin |
Executive Vice President and Chief Financial Officer (Principal Financial Officer and Principal Accounting Officer) | |
| * Michael Lynton |
Chairman of the Board of Directors | |
| * Len Blavatnik |
Vice Chairman of the Board of Directors | |
| * Lincoln Benet |
Director | |
| * Alex Blavatnik |
Director | |
S-1
Table of Contents
| Signature |
Title | |
| * Mathias Döpfner |
Director | |
| * Noreena Hertz |
Director | |
| * Ynon Kreiz |
Director | |
| * Max Lousada |
Director | |
| * Thomas H. Lee |
Director | |
| * Donald A. Wagner |
Director | |
| *By: |
/s/ Paul M. Robinson Paul M. Robinson as Attorney-in-Fact |
|||
S-2