Attached files
| file | filename |
|---|---|
| 8-K - FORM 8-K - FIRST BUSEY CORP /NV/ | tm2020889-1_8k.htm |
Exhibit 99.1

1 1 May 2020 INVESTOR PRESENTATION

2 2 Special Note Concerning Forward - Looking Statements Statements made in this document, other than those concerning historical financial information, may be considered forward - looking statements within the meaning of the Private Securities Litigation Reform Act of 1995 with respect to the financial condition, results of operations, plans, objectives, future performance and business of the Company. Forward - looking statements, which may be based upon beliefs, expectations and assumptions of the Company’s management and on information currently available to management, are generally identifiable by the use of words such as “believe,” “expect,” “anticipate,” “plan,” “intend,” “estimate,” “may,” “will,” “would,” “could,” “should” or other similar expressions. Additionally, all statements in this document, including forward - looking statements, speak only as of the date they are made, and the Company undertakes no obligation to update any statement in light of new information or future events. A number of factors, many of which are beyond the Company’s ability to control or predict, could cause actual results to differ materially from those in the Company’s forward - looking statements. These factors include, among others, the following: ( i ) the strength of the local, state, national and international economy (including the impact of the 2020 presidential election and the impact of tariffs, a U.S. withdrawal from or significant negotiation of trade agreements, trade wars and other changes in trade regulations); (ii) the economic impact of any future terrorist threats or attacks, widespread disease or pandemics (including the COVID - 19 pandemic in the United States), or other adverse external events that could cause economic deterioration or instability in credit markets; (iii) changes in state and federal laws, regulations and governmental policies concerning the Company’s general business; (iv) changes in accounting policies and practices, including CECL, that will change how the Company estimates credit losses; (v) changes in interest rates and prepayment rates of the Company’s assets (including the impact of The London Inter - bank Offered Rate phase - out); (vi) increased competition in the financial services sector and the inability to attract new customers; (vii) changes in technology and the ability to develop and maintain secure and reliable electronic systems; (viii) the loss of key executives or associates; (ix) changes in consumer spending; (x) unexpected results of current and/or future acquisitions, which may include failure to realize the anticipated benefits of the acquisition and the possibility that the transaction costs may be greater than anticipated; (xi) unexpected outcomes of existing or new litigation involving the Company; and (xii) the economic impact of exceptional weather occurrences such as tornadoes, hurricanes, floods, and blizzards. These risks and uncertainties should be considered in evaluating forward - looking statements and undue reliance should not be placed on such statements. Additional information concerning the Company and its business, including additional factors that could materially affect its financial results, is included in the Company’s filings with the Securities and Exchange Commission.
3 3 Non - GAAP Financial Measures This document contains financial information determined other than in accordance with accounting principles generally accepted in the United States of America (“GAAP”). Management uses these “non - GAAP” measures in its analysis of the Company’s performance. Management also believes that these non - GAAP financial measures allow for better comparability of period to period operating performance. Additionally, the Company believes this information is utilized by regulators and market analysts to evaluate a company’s financial condition, and therefore, such information is useful to investors. These disclosures should not be viewed as a substitute for operating results determined in accordance with GAAP, nor are they necessarily comparable to non - GAAP performance measures that may be presented by other companies. A reconciliation of the non - GAAP measures used in this document to the most directly comparable GAAP measures is provided beginning on page 39 of this document. For more details on the Company’s non - GAAP measures, refer to the Company’s Annual Report on Form 10 - K for the year ended December 31, 2019.

4 4 OVERVIEW OF FIRST BUSEY CORPORATION 4
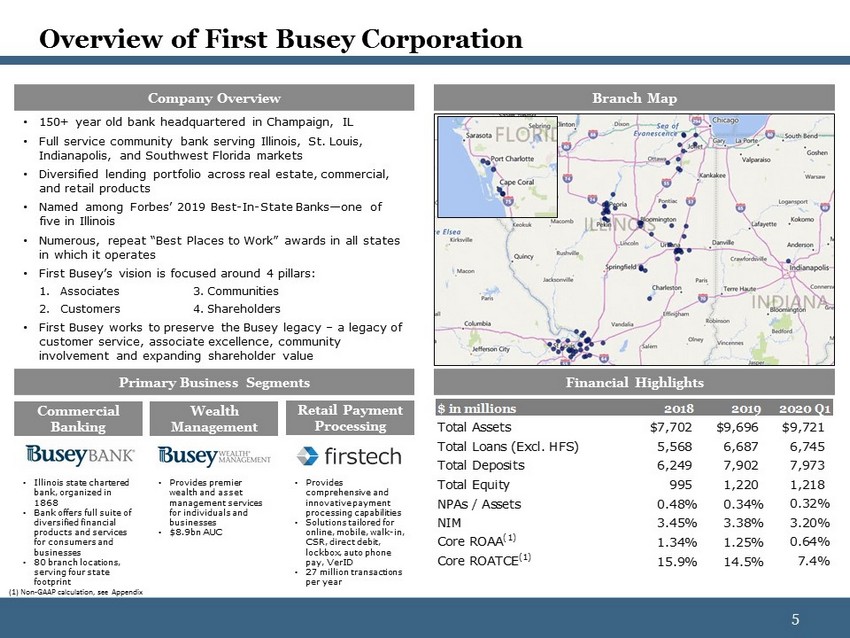
5 5 Overview of First Busey Corporation Company Overview Branch Map Primary Business Segments Financial Highlights Commercial Banking Wealth Management Retail Payment Processing • Illinois state chartered bank, organized in 1868 • Bank offers full suite of diversified financial products and services for consumers and businesses • 80 branch locations, serving four state footprint • Provides premier wealth and asset management services for individuals and businesses • $8.9bn AUC • Provides comprehensive and innovative payment processing capabilities • Solutions tailored for online, mobile, walk - in, CSR, direct debit, lockbox, auto phone pay, VerID • 27 million transactions per year • 150+ year old bank headquartered in Champaign, IL • Full service community bank serving Illinois, St. Louis, Indianapolis, and Southwest Florida markets • Diversified lending portfolio across real estate, commercial, and retail products • Named among Forbes’ 2019 Best - In - State Banks — one of five in Illinois • Numerous, repeat “Best Places to Work” awards in all states in which it operates • First Busey’s vision is focused around 4 pillars: 1. Associates 3. Communities 2. Customers 4. Shareholders • First Busey works to preserve the Busey legacy – a legacy of customer service, associate excellence, community involvement and expanding shareholder value • $ in millions 2018 2019 2020 Q1 Total Assets $7,702 $9,696 $9,721 Total Loans (Excl. HFS) 5,568 6,687 6,745 Total Deposits 6,249 7,902 7,973 Total Equity 995 1,220 1,218 NPAs / Assets 0.48% 0.34% 0.32% NIM 3.45% 3.38% 3.20% Core ROAA (1) 1.34% 1.25% 0.64% Core ROATCE (1) 15.9% 14.5% 7.4% (1) Non - GAAP calculation, see Appendix
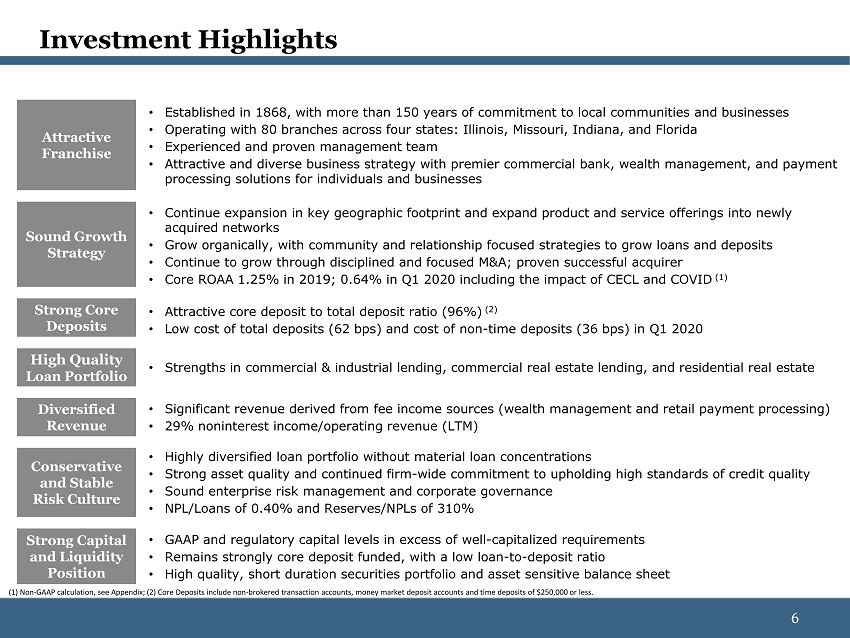
6 6 Investment Highlights • Established in 1868 , with more than 150 years of commitment to local communities and businesses • Operating with 80 branches across four states: Illinois , Missouri, Indiana, and Florida • Experienced and proven management team • Attractive and diverse business strategy with premier commercial bank, wealth management, and payment processing solutions for individuals and businesses Attractive Franchise Sound Growth Strategy Strong Core Deposits Strong Capital and Liquidity Position High Quality Loan Portfolio Diversified Revenue Conservative and Stable Risk Culture • Continue expansion in key geographic footprint and expand product and service offerings into newly acquired networks • Grow organically, with community and relationship focused strategies to grow loans and deposits • Continue to grow through disciplined and focused M&A; proven successful acquirer • Core ROAA 1.25% in 2019; 0.64% in Q1 2020 including the impact of CECL and COVID (1) • Attractive core deposit to total deposit ratio (96%) (2 ) • Low cost of total deposits (62 bps) and cost of non - time deposits (36 bps) in Q1 2020 • Strengths in commercial & industrial lending , commercial real estate lending, and residential real estate • Significant revenue derived from fee income sources (wealth management and retail payment processing) • 29% noninterest income/operating revenue (LTM) • Highly diversified loan portfolio without material loan concentrations • Strong asset quality and continued firm - wide commitment to upholding high standards of credit quality • Sound enterprise risk management and corporate governance • NPL/Loans of 0.40 % and Reserves/NPLs of 310 % • GAAP and regulatory capital levels in excess of well - capitalized requirements • Remains strongly core deposit funded, with a low loan - to - deposit ratio • High quality, short duration securities portfolio and asset sensitive balance sheet (1) Non - GAAP calculation, see Appendix; (2) Core Deposits include non - brokered transaction accounts, money market deposit accounts, and time deposits of $250,000 or less
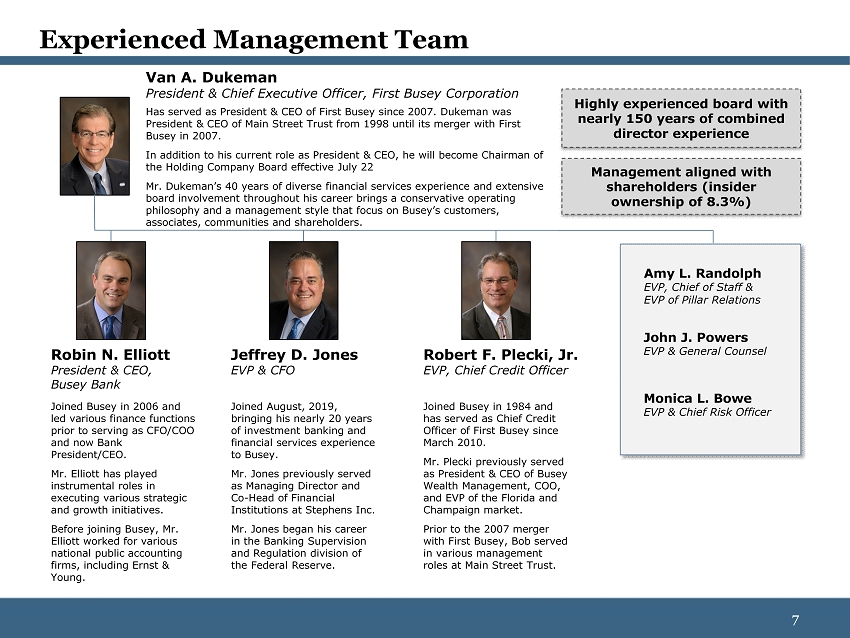
7 7 Experienced Management Team Van A. Dukeman President & Chief Executive Officer, First Busey Corporation Robin N. Elliott President & CEO, Busey Bank Jeffrey D. Jones EVP & CFO Robert F. Plecki, Jr. EVP, Chief Credit Officer John J. Powers EVP & General Counsel Monica L. Bowe EVP & Chief Risk Officer Has served as President & CEO of First Busey since 2007. Dukeman was President & CEO of Main Street Trust from 1998 until its merger with First Busey in 2007 . In addition to his current role as President & CEO, he will become Chairman of the Holding Company Board effective July 22 Mr. Dukeman’s 40 years of diverse financial services experience and extensive board involvement throughout his career brings a conservative operating philosophy and a management style that focus on Busey’s customers, associates, communities and shareholders. Joined Busey in 2006 and led various finance functions prior to serving as CFO/COO and now Bank President/CEO. Mr. Elliott has played instrumental roles in executing various strategic and growth initiatives. Before joining Busey, Mr. Elliott worked for various national public accounting firms, including Ernst & Young. Joined August, 2019, bringing his nearly 20 years of investment banking and financial services experience to Busey. Mr. Jones previously served as Managing Director and Co - Head of Financial Institutions at Stephens Inc. Mr. Jones began his career in the Banking Supervision and Regulation division of the Federal Reserve. Joined Busey in 1984 and has served as Chief Credit Officer of First Busey since March 2010. Mr . Plecki previously served as President & CEO of Busey Wealth Management, COO, and EVP of the Florida and Champaign market. Prior to the 2007 merger with First Busey , Bob served in various management roles at Main Street Trust. Highly experienced board with nearly 150 years of combined director experience Management aligned with shareholders (insider ownership of 8.3%) Amy L. Randolph EVP , Chief of Staff & EVP of Pillar Relations
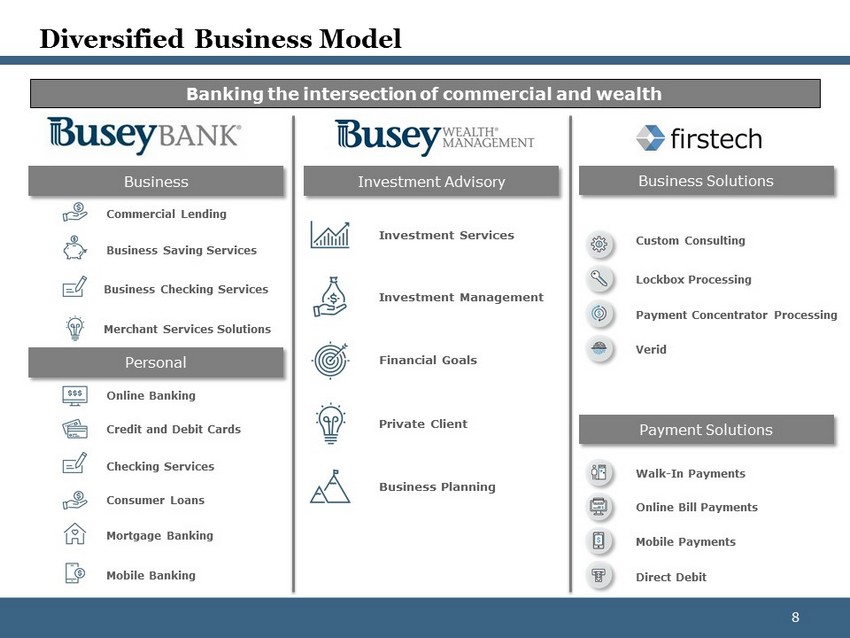
8 8 Online Banking Credit and Debit Cards Checking Services Consumer Loans Commercial Lending Business Saving Services Personal Business Mortgage Banking Mobile Banking Diversified Business Model Investment Services Investment Management Financial Goals Private Client Business Planning Business Checking Services Merchant Services Solutions Custom Consulting Lockbox Processing Payment Concentrator Processing Verid Walk - In Payments Online Bill Payments Mobile Payments Direct Debit Business Solutions Payment Solutions Investment Advisory Banking the intersection of commercial and wealth

9 9 Attractive Geographic Footprint Four Distinct Operating Regions provide for attractive mix of customers and demographic opportunities Northern Gateway Central Florida Banking Centers: 10 Deposits: $ 857MM Median HHI: $74,285 Banking Centers: 29 Deposits: $2.6B 2020 Pop.: 2.8 Million Banking Centers: 36 Deposits: $4.0B DMS Rank: Top 5 in 7 out of 8 IL Markets Banking Centers: 5 Deposits: $289MM 2020 - 25 Pop. Growth: 6.6% versus U.S. a vg. 3.3% Source : S&P Global Market Intelligence, US Census Claritas

10 10 $3,998 $5,425 $7,861 $7,702 $9,696 $9,721 2015 2016 2017 2018 2019 2020 Q1 Disciplined acquisition strategy has augmented strong organic growth Total Assets ($ M ) January 2015 Assets - $274mm AUC - $154mm Branches – 3 MSA - Peoria April 2016 Assets - $1.6bn Branches – 13 MSA – St. Louis July 2017 Assets - $1.4bn Branches – 9 MSA – Chicago October 2017 Assets - $667mm AUC - $600mm Branches – 13 MSA – Peoria January 2019 Assets - $1.7bn AUC – $1.5bn Branches – 19 MSA – St. Louis August 2019 Wealth Management AUC – $ 471mm MSA – Fort Myers Prudent acquisitions with TBV earn back periods of 3 years or less Excellence in Acquiring & Integrating

11 11 FINANCIAL SUMMARY 11

12 12 $26,614 $29,498 $30,535 $31,782 $15,479 $0.50 $0.53 $0.55 $0.57 $0.28 2019 Q1 2019 Q2 2019 Q3 2019 Q4 2020 Q1 $38,602 $42,823 $43,600 $41,131 $38,211 1.77% 1.80% 1.79% 1.68% 1.59% 2019 Q1 2019 Q2 2019 Q3 2019 Q4 2020 Q1 Core Earnings Power Core Net Income & Earnings Per Share (1) Core ROAA & ROATCE (1) Core Pre - Provision Net Revenue / Avg. Assets (1) Net Interest Margin $ in thousands 14.3% 14.5% 14.5% 14.9% 7.4% 1.22% 1.24% 1.25% 1.30% 0.64% 2019 Q1 2019 Q2 2019 Q3 2019 Q4 2020 Q1 $ in thousands (1) Non - GAAP calculation, see Appendix
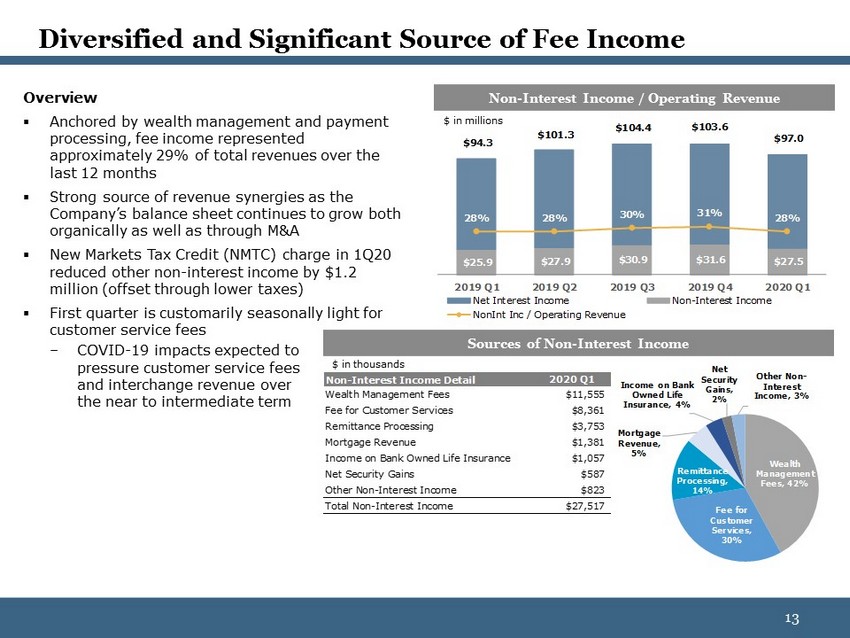
13 13 Overview ▪ Anchored by wealth management and payment processing, fee income represented approximately 29% of total revenues over the last 12 months ▪ Strong source of revenue synergies as the Company’s balance sheet continues to grow both organically as well as through M&A ▪ New Markets Tax Credit (NMTC) charge in 1Q20 reduced other non - interest income by $ 1.2 million (offset through lower taxes) ▪ First quarter is customarily seasonally light for customer service fees – COVID - 19 impacts expected to pressure customer service fees and interchange revenue over the near to intermediate term $25.9 $27.9 $30.9 $31.6 $27.5 $94.3 $101.3 $104.4 $103.6 $97.0 28% 28% 30% 31% 28% 2019 Q1 2019 Q2 2019 Q3 2019 Q4 2020 Q1 Net Interest Income Non-Interest Income NonInt Inc / Operating Revenue Diversified and Significant Source of Fee Income Non - Interest Income / Operating Revenue Sources of Non - Interest Income $ in millions $ in thousands Wealth Management Fees , 42% Fee for Customer Services , 30% Remittance Processing , 14% Mortgage Revenue , 5% Income on Bank Owned Life Insurance , 4% Net Security Gains , 2% Other Non - Interest Income , 3% Non-Interest Income Detail 2020 Q1 Wealth Management Fees $11,555 Fee for Customer Services $8,361 Remittance Processing $3,753 Mortgage Revenue $1,381 Income on Bank Owned Life Insurance $1,057 Net Security Gains $587 Other Non-Interest Income $823 Total Non-Interest Income $27,517

14 14 $9,133 $9,594 $8,994 $11,354 $11,709 $3,569 $3,845 $2,951 $4,176 $4,735 2019 Q1 2019 Q2 2019 Q3 2019 Q4 2020 Q1 Revenue Pre-Tax Net Income $8,886 $8,967 $9,409 $9,696 $8,925 2019 Q1 2019 Q2 2019 Q3 2019 Q4 2020 Q1 Resilient Wealth Management Platform Wealth – Assets Under Care Wealth – Revenue & Pre - tax Income $ in thousands $ in thousands Overview ▪ Provides a full range of asset management, investment and fiduciary services to individuals, businesses and foundations, tax preparation, philanthropic advisory services and farm and brokerage services Q1 2020 Summary ▪ Conducted a successful core system conversion of Investors Securities Trust in 1Q20 (acquisition closed in 3Q19) ▪ Conducted an aggressive client communication program in February and March which included webinars, email blasts, podcasts, social media and a robust outbound calling program ▪ Had positive net asset flows for the first quarter which included $127.4 million in new assets booked during the quarter ▪ 90 - day new asset pipeline has remained constant throughout COVID - 19 crisis ▪ Pre - tax profit margin of 40.4% in the Wealth Management segment in 1Q20 YE 2019 to Q1 2020: S&P 500: (20%) BUSE AUC: (8%)

15 15 $5,579 $6,031 $6,056 $6,345 $6,429 2.4% 2.4% 2.4% 2.4% 2.4% 2019 Q1 2019 Q2 2019 Q3 2019 Q4 2020 Q1 Avg. Assets / FTE NIE / Avg Assets $53,590 $58,315 $58,091 $59,157 $57,812 $1,017 56.4% 56.6% 55.4% 57.0% 59.5% 58.5% 2019 Q1 2019 Q2 2019 Q3 2019 Q4 2020 Q1 Noninterest Expense NIE (CECL addition) Efficiency Ratio Efficiency Ratio (ex-CECL) Focused Control on Expense Core Non - Interest Expense & Efficiency Ratio (1) Avg. Assets / FTE & Core NIE (1) / Avg. Assets $ in thousands $ in thousands (1) Non - GAAP calculation, see Appendix Overview ▪ The Company continues to manage its efficiency ratio by limiting nominal costs, as well as leveraging efficiencies throughout its branch network as a result of its successful M&A strategy and strong top - line growth Q1 2020 Summary ▪ Core adjusted expenses of $ 57.8 million in 1Q20 excluding amortization, acquisition / restructuring related charges and CECL (unfunded reserve) ▪ Lowest level since 2Q19, which was the first full quarter of combined operations following the acquisition of TheBANK of Edwardsville ▪ Margin compression resulting from Fed rate cuts has been the largest driver of the slight uptick in the efficiency ratio since 3Q19 ▪ Additional expense reductions versus budget expected in 2Q20 – 4Q20; anticipated to be $5 - 10 million in aggregate
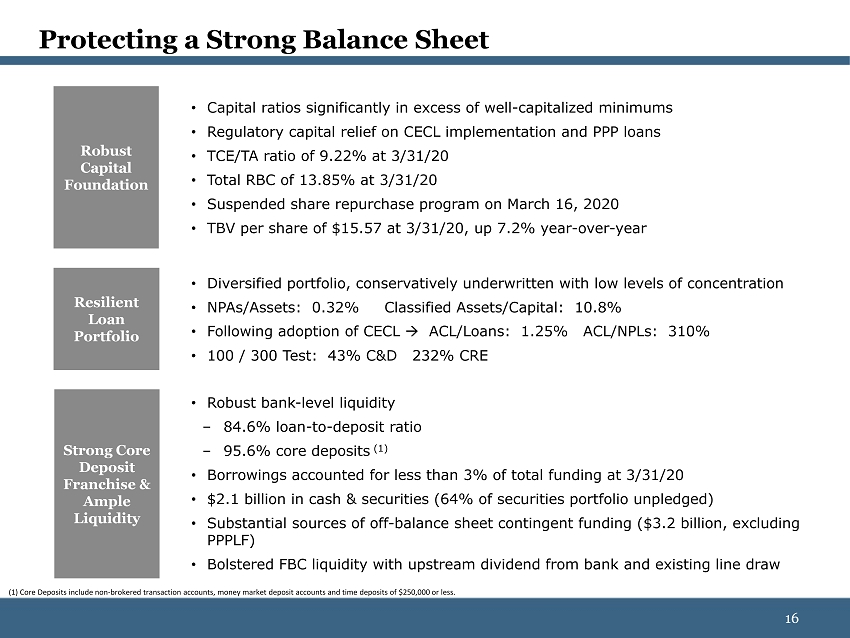
16 16 • Capital ratios significantly in excess of well - capitalized minimums • Regulatory capital relief on CECL implementation and PPP loans • TCE/TA ratio of 9.22% at 3/31/20 • Total RBC of 13.85% at 3/31/20 • Suspended share repurchase program on March 16, 2020 • TBV per share of $15.57 at 3/31/20, up 7.2% year - over - year • Diversified portfolio, conservatively underwritten with low levels of concentration • NPAs/Assets: 0.32% Classified Assets/Capital: 10.8% • Following adoption of CECL ACL/Loans: 1.25% ACL/NPLs: 310% • 100 / 300 Test: 43% C&D 232% CRE • Robust bank - level liquidity – 84.6 % loan - to - deposit ratio – 95.6% core deposits (1) • Borrowings accounted for less than 3% of total funding at 3/31/20 • $2.1 billion in cash & securities (64% of securities portfolio unpledged) • Substantial sources of off - balance sheet contingent funding ($3.2 billion, excluding PPPLF) • Bolstered FBC liquidity with upstream dividend from bank and existing line draw Resilient Loan Portfolio Robust Capital Foundation Strong Core Deposit Franchise & Ample Liquidity Protecting a Strong Balance Sheet (1) Core Deposits include non - brokered transaction accounts, money market deposit accounts, and time deposits of $250,000 or less
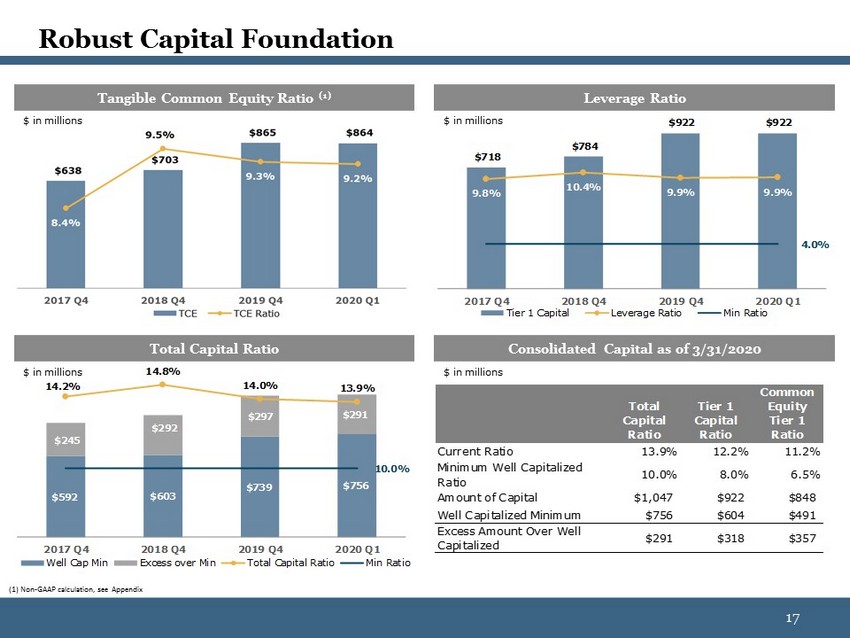
17 17 $592 $603 $739 $756 $245 $292 $297 $291 14.2% 14.8% 14.0% 13.9% 10.0% 2017 Q4 2018 Q4 2019 Q4 2020 Q1 Well Cap Min Excess over Min Total Capital Ratio Min Ratio $718 $784 $922 $922 9.8% 10.4% 9.9% 9.9% 4.0% 2017 Q4 2018 Q4 2019 Q4 2020 Q1 Tier 1 Capital Leverage Ratio Min Ratio Robust Capital Foundation Tangible Common Equity Ratio (1) Leverage Ratio Total Capital Ratio Consolidated Capital as of 3/31/2020 $ in millions $ in millions $ in millions Total Capital Ratio Tier 1 Capital Ratio Common Equity Tier 1 Ratio Current Ratio 13.9% 12.2% 11.2% Minimum Well Capitalized Ratio 10.0% 8.0% 6.5% Amount of Capital $1,047 $922 $848 Well Capitalized Minimum $756 $604 $491 Excess Amount Over Well Capitalized $291 $318 $357 $ in millions (1) Non - GAAP calculation, see Appendix

18 18 Non - Owner Occupied CRE 28% Owner Occupied CRE 14% Commercial & Industrial 26% Construction & Development 7% 1 - 4 Family Residential 18% HELOCs 6% Other 1% Illinois 66% Missouri 25% Indiana 5% Florida 4% High Quality Loan Portfolio Loan Portfolio Composition as of 3/31/2020 Loan Geographic Segmentation Total Loan Portfolio = $ 6 .7 billion MRQ Yield on Loans = 4.38% 56.4% $1,951 $2,062 58.6% $2,117 58.1% $2,044 56.9% 2-Mar 14-Mar 26-Mar 7-Apr 19-Apr Funded Draws & Line Utilization Rate ( 1) (1) Excludes Credit Card and Overdraft Protection $ in millions 30 - Apr

19 19 NAICS Sector 2020 Q1 Balance % of Total Loans Classified Loan Balances Manufacturing $259,400 3.8% $12,542 Finance and Insurance $201,713 3.0% $0 Wholesale Trade $169,615 2.5% $1,045 Construction $156,883 2.3% $3,406 Educational Services $154,232 2.3% $3,898 Health Care and Social Assistance $149,786 2.2% $4,014 Real Estate Rental & Leasing $141,968 2.1% $1,270 Agriculture, Forestry, Fishing and Hunting $114,575 1.7% $1,706 Retail Trade $86,877 1.3% $2,107 Public Administration $74,804 1.1% $0 Professional, Scientific, and Technical Services $52,535 0.8% $7,973 Transportation and Warehousing $47,409 0.7% $4,704 Food Services and Drinking Places $38,810 0.6% $60 Other Services (except Public Administration) $31,743 0.5% $240 Admin, Support & Waste Mgt Services $27,398 0.4% $5,153 Accommodation $19,827 0.3% $0 Arts, Entertainment, and Recreation $11,875 0.2% $2,000 Information $8,090 0.1% $0 Management of Companies and Enterprises $6,980 0.1% $0 Mining, Quarrying, and Oil and Gas Extraction $1,773 0.0% $0 Utilities $212 0.0% $0 Other C&I $11,494 0.2% $0 Total $1,768,000 26.2% $50,118 High Quality Loan Portfolio: C&I C&I Loans by Industry Total Loan Portfolio = $ 6 .7 billion MRQ Yield on Loans = 4.38% Total C&I Loans (1) $1,657 $1,668 $1,680 $1,748 $1,767 2019 Q1 2019 Q2 2019 Q3 2019 Q4 2020 Q1 C&I Portfolio Overview ▪ 26% of total loan portfolio ▪ Diversified portfolio results in low levels of concentrated e xposure ▪ Top concentration in one industry (manufacturing) is 15%, or 4% of total loans ▪ Only 2.8% of loans are classified ▪ No material exposure to oil & gas $ in thousands (1) Loan totals include purchase accounting, FASB, overdrafts, etc.
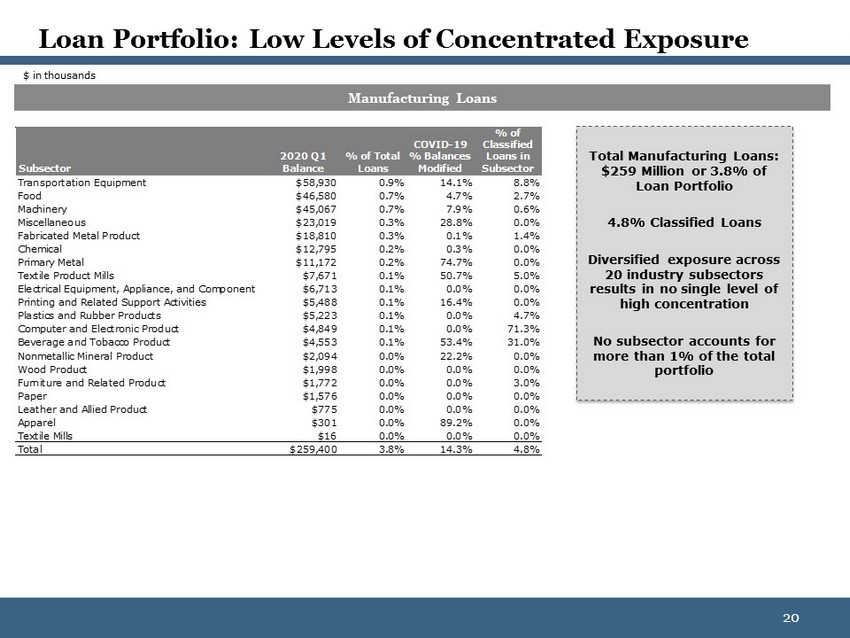
20 20 Loan Portfolio: Low Levels of Concentrated Exposure Manufacturing Loans Total Manufacturing Loans: $259 Million or 3 .8% of Loan Portfolio 4.8% Classified Loans Diversified exposure across 20 industry subsectors results in no single level of high concentration No subsector accounts for more than 1% of the total portfolio Subsector 2020 Q1 Balance % of Total Loans COVID-19 % Balances Modified % of Classified Loans in Subsector Transportation Equipment $58,930 0.9% 14.1% 8.8% Food $46,580 0.7% 4.7% 2.7% Machinery $45,067 0.7% 7.9% 0.6% Miscellaneous $23,019 0.3% 28.8% 0.0% Fabricated Metal Product $18,810 0.3% 0.1% 1.4% Chemical $12,795 0.2% 0.3% 0.0% Primary Metal $11,172 0.2% 74.7% 0.0% Textile Product Mills $7,671 0.1% 50.7% 5.0% Electrical Equipment, Appliance, and Component $6,713 0.1% 0.0% 0.0% Printing and Related Support Activities $5,488 0.1% 16.4% 0.0% Plastics and Rubber Products $5,223 0.1% 0.0% 4.7% Computer and Electronic Product $4,849 0.1% 0.0% 71.3% Beverage and Tobacco Product $4,553 0.1% 53.4% 31.0% Nonmetallic Mineral Product $2,094 0.0% 22.2% 0.0% Wood Product $1,998 0.0% 0.0% 0.0% Furniture and Related Product $1,772 0.0% 0.0% 3.0% Paper $1,576 0.0% 0.0% 0.0% Leather and Allied Product $775 0.0% 0.0% 0.0% Apparel $301 0.0% 89.2% 0.0% Textile Mills $16 0.0% 0.0% 0.0% Total $259,400 3.8% 14.3% 4.8% $ in thousands
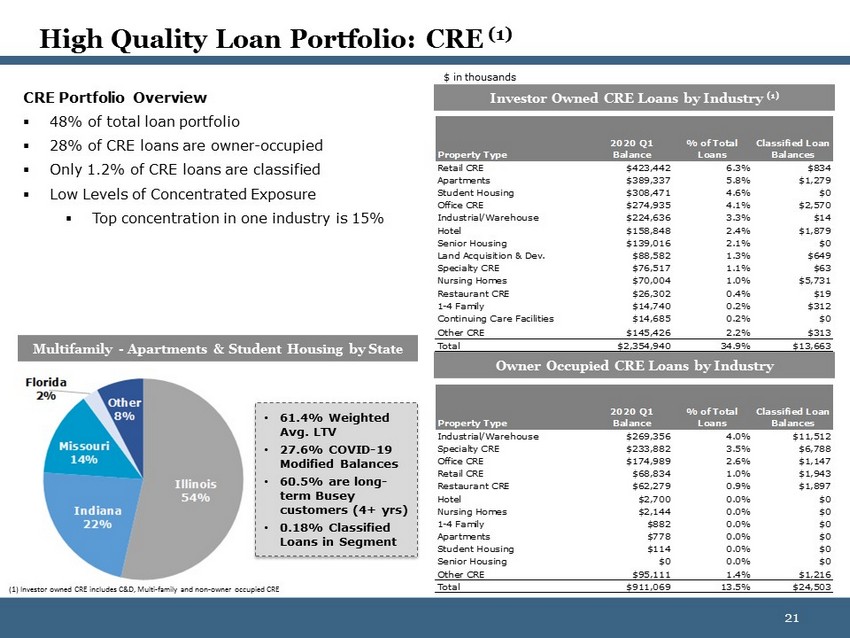
21 21 High Quality Loan Portfolio: CRE (1) CRE Portfolio Overview ▪ 48% of total loan portfolio ▪ 28% of CRE loans are owner - occupied ▪ Only 1.2% of CRE loans are classified ▪ Low Levels of Concentrated Exposure ▪ Top concentration in one industry is 15 % Investor Owned CRE Loans by Industry (1) Owner Occupied CRE Loans by Industry Property Type 2020 Q1 Balance % of Total Loans Classified Loan Balances Retail CRE $423,442 6.3% $834 Apartments $389,337 5.8% $1,279 Student Housing $308,471 4.6% $0 Office CRE $274,935 4.1% $2,570 Industrial/Warehouse $224,636 3.3% $14 Hotel $158,848 2.4% $1,879 Senior Housing $139,016 2.1% $0 Land Acquisition & Dev. $88,582 1.3% $649 Specialty CRE $76,517 1.1% $63 Nursing Homes $70,004 1.0% $5,731 Restaurant CRE $26,302 0.4% $19 1-4 Family $14,740 0.2% $312 Continuing Care Facilities $14,685 0.2% $0 Other CRE $145,426 2.2% $313 Total $2,354,940 34.9% $13,663 Multifamily - Apartments & Student Housing by State Property Type 2020 Q1 Balance % of Total Loans Classified Loan Balances Industrial/Warehouse $269,356 4.0% $11,512 Specialty CRE $233,882 3.5% $6,788 Office CRE $174,989 2.6% $1,147 Retail CRE $68,834 1.0% $1,943 Restaurant CRE $62,279 0.9% $1,897 Hotel $2,700 0.0% $0 Nursing Homes $2,144 0.0% $0 1-4 Family $882 0.0% $0 Apartments $778 0.0% $0 Student Housing $114 0.0% $0 Senior Housing $0 0.0% $0 Other CRE $95,111 1.4% $1,216 Total $911,069 13.5% $24,503 Illinois 54% Indiana 22% Missouri 14% Florida 2% Other 8% $ in thousands • 61.4% Weighted Avg. LTV • 27.6% COVID - 19 Modified Balances • 60.5% are long - term Busey customers (4+ yrs ) • 0.18% Classified Loans in Segment (1) Investor owned CRE includes C&D, Multi - family and non - owner occupied CRE

22 22 Strip Center 40% Retail Trade (C&I) 15% Single Tenant 15% Mixed Use - Retail 12% Shopping Center 10% Community Retail Center 8% Loan Portfolio: Low Levels of Concentrated Exposure Retail Trad e & Retail CRE Loans Traveler Accommodation Loans Total Retail Loans: $579 Million or 8.6% of Loan Portfolio Hotel - Large Chain 63% Hotel - Boutique 25% Hotel Ops. (C&I) 11% Other 1% Retail Type 2020 Q1 Balance % of Total Loans COVID-19 % Balances Modified Weighted Avg LTV % of Classified Loans in Segment Strip Center $234,928 3.5% 55.1% 68.2% 0.2% Retail Trade (C&I) $86,877 1.3% 27.0% 2.4% Single Tenant $85,603 1.3% 30.8% 57.6% 2.3% Mixed Use - Retail $68,378 1.0% 37.7% 65.9% 0.7% Shopping Center $57,697 0.9% 55.6% 47.3% 0.0% Community Retail Center $45,670 0.7% 45.0% 58.3% 0.0% Total $579,153 8.6% 44.5% 0.8% Total Traveler Accommodation Loans: $181 Million or 2 .7% of Loan Portfolio Subsector 2020 Q1 Balance % of Total Loans COVID-19 % Balances Modified Weighted Avg LTV % of Classified Loans in Segment Hotel - Full Service Large Chain $60,977 0.9% 61.0% 62.1% 3.1% Hotel - Limited Service Large Chain $53,390 0.8% 45.3% 61.3% 0.0% Hotel - Full Service Boutique $35,784 0.5% 0.0% 60.8% 0.0% Hotel Operations (C&I) $19,738 0.3% 0.0% 0.0% Hotel - Limited Service Boutique $10,340 0.2% 84.7% 54.9% 0.0% Motel $688 0.0% 65.4% 42.2% 0.0% Mixed Use - Hotel/Motel $368 0.0% 100.0% 44.6% 0.0% RV Parks and Campgrounds (C&I) $74 0.0% 0.0% 0.0% Bed-and-Breakfast Inns (C&I) $15 0.0% 0.0% 0.0% Total $181,375 2.7% 39.1% 1.0% $ in thousands
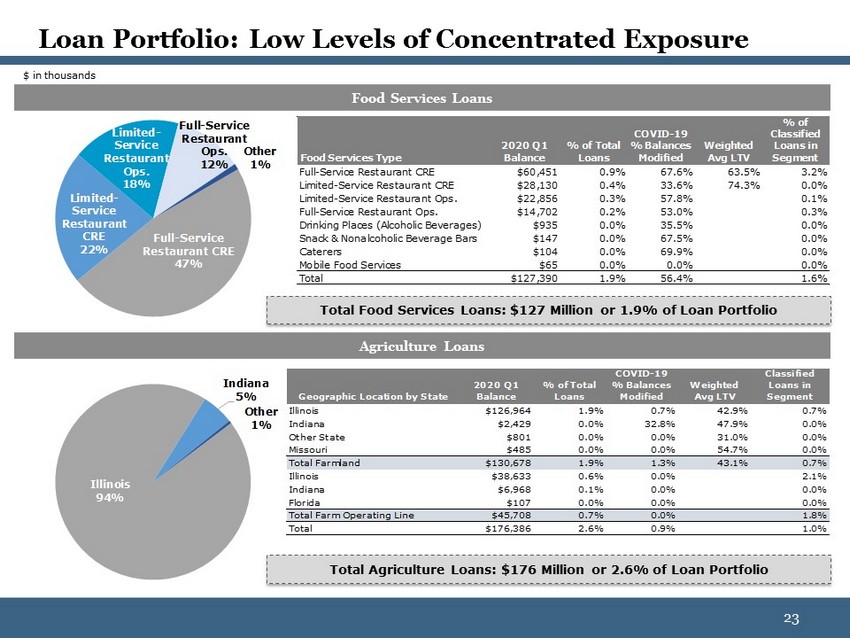
23 23 Full - Service Restaurant CRE 47% Limited - Service Restaurant CRE 22% Limited - Service Restaurant Ops. 18% Full - Service Restaurant Ops. 12% Other 1% Loan Portfolio: Low Levels of Concentrated Exposure Food Services Loans Food Services Type 2020 Q1 Balance % of Total Loans COVID-19 % Balances Modified Weighted Avg LTV % of Classified Loans in Segment Full-Service Restaurant CRE $60,451 0.9% 67.6% 63.5% 3.2% Limited-Service Restaurant CRE $28,130 0.4% 33.6% 74.3% 0.0% Limited-Service Restaurant Ops. $22,856 0.3% 57.8% 0.1% Full-Service Restaurant Ops. $14,702 0.2% 53.0% 0.3% Drinking Places (Alcoholic Beverages) $935 0.0% 35.5% 0.0% Snack & Nonalcoholic Beverage Bars $147 0.0% 67.5% 0.0% Caterers $104 0.0% 69.9% 0.0% Mobile Food Services $65 0.0% 0.0% 0.0% Total $127,390 1.9% 56.4% 1.6% Total Food Services Loans: $127 Million or 1 .9% of Loan Portfolio Agriculture Loans Illinois 94% Indiana 5% Other 1% Geographic Location by State 2020 Q1 Balance % of Total Loans COVID-19 % Balances Modified Weighted Avg LTV % of Classified Loans in Segment Illinois $126,964 1.9% 0.7% 42.9% 0.7% Indiana $2,429 0.0% 32.8% 47.9% 0.0% Other State $801 0.0% 0.0% 31.0% 0.0% Missouri $485 0.0% 0.0% 54.7% 0.0% Total Farmland $130,678 1.9% 1.3% 43.1% 0.7% Illinois $38,633 0.6% 0.0% 2.1% Indiana $6,968 0.1% 0.0% 0.0% Florida $107 0.0% 0.0% 0.0% Total Farm Operating Line $45,708 0.7% 0.0% 1.8% Total $176,386 2.6% 0.9% 1.0% $ in thousands Total Agriculture Loans: $176 Million or 2 .6% of Loan Portfolio
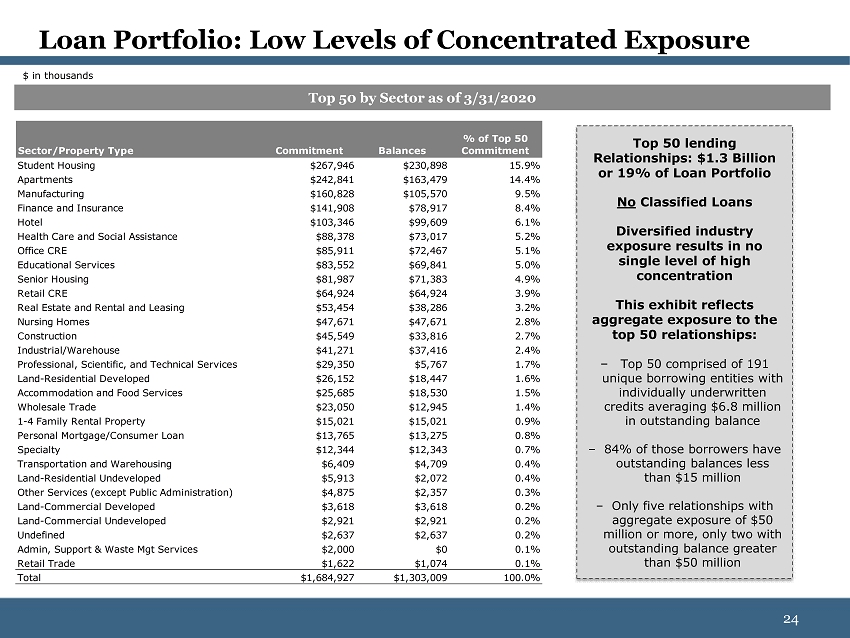
24 24 Loan Portfolio: Low Levels of Concentrated Exposure Top 50 by Sector as of 3/31/2020 Total Manufacturing Loans: $259 Million or 3 .8% of Loan Portfolio Sector/Property Type Commitment Balances % of Top 50 Commitment Student Housing $267,946 $230,898 15.9% Apartments $242,841 $163,479 14.4% Manufacturing $160,828 $105,570 9.5% Finance and Insurance $141,908 $78,917 8.4% Hotel $103,346 $99,609 6.1% Health Care and Social Assistance $88,378 $73,017 5.2% Office CRE $85,911 $72,467 5.1% Educational Services $83,552 $69,841 5.0% Senior Housing $81,987 $71,383 4.9% Retail CRE $64,924 $64,924 3.9% Real Estate and Rental and Leasing $53,454 $38,286 3.2% Nursing Homes $47,671 $47,671 2.8% Construction $45,549 $33,816 2.7% Industrial/Warehouse $41,271 $37,416 2.4% Professional, Scientific, and Technical Services $29,350 $5,767 1.7% Land-Residential Developed $26,152 $18,447 1.6% Accommodation and Food Services $25,685 $18,530 1.5% Wholesale Trade $23,050 $12,945 1.4% 1-4 Family Rental Property $15,021 $15,021 0.9% Personal Mortgage/Consumer Loan $13,765 $13,275 0.8% Specialty $12,344 $12,343 0.7% Transportation and Warehousing $6,409 $4,709 0.4% Land-Residential Undeveloped $5,913 $2,072 0.4% Other Services (except Public Administration) $4,875 $2,357 0.3% Land-Commercial Developed $3,618 $3,618 0.2% Land-Commercial Undeveloped $2,921 $2,921 0.2% Undefined $2,637 $2,637 0.2% Admin, Support & Waste Mgt Services $2,000 $0 0.1% Retail Trade $1,622 $1,074 0.1% Total $1,684,927 $1,303,009 100.0% Top 50 lending Relationships: $ 1.3 Billion or 19% of Loan Portfolio No Classified Loans Diversified industry exposure results in no single level of high concentration This exhibit reflects aggregate exposure to the top 50 relationships: – Top 50 comprised of 191 unique borrowing entities with individually underwritten credits averaging $6.8 million in outstanding balance – 84% of those borrowers have outstanding balances less than $15 million – Only five relationships with aggregate exposure of $50 million or more, only two with outstanding balance greater than $50 million $ in thousands
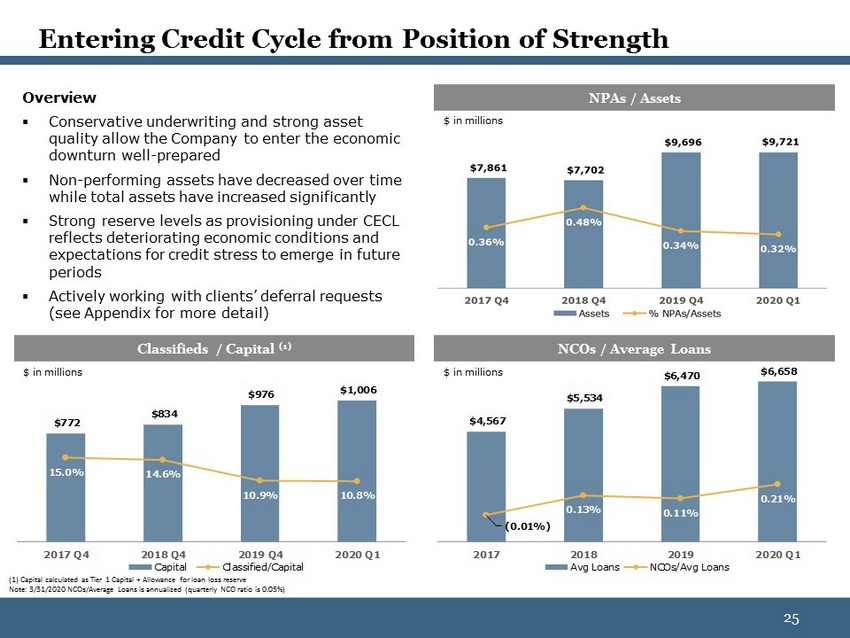
25 25 $4,567 $5,534 $6,470 $6,658 (0.01%) 0.13% 0.11% 0.21% 2017 2018 2019 2020 Q1 Avg Loans NCOs/Avg Loans $772 $834 $976 $1,006 15.0% 14.6% 10.9% 10.8% 2017 Q4 2018 Q4 2019 Q4 2020 Q1 Capital Classified/Capital Entering Credit Cycle from Position of Strength NPAs / Assets Classifieds / Capital (1) NCOs / Average Loans (1) Capital calculated as Tier 1 Capital + Allowance for loan loss reserve Note: 3/31/2020 NCOs/Average Loans is annualized (quarterly NCO ratio is 0.05%) $ in millions $ in millions $ in millions Overview ▪ C onservative underwriting and strong asset quality allow t he Company to enter the economic downturn well - prepared ▪ Non - performing a ssets have decreased over time while total assets have increased significantly ▪ Strong reserve levels as provisioning under CECL reflects deteriorating economic conditions and expectations for credit stress to emerge in future periods ▪ Actively working with clients’ deferral requests (see Appendix for more detail)

26 26 $28,648 $36,974 $32,564 $30,765 187% 137% 165% 274% 2017 Q4 2018 Q4 2019 Q4 2020 Q1 NPAs Allowance/ NPAs Adoption of CECL Fortifies Loan Loss Reserves Allowance / Loans Allowance / NPLs Allowance / NPAs Provision Coverage / Net Charge - offs $ in millions (1) 4Q17 provision expense was $5.303 million and net recoveries were $0.484 million $ in thousands $ in thousands

27 27 $5,600 $5,705 $7,587 $7,624 91.4% 91.3% 96.0% 95.6% 2017 Q4 2018 Q4 2019 Q4 2020 Q1 Core Deposits Core/ Total Deposits Non - interest bearing demand , 24% CD < 250k , 14% CD > 250k , 4% Interest bearing demand , 25% Savings & MMDA , 33% Strong Core Deposit Franchise $6,126 $6,249 $7,902 $7,973 90.1% 89.1% 84.6% 84.6% 2017 Q4 2018 Q4 2019 Q4 2020 Q1 Total Deposits Loan to Deposit Ratio Deposit Composition as of 03/31/2020 Total Deposits & Loan to Deposit Ratio Core Deposits (1) / Total Deposits $ in millions $ in millions $ in millions Cost of Deposits = 0.62% Overview ▪ Strong core deposit to total deposit ratio (96%) (1) ▪ Core deposits are 90% of total liabilities (1) ▪ Late in 1Q and early in 2Q reduced cost of non - time deposits from 0.39% to 0.14% ▪ On average, $80 to $100 million of time deposits maturing each month – Picking up 100 - 125bps in rate reductions on renewals (1) Core Deposits include non - brokered transaction accounts, money market deposit accounts and time deposits of $250,000 or less.
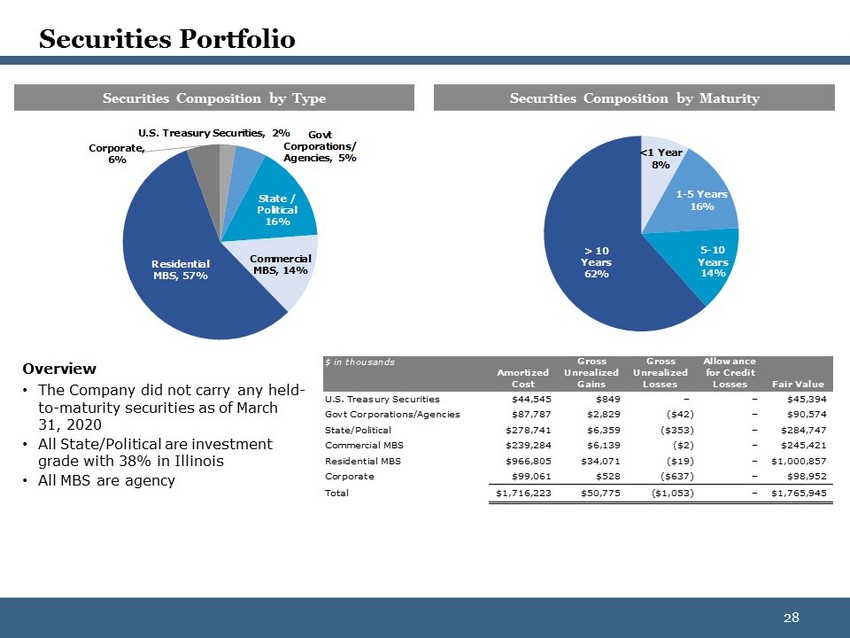
28 28 Securities Portfolio U.S. Treasury Securities , 2% Govt Corporations/ Agencies , 5% State / Political 16% Commercial MBS , 14% Residential MBS , 57% Corporate , 6% <1 Year 8% 1 - 5 Years 16% 5 - 10 Years 14% > 10 Years 62% Securities Composition by Type Securities Composition by Maturity $ in thousands Amortized Cost Gross Unrealized Gains Gross Unrealized Losses Allowance for Credit Losses Fair Value U.S. Treasury Securities $44,545 $849 – – $45,394 Govt Corporations/Agencies $87,787 $2,829 ($42) – $90,574 State/Political $278,741 $6,359 ($353) – $284,747 Commercial MBS $239,284 $6,139 ($2) – $245,421 Residential MBS $966,805 $34,071 ($19) – $1,000,857 Corporate $99,061 $528 ($637) – $98,952 Total $1,716,223 $50,775 ($1,053) – $1,765,945 Overview • The Company did not carry any held - to - maturity securities as of March 31, 2020 • All State/Political are investment grade with 38% in Illinois • All MBS are agency

29 29 Liquidity Detail Bank Liquidity • As of March 31, 2020, management believed that adequate liquidity existed to meet all projected cash flow obligations • First Busey’s primary sources of funds consist of deposits, investment maturities and sales, loan principal repayments and capital funds • The Company has the ability to pledge PPP loans as collateral to the FHLB, Federal Reserve Discount Window and the Paycheck Protection Program Liquidity Facility to increase the availability to borrow against any potential short - term funding needs Holding Company Liquidity • In the first quarter , the Company bolstered holding company liquidity with an upstream dividend from the bank and existing line draw • The Company has existing senior debt, subordinated debt and trust preferred securities at the holding company (1) Net of unamortized issuance costs (2) PPPLF availability as of May 18, 2020 Contingency Liquidity Holding Company Detail $ in millions $ in millions Amount Outstanding Available Cash & Due from Banks $79.1 Securities $4.9 Revolving Loan Facility $20.0 – Senior Debt (1) $39.7 – Subordinated Debt (1) $59.3 – Trust Preferred $71.3 – Total Balances Unpledged Securities $1,122 Available FHLB $1,591 FRB Discount $529 Fed Funds Lines $325 Brokered Availability $786 PPPLF Availability (2) $739 Total $5,092

30 30 Interest Rate Risk Management & Sensitivity • First Busey ’s asset - liability committee meets at least quarterly to review current market conditions and to structure the Consolidated Balance Sheets to optimize stability in net interest income in consideration of projected future changes in interest rates and primarily relies on balance sheet and income simulation analysis to determine the potential impact of changes in market interest rates on net interest income. • In these standard simulation models, the balance sheet is projected over a one - year and a two - year time horizon and net interest income is calculated under current market rates and assuming permanent instantaneous shifts of +/ - 100, +200 and +300 basis points. Due to the current low interest rate environment, a downward adjustment in federal fund rates was not meaningful at March 31, 2020. T he interest rate risk of First Busey as a result of immediate and sustained changes in interest rates, was as follows: • The model assumes immediate and sustained shifts in the federal funds rate and other market rate indices and corresponding shifts in other non - market rate indices based on their historical changes relative to changes in the federal funds rate and other market indices. Assets and liabilities are assumed to remain constant as of measurement date; variable - rate assets and liabilities are repriced based on repricing frequency; and prepayment speeds on loans are projected for both declining and rising rate environments. Rate Shock Year 1 Year 2 +300 bps 18.85% 25.18% +200 bps 12.89% 17.30% +100 bps 6.63% 9.02% -100 bps NM NM Annual % Change in Net Interest Income

31 31 Summary Maintain Strong Core Deposits 96% Core Deposits/Deposits (1) 0.62% Cost of Deposits Foster Conservative and Stable Risk Culture 0.32% Non - Performing Assets/Assets 310% Reserves/NPLs Consistently Hold a Strong Capital Position Capital far in excess of “Well Capitalized” standard under Basel III 9.2% TCE/TA and 13.9% TRBC Ratio Cultivate Diversified Revenue Streams 29% LTM Noninterest Income/Operating Revenue ~$9 Billion Assets Under Care Wealth Management Business Proven Leadership Experienced and cycle - tested management team Over 210 years of combined experience amongst top seven executives Attractive Growth Proposition Track record of disciplined M&A strategy, acquiring institutions with accretive credit cultures and deposit bases (6 transactions closed since January 2015) Positioned to take advantage of growth opportunities in new and existing markets, and leverage diversified product offerings (1) Core Deposits include non - brokered transaction accounts, money market deposit accounts and time deposits of $250,000 or less.

32 32 COVID - 19 PANDEMIC RESPONSE 32
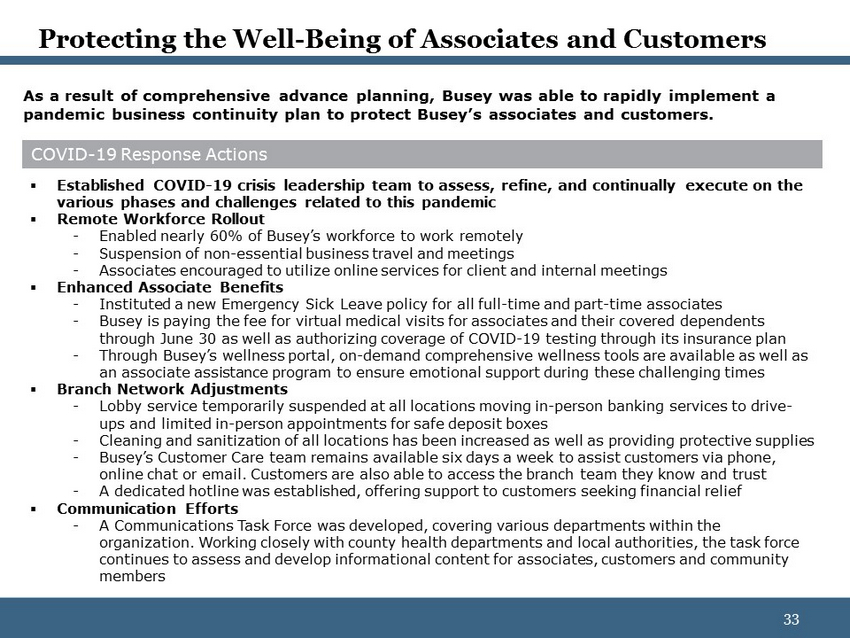
33 33 Protecting the Well - Being of Associates and Customers ▪ Established COVID - 19 crisis leadership team to assess, refine, and continually execute on the various phases and challenges related to this pandemic ▪ Remote Workforce Rollout - Enabled nearly 60% of Busey’s workforce to work remotely - Suspension of non - essential business travel and meetings - Associates encouraged to utilize online services for client and internal meetings ▪ Enhanced Associate Benefits - Instituted a new Emergency Sick Leave policy for all full - time and part - time associates - Busey is paying the fee for virtual medical visits for associates and their covered dependents through June 30 as well as authorizing coverage of COVID - 19 testing through its insurance plan - Through Busey’s wellness portal, on - demand comprehensive wellness tools are available as well as an associate assistance program to ensure emotional support during these challenging times ▪ Branch Network Adjustments - Lobby service temporarily suspended at all locations moving in - person banking services to drive - ups and limited in - person appointments for safe deposit boxes - Cleaning and sanitization of all locations has been increased as well as providing protective supplies - Busey’s Customer Care team remains available six days a week to assist customers via phone, online chat or email. Customers are also able to access the branch team they know and trust - A dedicated hotline was established, offering support to customers seeking financial relief ▪ Communication Efforts - A Communications Task Force was developed, covering various departments within the organization. Working closely with county health departments and local authorities, the task force continues to assess and develop informational content for associates, customers and community members As a result of comprehensive advance planning, Busey was able to rapidly implement a pandemic business continuity plan to protect Busey’s associates and customers . COVID - 19 Response Actions

34 34 Supporting Financial Needs of Customers COVID - 19 Response Actions ▪ Busey is offering several options to Busey’s qualifying business customers to help them through this period of economic disruption. Various six - month modification programs with opt - ins from the customer in 90 - day intervals are available, including a 90 - day deferral of principal & interest or interest only payment options - Through May 18th, deferred payments on 1,041 business loans representing principal balances of $1.030 billion, equivalent to approximately 17.5% of the Commercial loan portfolio ▪ For those experiencing or anticipating hardships due to COVID - 19, Busey is offering multiple payment deferral options for qualifying customers with loans - personal, auto, home equity, mortgages and more. There will be no credit bureau impact with granted deferrals - 1,973 customer request applications received - 832 mortgage and retail loan deferrals already processed representing $118mm, or approximately 8.0% of retail portfolio, of principal balances for loans on the balance sheet - 604 mortgage loan deferrals of over $77mm, or approximately 3.4%, of principal balances of loans in the servicing portfolio ▪ Busey developed a Financial Relief Program designed to alleviate some of the hardships qualifying customers may face as a result of the pandemic itself or the resulting economic impact. For the next six months, Busey is automatically offering: - Waiver of pre - authorized transfer fees to prevent overdrafts - Waiver of charge for each pre - authorized transfer over six per monthly statement cycle on consumer/personal savings and money market accounts - Free debit card replacement and express delivery of cards to customers Personal Loan and Mortgage Customers Commercial and Small Business Clients Select Customer Fee Waivers * Additional fee waiver requests reviewed on a case - by - case basis

35 35 ▪ As part of the CARES Act, Congress appropriated approximately $349 billion for the creation of the Paycheck Protection Program (PPP) as well as approving on April 24, 2020 an additional $310 billion for the PPP. This program provides payroll assistance for the nation’s nearly 30 million small businesses — and select nonprofits — in the form of 100% guaranteed loans from the U.S . Small Business Administration (SBA ) ▪ Busey was a bridge for this program and actively helped their customers sign up for this important financial resource. ▪ $739 million in approved loans ▪ 4,172 total loans processed ▪ Over 85,000 j obs impacted ▪ Anticipated fees of $24.8 million Participating in the CARES Act Paycheck Protection Program Summary Impact Note: As of 05/18/2020 $ in thousands Small Business Applications & Loan Funding Industry # of PPP Loans Booked PPP Balances PPP Avg. Loan Size % of Total Construction 431 $136,041 $316 18.4% Health Care and Social Assistance 465 $98,455 $212 13.3% Manufacturing 246 $74,015 $301 10.0% Professional, Scientific, and Technical Services 438 $71,349 $163 9.7% Wholesale Trade 166 $52,500 $316 7.1% Retail Trade 307 $46,828 $153 6.3% Other Services (except Public Administration) 456 $43,897 $96 5.9% Food Services and Drinking Places 300 $36,653 $122 5.0% Real Estate and Rental and Leasing 286 $35,725 $125 4.8% Transportation and Warehousing 95 $27,180 $286 3.7% Admin, Support & Waste Mgt Services 149 $26,180 $176 3.5% Undefined 304 $25,301 $83 3.4% Finance and Insurance 197 $23,186 $118 3.1% Educational Services 60 $11,863 $198 1.6% Arts, Entertainment, and Recreation 122 $8,614 $71 1.2% Information 28 $6,801 $243 0.9% Accommodation 29 $5,573 $192 0.8% Public Administration 9 $3,688 $410 0.5% Mining, Quarrying, and Oil and Gas Extraction 6 $2,326 $388 0.3% Agriculture, Forestry, Fishing and Hunting 69 $1,736 $25 0.2% Management of Companies and Enterprises 6 $725 $121 0.1% Utilities 3 $104 $35 0.0% Total 4,172 $738,738 $ 177.07 100.0%
36 36 APPENDIX 36
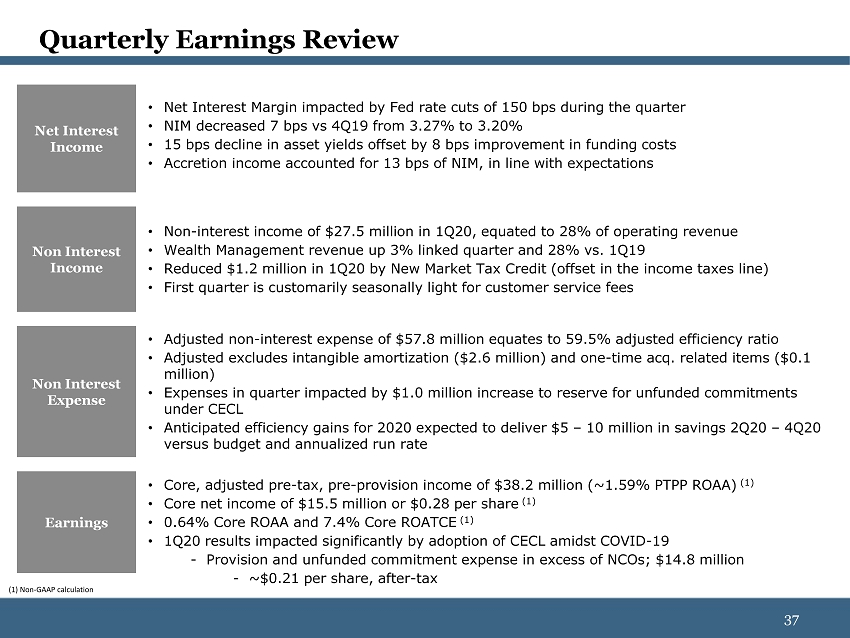
37 37 • Net Interest Margin impacted by Fed rate cuts of 150 bps during the quarter • NIM decreased 7 bps vs 4Q19 from 3.27% to 3.20% • 15 bps decline in asset yields offset by 8 bps improvement in funding costs • Accretion income accounted for 13 bps of NIM, in line with expectations Non Interest Expense • Non - interest income of $27.5 million in 1Q20, equated to 28% of operating revenue • Wealth Management revenue up 3% linked quarter and 28% vs. 1Q19 • Reduced $1.2 million in 1Q20 by New Market Tax Credit (offset in the income taxes line) • First quarter is customarily seasonally light for customer service fees • Adjusted non - interest expense of $57.8 million equates to 59.5% adjusted efficiency ratio • Adjusted excludes intangible amortization ($ 2.6 million) and one - time acq. related items ($ 0.1 million) • Expenses in quarter impacted by $1.0 million increase to reserve for unfunded commitments under CECL • Anticipated efficiency gains for 2020 expected to deliver $5 – 10 million in savings 2Q20 – 4Q20 versus budget and annualized run rate • Core, adjusted pre - tax, pre - provision income of $38.2 million (~1.59% PTPP ROAA) (1) • Core net income of $ 15.5 million or $0.28 per share (1) • 0.64% Core ROAA and 7.4% Core ROATCE (1) • 1Q20 results impacted significantly by adoption of CECL amidst COVID - 19 - Provision and unfunded commitment expense in excess of NCOs; $14.8 million - ~$ 0.21 per share, after - tax Earnings Non Interest Income Net Interest Income Quarterly Earnings Review (1) Non - GAAP calculation

38 38 Current Expected Credit Loss (CECL) Implementation ▪ On January 1, 2020, the Company adopted ASU 2016 - 13 (Topic 326), “Measurement of Credit Losses on Financial Instruments,” commonly referenced as the CECL model. Upon adoption of CECL, Busey recognized: - $16.8 million increase in the allowance for credit losses, substantially attributable to the remaining loan fair value marks on prior acquisitions - $5.5 million increase in the reserve for unfunded commitments (carried in other liabilities) - Total Day 1 increase of 41.54% over 12/31/19 reserve balance - These one - time increases, net of tax, were $15.9 million and recorded as an adjustment to beginning retained earnings ▪ During the first quarter of 2020, the Company recorded provision for credit losses of $17.2 million and provision for unfunded commitments of $1.0 million primarily as a result of economic factors around COVID - 19 - While the Company’s portfolio has not yet demonstrated material indications of weakness, provisioning under CECL reflects deteriorating economic conditions and expectations for credit stress to emerge in future periods - Total Day 2 increase of 69.11% over 12/31/19 reserve balance and 19.48% over CECL Day 1 balance - Ongoing impacts of the CECL methodology will be dependent upon changes in economic conditions and forecasts, originated and acquired loan portfolio composition, credit performance trends, portfolio duration, and other factors ▪ Increase in allowance for credit losses moves allowance for credit losses as a percentage of portfolio loans to 1.25% at March 31, 2020 and allowance for credit losses as a percentage of non - performing loans to 310%
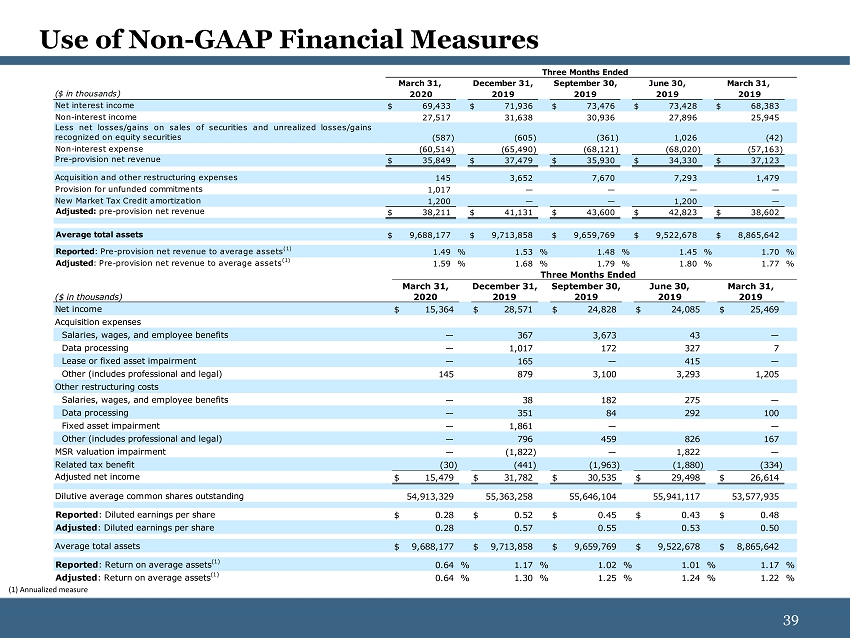
39 39 Use of Non - GAAP Financial Measures (1) Annualized measure Three Months Ended March 31, December 31, September 30, June 30, March 31, ($ in thousands) 2020 2019 2019 2019 2019 Net interest income $ 69,433 $ 71,936 $ 73,476 $ 73,428 $ 68,383 Non-interest income 27,517 31,638 30,936 27,896 25,945 Less net losses/gains on sales of securities and unrealized losses/gains recognized on equity securities (587) (605) (361) 1,026 (42) Non-interest expense (60,514) (65,490) (68,121) (68,020) (57,163) Pre-provision net revenue $ 35,849 $ 37,479 $ 35,930 $ 34,330 $ 37,123 Acquisition and other restructuring expenses 145 3,652 7,670 7,293 1,479 Provision for unfunded commitments 1,017 — — — — New Market Tax Credit amortization 1,200 — — 1,200 — Adjusted: pre-provision net revenue $ 38,211 $ 41,131 $ 43,600 $ 42,823 $ 38,602 Average total assets $ 9,688,177 $ 9,713,858 $ 9,659,769 $ 9,522,678 $ 8,865,642 Reported: Pre-provision net revenue to average assets (1) 1.49 % 1.53 % 1.48 % 1.45 % 1.70 % Adjusted: Pre-provision net revenue to average assets (1) 1.59 % 1.68 % 1.79 % 1.80 % 1.77 % Three Months Ended March 31, December 31, September 30, June 30, March 31, ($ in thousands) 2020 2019 2019 2019 2019 Net income $ 15,364 $ 28,571 $ 24,828 $ 24,085 $ 25,469 Acquisition expenses Salaries, wages, and employee benefits — 367 3,673 43 — Data processing — 1,017 172 327 7 Lease or fixed asset impairment — 165 — 415 — Other (includes professional and legal) 145 879 3,100 3,293 1,205 Other restructuring costs Salaries, wages, and employee benefits — 38 182 275 — Data processing — 351 84 292 100 Fixed asset impairment — 1,861 — — Other (includes professional and legal) — 796 459 826 167 MSR valuation impairment — (1,822) — 1,822 — Related tax benefit (30) (441) (1,963) (1,880) (334) Adjusted net income $ 15,479 $ 31,782 $ 30,535 $ 29,498 $ 26,614 Dilutive average common shares outstanding 54,913,329 55,363,258 55,646,104 55,941,117 53,577,935 Reported: Diluted earnings per share $ 0.28 $ 0.52 $ 0.45 $ 0.43 $ 0.48 Adjusted: Diluted earnings per share 0.28 0.57 0.55 0.53 0.50 Average total assets $ 9,688,177 $ 9,713,858 $ 9,659,769 $ 9,522,678 $ 8,865,642 Reported: Return on average assets (1) 0.64 % 1.17 % 1.02 % 1.01 % 1.17 % Adjusted: Return on average assets (1) 0.64 % 1.30 % 1.25 % 1.24 % 1.22 %

40 40 Use of Non - GAAP Financial Measures Three Months Ended March 31, December 31, September 30, June 30, March 31, ($ in thousands) 2020 2019 2019 2019 2019 Reported: Net Interest income $ 69,433 $ 71,936 $ 73,476 $ 73,428 $ 68,383 Tax-equivalent adjustment 730 781 778 777 677 Tax-equivalent interest income $ 70,163 $ 72,717 $ 74,254 $ 74,205 $ 69,060 Reported: Non-interest income 27,517 31,638 30,936 27,896 25,945 Less net losses/gains on sales of securities and unrealized losses/gains recognized on equity securities (587) (605) (361) 1,026 (42) Adjusted: Non-interest income $ 26,930 $ 31,033 $ 30,575 $ 28,922 $ 25,903 Reported: Non-interest expense 60,514 65,490 68,121 68,020 57,163 Amortization of intangible assets (2,557) (2,681) (2,360) (2,412) (2,094) Non-operating adjustments: Salaries, wages, and employee benefits — (405) (3,855) (318) — Data processing — (1,368) (256) (619) (107) Other (145) (1,879) (3,559) (6,356) (1,372) Adjusted: Non-interest expense $ 57,812 $ 59,157 $ 58,091 $ 58,315 $ 53,590 Reported: Efficiency ratio 59.69 % 60.54 % 62.73 % 63.62 % 57.99 % Adjusted: Efficiency ratio 59.54 % 57.02 % 55.42 % 56.55 % 56.43 % As of and for the Three Months Ended March 31, December 31, September 30, June 30, March 31, ($ in thousands) 2020 2019 2019 2019 2019 Total Assets $ 9,721,405 $ 9,695,729 $ 9,753,760 $ 9,612,667 $ 9,537,334 Goodwill and other intangible assets, net (370,572) (373,129) (381,323) (375,327) (377,739) Tax effect of other intangible assets, net 16,530 17,247 16,415 17,075 17,751 Tangible assets $ 9,367,363 $ 9,339,847 $ 9,388,852 $ 9,254,415 $ 9,177,346 Total stockholders’ equity 1,217,585 1,220,434 1,215,981 1,203,608 1,186,141 Goodwill and other intangible assets, net (370,572) (373,129) (381,323) (375,327) (377,739) Tax effect of other intangible assets, net 16,530 17,247 16,415 17,075 17,751 Tangible common equity $ 863,543 $ 864,552 $ 851,073 $ 845,356 $ 826,153 Ending number of common shares outstanding 54,401,208 54,788,772 55,197,277 55,386,636 55,624,627 Tangible common equity to tangible assets (1) 9.22 % 9.26 % 9.06 % 9.13 % 9.00 % Tangible book value per share $ 15.57 $ 15.46 $ 15.12 $ 14.95 $ 14.53 Average stockholders’ common equity $ 1,218,160 $ 1,224,447 $ 1,212,833 $ 1,195,802 $ 1,109,872 Average goodwill and other intangible assets, net (372,240) (379,268) (377,601) (376,851) (352,587) Average tangible stockholders’ common equity $ 845,920 $ 845,179 $ 835,232 $ 818,951 $ 757,285 Reported: Return on average tangible common equity (2) 7.30 % 13.41 % 11.79 % 11.80 % 13.64 % Adjusted: Return on average tangible common equity (2)(3) 7.36 % 14.92 % 14.50 % 14.45 % 14.25 % (1) Tax - effected measure (2) Annualized measure (3) Calculated using adjusted net income