Attached files
| file | filename |
|---|---|
| 8-K - 8-K - DigitalBridge Group, Inc. | clny8-k052020.htm |

Exhibit 99.1 HOSPITALITY PORTFOLIO OVERVIEW May 22, 2020 1
DISCLAIMER Cautionary Statement Regarding Forward-Looking Statements This presentation may contain forward-looking statements within the meaning of the federal securities laws. Forward-looking statements relate to expectations, beliefs, projections, future plans and strategies, anticipated events or trends and similar expressions concerning matters that are not historical facts. In some cases, you can identify forward-looking statements by the use of forward-looking terminology such as “may,” “will,” “should,” “expects,” “intends,” “plans,” “anticipates,” “believes,” “estimates,” “predicts,” or “potential” or the negative of these words and phrases or similar words or phrases which are predictions of or indicate future events or trends and which do not relate solely to historical matters. You can also identify forward-looking statements by discussions of strategy, plans or intentions. Forward-looking statements involve known and unknown risks, uncertainties, assumptions and contingencies, many of which are beyond the control of Colony Capital, Inc. (the “Company” or “Colony Capital”) and may cause the Company’s actual results to differ significantly from those expressed in any forward-looking statement. Factors that might cause such a difference include, without limitation, the impact of COVID-19 on the Company’s business and operations, including the performance of its hospitality portfolios, the impact of market trends and conditions on key financial metrics in the Company’s hospitality portfolios, including but not limited to occupancy, average daily rate (ADR), and revenue per available room (RevPAR), capital expenditures, the ability to meet debt service on the non-recourse mortgage debt collateralized by the hospitality portfolios or whether the Company will be successful in obtaining accommodations or modifications to such mortgage debt, whether Colony Capital will be able to maintain its qualification as a REIT for U.S. federal income tax purposes, adverse general and local economic conditions, an unfavorable capital market environment, and other risks and uncertainties, including those detailed in the Company’s Annual Report on Form 10-K for the fiscal year ended December 31, 2019 and Quarterly Report on Form 10-Q for the quarter ended March 31, 2020, under the heading “Risk Factors,” as such factors may be updated from time to time in our subsequent periodic filings with the U.S. Securities and Exchange Commission (“SEC”). All forward-looking statements reflect Colony Capital’s good faith beliefs, assumptions and expectations, but they are not guarantees of future performance. Additional information about these and other factors can be found in Colony Capital’s reports filed from time to time with the SEC. Colony Capital cautions investors not to unduly rely on any forward-looking statements. The forward-looking statements speak only as of the date of this presentation. Colony Capital is under no duty to update any of these forward-looking statements after the date of this presentation, nor to conform prior statements to actual results or revised expectations, and Colony Capital does not intend to do so. This presentation may contain statistics and other data that has been obtained or compiled from information made available by third-party service providers. Colony Capital has not independently verified such statistics or data. This presentation is for informational purposes only and does not constitute an offer to sell or a solicitation of an offer to buy any securities of Colony Capital. This information is not intended to be indicative of future results. Actual performance of Colony Capital may vary materially. Included in this presentation are certain “non-GAAP financial measures,” within the meaning of SEC rules and regulations, that are different from measures calculated and presented in accordance with generally accepted accounting principles (GAAP). The Company considers the following non-GAAP financial measures useful to investors as key supplemental measures of the operating performance of its hospitality portfolios: (1) Net Operating Income Before Reserve for Furniture, Fixtures and Equipment Expenditures (“NOI Before FF&E Reserve”) and (2) Net Operating Income After Reserve for Furniture, Fixtures and Equipment Expenditures (“NOI After FF&E Reserve”). These non-GAAP financial measures could be considered along with, but not as alternatives to, net income or loss, or any other measures of the operating performance of the Company’s hospitality portfolios prescribed by GAAP. 2 2

Residence Inn – Chicago, IL 1. INLAND PORTFOLIO OVERVIEW 3
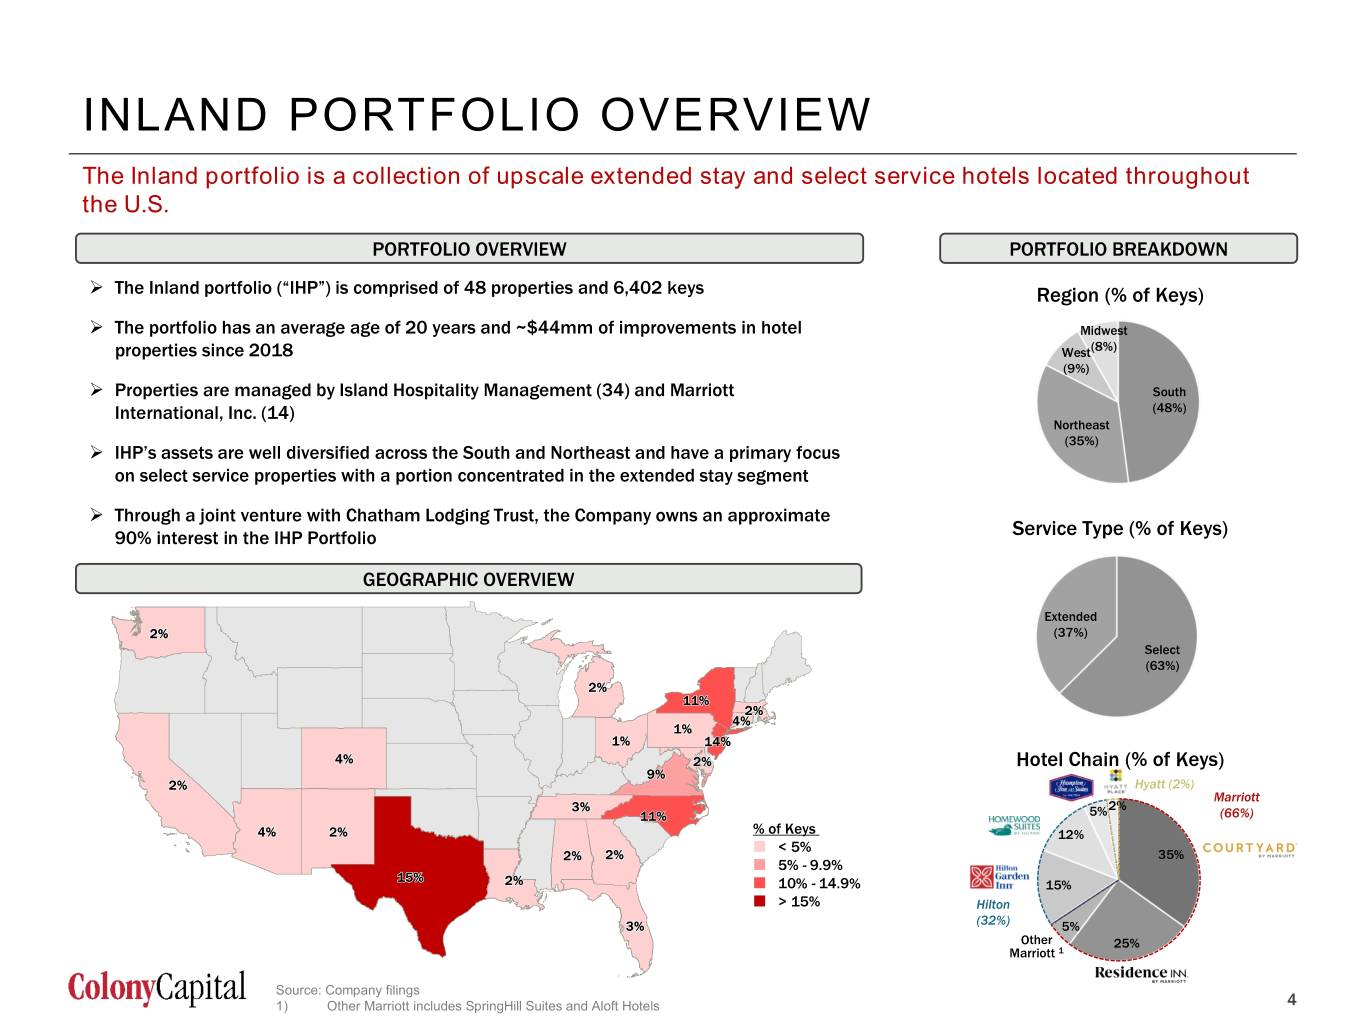
INLAND PORTFOLIO OVERVIEW The Inland portfolio is a collection of upscale extended stay and select service hotels located throughout the U.S. PORTFOLIO OVERVIEW PORTFOLIO BREAKDOWN The Inland portfolio (“IHP”) is comprised of 48 properties and 6,402 keys Region (% of Keys) The portfolio has an average age of 20 years and ~$44mm of improvements in hotel Midwest properties since 2018 West (8%) (9%) Properties are managed by Island Hospitality Management (34) and Marriott South International, Inc. (14) (48%) Northeast (35%) IHP’s assets are well diversified across the South and Northeast and have a primary focus on select service properties with a portion concentrated in the extended stay segment Through a joint venture with Chatham Lodging Trust, the Company owns an approximate 90% interest in the IHP Portfolio Service Type (% of Keys) GEOGRAPHIC OVERVIEW Extended (37%) Select (63%) Hotel Chain (% of Keys) Hyatt (2%) Marriott 2% 5% (66%) % of Keys 12% < 5% 35% 5% - 9.9% 10% - 14.9% 15% > 15% Hilton (32%) 5% Other 25% Marriott 1 Source: Company filings 4 1) Other Marriott includes SpringHill Suites and Aloft Hotels 4 Other 2
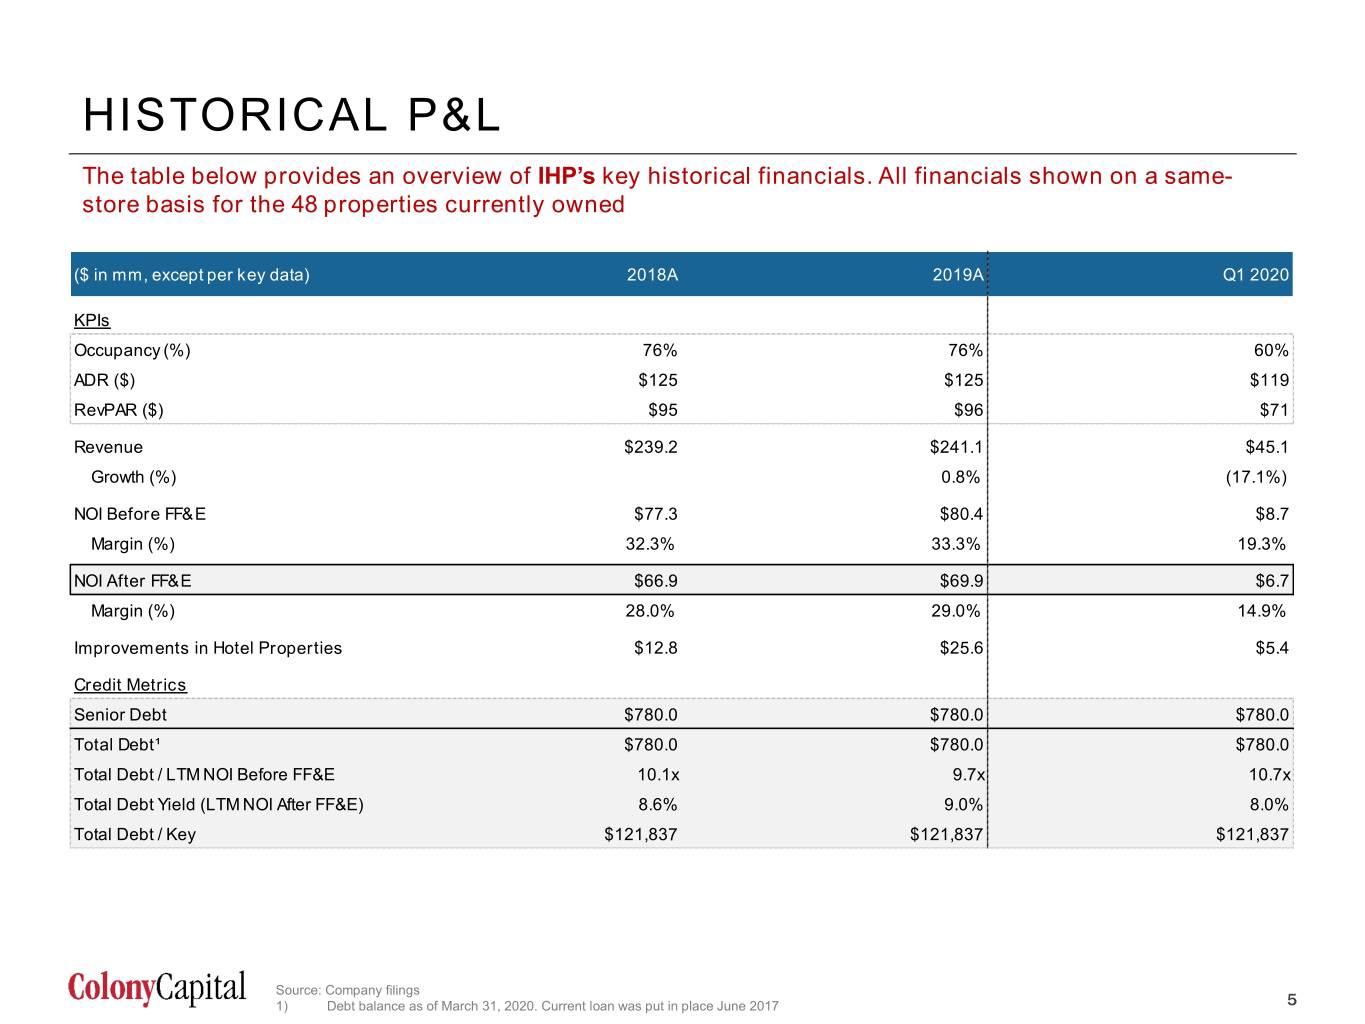
HISTORICAL P&L The table below provides an overview of IHP’s key historical financials. All financials shown on a same- store basis for the 48 properties currently owned ($ in mm, except per key data) 2018A 2019A Q1 2020 KPIs Occupancy (%) 76% 76% 60% ADR ($) $125 $125 $119 RevPAR ($) $95 $96 $71 Revenue $239.2 $241.1 $45.1 Growth (%) 0.8% (17.1%) NOI Before FF&E $77.3 $80.4 $8.7 Margin (%) 32.3% 33.3% 19.3% NOI After FF&E $66.9 $69.9 $6.7 Margin (%) 28.0% 29.0% 14.9% Improvements in Hotel Properties $12.8 $25.6 $5.4 Credit Metrics Senior Debt $780.0 $780.0 $780.0 Total Debt¹ $780.0 $780.0 $780.0 Total Debt / LTM NOI Before FF&E 10.1x 9.7x 10.7x Total Debt Yield (LTM NOI After FF&E) 8.6% 9.0% 8.0% Total Debt / Key $121,837 $121,837 $121,837 Source: Company filings 5 1) Debt balance as of March 31, 2020. Current loan was put in place June 2017 5
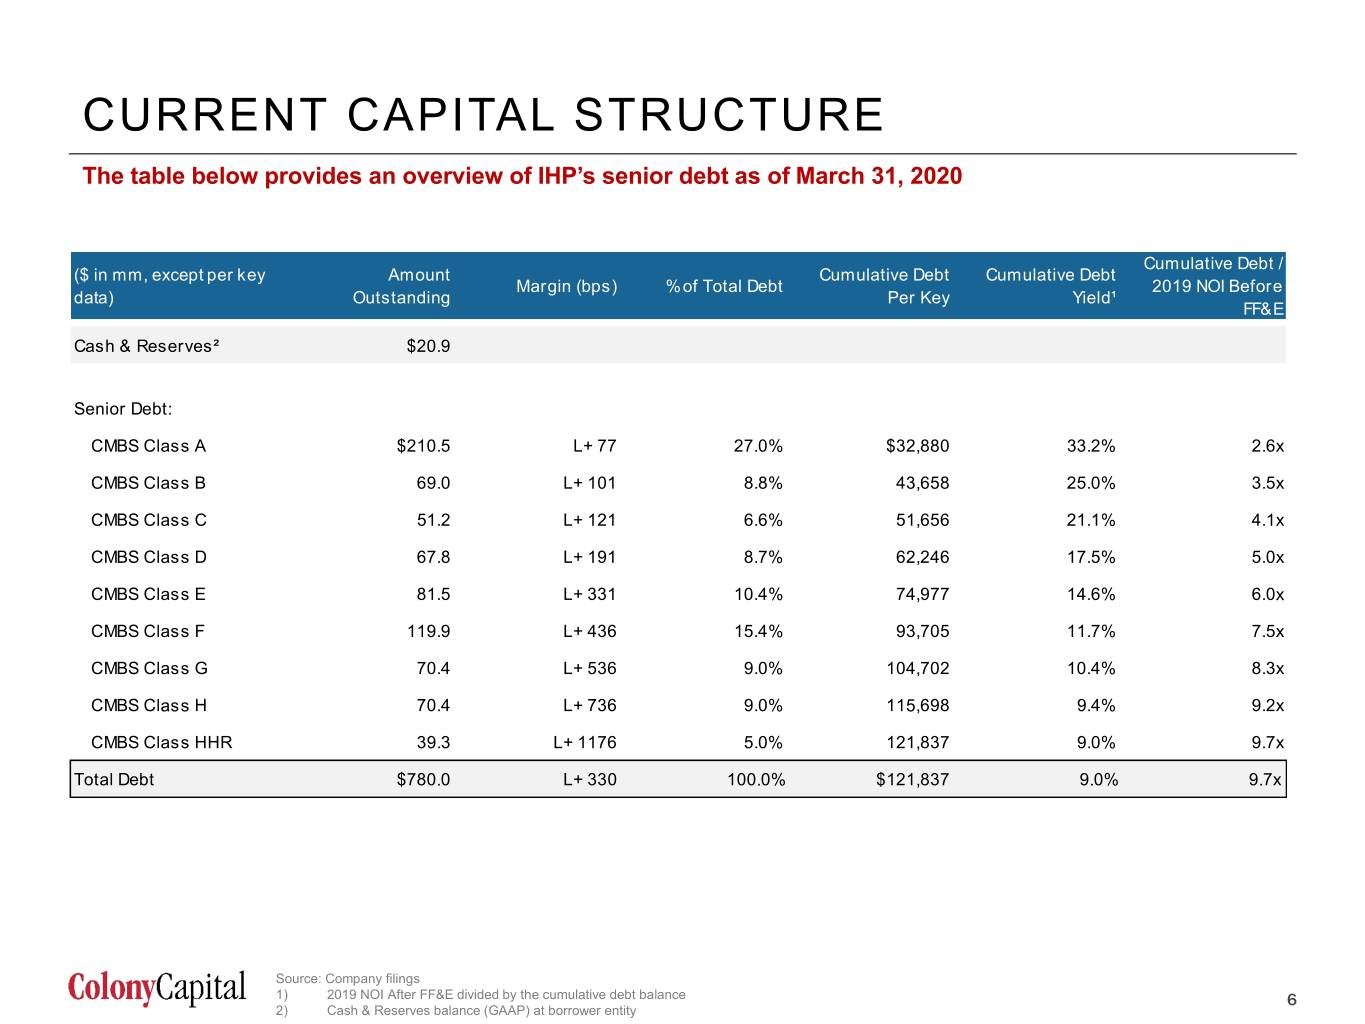
CURRENT CAPITAL STRUCTURE The table below provides an overview of IHP’s senior debt as of March 31, 2020 Cumulative Debt / ($ in mm, except per key Amount Cumulative Debt Cumulative Debt Margin (bps) % of Total Debt 2019 NOI Before data) Outstanding Per Key Yield¹ FF&E Cash & Reserves² $20.9 Senior Debt: CMBS Class A $210.5 L+ 77 27.0% $32,880 33.2% 2.6x CMBS Class B 69.0 L+ 101 8.8% 43,658 25.0% 3.5x CMBS Class C 51.2 L+ 121 6.6% 51,656 21.1% 4.1x CMBS Class D 67.8 L+ 191 8.7% 62,246 17.5% 5.0x CMBS Class E 81.5 L+ 331 10.4% 74,977 14.6% 6.0x CMBS Class F 119.9 L+ 436 15.4% 93,705 11.7% 7.5x CMBS Class G 70.4 L+ 536 9.0% 104,702 10.4% 8.3x CMBS Class H 70.4 L+ 736 9.0% 115,698 9.4% 9.2x CMBS Class HHR 39.3 L+ 1176 5.0% 121,837 9.0% 9.7x Total Debt $780.0 L+ 330 100.0% $121,837 9.0% 9.7x Source: Company filings 1) 2019 NOI After FF&E divided by the cumulative debt balance 6 2) Cash & Reserves balance (GAAP) at borrower entity 6

Courtyard – Atlantic City, NJ 2. INNKEEPERS PORTFOLIO OVERVIEW 7
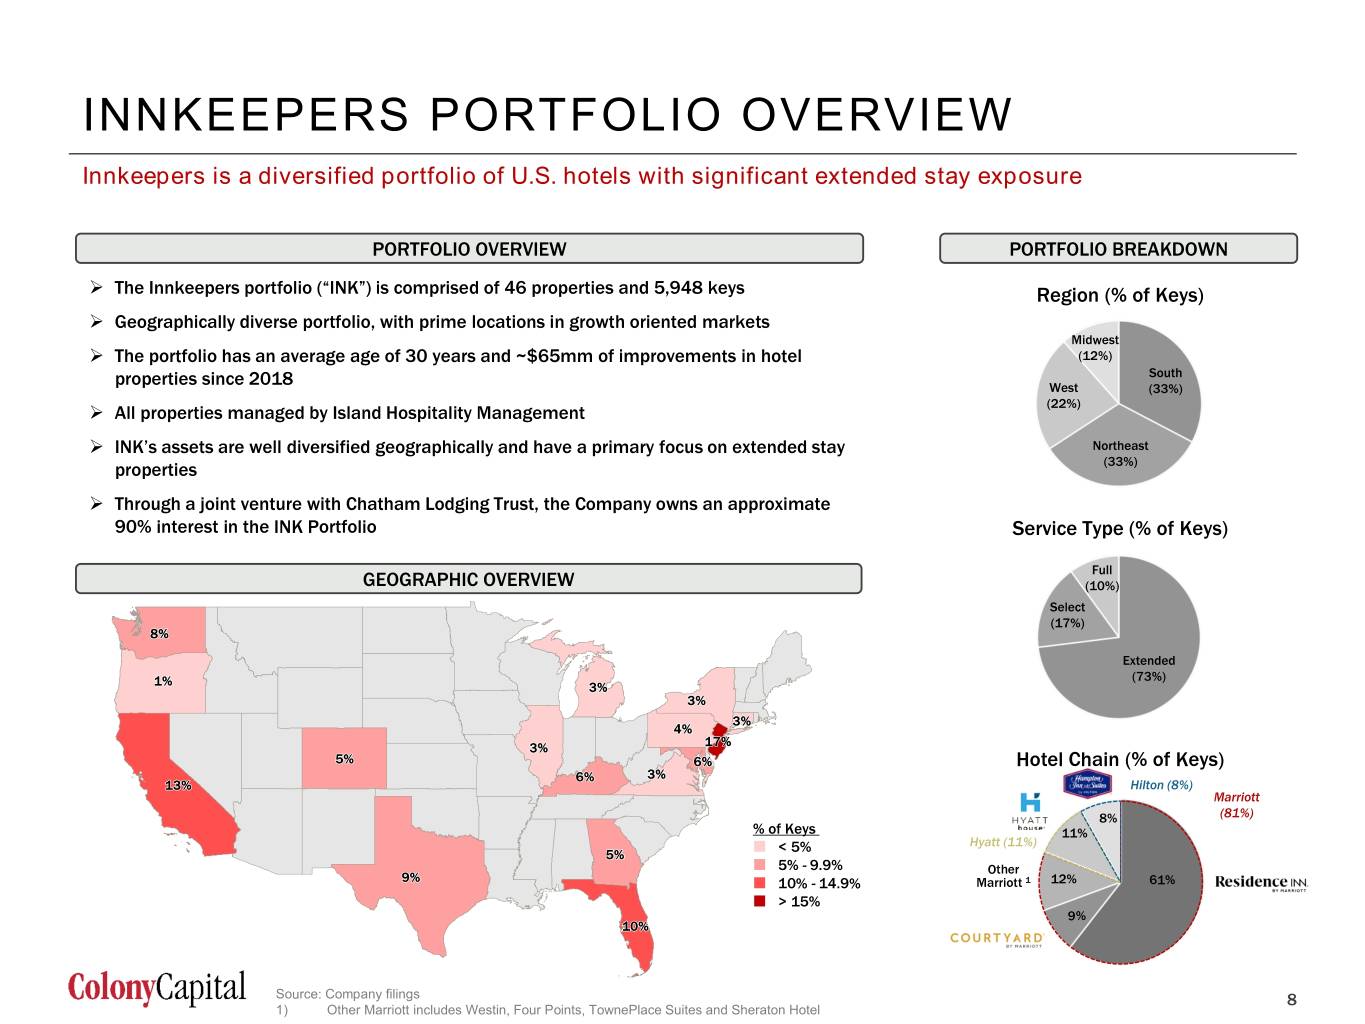
INNKEEPERS PORTFOLIO OVERVIEW Innkeepers is a diversified portfolio of U.S. hotels with significant extended stay exposure PORTFOLIO OVERVIEW PORTFOLIO BREAKDOWN The Innkeepers portfolio (“INK”) is comprised of 46 properties and 5,948 keys Region (% of Keys) Geographically diverse portfolio, with prime locations in growth oriented markets Midwest The portfolio has an average age of 30 years and ~$65mm of improvements in hotel (12%) properties since 2018 South West (33%) (22%) All properties managed by Island Hospitality Management INK’s assets are well diversified geographically and have a primary focus on extended stay Northeast properties (33%) Through a joint venture with Chatham Lodging Trust, the Company owns an approximate 90% interest in the INK Portfolio Service Type (% of Keys) Full GEOGRAPHIC OVERVIEW (10%) Select (17%) Extended (73%) Hotel Chain (% of Keys) Hilton (8%) Marriott 8% (81%) % of Keys 11% < 5% Hyatt (11%) 5% - 9.9% Other 10% - 14.9% Marriott 1 12% 61% > 15% 9% Source: Company filings 8 1) Other Marriott includes Westin, Four Points, TownePlace Suites and Sheraton Hotel 8 Other 2
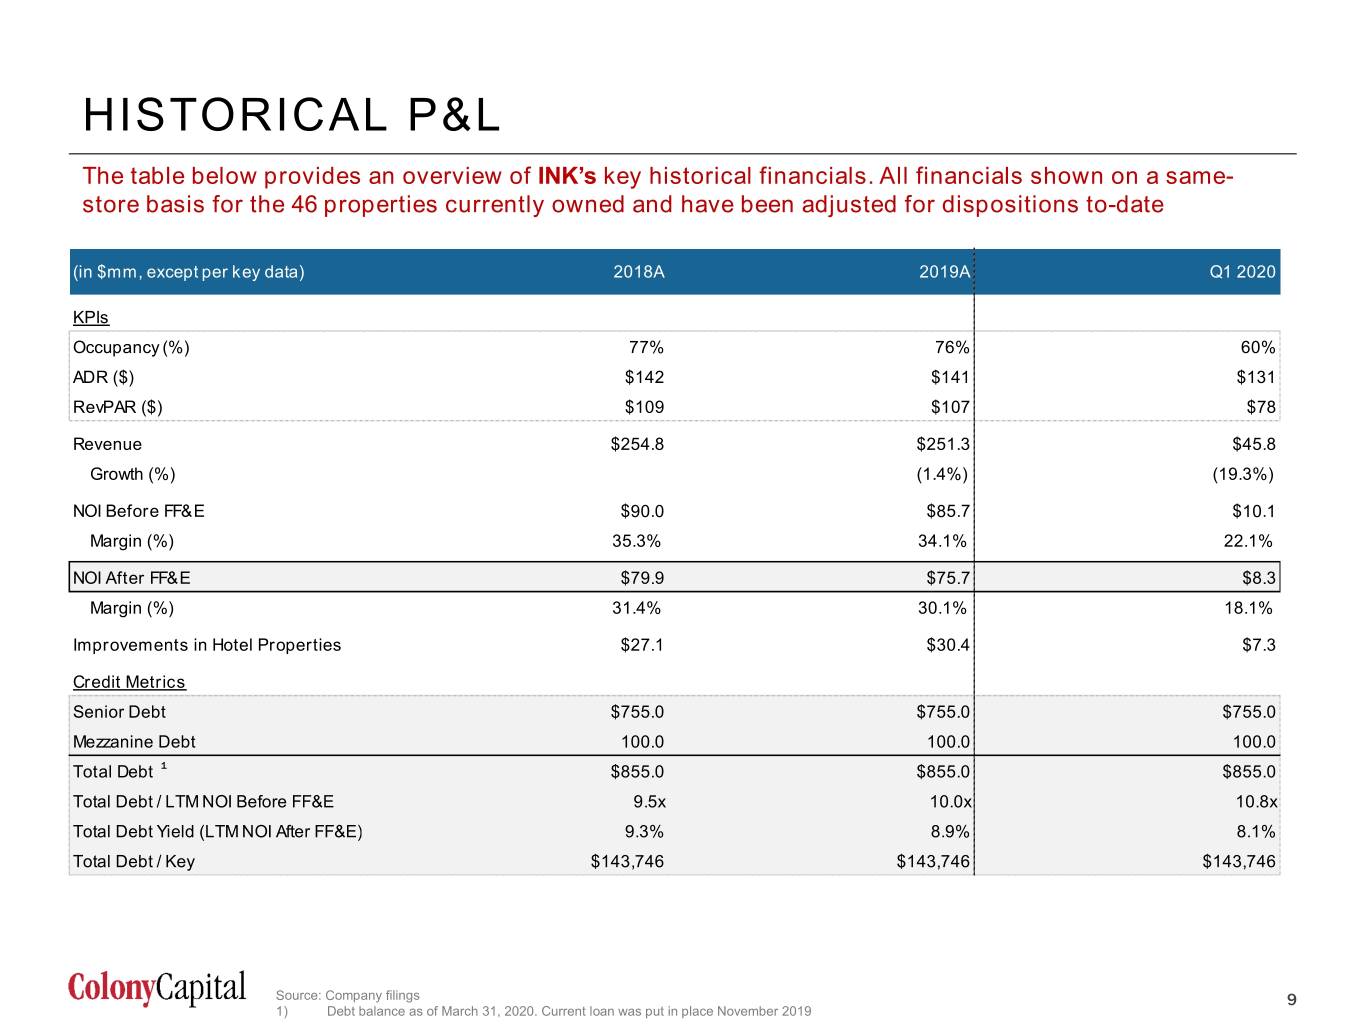
HISTORICAL P&L The table below provides an overview of INK’s key historical financials. All financials shown on a same- store basis for the 46 properties currently owned and have been adjusted for dispositions to-date (in $mm, except per key data) 2018A 2019A Q1 2020 KPIs Occupancy (%) 77% 76% 60% ADR ($) $142 $141 $131 RevPAR ($) $109 $107 $78 Revenue $254.8 $251.3 $45.8 Growth (%) (1.4%) (19.3%) NOI Before FF&E $90.0 $85.7 $10.1 Margin (%) 35.3% 34.1% 22.1% NOI After FF&E $79.9 $75.7 $8.3 Margin (%) 31.4% 30.1% 18.1% Improvements in Hotel Properties $27.1 $30.4 $7.3 Credit Metrics Senior Debt $755.0 $755.0 $755.0 Mezzanine Debt 100.0 100.0 100.0 Total Debt 1 $855.0 $855.0 $855.0 Total Debt / LTM NOI Before FF&E 9.5x 10.0x 10.8x Total Debt Yield (LTM NOI After FF&E) 9.3% 8.9% 8.1% Total Debt / Key $143,746 $143,746 $143,746 Source: Company filings 9 1) Debt balance as of March 31, 2020. Current loan was put in place November 2019 9
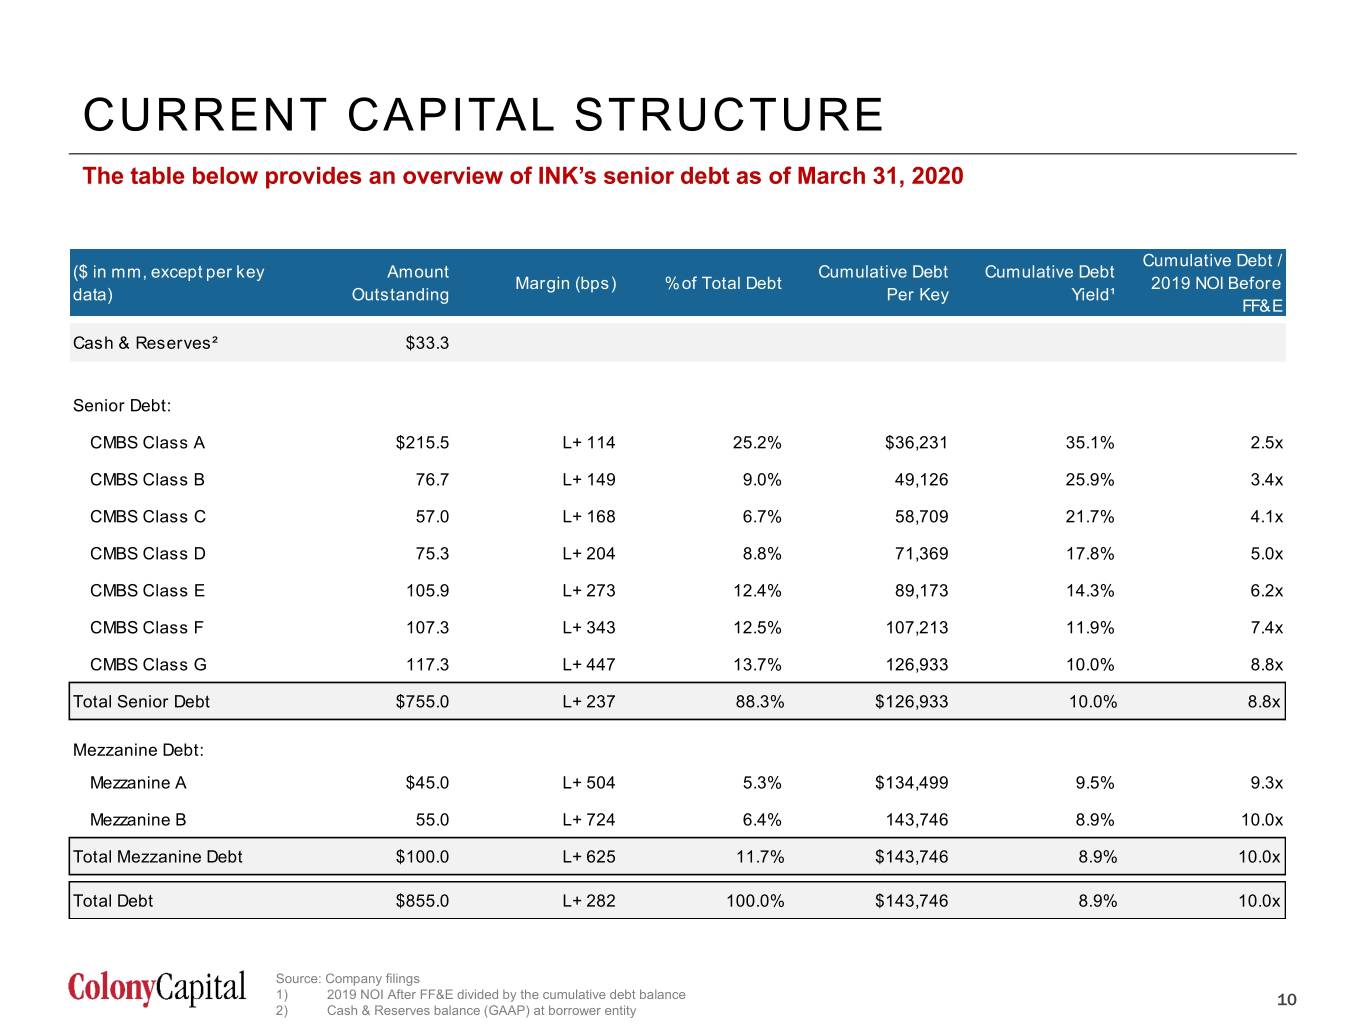
CURRENT CAPITAL STRUCTURE The table below provides an overview of INK’s senior debt as of March 31, 2020 Cumulative Debt / ($ in mm, except per key Amount Cumulative Debt Cumulative Debt Margin (bps) % of Total Debt 2019 NOI Before data) Outstanding Per Key Yield¹ FF&E Cash & Reserves² $33.3 Senior Debt: CMBS Class A $215.5 L+ 114 25.2% $36,231 35.1% 2.5x CMBS Class B 76.7 L+ 149 9.0% 49,126 25.9% 3.4x CMBS Class C 57.0 L+ 168 6.7% 58,709 21.7% 4.1x CMBS Class D 75.3 L+ 204 8.8% 71,369 17.8% 5.0x CMBS Class E 105.9 L+ 273 12.4% 89,173 14.3% 6.2x CMBS Class F 107.3 L+ 343 12.5% 107,213 11.9% 7.4x CMBS Class G 117.3 L+ 447 13.7% 126,933 10.0% 8.8x Total Senior Debt $755.0 L+ 237 88.3% $126,933 10.0% 8.8x Mezzanine Debt: Mezzanine A $45.0 L+ 504 5.3% $134,499 9.5% 9.3x Mezzanine B 55.0 L+ 724 6.4% 143,746 8.9% 10.0x Total Mezzanine Debt $100.0 L+ 625 11.7% $143,746 8.9% 10.0x Total Debt $855.0 L+ 282 100.0% $143,746 8.9% 10.0x Source: Company filings 1) 2019 NOI After FF&E divided by the cumulative debt balance 10 2) Cash & Reserves balance (GAAP) at borrower entity 10

Courtyard – San Jose, CA 3. NEW ENGLAND PORTFOLIO OVERVIEW 11
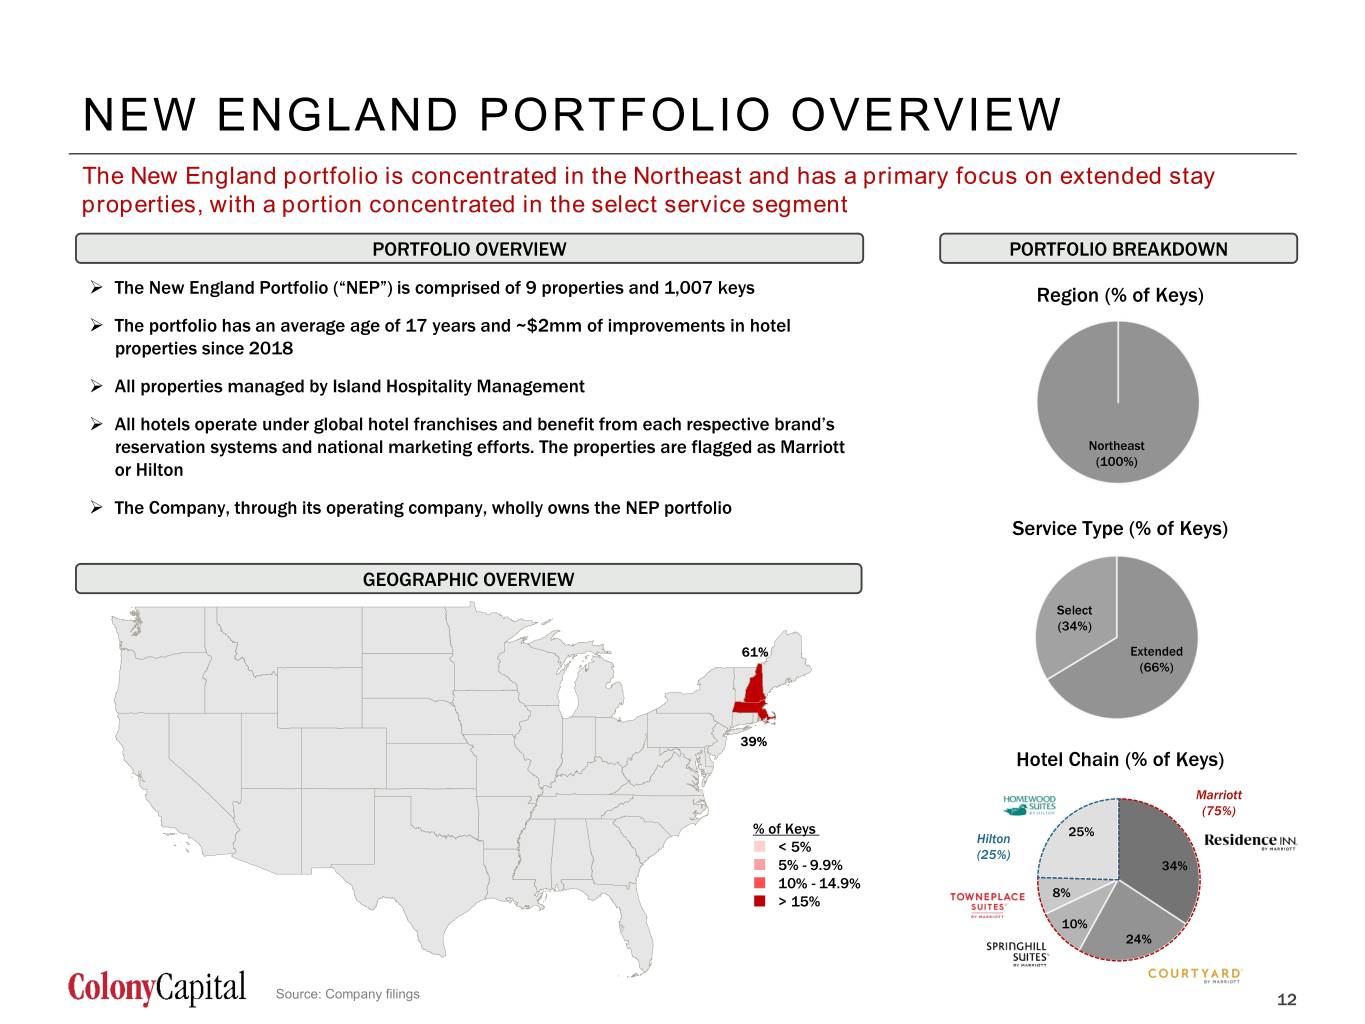
NEW ENGLAND PORTFOLIO OVERVIEW The New England portfolio is concentrated in the Northeast and has a primary focus on extended stay properties, with a portion concentrated in the select service segment PORTFOLIO OVERVIEW PORTFOLIO BREAKDOWN The New England Portfolio (“NEP”) is comprised of 9 properties and 1,007 keys Region (% of Keys) The portfolio has an average age of 17 years and ~$2mm of improvements in hotel properties since 2018 All properties managed by Island Hospitality Management All hotels operate under global hotel franchises and benefit from each respective brand’s reservation systems and national marketing efforts. The properties are flagged as Marriott Northeast or Hilton (100%) The Company, through its operating company, wholly owns the NEP portfolio Service Type (% of Keys) GEOGRAPHIC OVERVIEW Select (34%) Extended (66%) Hotel Chain (% of Keys) Marriott (75%) % of Keys 25% Hilton < 5% Other (25%) Marriott 1 5% - 9.9% 34% 10% - 14.9% 8% > 15% 10% 24% Source: Company filings 12 12 Other 2
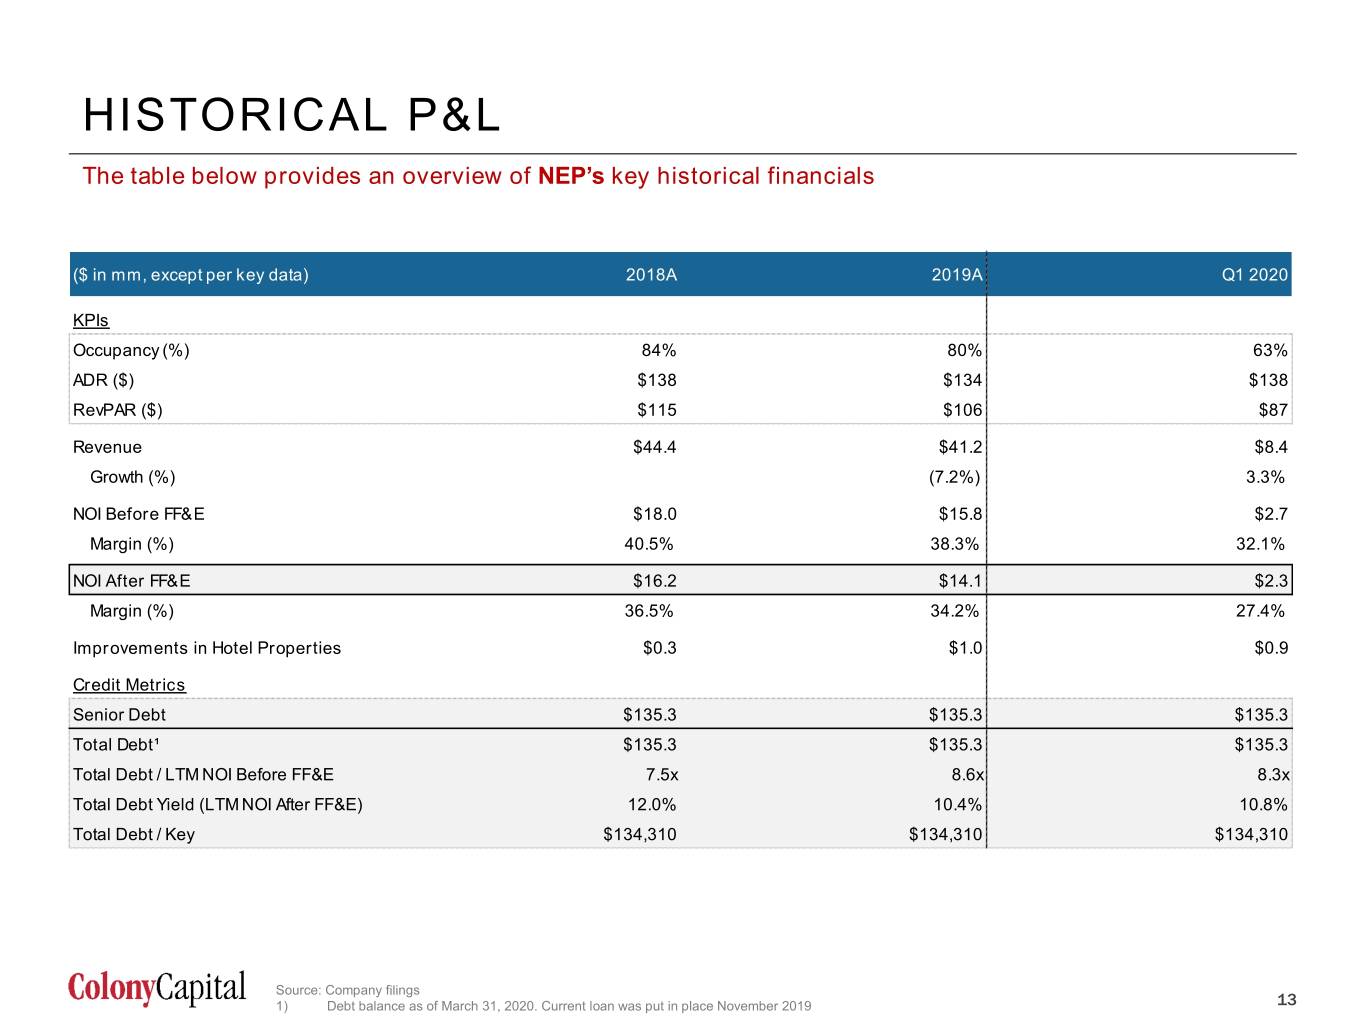
HISTORICAL P&L The table below provides an overview of NEP’s key historical financials ($ in mm, except per key data) 2018A 2019A Q1 2020 KPIs Occupancy (%) 84% 80% 63% ADR ($) $138 $134 $138 RevPAR ($) $115 $106 $87 Revenue $44.4 $41.2 $8.4 Growth (%) (7.2%) 3.3% NOI Before FF&E $18.0 $15.8 $2.7 Margin (%) 40.5% 38.3% 32.1% NOI After FF&E $16.2 $14.1 $2.3 Margin (%) 36.5% 34.2% 27.4% Improvements in Hotel Properties $0.3 $1.0 $0.9 Credit Metrics Senior Debt $135.3 $135.3 $135.3 Total Debt¹ $135.3 $135.3 $135.3 Total Debt / LTM NOI Before FF&E 7.5x 8.6x 8.3x Total Debt Yield (LTM NOI After FF&E) 12.0% 10.4% 10.8% Total Debt / Key $134,310 $134,310 $134,310 Source: Company filings 13 1) Debt balance as of March 31, 2020. Current loan was put in place November 2019 13
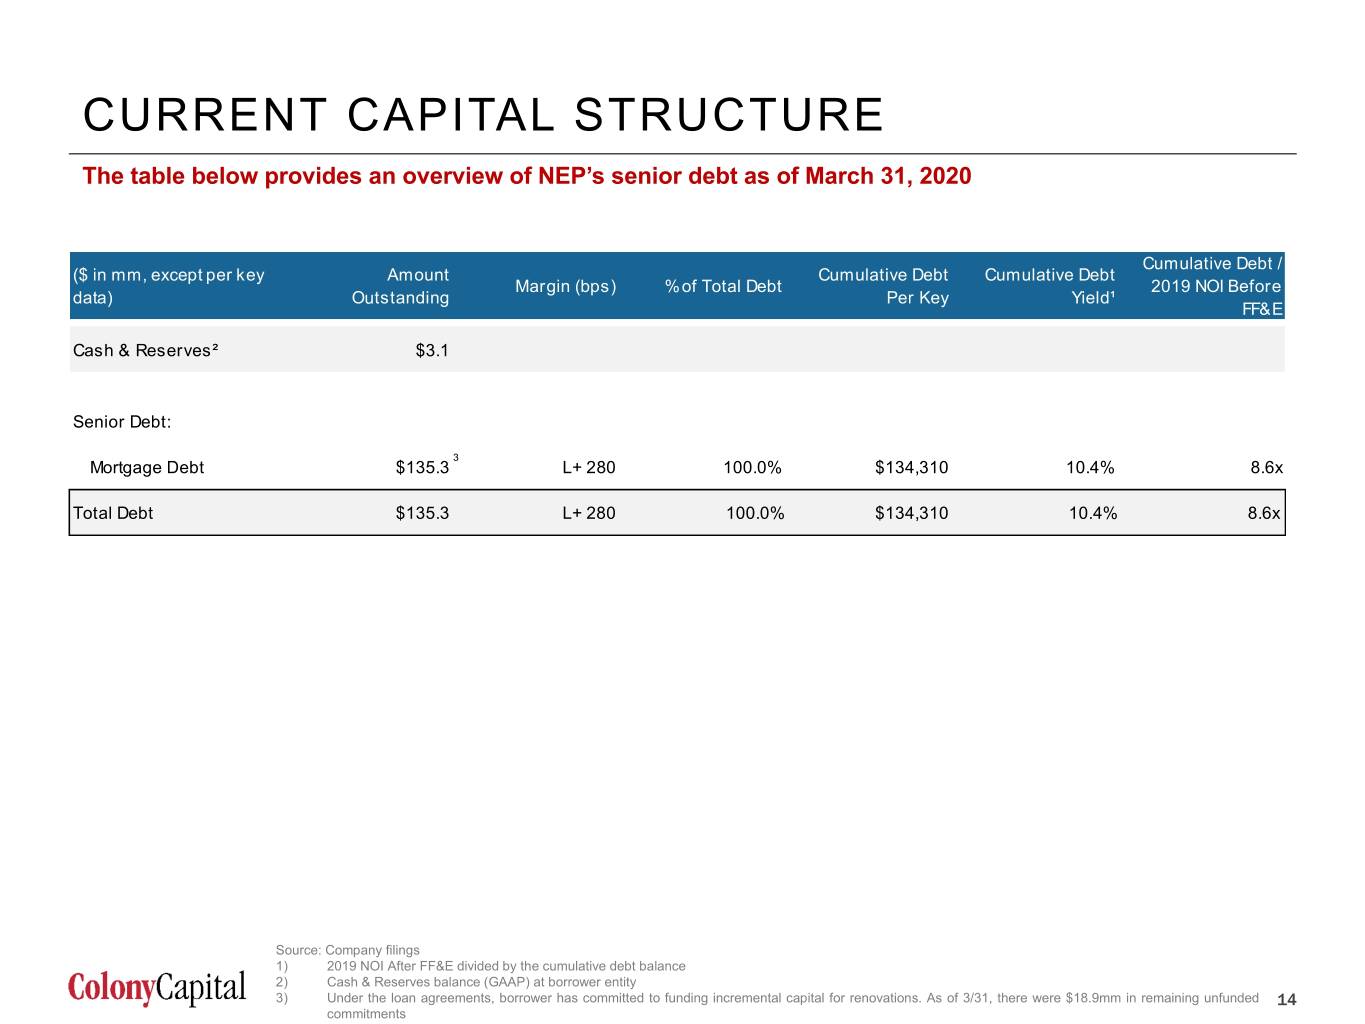
CURRENT CAPITAL STRUCTURE The table below provides an overview of NEP’s senior debt as of March 31, 2020 Cumulative Debt / ($ in mm, except per key Amount Cumulative Debt Cumulative Debt Margin (bps) % of Total Debt 2019 NOI Before data) Outstanding Per Key Yield¹ FF&E Cash & Reserves² $3.1 Senior Debt: 3 Mortgage Debt $135.3 L+ 280 100.0% $134,310 10.4% 8.6x Total Debt $135.3 L+ 280 100.0% $134,310 10.4% 8.6x Source: Company filings 1) 2019 NOI After FF&E divided by the cumulative debt balance 2) Cash & Reserves balance (GAAP) at borrower entity 3) Under the loan agreements, borrower has committed to funding incremental capital for renovations. As of 3/31, there were $18.9mm in remaining unfunded 14 commitments 14

Courtyard – Pleasanton, CA 4. K PORTFOLIO OVERVIEW 15
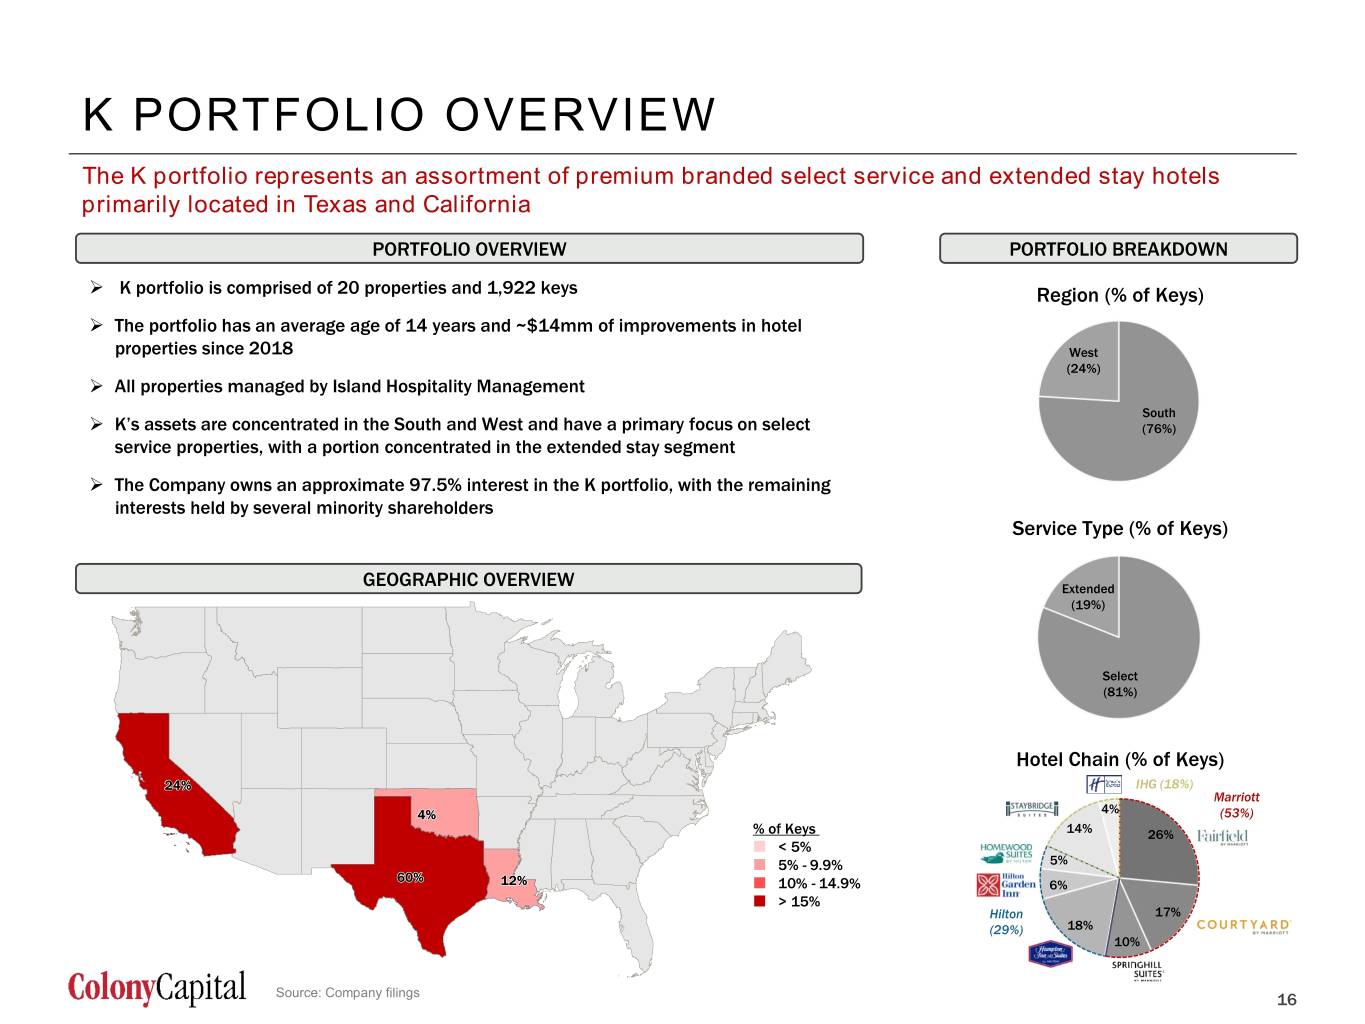
K PORTFOLIO OVERVIEW The K portfolio represents an assortment of premium branded select service and extended stay hotels primarily located in Texas and California PORTFOLIO OVERVIEW PORTFOLIO BREAKDOWN K portfolio is comprised of 20 properties and 1,922 keys Region (% of Keys) The portfolio has an average age of 14 years and ~$14mm of improvements in hotel properties since 2018 West (24%) All properties managed by Island Hospitality Management South K’s assets are concentrated in the South and West and have a primary focus on select (76%) service properties, with a portion concentrated in the extended stay segment The Company owns an approximate 97.5% interest in the K portfolio, with the remaining interests held by several minority shareholders Service Type (% of Keys) GEOGRAPHIC OVERVIEW Extended (19%) Select (81%) Hotel Chain (% of Keys) IHG (18%) Marriott 4% (53%) % of Keys 14% 26% < 5% 5% - 9.9% 5% 10% - 14.9% 6% > 15% Hilton 17% (29%) 18% 10% Source: Company filings 16 16 Other 2
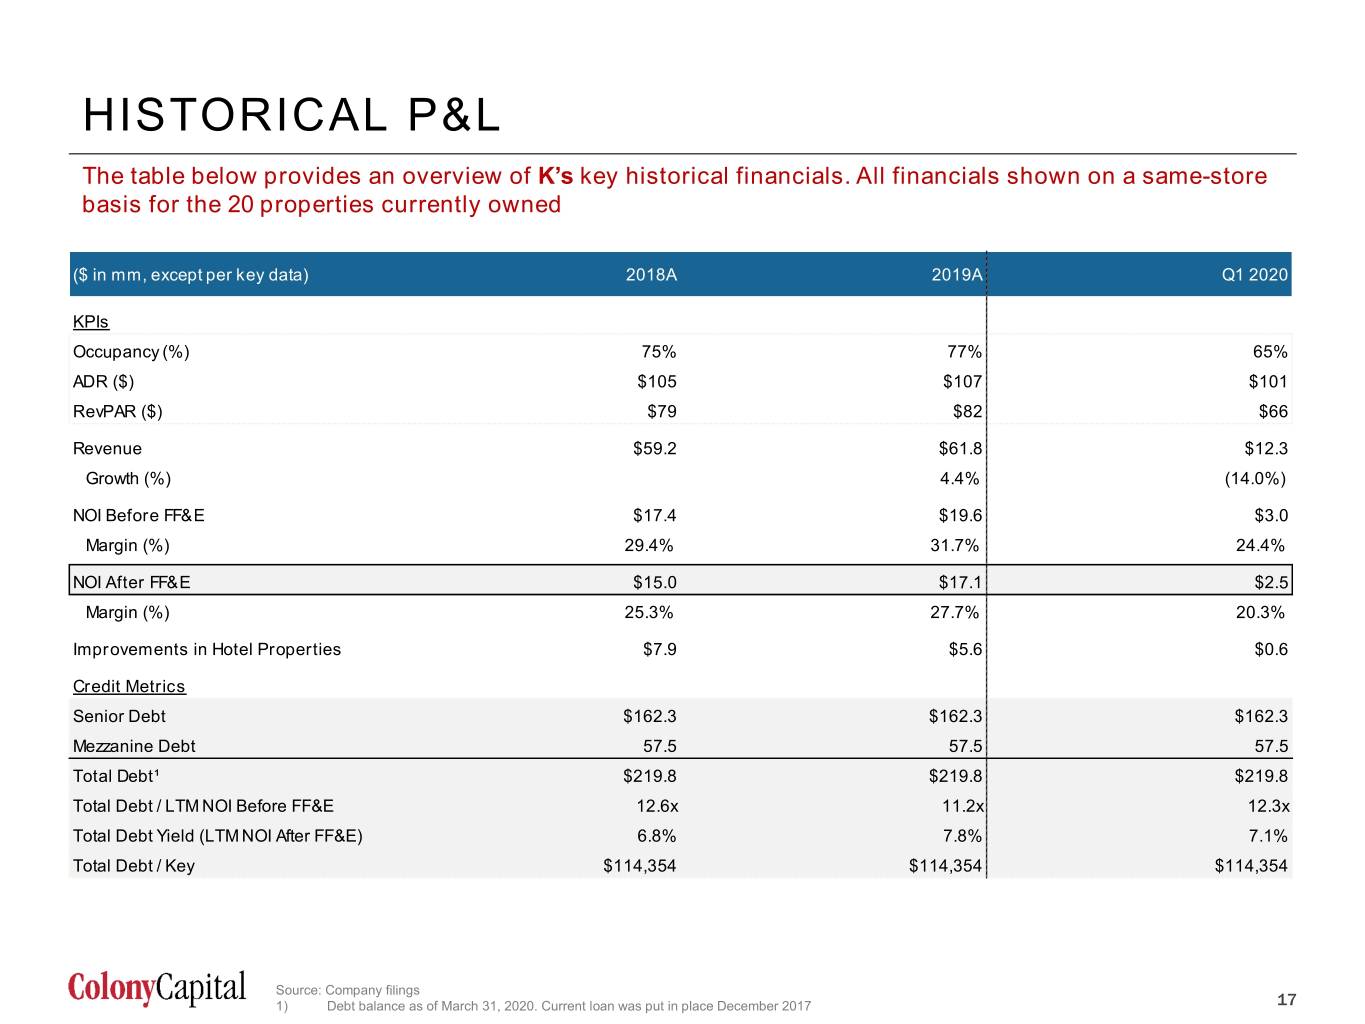
HISTORICAL P&L The table below provides an overview of K’s key historical financials. All financials shown on a same-store basis for the 20 properties currently owned ($ in mm, except per key data) 2018A 2019A Q1 2020 KPIs Occupancy (%) 75% 77% 65% ADR ($) $105 $107 $101 RevPAR ($) $79 $82 $66 Revenue $59.2 $61.8 $12.3 Growth (%) 4.4% (14.0%) NOI Before FF&E $17.4 $19.6 $3.0 Margin (%) 29.4% 31.7% 24.4% NOI After FF&E $15.0 $17.1 $2.5 Margin (%) 25.3% 27.7% 20.3% Improvements in Hotel Properties $7.9 $5.6 $0.6 Credit Metrics Senior Debt $162.3 $162.3 $162.3 Mezzanine Debt 57.5 57.5 57.5 Total Debt¹ $219.8 $219.8 $219.8 Total Debt / LTM NOI Before FF&E 12.6x 11.2x 12.3x Total Debt Yield (LTM NOI After FF&E) 6.8% 7.8% 7.1% Total Debt / Key $114,354 $114,354 $114,354 Source: Company filings 17 1) Debt balance as of March 31, 2020. Current loan was put in place December 2017 17
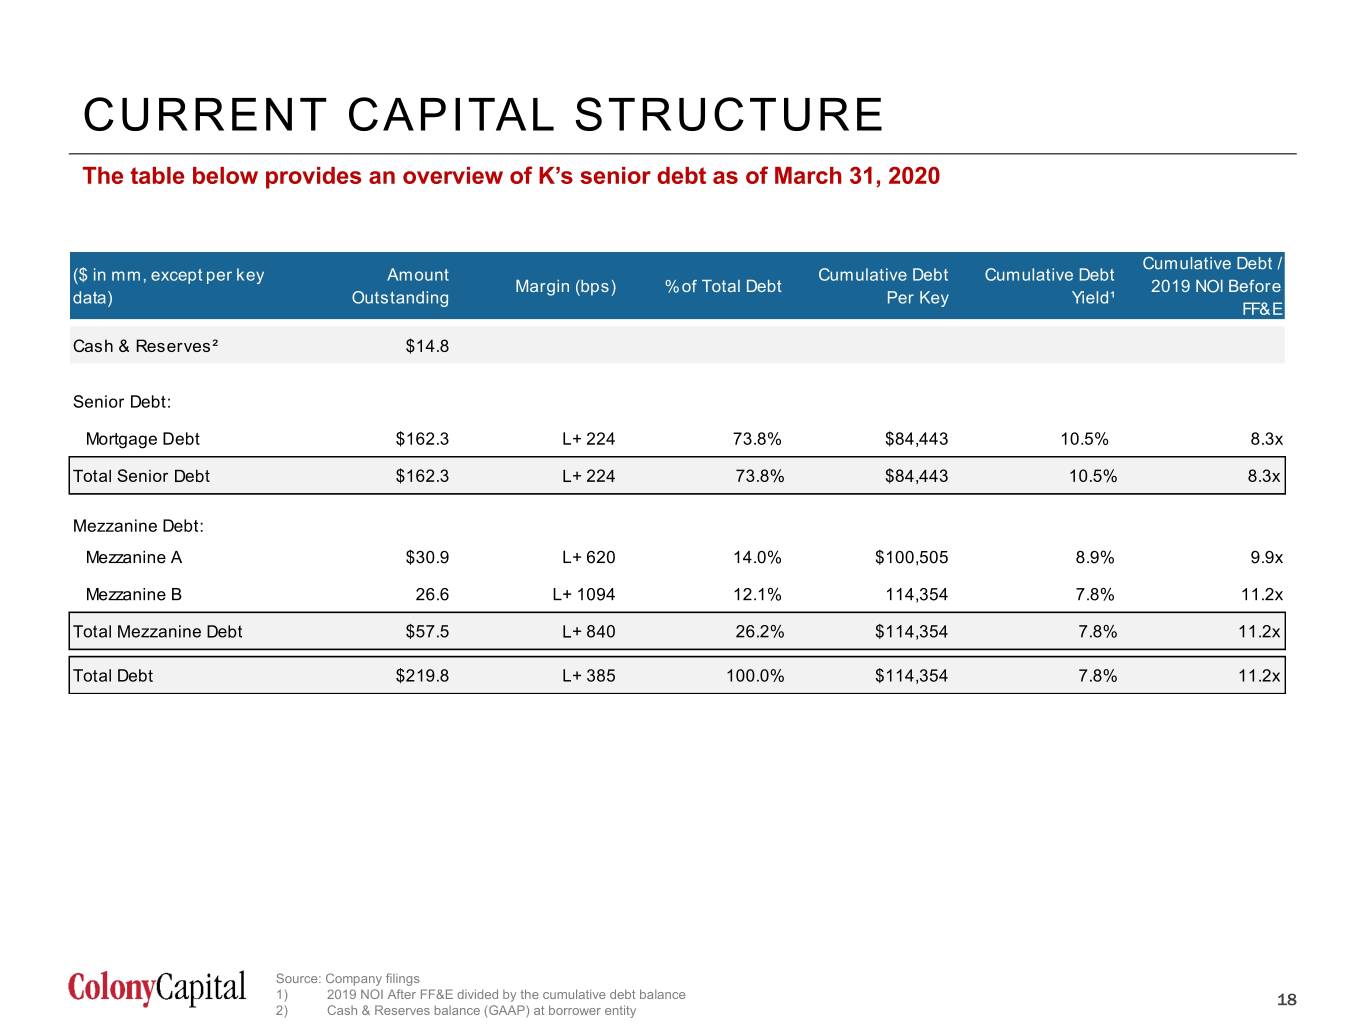
CURRENT CAPITAL STRUCTURE The table below provides an overview of K’s senior debt as of March 31, 2020 Cumulative Debt / ($ in mm, except per key Amount Cumulative Debt Cumulative Debt Margin (bps) % of Total Debt 2019 NOI Before data) Outstanding Per Key Yield¹ FF&E Cash & Reserves² $14.8 Senior Debt: Mortgage Debt $162.3 L+ 224 73.8% $84,443 10.5% 8.3x Total Senior Debt $162.3 L+ 224 73.8% $84,443 10.5% 8.3x Mezzanine Debt: Mezzanine A $30.9 L+ 620 14.0% $100,505 8.9% 9.9x Mezzanine B 26.6 L+ 1094 12.1% 114,354 7.8% 11.2x Total Mezzanine Debt $57.5 L+ 840 26.2% $114,354 7.8% 11.2x Total Debt $219.8 L+ 385 100.0% $114,354 7.8% 11.2x Source: Company filings 1) 2019 NOI After FF&E divided by the cumulative debt balance 18 2) Cash & Reserves balance (GAAP) at borrower entity 18

Courtyard – Herndon, VA 5. COURTYARD BY MARRIOTT PORTFOLIO OVERVIEW 19
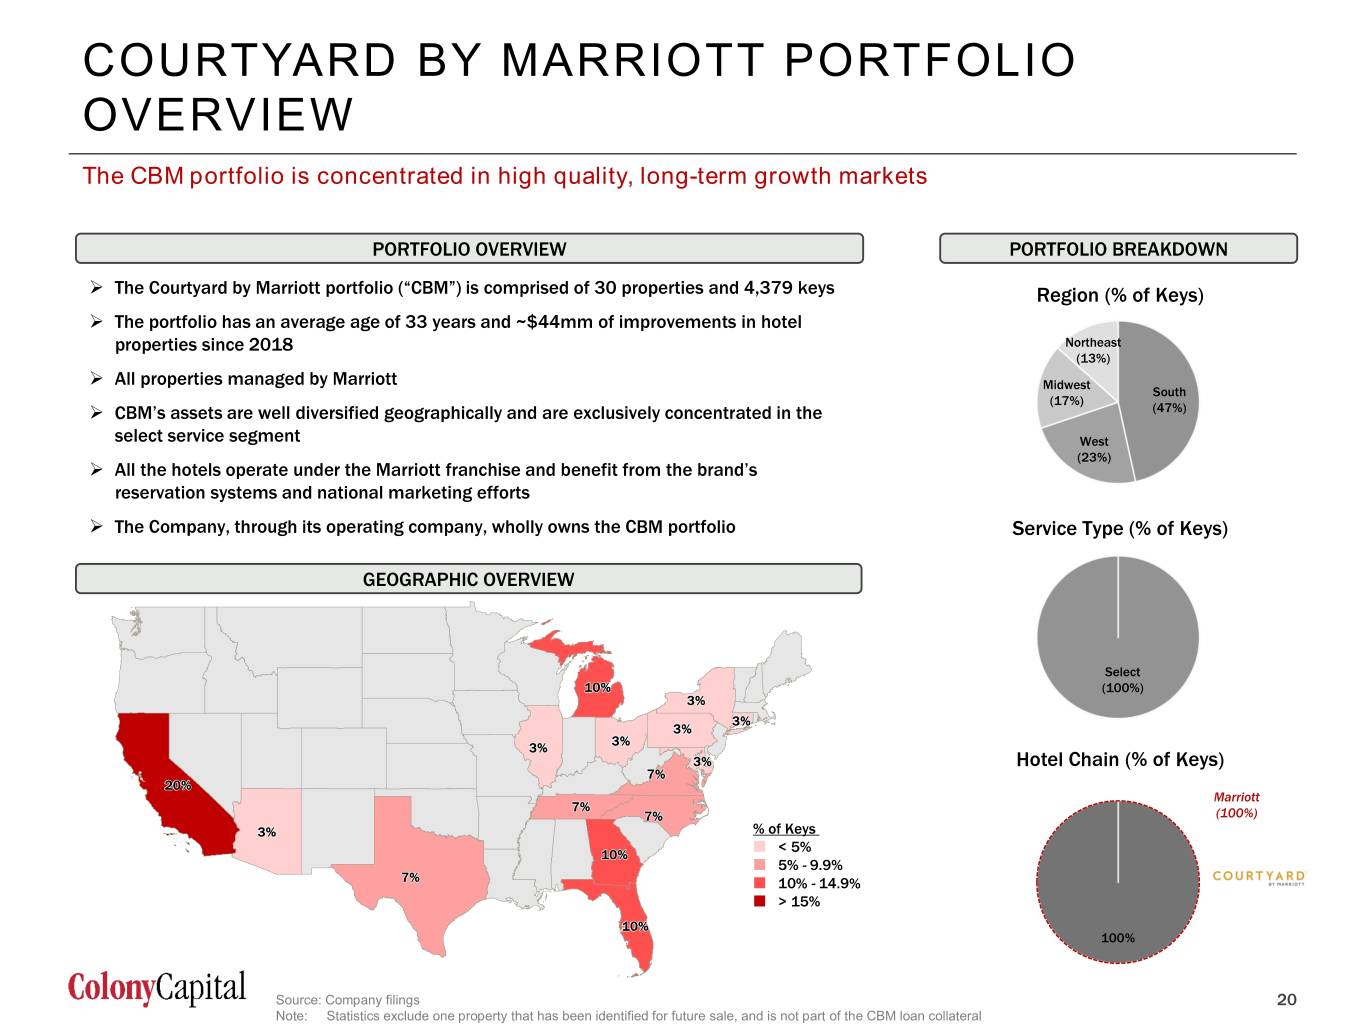
COURTYARD BY MARRIOTT PORTFOLIO OVERVIEW The CBM portfolio is concentrated in high quality, long-term growth markets PORTFOLIO OVERVIEW PORTFOLIO BREAKDOWN The Courtyard by Marriott portfolio (“CBM”) is comprised of 30 properties and 4,379 keys Region (% of Keys) The portfolio has an average age of 33 years and ~$44mm of improvements in hotel properties since 2018 Northeast (13%) All properties managed by Marriott Midwest South (17%) CBM’s assets are well diversified geographically and are exclusively concentrated in the (47%) select service segment West (23%) All the hotels operate under the Marriott franchise and benefit from the brand’s reservation systems and national marketing efforts The Company, through its operating company, wholly owns the CBM portfolio Service Type (% of Keys) GEOGRAPHIC OVERVIEW Select (100%) Hotel Chain (% of Keys) Marriott (100%) % of Keys Marriott < 5% Other (69%) Marriott 1 5% - 9.9% 10% - 14.9% > 15% 100% Hilton (24%) Source: Company filings 20 Note: Statistics exclude one property that has been identified for future sale, and is not part of the CBM loan collateral 20 Other 2
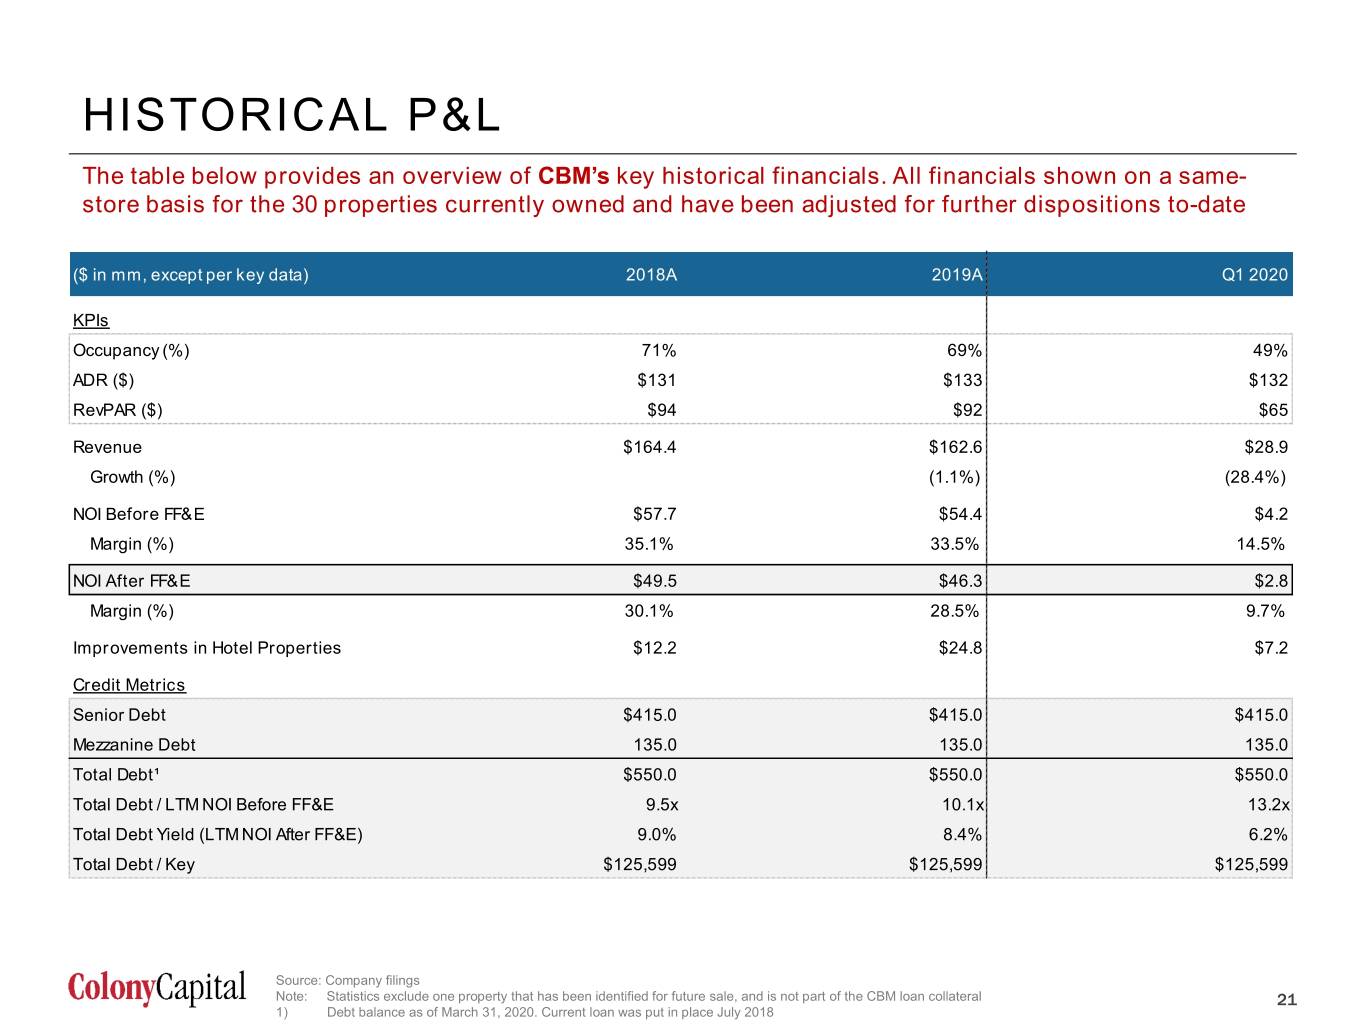
HISTORICAL P&L The table below provides an overview of CBM’s key historical financials. All financials shown on a same- store basis for the 30 properties currently owned and have been adjusted for further dispositions to-date ($ in mm, except per key data) 2018A 2019A Q1 2020 KPIs Occupancy (%) 71% 69% 49% ADR ($) $131 $133 $132 RevPAR ($) $94 $92 $65 Revenue $164.4 $162.6 $28.9 Growth (%) (1.1%) (28.4%) NOI Before FF&E $57.7 $54.4 $4.2 Margin (%) 35.1% 33.5% 14.5% NOI After FF&E $49.5 $46.3 $2.8 Margin (%) 30.1% 28.5% 9.7% Improvements in Hotel Properties $12.2 $24.8 $7.2 Credit Metrics Senior Debt $415.0 $415.0 $415.0 Mezzanine Debt 135.0 135.0 135.0 Total Debt¹ $550.0 $550.0 $550.0 Total Debt / LTM NOI Before FF&E 9.5x 10.1x 13.2x Total Debt Yield (LTM NOI After FF&E) 9.0% 8.4% 6.2% Total Debt / Key $125,599 $125,599 $125,599 Source: Company filings Note: Statistics exclude one property that has been identified for future sale, and is not part of the CBM loan collateral 21 1) Debt balance as of March 31, 2020. Current loan was put in place July 2018 21
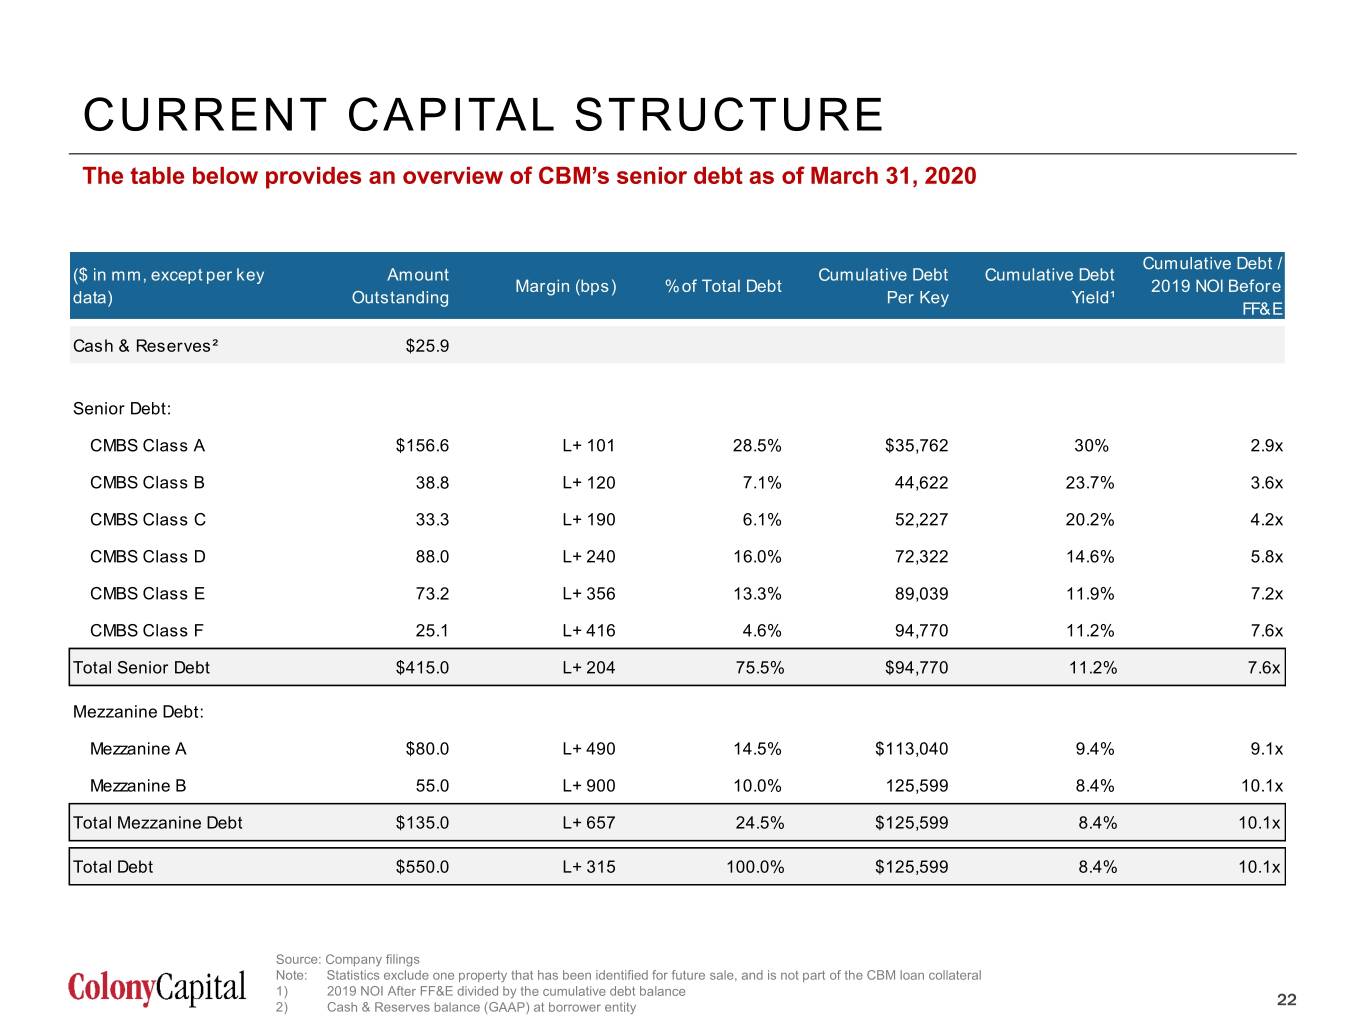
CURRENT CAPITAL STRUCTURE The table below provides an overview of CBM’s senior debt as of March 31, 2020 Cumulative Debt / ($ in mm, except per key Amount Cumulative Debt Cumulative Debt Margin (bps) % of Total Debt 2019 NOI Before data) Outstanding Per Key Yield¹ FF&E Cash & Reserves² $25.9 Senior Debt: CMBS Class A $156.6 L+ 101 28.5% $35,762 30% 2.9x CMBS Class B 38.8 L+ 120 7.1% 44,622 23.7% 3.6x CMBS Class C 33.3 L+ 190 6.1% 52,227 20.2% 4.2x CMBS Class D 88.0 L+ 240 16.0% 72,322 14.6% 5.8x CMBS Class E 73.2 L+ 356 13.3% 89,039 11.9% 7.2x CMBS Class F 25.1 L+ 416 4.6% 94,770 11.2% 7.6x Total Senior Debt $415.0 L+ 204 75.5% $94,770 11.2% 7.6x Mezzanine Debt: Mezzanine A $80.0 L+ 490 14.5% $113,040 9.4% 9.1x Mezzanine B 55.0 L+ 900 10.0% 125,599 8.4% 10.1x Total Mezzanine Debt $135.0 L+ 657 24.5% $125,599 8.4% 10.1x Total Debt $550.0 L+ 315 100.0% $125,599 8.4% 10.1x Source: Company filings Note: Statistics exclude one property that has been identified for future sale, and is not part of the CBM loan collateral 1) 2019 NOI After FF&E divided by the cumulative debt balance 22 2) Cash & Reserves balance (GAAP) at borrower entity 22
Residence Inn – Las Vegas , NV 6. THL PORTFOLIO OVERVIEW 23
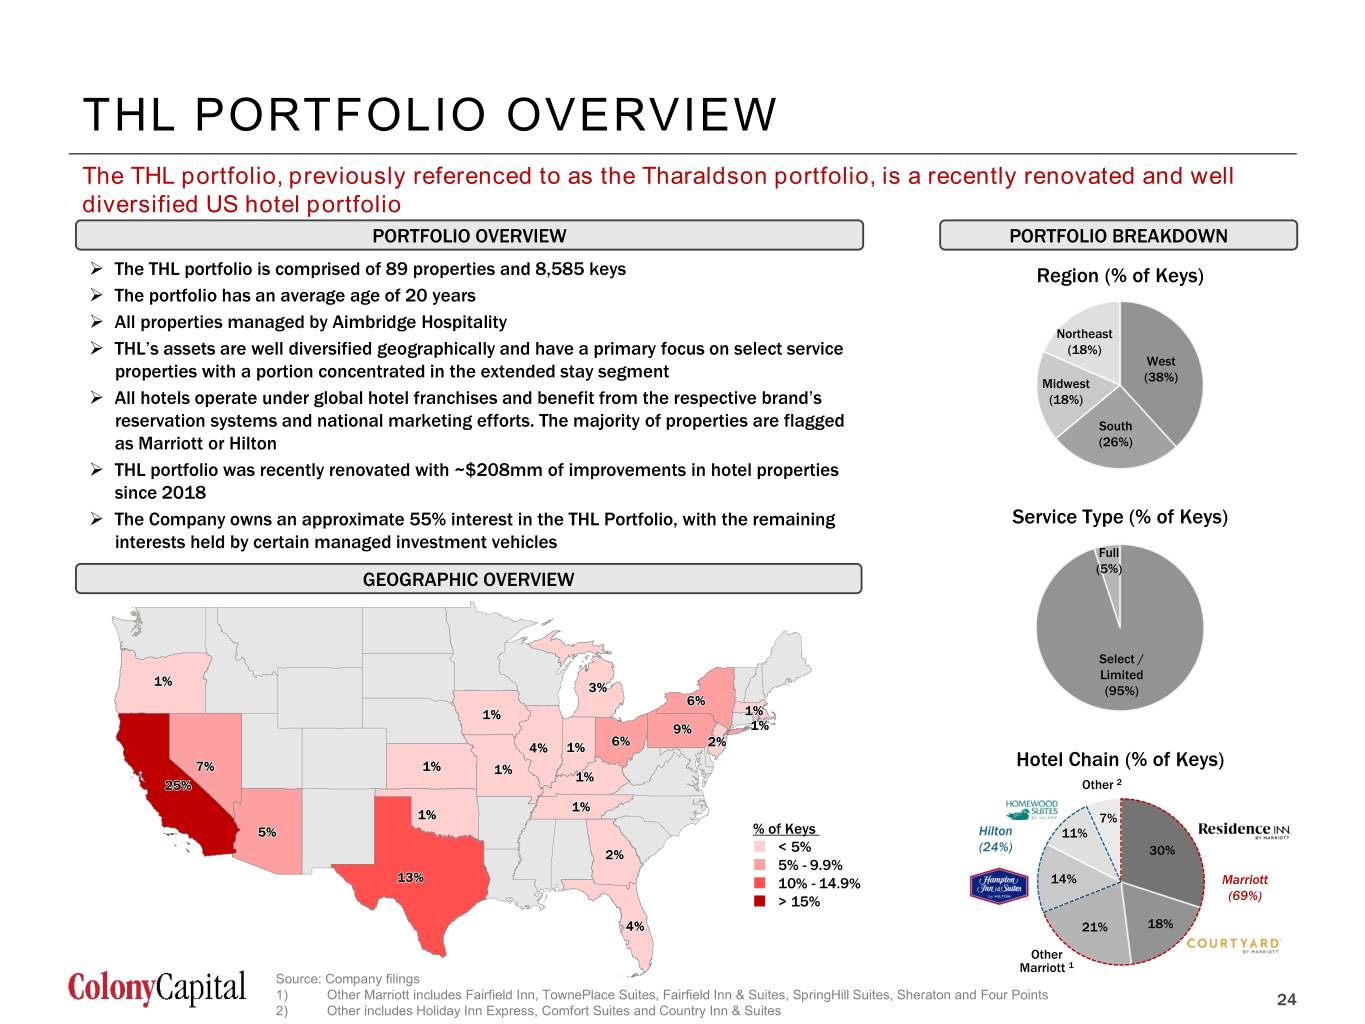
THL PORTFOLIO OVERVIEW The THL portfolio, previously referenced to as the Tharaldson portfolio, is a recently renovated and well diversified US hotel portfolio PORTFOLIO OVERVIEW PORTFOLIO BREAKDOWN The THL portfolio is comprised of 89 properties and 8,585 keys Region (% of Keys) The portfolio has an average age of 20 years All properties managed by Aimbridge Hospitality Northeast THL’s assets are well diversified geographically and have a primary focus on select service (18%) West properties with a portion concentrated in the extended stay segment Midwest (38%) All hotels operate under global hotel franchises and benefit from the respective brand’s (18%) reservation systems and national marketing efforts. The majority of properties are flagged South as Marriott or Hilton (26%) THL portfolio was recently renovated with ~$208mm of improvements in hotel properties since 2018 The Company owns an approximate 55% interest in the THL Portfolio, with the remaining Service Type (% of Keys) interests held by certain managed investment vehicles Full (5%) GEOGRAPHIC OVERVIEW Select / Limited (95%) Hotel Chain (% of Keys) Other 2 7% % of Keys Hilton 11% < 5% (24%) 30% 5% - 9.9% 10% - 14.9% 14% Marriott > 15% (69%) 21% 18% Other Marriott 1 Source: Company filings 1) Other Marriott includes Fairfield Inn, TownePlace Suites, Fairfield Inn & Suites, SpringHill Suites, Sheraton and Four Points 24 2) Other includes Holiday Inn Express, Comfort Suites and Country Inn & Suites 24
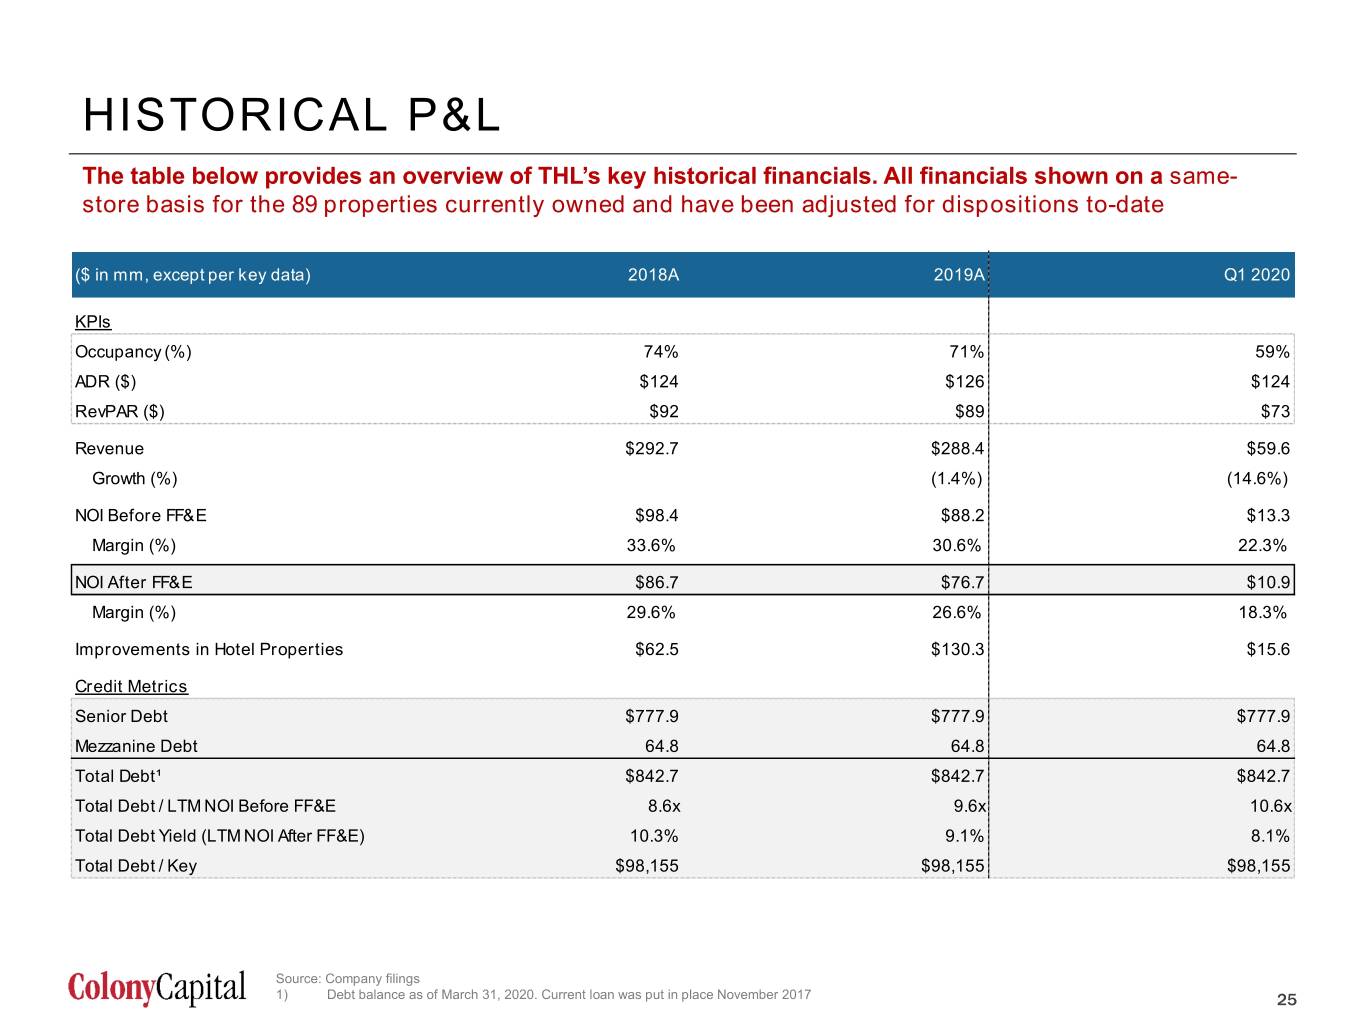
HISTORICAL P&L The table below provides an overview of THL’s key historical financials. All financials shown on a same- store basis for the 89 properties currently owned and have been adjusted for dispositions to-date ($ in mm, except per key data) 2018A 2019A Q1 2020 KPIs Occupancy (%) 74% 71% 59% ADR ($) $124 $126 $124 RevPAR ($) $92 $89 $73 Revenue $292.7 $288.4 $59.6 Growth (%) (1.4%) (14.6%) NOI Before FF&E $98.4 $88.2 $13.3 Margin (%) 33.6% 30.6% 22.3% NOI After FF&E $86.7 $76.7 $10.9 Margin (%) 29.6% 26.6% 18.3% Improvements in Hotel Properties $62.5 $130.3 $15.6 Credit Metrics Senior Debt $777.9 $777.9 $777.9 Mezzanine Debt 64.8 64.8 64.8 Total Debt¹ $842.7 $842.7 $842.7 Total Debt / LTM NOI Before FF&E 8.6x 9.6x 10.6x Total Debt Yield (LTM NOI After FF&E) 10.3% 9.1% 8.1% Total Debt / Key $98,155 $98,155 $98,155 Source: Company filings 1) Debt balance as of March 31, 2020. Current loan was put in place November 2017 25 25
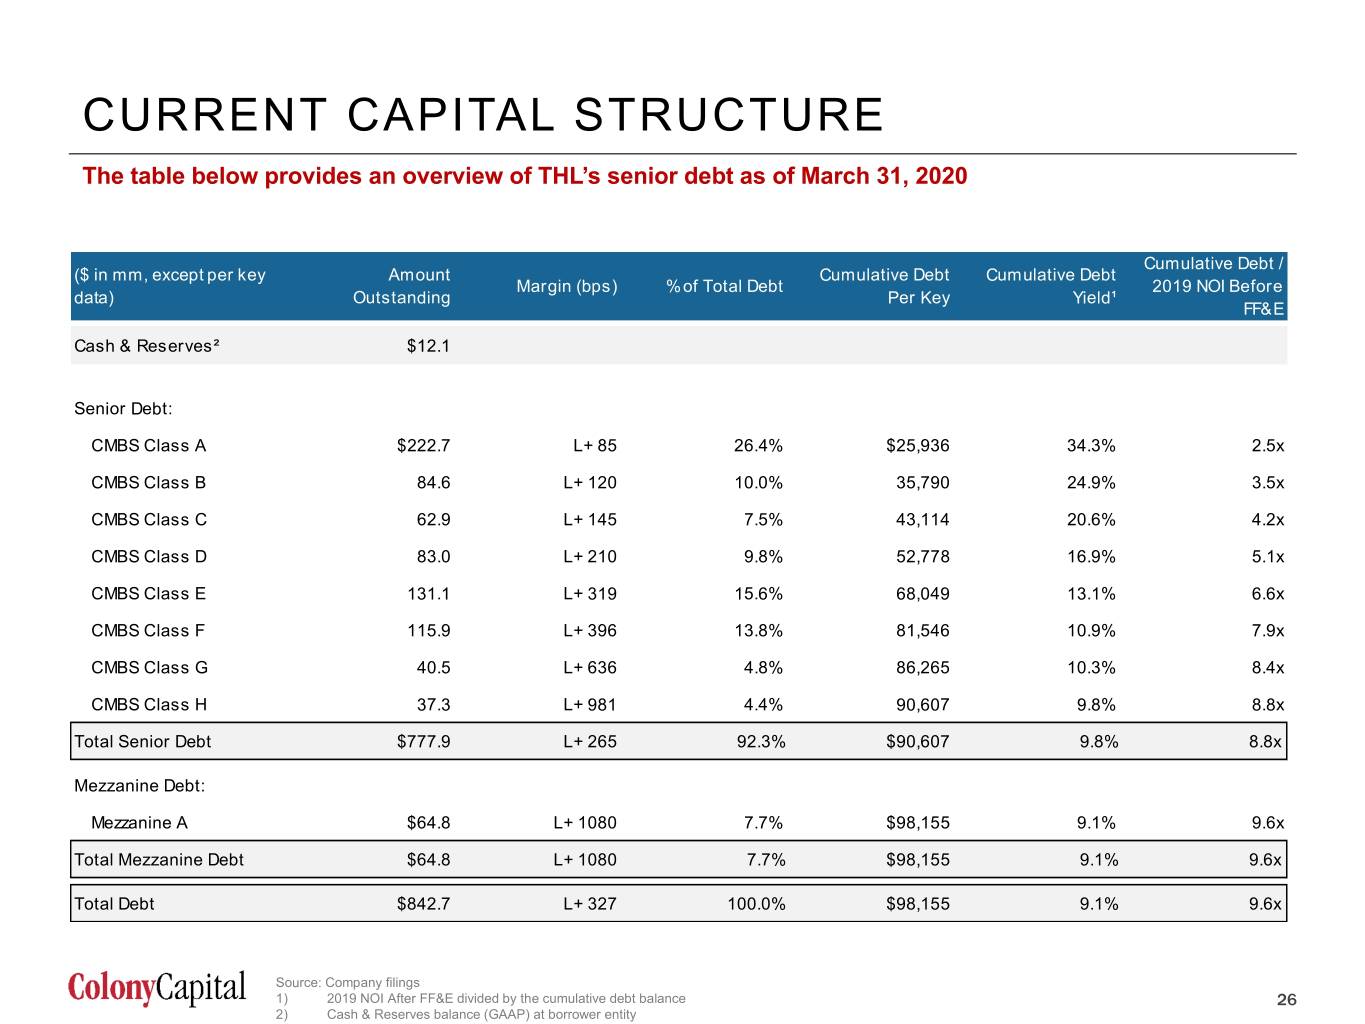
CURRENT CAPITAL STRUCTURE The table below provides an overview of THL’s senior debt as of March 31, 2020 Cumulative Debt / ($ in mm, except per key Amount Cumulative Debt Cumulative Debt Margin (bps) % of Total Debt 2019 NOI Before data) Outstanding Per Key Yield¹ FF&E Cash & Reserves² $12.1 Senior Debt: CMBS Class A $222.7 L+ 85 26.4% $25,936 34.3% 2.5x CMBS Class B 84.6 L+ 120 10.0% 35,790 24.9% 3.5x CMBS Class C 62.9 L+ 145 7.5% 43,114 20.6% 4.2x CMBS Class D 83.0 L+ 210 9.8% 52,778 16.9% 5.1x CMBS Class E 131.1 L+ 319 15.6% 68,049 13.1% 6.6x CMBS Class F 115.9 L+ 396 13.8% 81,546 10.9% 7.9x CMBS Class G 40.5 L+ 636 4.8% 86,265 10.3% 8.4x CMBS Class H 37.3 L+ 981 4.4% 90,607 9.8% 8.8x Total Senior Debt $777.9 L+ 265 92.3% $90,607 9.8% 8.8x Mezzanine Debt: Mezzanine A $64.8 L+ 1080 7.7% $98,155 9.1% 9.6x Total Mezzanine Debt $64.8 L+ 1080 7.7% $98,155 9.1% 9.6x Total Debt $842.7 L+ 327 100.0% $98,155 9.1% 9.6x Source: Company filings 1) 2019 NOI After FF&E divided by the cumulative debt balance 26 2) Cash & Reserves balance (GAAP) at borrower entity 26

Marriott – Miami, FL 7. MIAMI CONNECTION OVERVIEW 27
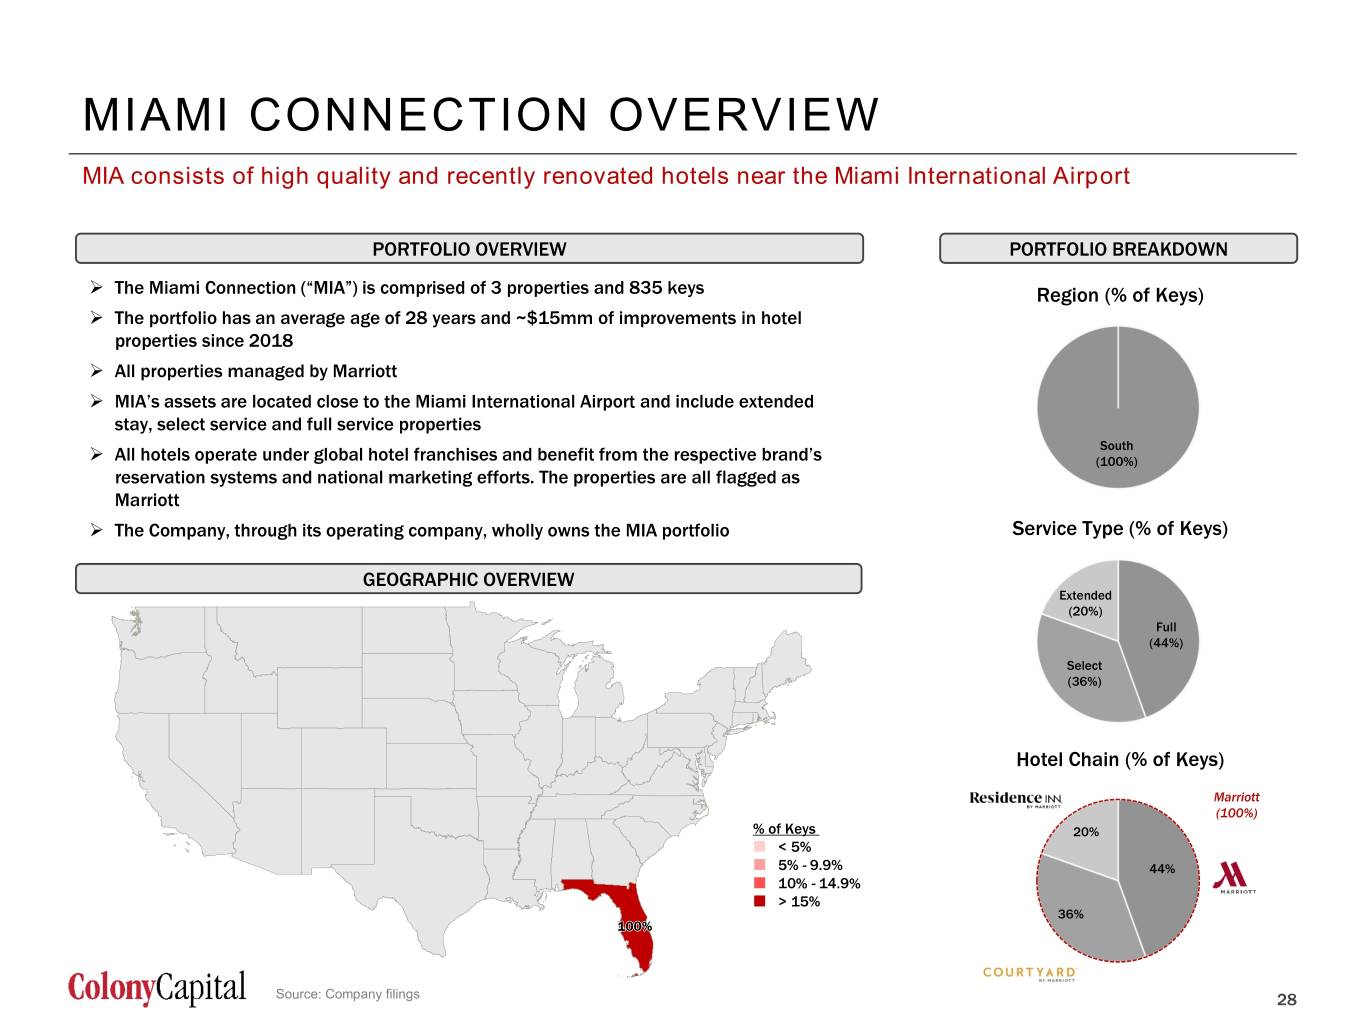
MIAMI CONNECTION OVERVIEW MIA consists of high quality and recently renovated hotels near the Miami International Airport PORTFOLIO OVERVIEW PORTFOLIO BREAKDOWN The Miami Connection (“MIA”) is comprised of 3 properties and 835 keys Region (% of Keys) The portfolio has an average age of 28 years and ~$15mm of improvements in hotel properties since 2018 All properties managed by Marriott MIA’s assets are located close to the Miami International Airport and include extended stay, select service and full service properties South All hotels operate under global hotel franchises and benefit from the respective brand’s (100%) reservation systems and national marketing efforts. The properties are all flagged as Marriott The Company, through its operating company, wholly owns the MIA portfolio Service Type (% of Keys) GEOGRAPHIC OVERVIEW Extended (20%) Full (44%) Select (36%) Hotel Chain (% of Keys) Marriott (100%) % of Keys 20% < 5% Other Marriott 1 5% - 9.9% 44% 10% - 14.9% > 15% 36% Hilton Source: Company filings 28 (24%) 28 Other 2
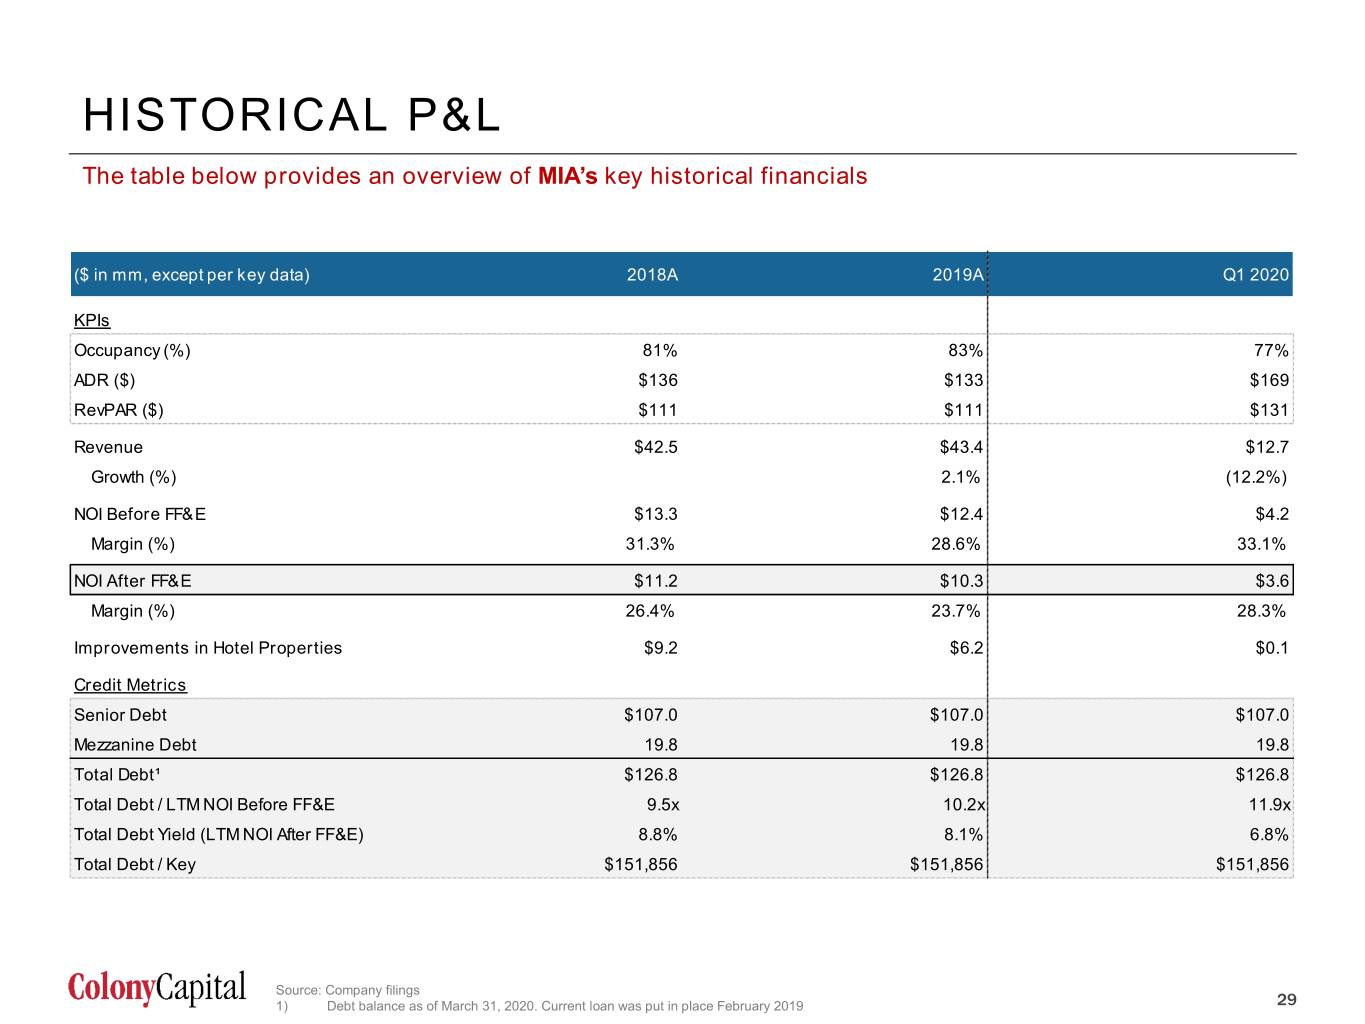
HISTORICAL P&L The table below provides an overview of MIA’s key historical financials ($ in mm, except per key data) 2018A 2019A Q1 2020 KPIs Occupancy (%) 81% 83% 77% ADR ($) $136 $133 $169 RevPAR ($) $111 $111 $131 Revenue $42.5 $43.4 $12.7 Growth (%) 2.1% (12.2%) NOI Before FF&E $13.3 $12.4 $4.2 Margin (%) 31.3% 28.6% 33.1% NOI After FF&E $11.2 $10.3 $3.6 Margin (%) 26.4% 23.7% 28.3% Improvements in Hotel Properties $9.2 $6.2 $0.1 Credit Metrics Senior Debt $107.0 $107.0 $107.0 Mezzanine Debt 19.8 19.8 19.8 Total Debt¹ $126.8 $126.8 $126.8 Total Debt / LTM NOI Before FF&E 9.5x 10.2x 11.9x Total Debt Yield (LTM NOI After FF&E) 8.8% 8.1% 6.8% Total Debt / Key $151,856 $151,856 $151,856 Source: Company filings 29 1) Debt balance as of March 31, 2020. Current loan was put in place February 2019 29
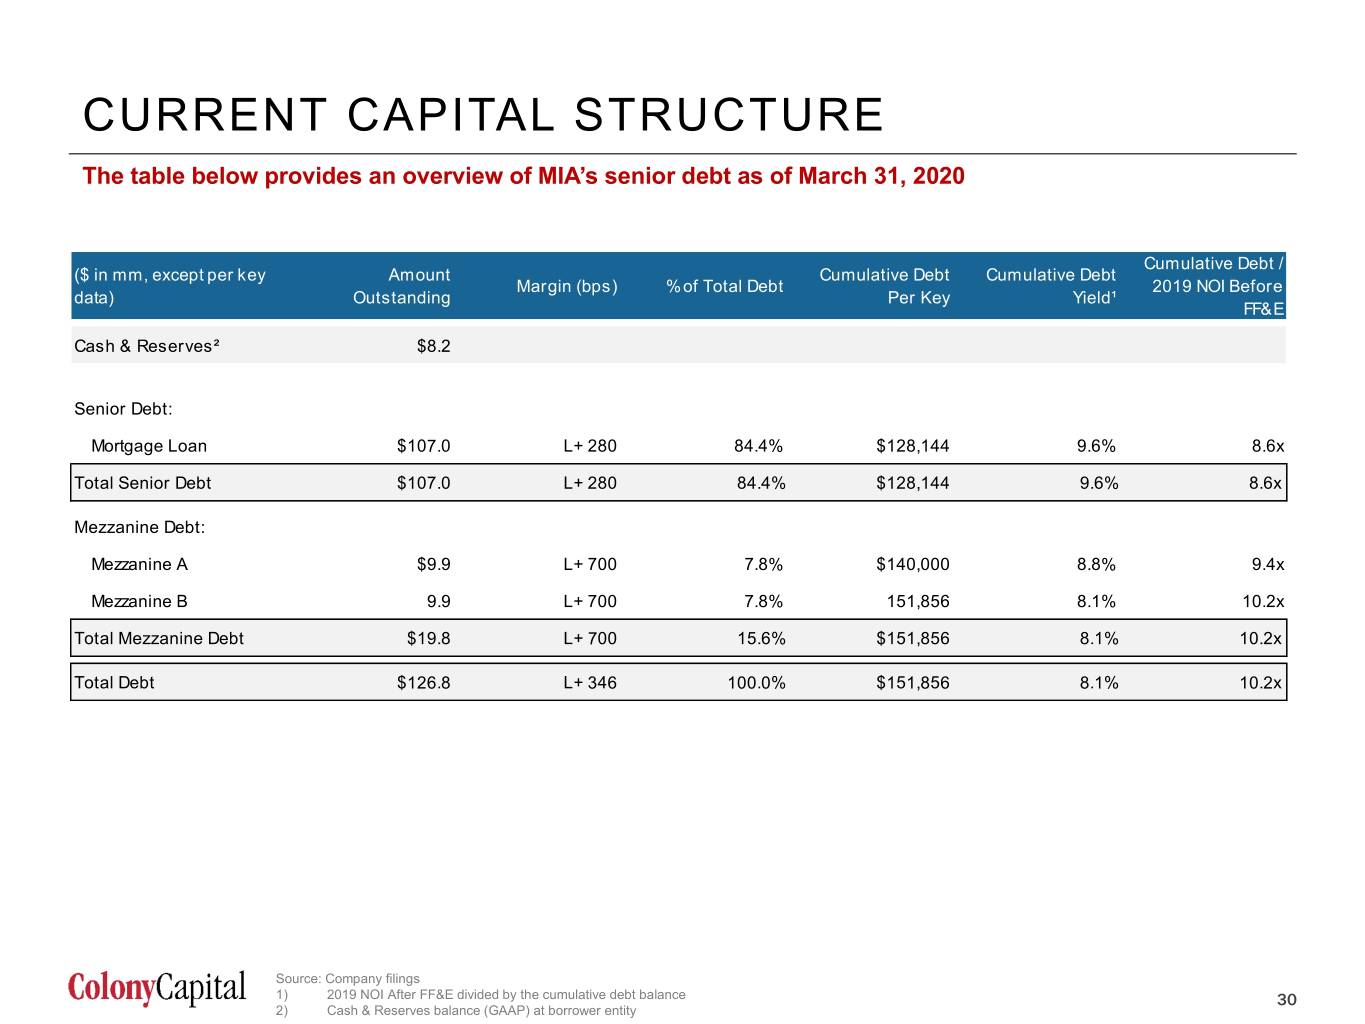
CURRENT CAPITAL STRUCTURE The table below provides an overview of MIA’s senior debt as of March 31, 2020 Cumulative Debt / ($ in mm, except per key Amount Cumulative Debt Cumulative Debt Margin (bps) % of Total Debt 2019 NOI Before data) Outstanding Per Key Yield¹ FF&E Cash & Reserves² $8.2 Senior Debt: Mortgage Loan $107.0 L+ 280 84.4% $128,144 9.6% 8.6x Total Senior Debt $107.0 L+ 280 84.4% $128,144 9.6% 8.6x Mezzanine Debt: Mezzanine A $9.9 L+ 700 7.8% $140,000 8.8% 9.4x Mezzanine B 9.9 L+ 700 7.8% 151,856 8.1% 10.2x Total Mezzanine Debt $19.8 L+ 700 15.6% $151,856 8.1% 10.2x Total Debt $126.8 L+ 346 100.0% $151,856 8.1% 10.2x Source: Company filings 1) 2019 NOI After FF&E divided by the cumulative debt balance 30 2) Cash & Reserves balance (GAAP) at borrower entity 30
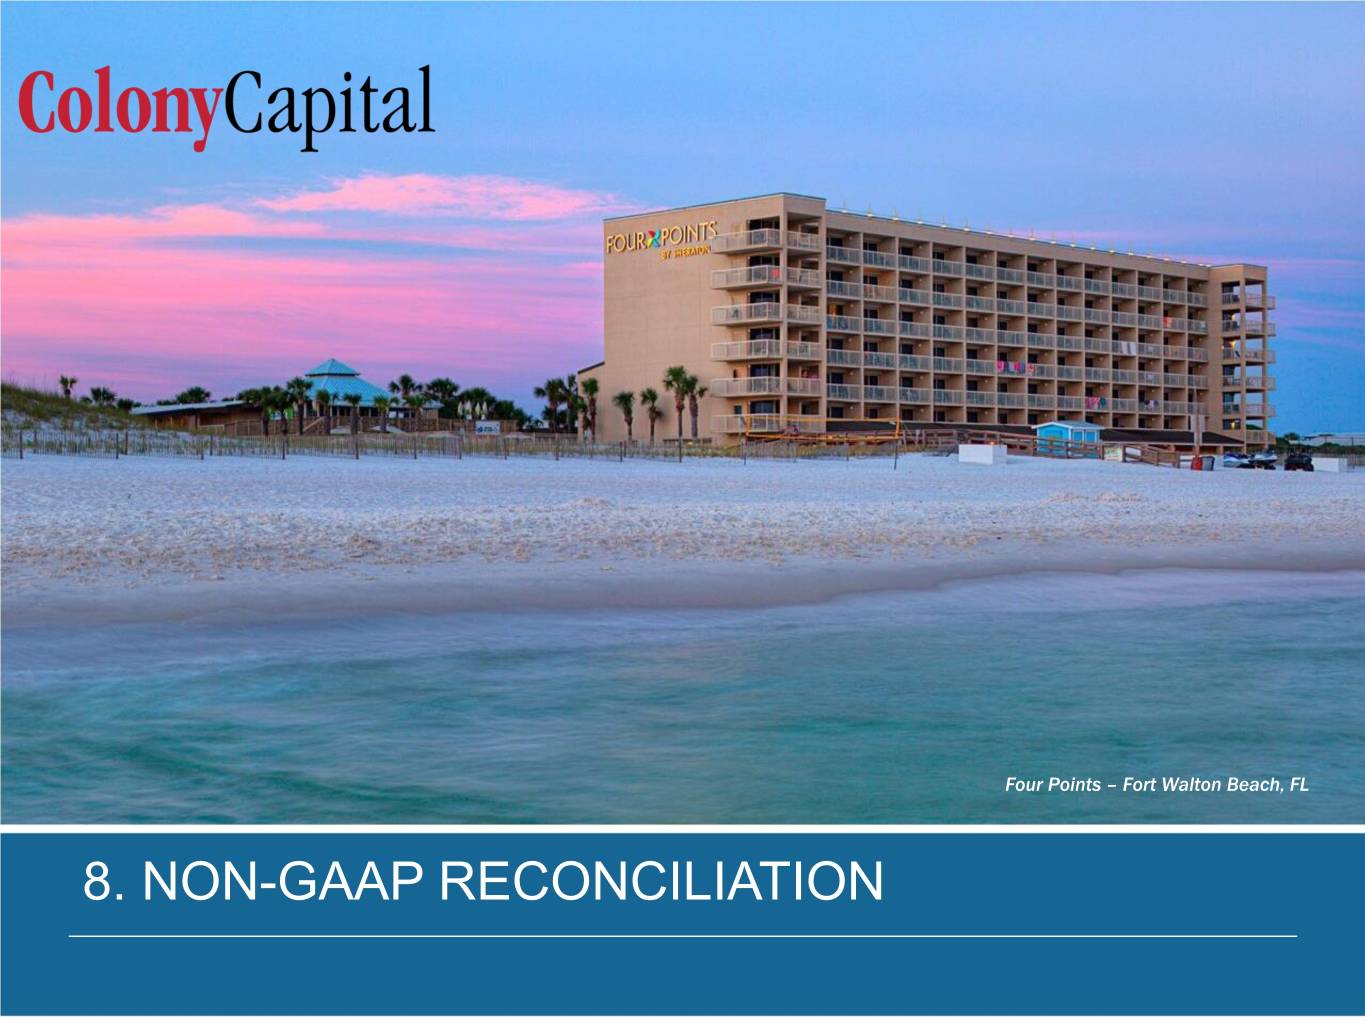
Four Points – Fort Walton Beach, FL 8. NON-GAAP RECONCILIATION 31
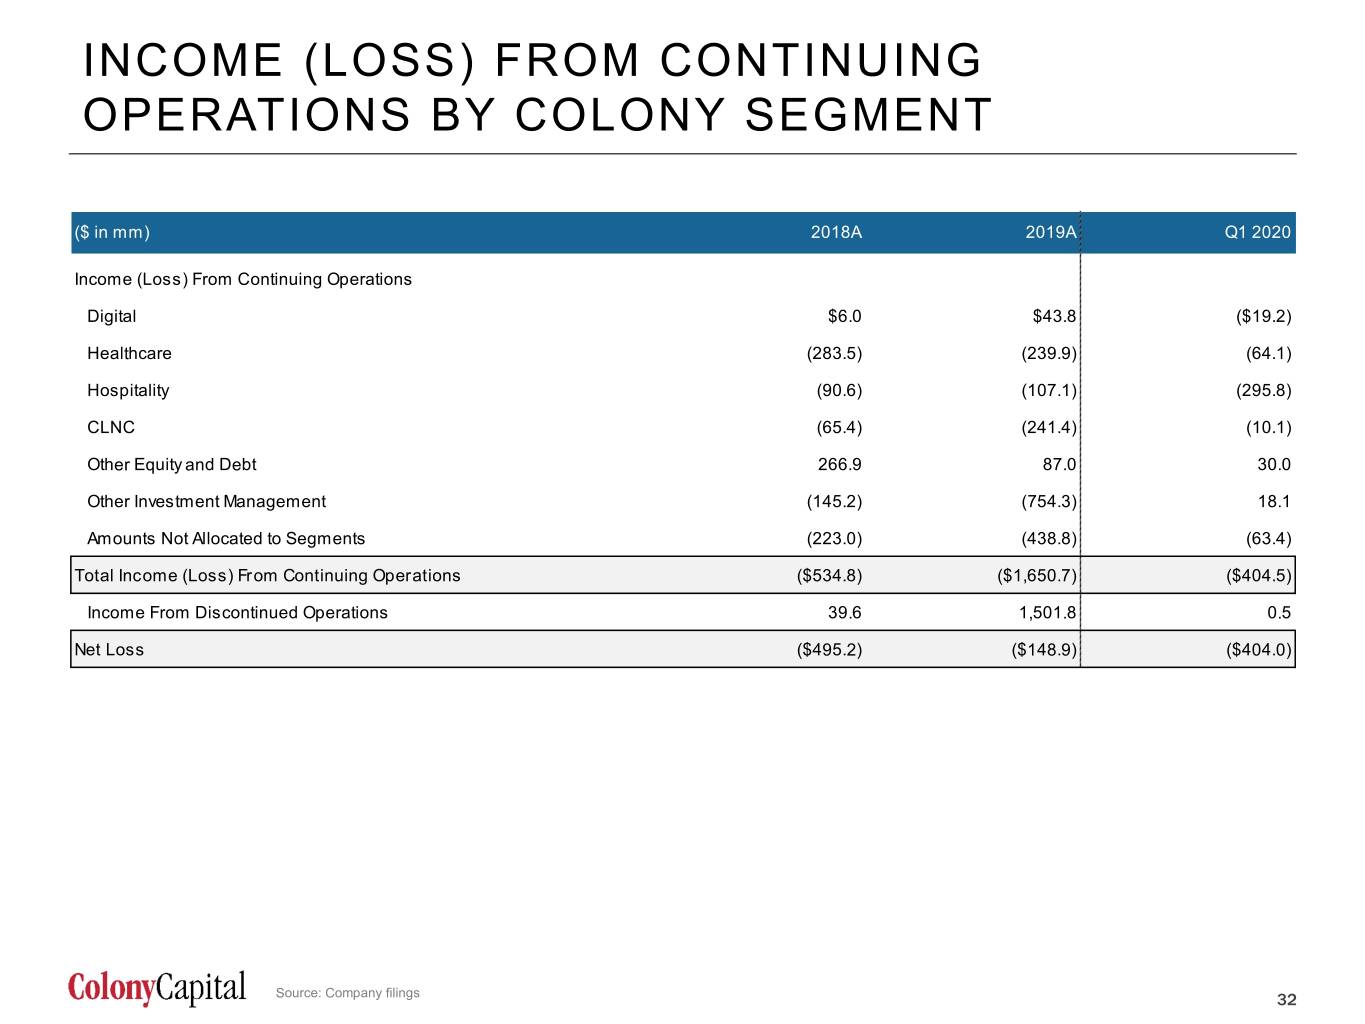
INCOME (LOSS) FROM CONTINUING OPERATIONS BY COLONY SEGMENT ($ in mm) 2018A 2019A Q1 2020 Income (Loss) From Continuing Operations Digital $6.0 $43.8 ($19.2) Healthcare (283.5) (239.9) (64.1) Hospitality (90.6) (107.1) (295.8) CLNC (65.4) (241.4) (10.1) Other Equity and Debt 266.9 87.0 30.0 Other Investment Management (145.2) (754.3) 18.1 Amounts Not Allocated to Segments (223.0) (438.8) (63.4) Total Income (Loss) From Continuing Operations ($534.8) ($1,650.7) ($404.5) Income From Discontinued Operations 39.6 1,501.8 0.5 Net Loss ($495.2) ($148.9) ($404.0) Source: Company filings 32 32
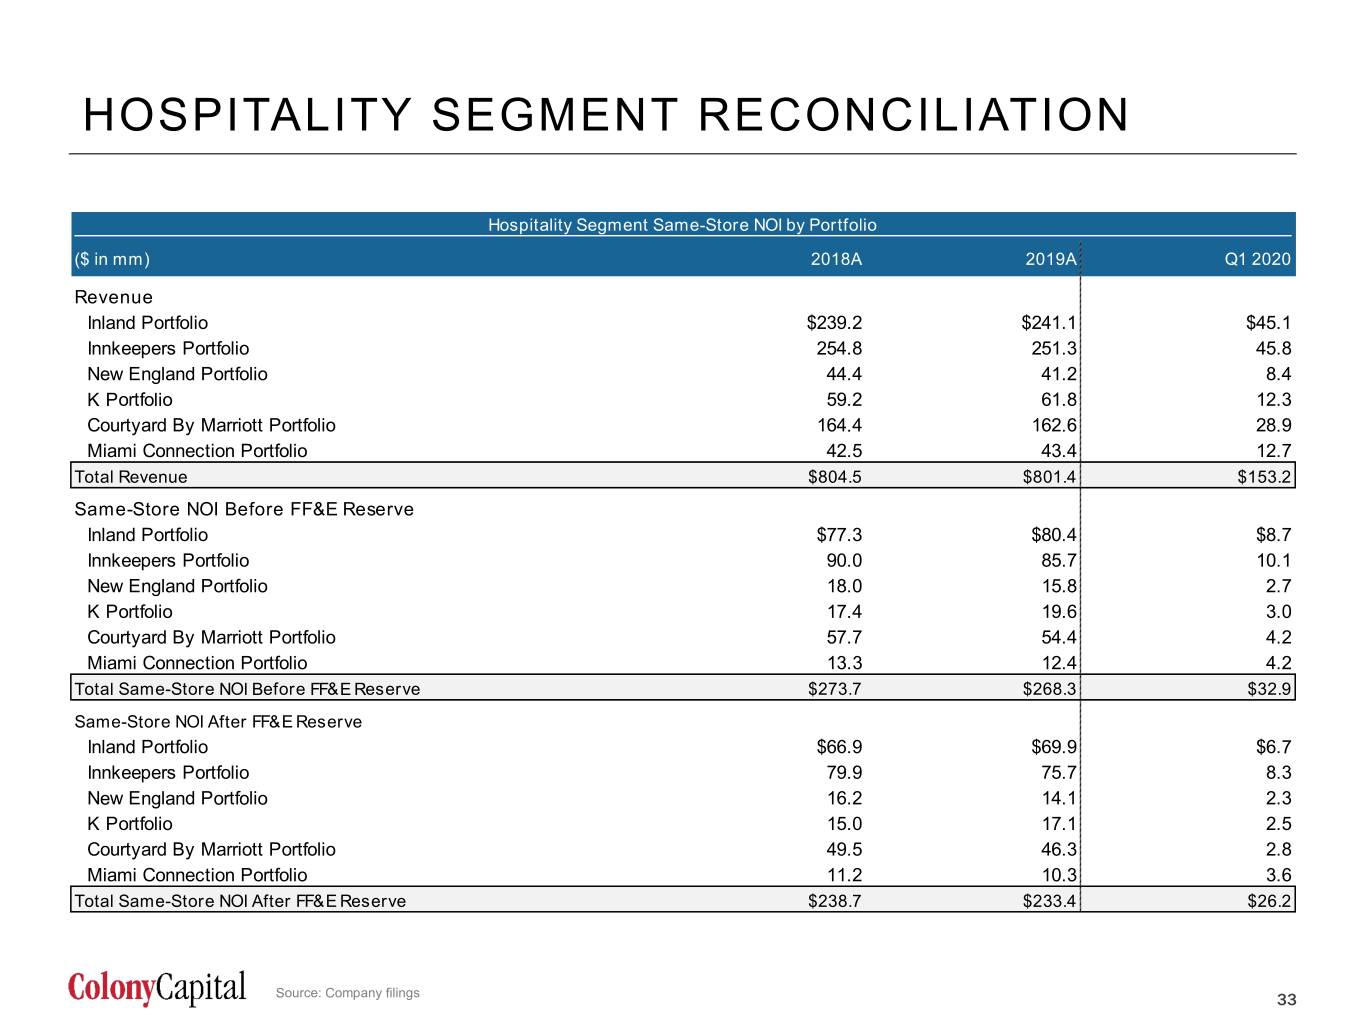
HOSPITALITY SEGMENT RECONCILIATION Hospitality Segment Same-Store NOI by Portfolio ($ in mm) 2018A 2019A Q1 2020 Revenue Inland Portfolio $239.2 $241.1 $45.1 Innkeepers Portfolio 254.8 251.3 45.8 New England Portfolio 44.4 41.2 8.4 K Portfolio 59.2 61.8 12.3 Courtyard By Marriott Portfolio 164.4 162.6 28.9 Miami Connection Portfolio 42.5 43.4 12.7 Total Revenue $804.5 $801.4 $153.2 Same-Store NOI Before FF&E Reserve Inland Portfolio $77.3 $80.4 $8.7 Innkeepers Portfolio 90.0 85.7 10.1 New England Portfolio 18.0 15.8 2.7 K Portfolio 17.4 19.6 3.0 Courtyard By Marriott Portfolio 57.7 54.4 4.2 Miami Connection Portfolio 13.3 12.4 4.2 Total Same-Store NOI Before FF&E Reserve $273.7 $268.3 $32.9 Same-Store NOI After FF&E Reserve Inland Portfolio $66.9 $69.9 $6.7 Innkeepers Portfolio 79.9 75.7 8.3 New England Portfolio 16.2 14.1 2.3 K Portfolio 15.0 17.1 2.5 Courtyard By Marriott Portfolio 49.5 46.3 2.8 Miami Connection Portfolio 11.2 10.3 3.6 Total Same-Store NOI After FF&E Reserve $238.7 $233.4 $26.2 Source: Company filings 33 33
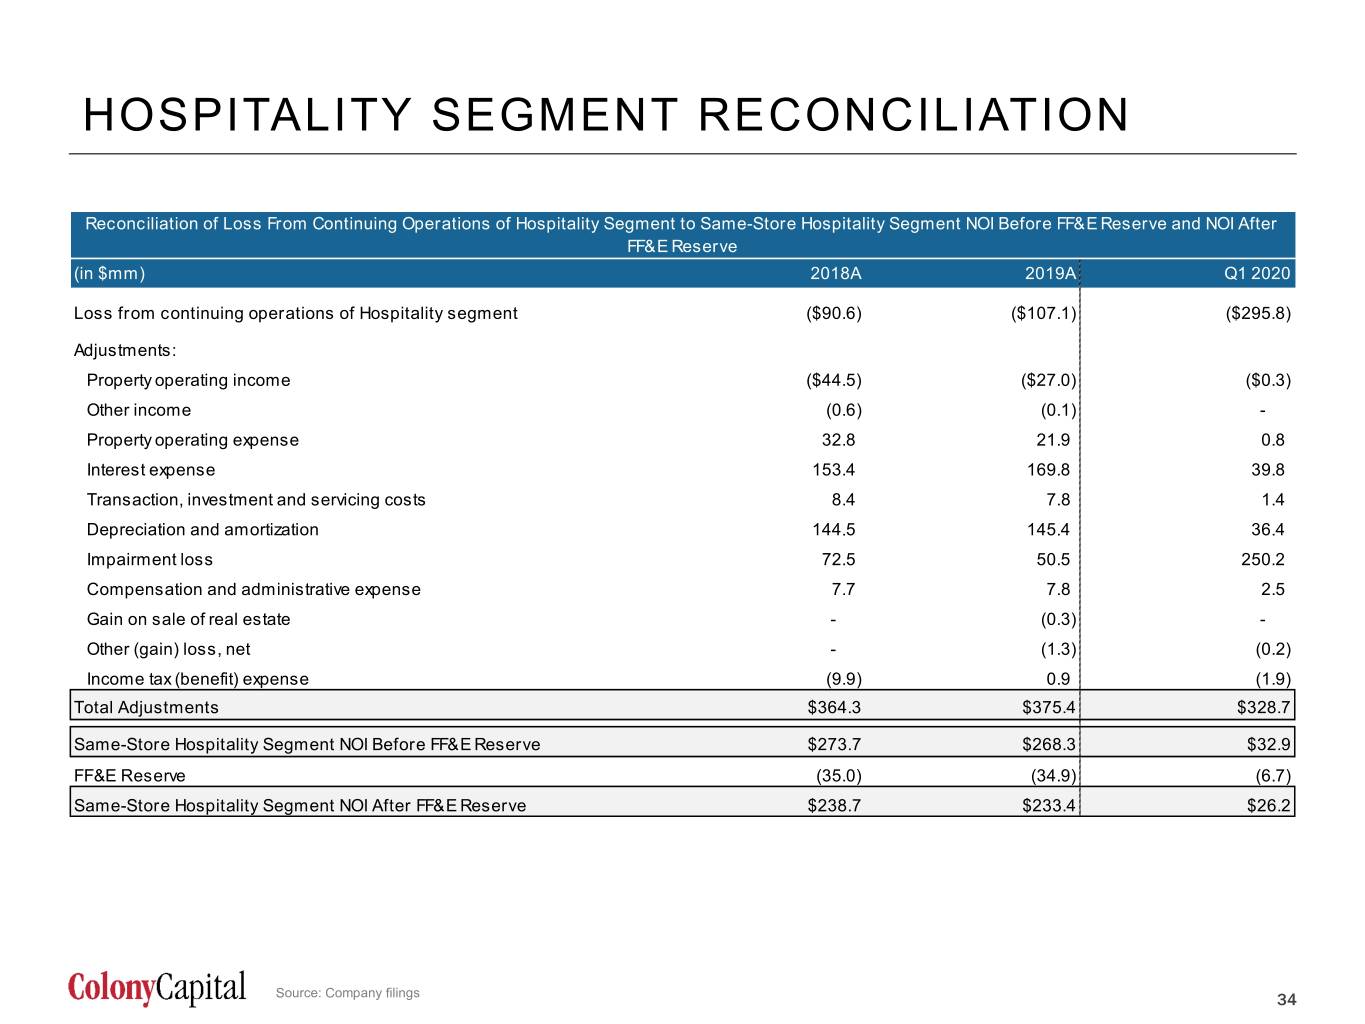
HOSPITALITY SEGMENT RECONCILIATION Reconciliation of Loss From Continuing Operations of Hospitality Segment to Same-Store Hospitality Segment NOI Before FF&E Reserve and NOI After FF&E Reserve (in $mm) 2018A 2019A Q1 2020 Loss from continuing operations of Hospitality segment ($90.6) ($107.1) ($295.8) Adjustments: Property operating income ($44.5) ($27.0) ($0.3) Other income (0.6) (0.1) - Property operating expense 32.8 21.9 0.8 Interest expense 153.4 169.8 39.8 Transaction, investment and servicing costs 8.4 7.8 1.4 Depreciation and amortization 144.5 145.4 36.4 Impairment loss 72.5 50.5 250.2 Compensation and administrative expense 7.7 7.8 2.5 Gain on sale of real estate - (0.3) - Other (gain) loss, net - (1.3) (0.2) Income tax (benefit) expense (9.9) 0.9 (1.9) Total Adjustments $364.3 $375.4 $328.7 Same-Store Hospitality Segment NOI Before FF&E Reserve $273.7 $268.3 $32.9 FF&E Reserve (35.0) (34.9) (6.7) Same-Store Hospitality Segment NOI After FF&E Reserve $238.7 $233.4 $26.2 Source: Company filings 34 34
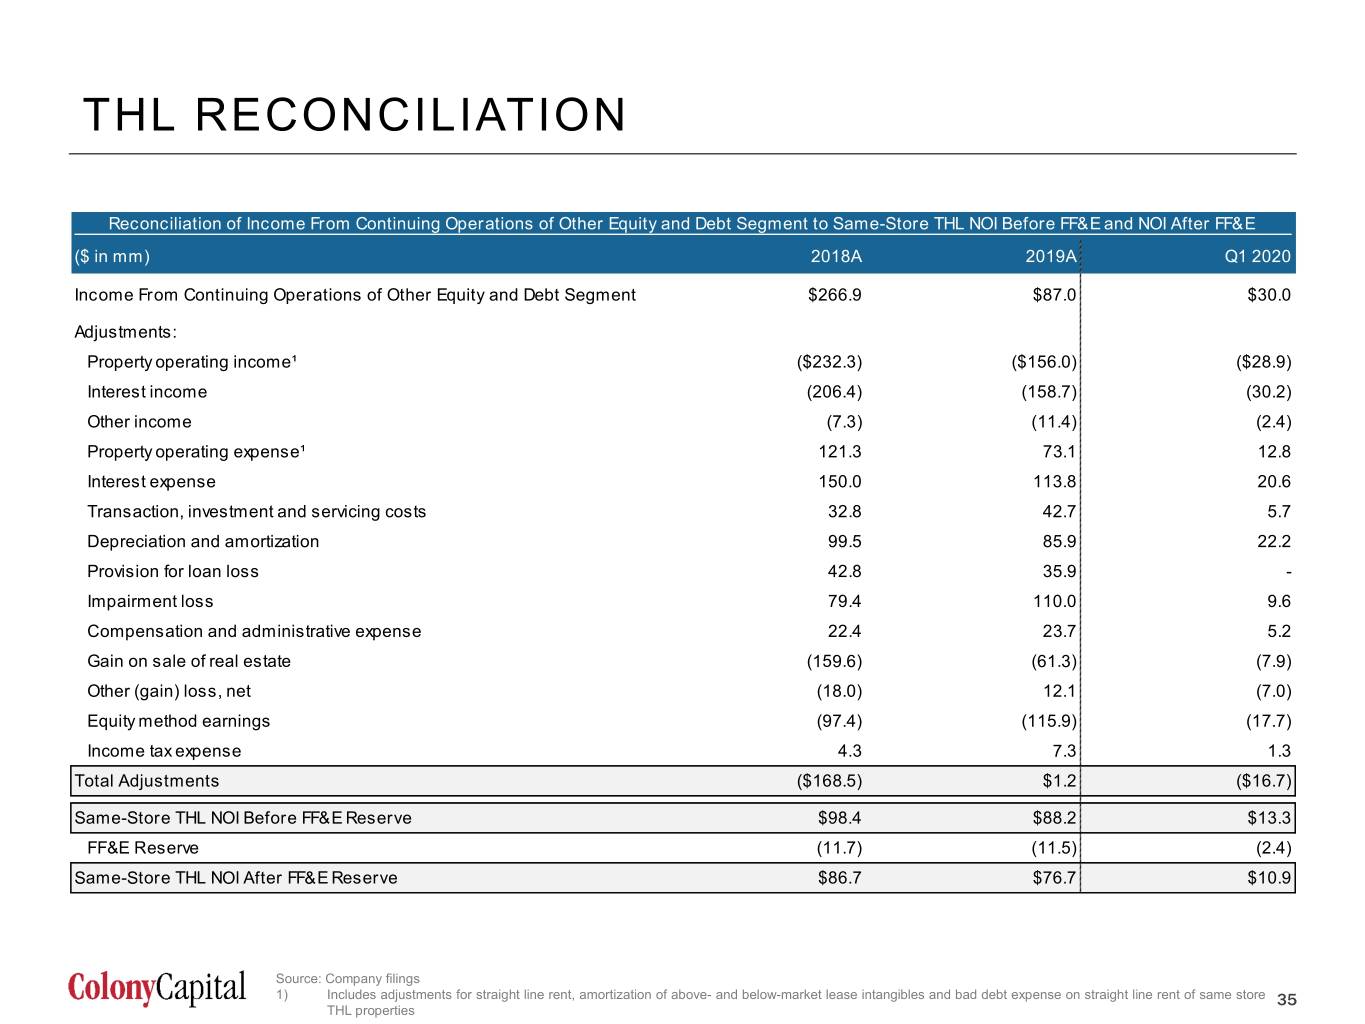
THL RECONCILIATION Reconciliation of Income From Continuing Operations of Other Equity and Debt Segment to Same-Store THL NOI Before FF&E and NOI After FF&E ($ in mm) 2018A 2019A Q1 2020 Income From Continuing Operations of Other Equity and Debt Segment $266.9 $87.0 $30.0 Adjustments: Property operating income¹ ($232.3) ($156.0) ($28.9) Interest income (206.4) (158.7) (30.2) Other income (7.3) (11.4) (2.4) Property operating expense¹ 121.3 73.1 12.8 Interest expense 150.0 113.8 20.6 Transaction, investment and servicing costs 32.8 42.7 5.7 Depreciation and amortization 99.5 85.9 22.2 Provision for loan loss 42.8 35.9 - Impairment loss 79.4 110.0 9.6 Compensation and administrative expense 22.4 23.7 5.2 Gain on sale of real estate (159.6) (61.3) (7.9) Other (gain) loss, net (18.0) 12.1 (7.0) Equity method earnings (97.4) (115.9) (17.7) Income tax expense 4.3 7.3 1.3 Total Adjustments ($168.5) $1.2 ($16.7) Same-Store THL NOI Before FF&E Reserve $98.4 $88.2 $13.3 FF&E Reserve (11.7) (11.5) (2.4) Same-Store THL NOI After FF&E Reserve $86.7 $76.7 $10.9 Source: Company filings 1) Includes adjustments for straight line rent, amortization of above- and below-market lease intangibles and bad debt expense on straight line rent of same store 35 THL properties 35
