Attached files
| file | filename |
|---|---|
| 8-K - 8-K - NEW YORK MORTGAGE TRUST INC | a8-kq12020earningsrele.htm |
| EX-99.1 - EXHIBIT 99.1 - NEW YORK MORTGAGE TRUST INC | exhibit991q12020.htm |
New York Mortgage Trust 2020 First Quarter Financial Summary
Forward Looking Statements This presentation contains forward-looking statements within the meaning of the safe harbor provisions of the Private Securities Litigation Reform Act of 1995. Forward- looking statements are based on our beliefs, assumptions and expectations of our future performance, taking into account all information currently available to us. These beliefs, assumptions and expectations are subject to risks and uncertainties and can change as a result of many possible events or factors, not all of which are known to us. If a change occurs, our business, financial condition, liquidity and results of operations may vary materially from those expressed or implied in our forward-looking statements. The following factors are examples of those that could cause actual results to vary from our forward-looking statements: changes in our business and investment strategy; changes in interest rates and the fair market value of our assets, including negative changes resulting in margin calls relating to the financing of our assets; changes in credit spreads; changes in the long-term credit ratings of the U.S., Fannie Mae, Freddie Mac, and Ginnie Mae; general volatility of the markets in which we invest; changes in prepayment rates on the loans we own or that underlie our investment securities; increased rates of default or delinquencies and/or decreased recovery rates on our assets; our ability to identify and acquire our targeted assets, including assets in our investment pipeline; changes in our relationships with our financing counterparties and our ability to borrow to finance our assets and the terms thereof; our ability to predict and control costs; changes in governmental laws, regulations or policies affecting our business, including in response to COVID-19; our ability to make distributions to our stockholders in the future; our ability to maintain our qualification as a REIT for federal tax purposes; our ability to maintain our exemption from registration under the Investment Company Act of 1940, as amended; risks associated with investing in real estate assets, including changes in business conditions and the general economy, the availability of investment opportunities and the conditions in the market for Agency RMBS, non-Agency RMBS, ABS and CMBS securities, residential mortgage loans, structured multi-family investments and other mortgage-, residential housing- and credit-related assets, including changes resulting from the ongoing spread and economic effects of COVID-19; and the impact of COVID-19 on us, our operations and our personnel. These and other risks, uncertainties and factors, including the risk factors described in our most recent Annual Report on Form 10-K, as updated and supplemented from time to time, and our subsequent Quarterly Reports on Form 10-Q and other information that we file from time to time with the U.S. Securities and Exchange Commission (“SEC”) under the Securities Exchange Act of 1934, as amended (the “Exchange Act”), could cause our actual results to differ materially from those projected in any forward-looking statements we make. All forward-looking statements speak only as of the date on which they are made. New risks and uncertainties arise over time and it is not possible to predict those events or how they may affect us. Except as required by law, we are not obligated to, and do not intend to, update or revise any forward-looking statements, whether as a result of new information, future events or otherwise. This presentation may not contain all of the information that is important to you. As a result, the information in this presentation should be read together with the information included in our most recent Annual Report on Form 10-K, as updated and supplemented from time to time, and our subsequent Quarterly Reports on Form 10-Q and other information that we file under the Exchange Act. References to “the Company,” “NYMT,” “we,” “us,” or “our” refer to New York Mortgage Trust, Inc., together with its consolidated subsidiaries, unless we specifically state otherwise or the context indicates otherwise. See glossary of defined terms and detailed end notes for additional important disclosures included at the end of this presentation. First quarter 2020 Financial Tables can be viewed in the Company’s press release dated May 21, 2020 posted on the Company’s website at http://www.nymtrust.com under the “Events and Presentations” section. 2 See Glossary and End Notes in the Appendix.
To Our Stockholders NYMT’s Resilience Through COVID-19 As we announce our results for the first quarter of 2020, in a time of turmoil and uncertainty, we wanted to provide an update to our valued investors and key stakeholders of the Company to reaffirm our confidence in the strength and resilience of our business. NYMT has a history of successfully navigating changing economic conditions, including the global financial crisis in 2008. NYMT’s capital foundation and strong relationships with financing partners, along with our disciplined approach to risk management, have played crucial roles in our ability to successfully navigate through markets, much as we face today. While the operating environment has been extremely challenging and dynamic in nature, we believe NYMT will benefit from its durable balance sheet, low leverage, and disciplined approach to liquidity, which have been further enhanced since the end of March. The Company’s priority continues to center around the health and well being of our staff, partners and community. We believe our extensive business continuity planning and infrastructure have positioned us well for the reality of working remotely. To date, all of our internal operations have continued to function efficiently, allowing us to remain focused on sustainable, long-term value creation. Thank you for your continued trust and confidence in NYMT throughout these unprecedented times. Our business strategy and strategic planning will continue to adapt to the evolving conditions of the market. We have an unwavering commitment to delivering stockholder value through the active management of our diverse investment portfolio. To that end, we look forward to sharing our 2020 First Quarter Results. 3
Table of Contents Company Overview Business Update Financial Summary Strategy Updates Quarterly Comparative Financial Information Appendix Glossary End Notes Capital Allocation Reconciliation of Net Interest Income

Company Overview
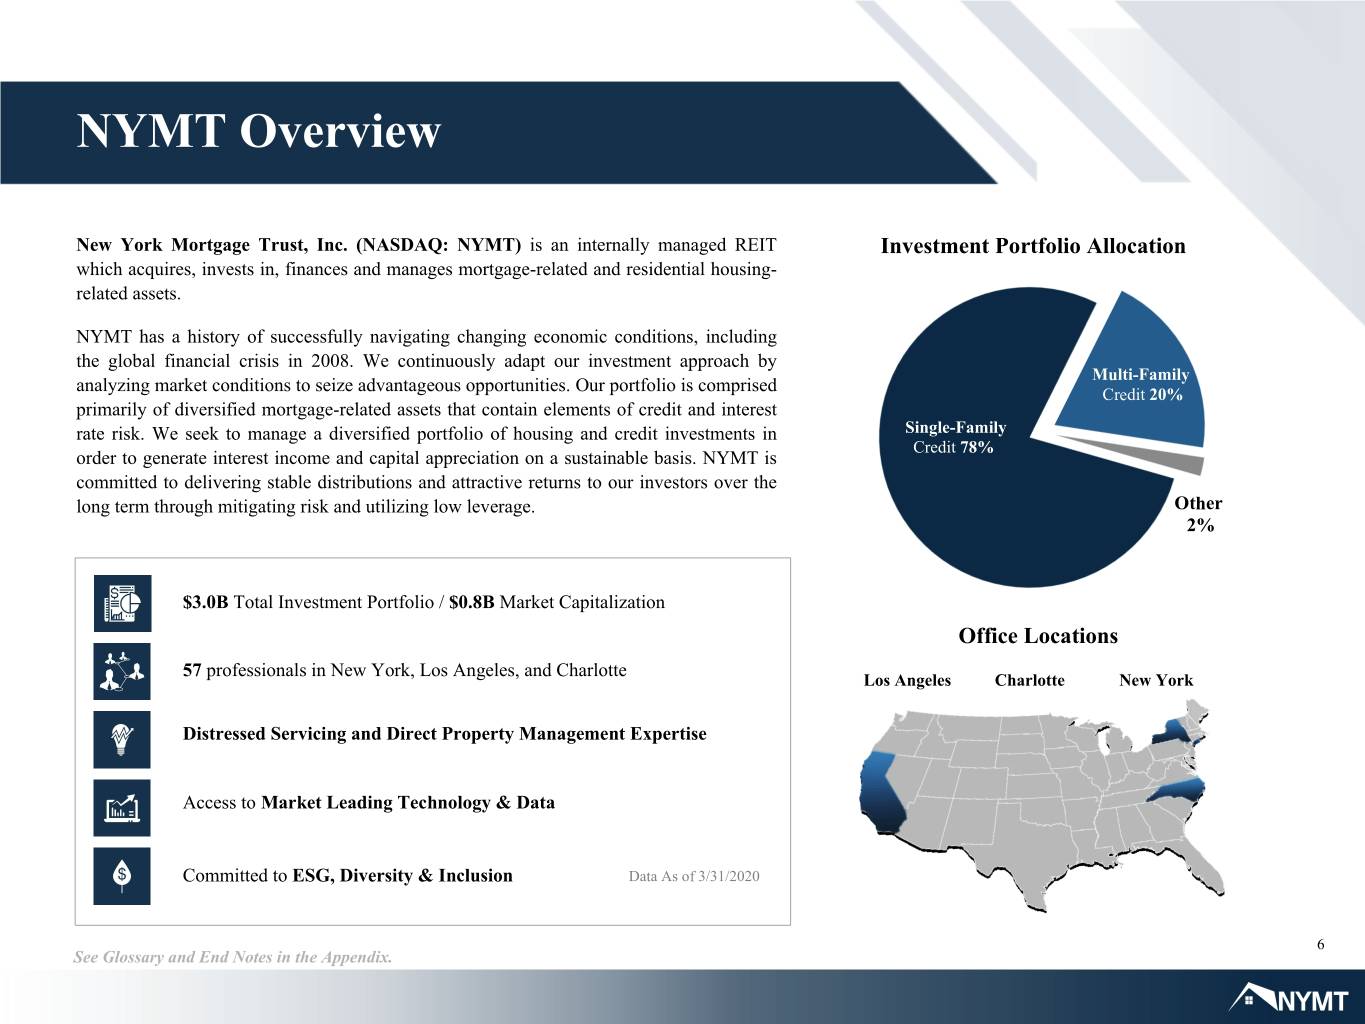
NYMT Overview New York Mortgage Trust, Inc. (NASDAQ: NYMT) is an internally managed REIT Investment Portfolio Allocation which acquires, invests in, finances and manages mortgage-related and residential housing- related assets. NYMT has a history of successfully navigating changing economic conditions, including the global financial crisis in 2008. We continuously adapt our investment approach by Multi-Family analyzing market conditions to seize advantageous opportunities. Our portfolio is comprised Credit 20% primarily of diversified mortgage-related assets that contain elements of credit and interest rate risk. We seek to manage a diversified portfolio of housing and credit investments in Single-Family Credit 78% order to generate interest income and capital appreciation on a sustainable basis. NYMT is committed to delivering stable distributions and attractive returns to our investors over the long term through mitigating risk and utilizing low leverage. Other 2% $3.0B Total Investment Portfolio / $0.8B Market Capitalization Office Locations 57 professionals in New York, Los Angeles, and Charlotte Los Angeles Charlotte New York Distressed Servicing and Direct Property Management Expertise Access to Market Leading Technology & Data Committed to ESG, Diversity & Inclusion Data As of 3/31/2020 6 See Glossary and End Notes in the Appendix.

Business Updates
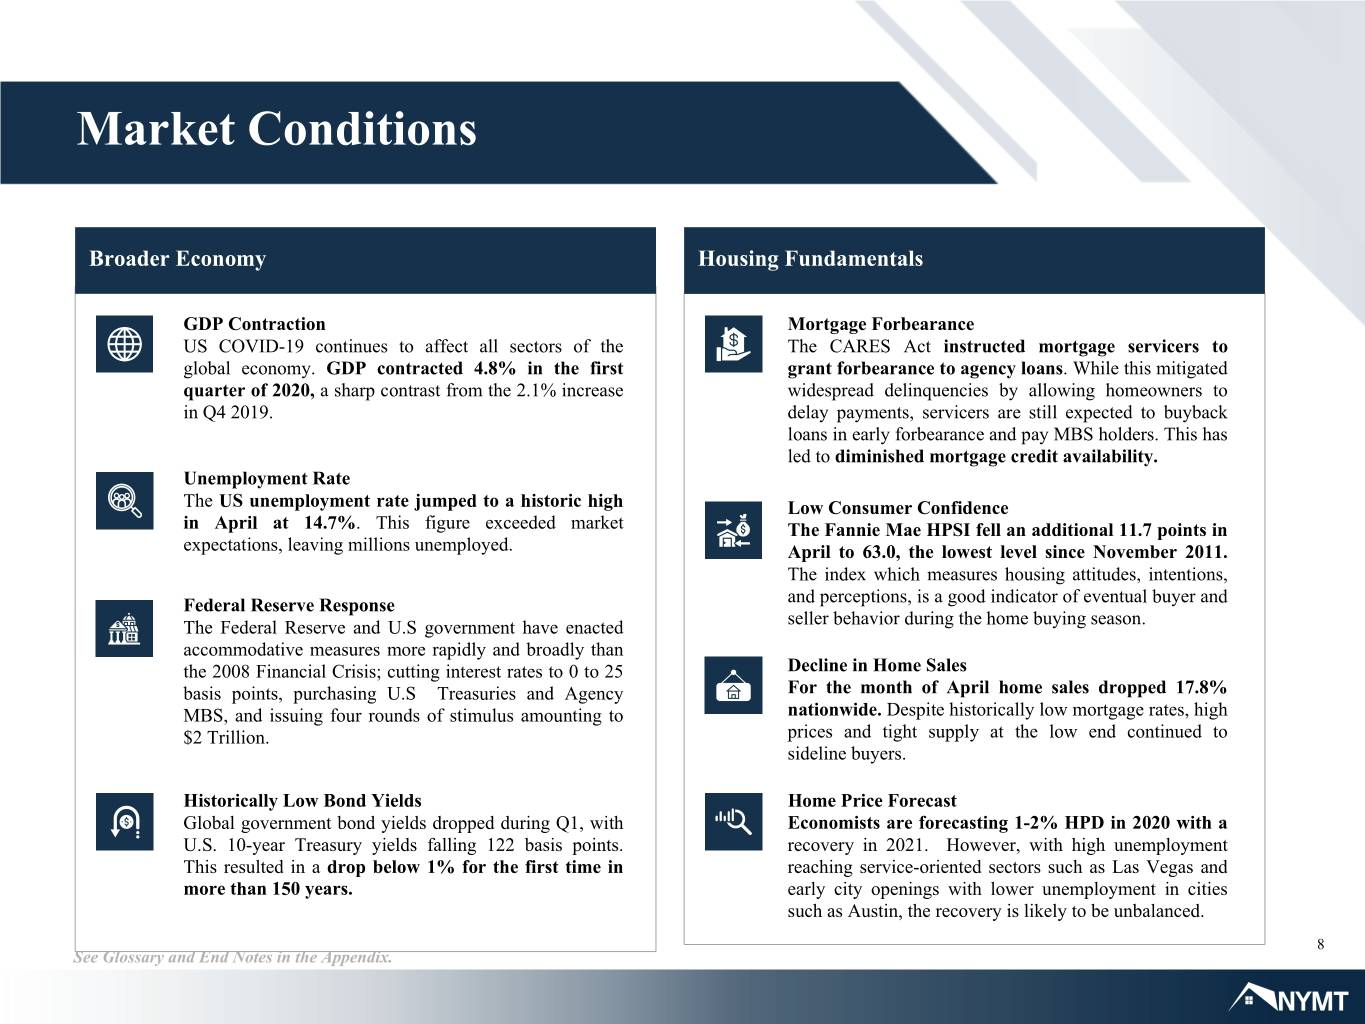
Market Conditions Broader Economy Housing Fundamentals GDP Contraction Mortgage Forbearance US COVID-19 continues to affect all sectors of the The CARES Act instructed mortgage servicers to global economy. GDP contracted 4.8% in the first grant forbearance to agency loans. While this mitigated quarter of 2020, a sharp contrast from the 2.1% increase widespread delinquencies by allowing homeowners to in Q4 2019. delay payments, servicers are still expected to buyback loans in early forbearance and pay MBS holders. This has led to diminished mortgage credit availability. Unemployment Rate The US unemployment rate jumped to a historic high Low Consumer Confidence in April at 14.7%. This figure exceeded market The Fannie Mae HPSI fell an additional 11.7 points in expectations, leaving millions unemployed. April to 63.0, the lowest level since November 2011. The index which measures housing attitudes, intentions, Federal Reserve Response and perceptions, is a good indicator of eventual buyer and The Federal Reserve and U.S government have enacted seller behavior during the home buying season. accommodative measures more rapidly and broadly than the 2008 Financial Crisis; cutting interest rates to 0 to 25 Decline in Home Sales basis points, purchasing U.S Treasuries and Agency For the month of April home sales dropped 17.8% MBS, and issuing four rounds of stimulus amounting to nationwide. Despite historically low mortgage rates, high $2 Trillion. prices and tight supply at the low end continued to sideline buyers. Historically Low Bond Yields Home Price Forecast Global government bond yields dropped during Q1, with Economists are forecasting 1-2% HPD in 2020 with a U.S. 10-year Treasury yields falling 122 basis points. recovery in 2021. However, with high unemployment This resulted in a drop below 1% for the first time in reaching service-oriented sectors such as Las Vegas and more than 150 years. early city openings with lower unemployment in cities such as Austin, the recovery is likely to be unbalanced. 8 See Glossary and End Notes in the Appendix.
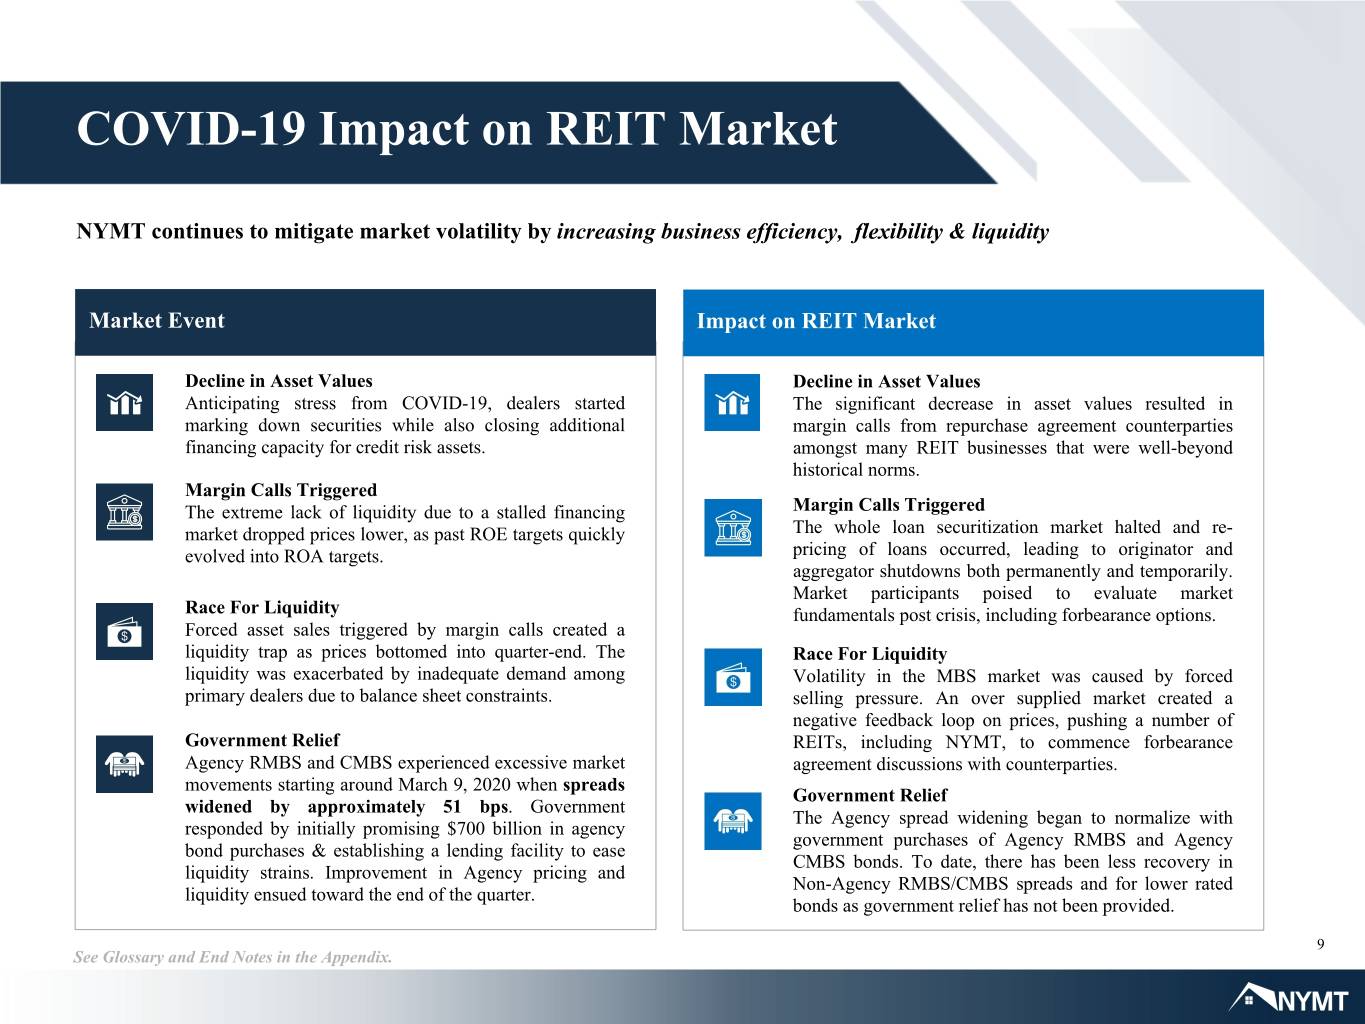
COVID-19 Impact on REIT Market NYMT continues to mitigate market volatility by increasing business efficiency, flexibility & liquidity Market Event Impact on REIT Market Decline in Asset Values Decline in Asset Values Anticipating stress from COVID-19, dealers started The significant decrease in asset values resulted in marking down securities while also closing additional margin calls from repurchase agreement counterparties financing capacity for credit risk assets. amongst many REIT businesses that were well-beyond historical norms. Margin Calls Triggered The extreme lack of liquidity due to a stalled financing Margin Calls Triggered market dropped prices lower, as past ROE targets quickly The whole loan securitization market halted and re- evolved into ROA targets. pricing of loans occurred, leading to originator and aggregator shutdowns both permanently and temporarily. Market participants poised to evaluate market Race For Liquidity fundamentals post crisis, including forbearance options. Forced asset sales triggered by margin calls created a liquidity trap as prices bottomed into quarter-end. The Race For Liquidity liquidity was exacerbated by inadequate demand among Volatility in the MBS market was caused by forced primary dealers due to balance sheet constraints. selling pressure. An over supplied market created a negative feedback loop on prices, pushing a number of Government Relief REITs, including NYMT, to commence forbearance Agency RMBS and CMBS experienced excessive market agreement discussions with counterparties. movements starting around March 9, 2020 when spreads Government Relief widened by approximately 51 bps. Government The Agency spread widening began to normalize with responded by initially promising $700 billion in agency government purchases of Agency RMBS and Agency bond purchases & establishing a lending facility to ease CMBS bonds. To date, there has been less recovery in liquidity strains. Improvement in Agency pricing and Non-Agency RMBS/CMBS spreads and for lower rated liquidity ensued toward the end of the quarter. bonds as government relief has not been provided. 9 See Glossary and End Notes in the Appendix.
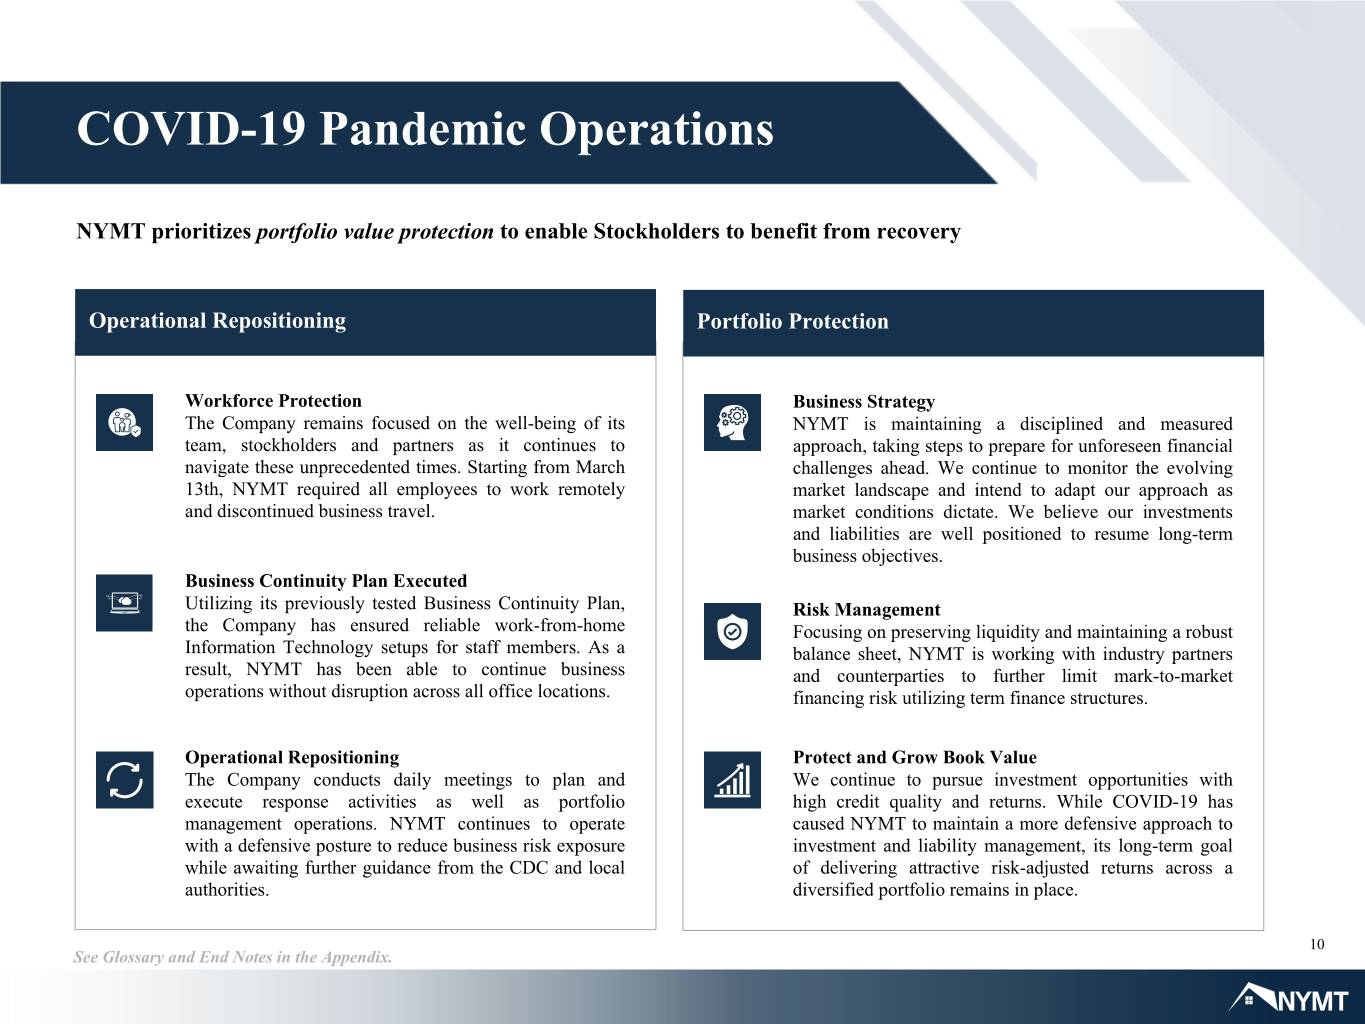
COVID-19 Pandemic Operations NYMT prioritizes portfolio value protection to enable Stockholders to benefit from recovery Operational Repositioning Portfolio Protection Workforce Protection Business Strategy The Company remains focused on the well-being of its NYMT is maintaining a disciplined and measured team, stockholders and partners as it continues to approach, taking steps to prepare for unforeseen financial navigate these unprecedented times. Starting from March challenges ahead. We continue to monitor the evolving 13th, NYMT required all employees to work remotely market landscape and intend to adapt our approach as and discontinued business travel. market conditions dictate. We believe our investments and liabilities are well positioned to resume long-term business objectives. Business Continuity Plan Executed Utilizing its previously tested Business Continuity Plan, Risk Management the Company has ensured reliable work-from-home Focusing on preserving liquidity and maintaining a robust Information Technology setups for staff members. As a balance sheet, NYMT is working with industry partners result, NYMT has been able to continue business and counterparties to further limit mark-to-market operations without disruption across all office locations. financing risk utilizing term finance structures. Operational Repositioning Protect and Grow Book Value The Company conducts daily meetings to plan and We continue to pursue investment opportunities with execute response activities as well as portfolio high credit quality and returns. While COVID-19 has management operations. NYMT continues to operate caused NYMT to maintain a more defensive approach to with a defensive posture to reduce business risk exposure investment and liability management, its long-term goal while awaiting further guidance from the CDC and local of delivering attractive risk-adjusted returns across a authorities. diversified portfolio remains in place. 10 See Glossary and End Notes in the Appendix.
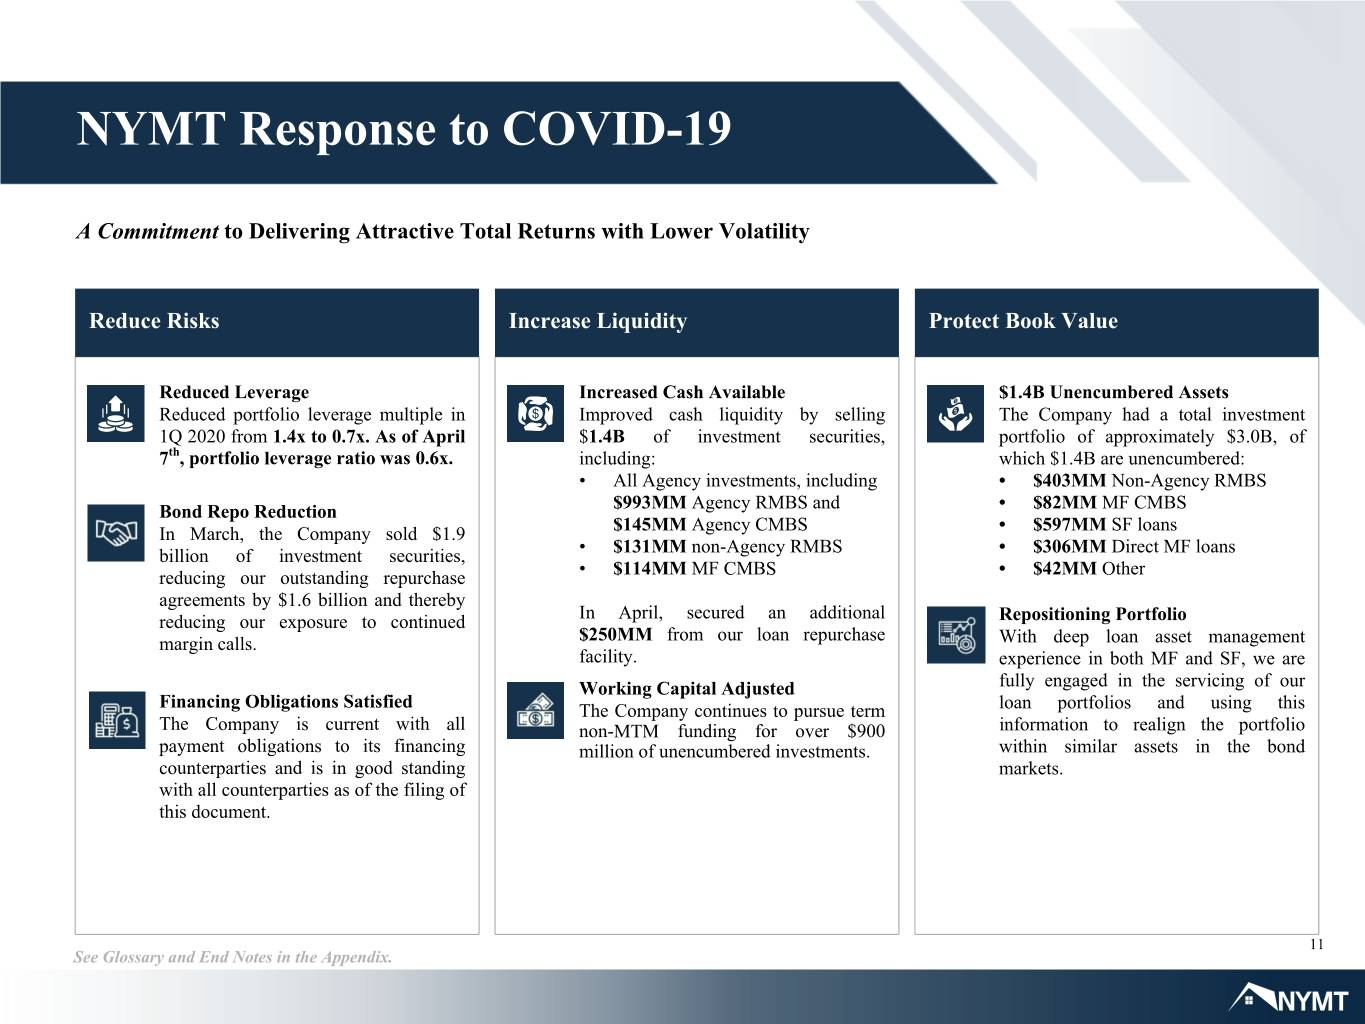
NYMT Response to COVID-19 A Commitment to Delivering Attractive Total Returns with Lower Volatility Reduce Risks Increase Liquidity Protect Book Value Reduced Leverage Increased Cash Available $1.4B Unencumbered Assets Reduced portfolio leverage multiple in Improved cash liquidity by selling The Company had a total investment 1Q 2020 from 1.4x to 0.7x. As of April $1.4B of investment securities, portfolio of approximately $3.0B, of 7th, portfolio leverage ratio was 0.6x. including: which $1.4B are unencumbered: • All Agency investments, including • $403MM Non-Agency RMBS Bond Repo Reduction $993MM Agency RMBS and • $82MM MF CMBS $145MM Agency CMBS • $597MM SF loans In March, the Company sold $1.9 • $131MM non-Agency RMBS • $306MM Direct MF loans billion of investment securities, • $114MM MF CMBS • $42MM Other reducing our outstanding repurchase agreements by $1.6 billion and thereby In April, secured an additional reducing our exposure to continued Repositioning Portfolio $250MM from our loan repurchase margin calls. With deep loan asset management facility. experience in both MF and SF, we are Working Capital Adjusted fully engaged in the servicing of our Financing Obligations Satisfied The Company continues to pursue term loan portfolios and using this The Company is current with all non-MTM funding for over $900 information to realign the portfolio payment obligations to its financing million of unencumbered investments. within similar assets in the bond counterparties and is in good standing markets. with all counterparties as of the filing of this document. 11 See Glossary and End Notes in the Appendix.
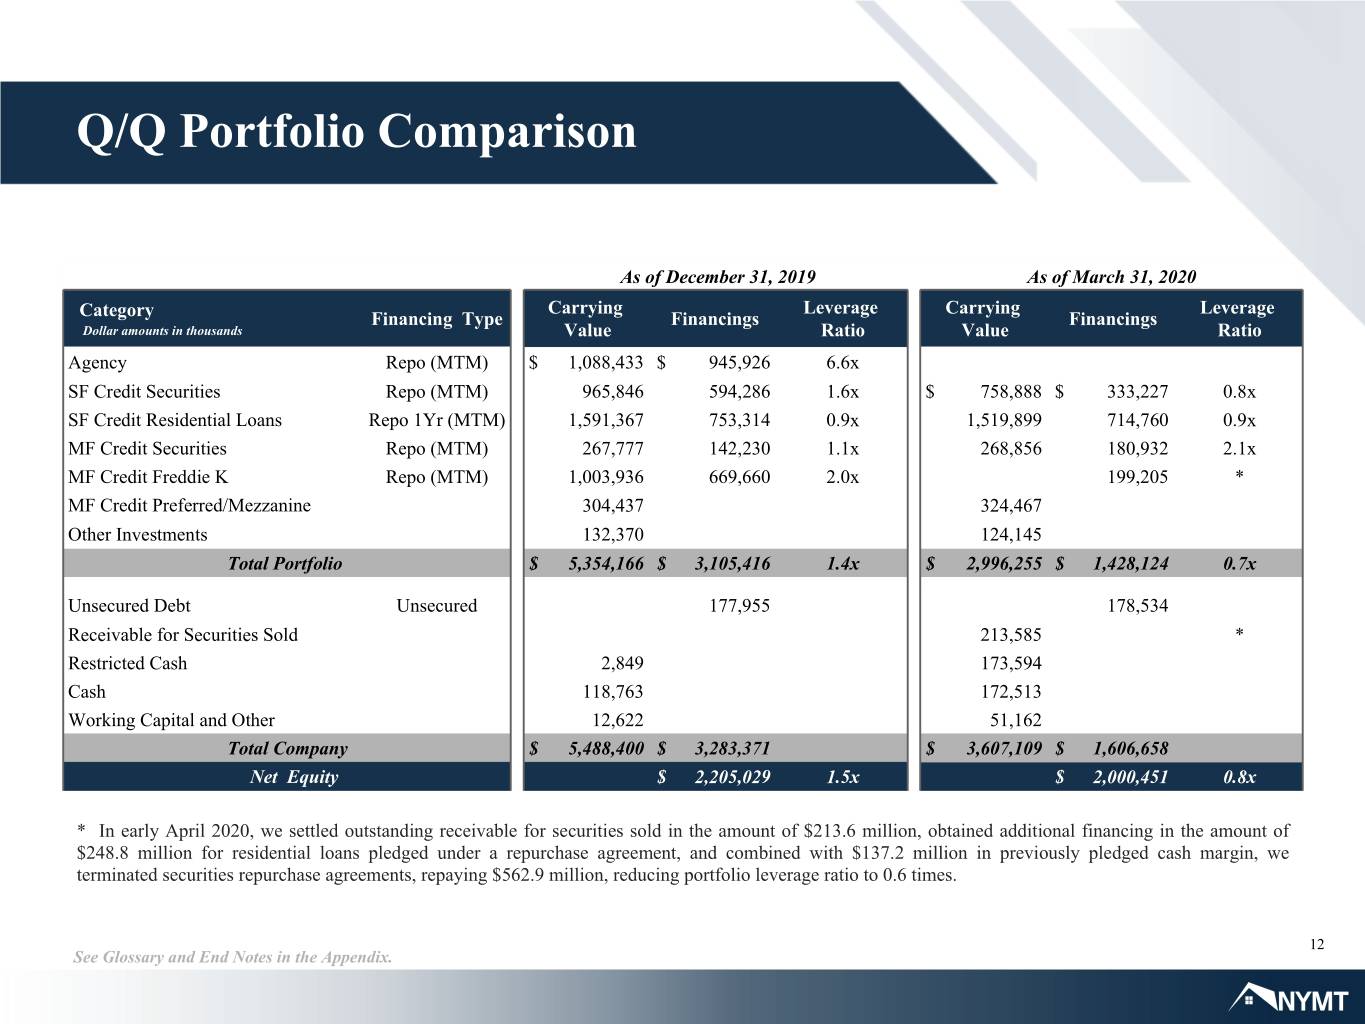
Q/Q Portfolio Comparison As of December 31, 2019 As of March 31, 2020 Carrying Leverage Carrying Leverage Category Financing Type Financings Financings Dollar amounts in thousands Value Ratio Value Ratio Agency Repo (MTM) $ 1,088,433 $ 945,926 6.6x SF Credit Securities Repo (MTM) 965,846 594,286 1.6x $ 758,888 $ 333,227 0.8x SF Credit Residential Loans Repo 1Yr (MTM) 1,591,367 753,314 0.9x 1,519,899 714,760 0.9x MF Credit Securities Repo (MTM) 267,777 142,230 1.1x 268,856 180,932 2.1x MF Credit Freddie K Repo (MTM) 1,003,936 669,660 2.0x 199,205 * MF Credit Preferred/Mezzanine 304,437 324,467 Other Investments 132,370 124,145 Total Portfolio $ 5,354,166 $ 3,105,416 1.4x $ 2,996,255 $ 1,428,124 0.7x Unsecured Debt Unsecured 177,955 178,534 Receivable for Securities Sold 213,585 * Restricted Cash 2,849 173,594 Cash 118,763 172,513 Working Capital and Other 12,622 51,162 Total Company $ 5,488,400 $ 3,283,371 $ 3,607,109 $ 1,606,658 Net Equity $ 2,205,029 1.5x $ 2,000,451 0.8x * In early April 2020, we settled outstanding receivable for securities sold in the amount of $213.6 million, obtained additional financing in the amount of $248.8 million for residential loans pledged under a repurchase agreement, and combined with $137.2 million in previously pledged cash margin, we terminated securities repurchase agreements, repaying $562.9 million, reducing portfolio leverage ratio to 0.6 times. 12 See Glossary and End Notes in the Appendix.
Financial Summary First Quarter 2020

First Quarter Financial Snapshot Loss Per Share Dividend Per Share Net Interest Margin Basic Comprehensive Q1 Dividend $(1.71) $(2.11) Suspended Earnings & Book Value 2.90% 2.92% Price to Book Economic Return on Book Value 2.40% 2.16% 2.40% Market Price Book Value Price/Book Quarter End $1.55 $3.89 0.40 (32.7%) 1Q 2019 2Q 2019 3Q 2019 4Q 2019 1Q 2020 Total Portfolio Size Allocation Yield on Avg. Interest Earnings Assets Total Investment Portfolio $3.0B MF Credit $2.3B SF Credit SF Credit MFMFMF20% Credit CreditCredit Investment MF Credit SFSF78% SFCredit CreditCredit 20%20%20% SF Credit 20% Portfolio 78%78%78% $0.6B MF Credit 6.22% 5.91% 6.07% 6.15% 5.99% 78% Other 2% $0.1B Other 1Q 2019 2Q 2019 3Q 2019 4Q 2019 1Q 2020 Financing Total Leverage Ratio Portfolio Leverage Ratio Avg. Portfolio Financing Cost Total $1.6B Financing Callable $1.4B 1.8X 1.8X 3.82% 3.75% 1.7X 3.67% 3.25% 3.07% 1.5X 1.5X 1.6X 1.4X 1.4X 0.8X 0.7X Non-Callable $0.2B 1Q 2019 2Q 2019 3Q 2019 4Q 2019 1Q 2020 1Q 2019 2Q 2019 3Q 2019 4Q 2019 1Q 2020 1Q 2019 2Q 2019 3Q 2019 4Q 2019 1Q 2020 14 See Glossary and End Notes in the Appendix.
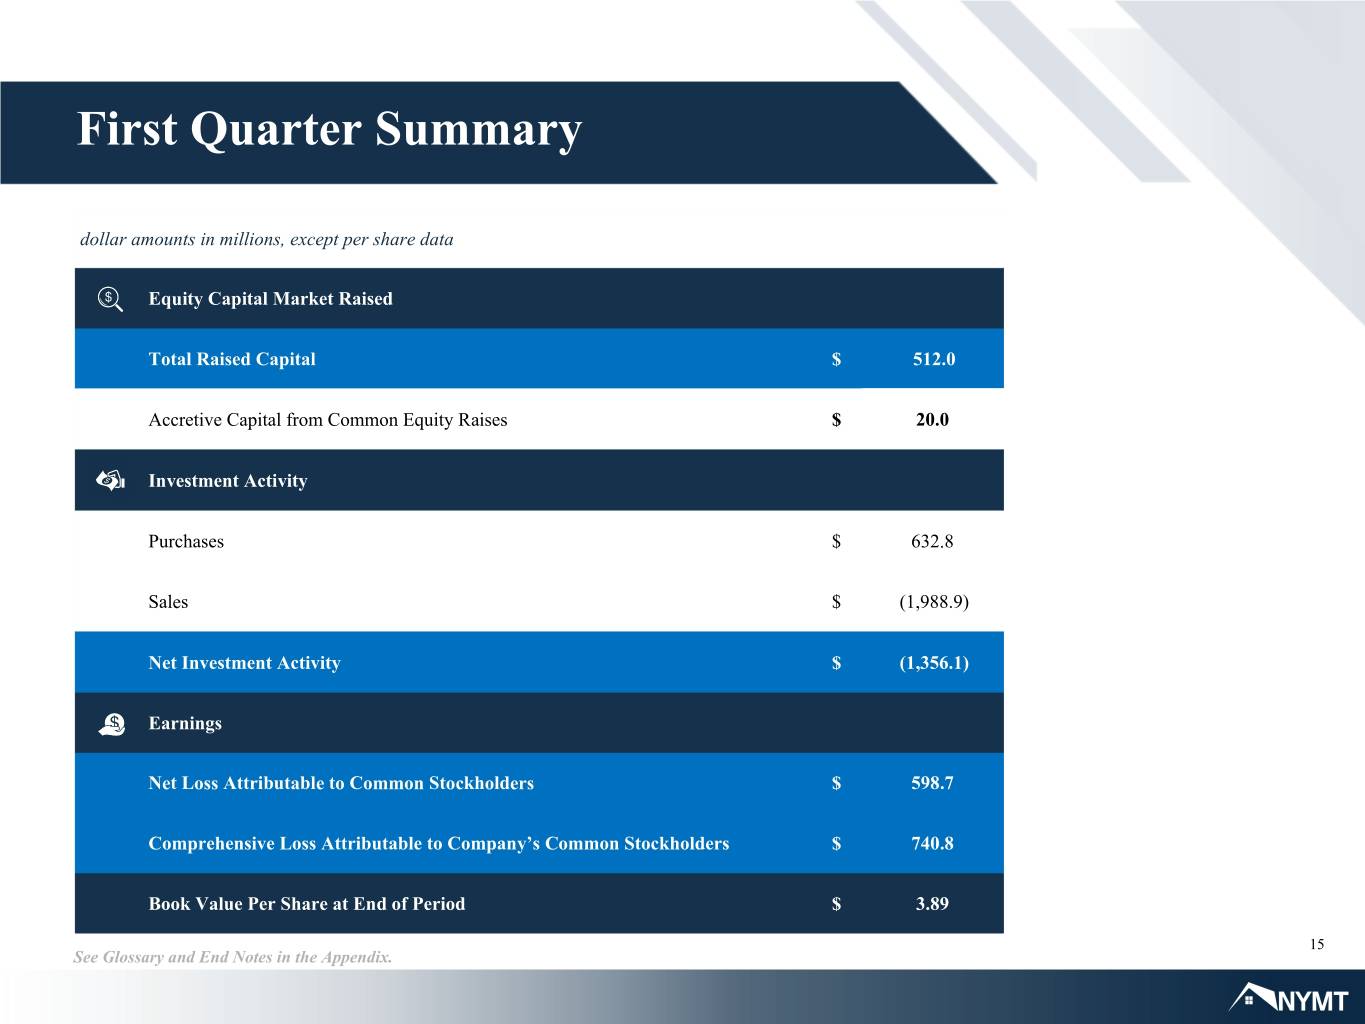
First Quarter Summary dollar amounts in millions, except per share data Equity Capital Market Raised Total Raised Capital $ 512.0 Accretive Capital from Common Equity Raises $ 20.0 Investment Activity Purchases $ 632.8 Sales $ (1,988.9) Net Investment Activity $ (1,356.1) Earnings Net Loss Attributable to Common Stockholders $ 598.7 Comprehensive Loss Attributable to Company’s Common Stockholders $ 740.8 Book Value Per Share at End of Period $ 3.89 15 See Glossary and End Notes in the Appendix.
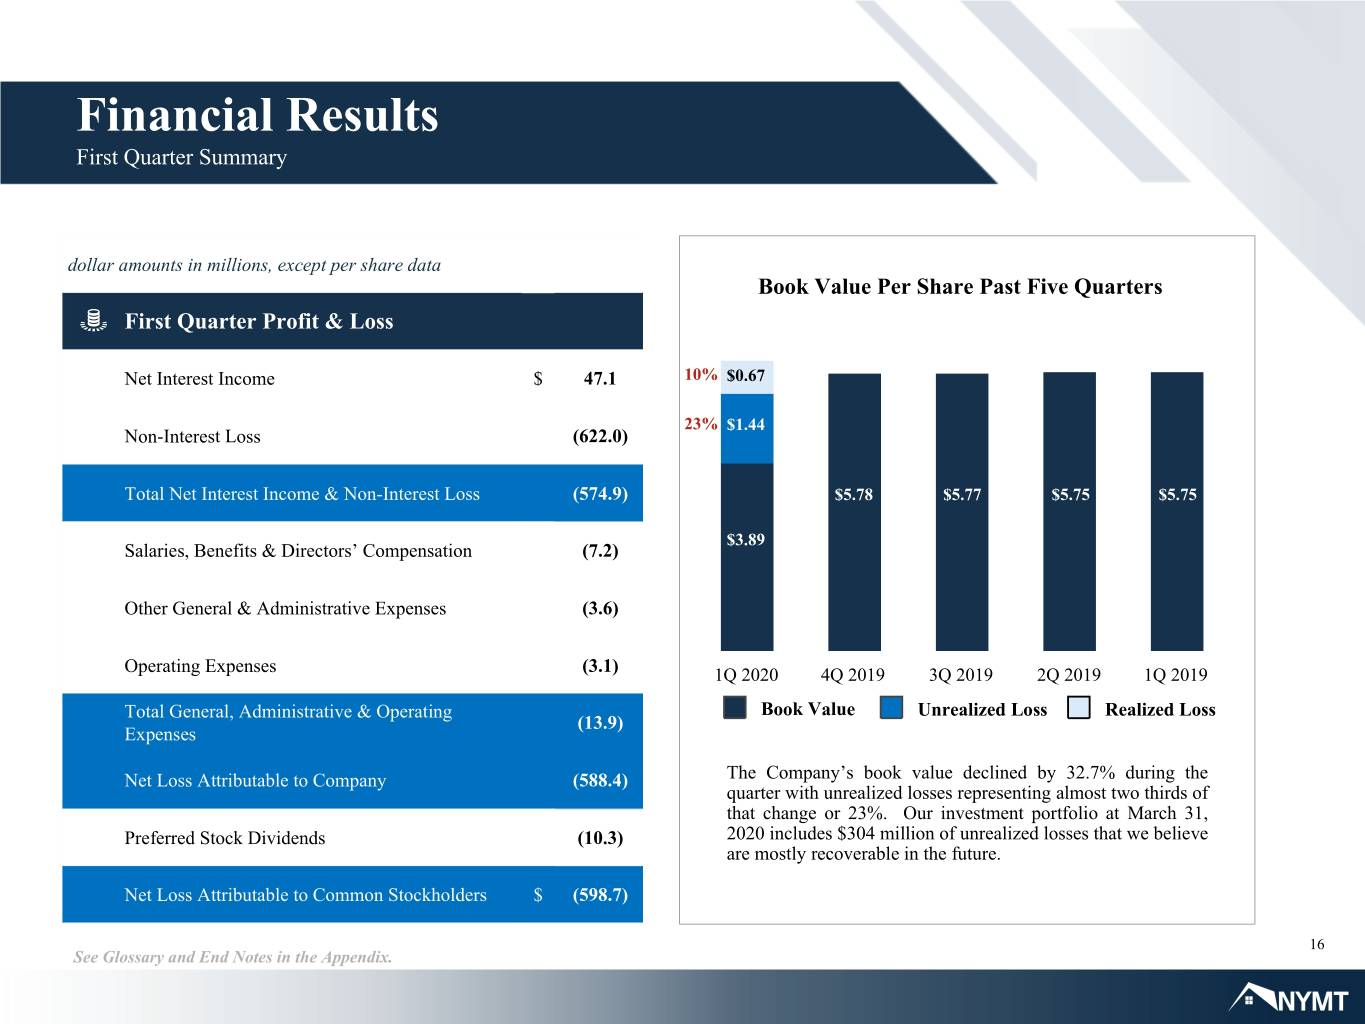
Financial Results First Quarter Summary dollar amounts in millions, except per share data Book Value Per Share Past Five Quarters First Quarter Profit & Loss Net Interest Income $ 47.1 10% $0.67 23% $1.44 Non-Interest Loss (622.0) Total Net Interest Income & Non-Interest Loss (574.9) $5.78 $5.77 $5.75 $5.75 $3.89 Salaries, Benefits & Directors’ Compensation (7.2) Other General & Administrative Expenses (3.6) Operating Expenses (3.1) 1Q 2020 4Q 2019 3Q 2019 2Q 2019 1Q 2019 Total General, Administrative & Operating Book Value Unrealized Loss Realized Loss (13.9) Expenses Net Loss Attributable to Company (588.4) The Company’s book value declined by 32.7% during the quarter with unrealized losses representing almost two thirds of that change or 23%. Our investment portfolio at March 31, Preferred Stock Dividends (10.3) 2020 includes $304 million of unrealized losses that we believe are mostly recoverable in the future. Net Loss Attributable to Common Stockholders $ (598.7) 16 See Glossary and End Notes in the Appendix.

Strategy Updates
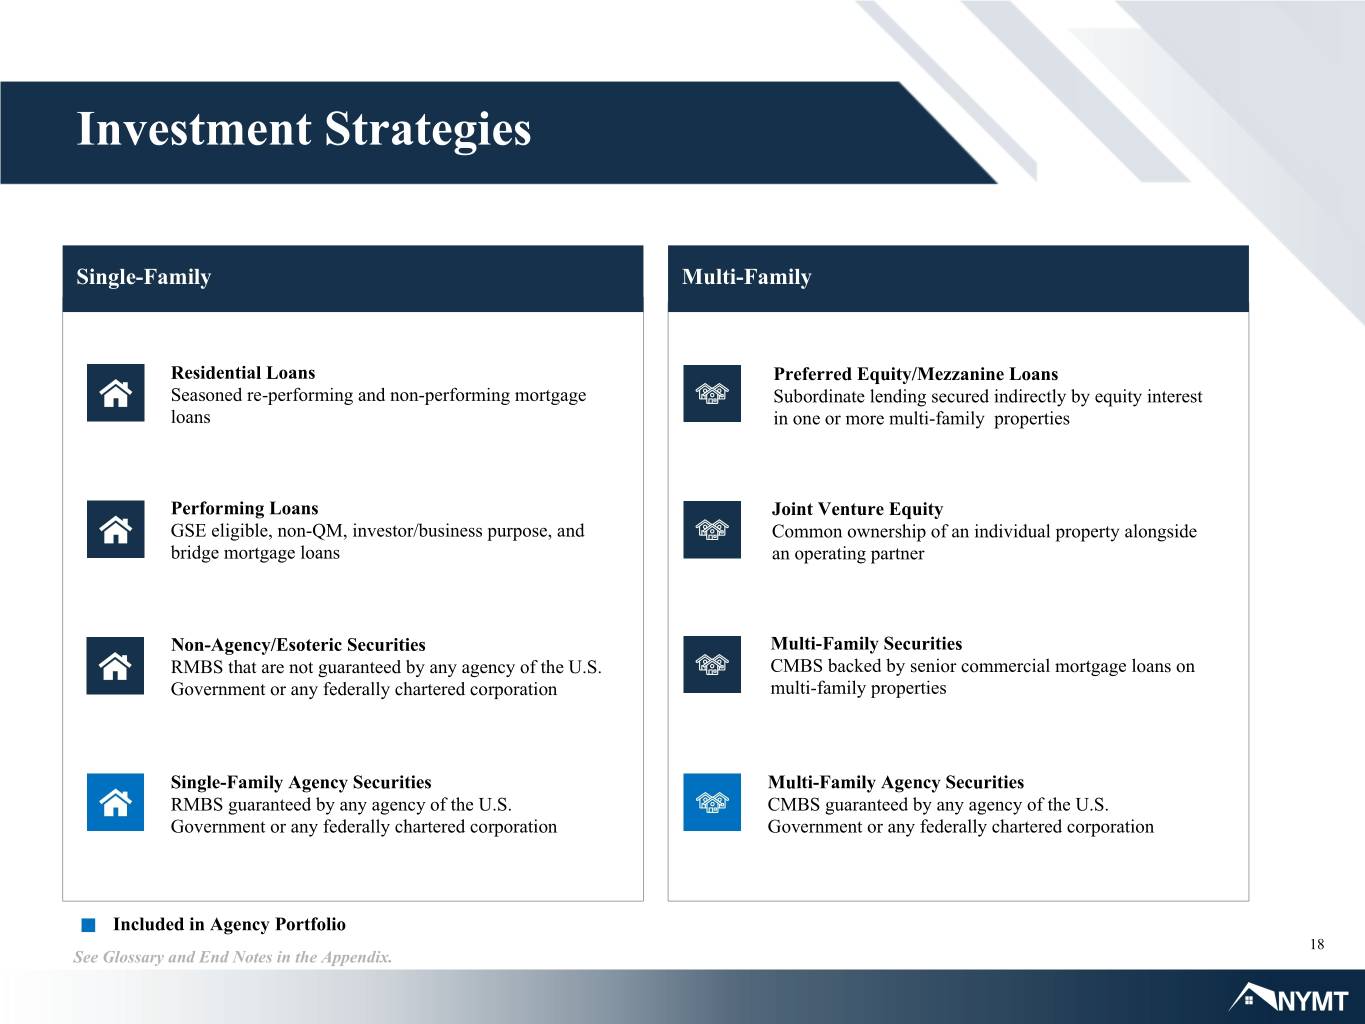
Investment Strategies Single-Family Multi-Family Residential Loans Preferred Equity/Mezzanine Loans Seasoned re-performing and non-performing mortgage Subordinate lending secured indirectly by equity interest loans in one or more multi-family properties Performing Loans Joint Venture Equity GSE eligible, non-QM, investor/business purpose, and Common ownership of an individual property alongside bridge mortgage loans an operating partner Non-Agency/Esoteric Securities Multi-Family Securities RMBS that are not guaranteed by any agency of the U.S. CMBS backed by senior commercial mortgage loans on Government or any federally chartered corporation multi-family properties Single-Family Agency Securities Multi-Family Agency Securities RMBS guaranteed by any agency of the U.S. CMBS guaranteed by any agency of the U.S. Government or any federally chartered corporation Government or any federally chartered corporation Included in Agency Portfolio 18 See Glossary and End Notes in the Appendix.
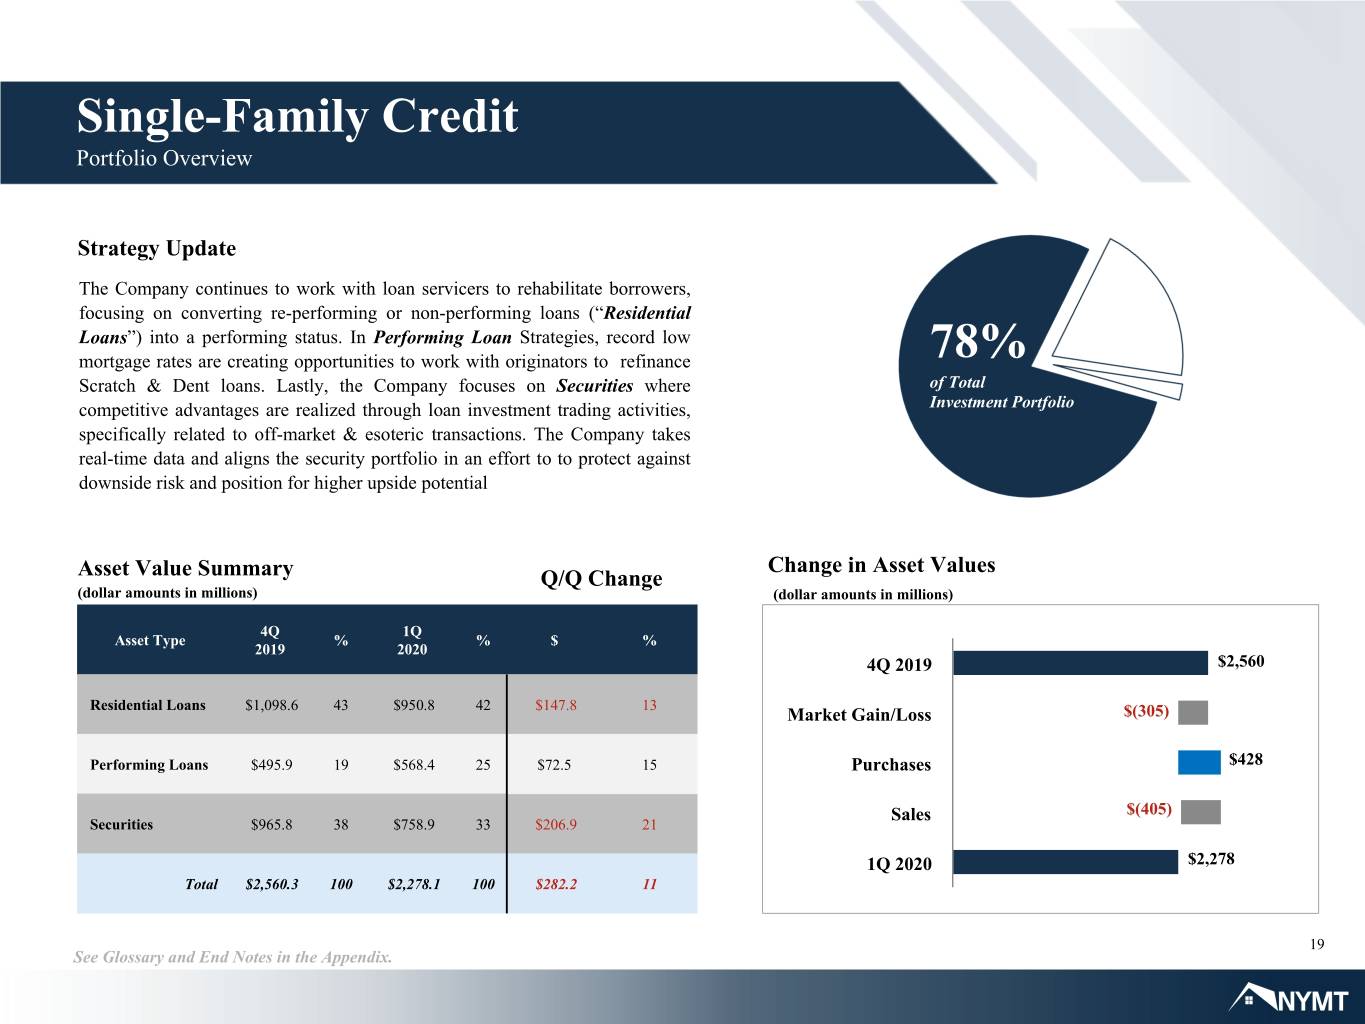
Single-Family Credit Portfolio Overview Strategy Update The Company continues to work with loan servicers to rehabilitate borrowers, focusing on converting re-performing or non-performing loans (“Residential Loans”) into a performing status. In Performing Loan Strategies, record low mortgage rates are creating opportunities to work with originators to refinance 78% Scratch & Dent loans. Lastly, the Company focuses on Securities where of Total competitive advantages are realized through loan investment trading activities, Investment Portfolio specifically related to off-market & esoteric transactions. The Company takes real-time data and aligns the security portfolio in an effort to to protect against downside risk and position for higher upside potential Change in Asset Values Asset Value Summary Q/Q Change (dollar amounts in millions) (dollar amounts in millions) 4Q 1Q Asset Type % % $ % 2019 2020 4Q 2019 $2,560 Residential Loans $1,098.6 43 $950.8 42 $147.8 13 Market Gain/Loss $(305) Performing Loans $495.9 19 $568.4 25 $72.5 15 Purchases $428 Sales $(405) Securities $965.8 38 $758.9 33 $206.9 21 1Q 2020 $2,278 Total $2,560.3 100 $2,278.1 100 $282.2 11 19 See Glossary and End Notes in the Appendix.
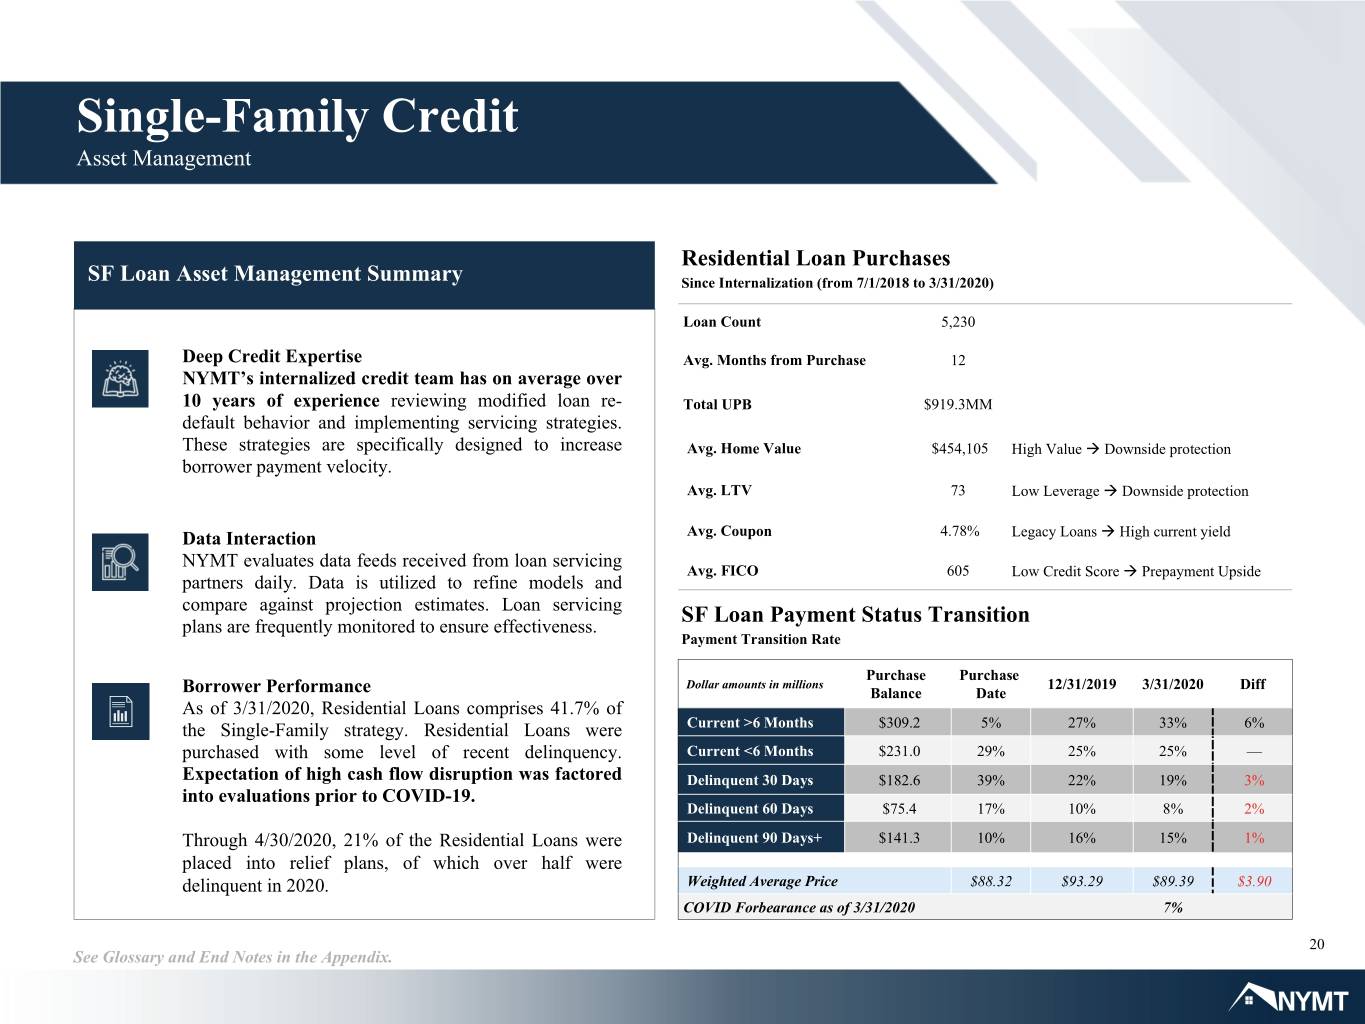
Single-Family Credit Asset Management Residential Loan Purchases SF Loan Asset Management Summary Since Internalization (from 7/1/2018 to 3/31/2020) Loan Count 5,230 Deep Credit Expertise Avg. Months from Purchase 12 NYMT’s internalized credit team has on average over 10 years of experience reviewing modified loan re- Total UPB $919.3MM default behavior and implementing servicing strategies. These strategies are specifically designed to increase Avg. Home Value $454,105 High Value à Downside protection borrower payment velocity. Avg. LTV 73 Low Leverage à Downside protection Data Interaction Avg. Coupon 4.78% Legacy Loans à High current yield NYMT evaluates data feeds received from loan servicing Avg. FICO 605 Low Credit Score à Prepayment Upside partners daily. Data is utilized to refine models and compare against projection estimates. Loan servicing SF Loan Payment Status Transition plans are frequently monitored to ensure effectiveness. Payment Transition Rate Purchase Purchase Dollar amounts in millions 12/31/2019 3/31/2020 Diff Borrower Performance Balance Date As of 3/31/2020, Residential Loans comprises 41.7% of the Single-Family strategy. Residential Loans were Current >6 Months $309.2 5% 27% 33% 6% purchased with some level of recent delinquency. Current <6 Months $231.0 29% 25% 25% — Expectation of high cash flow disruption was factored Delinquent 30 Days $182.6 39% 22% 19% 3% into evaluations prior to COVID-19. Delinquent 60 Days $75.4 17% 10% 8% 2% Through 4/30/2020, 21% of the Residential Loans were Delinquent 90 Days+ $141.3 10% 16% 15% 1% placed into relief plans, of which over half were delinquent in 2020. Weighted Average Price $88.32 $93.29 $89.39 $3.90 COVID Forbearance as of 3/31/2020 7% 20 See Glossary and End Notes in the Appendix.
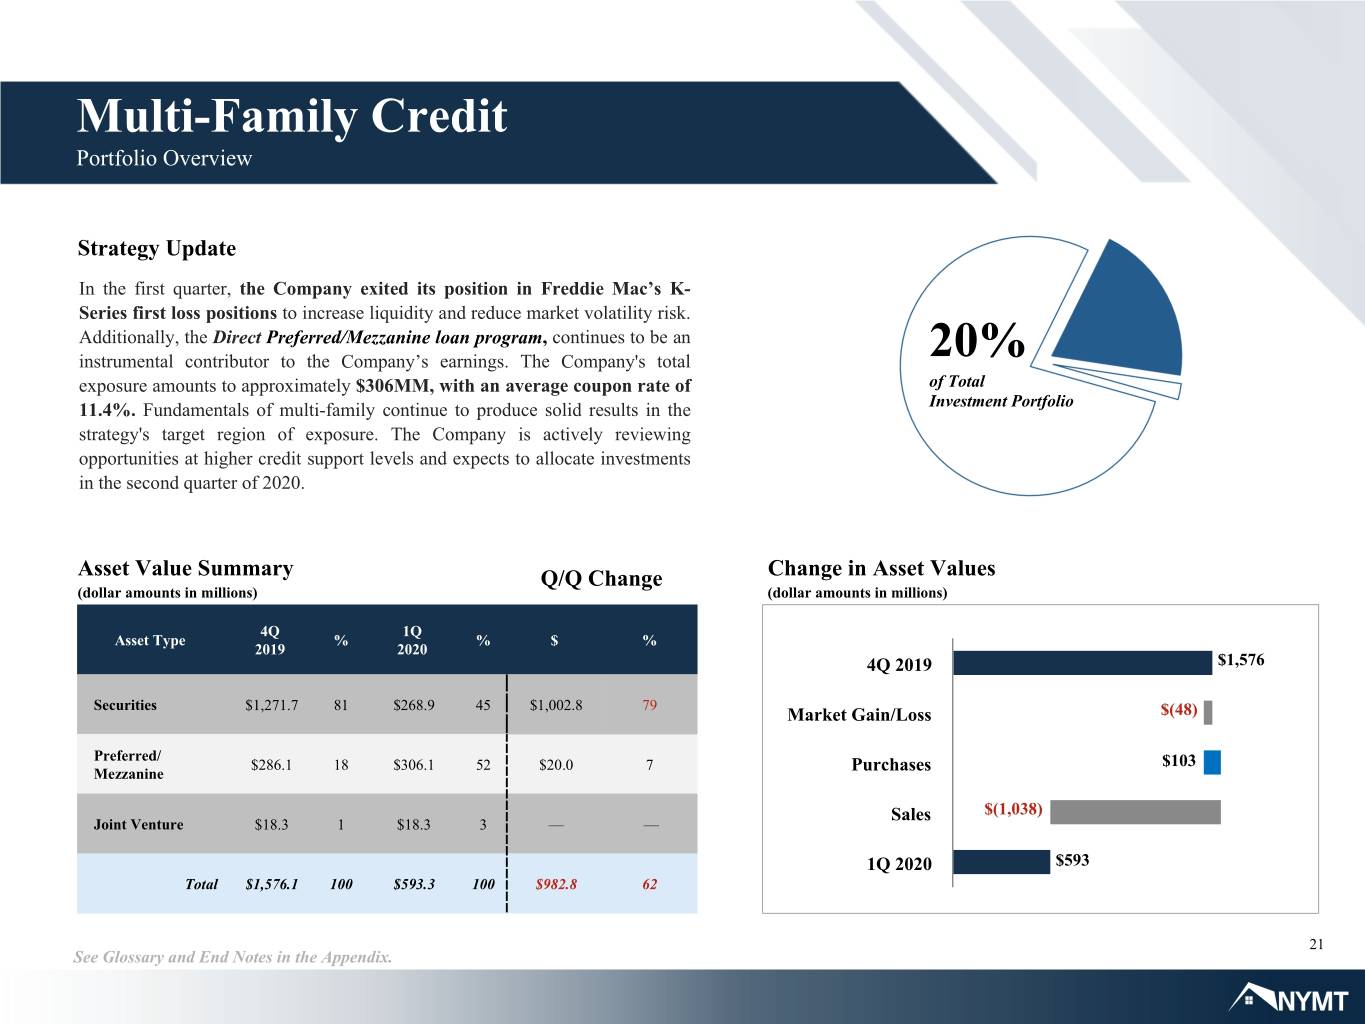
Multi-Family Credit Portfolio Overview Strategy Update In the first quarter, the Company exited its position in Freddie Mac’s K- Series first loss positions to increase liquidity and reduce market volatility risk. Additionally, the Direct Preferred/Mezzanine loan program, continues to be an instrumental contributor to the Company’s earnings. The Company's total 20% exposure amounts to approximately $306MM, with an average coupon rate of of Total 11.4%. Fundamentals of multi-family continue to produce solid results in the Investment Portfolio strategy's target region of exposure. The Company is actively reviewing opportunities at higher credit support levels and expects to allocate investments in the second quarter of 2020. Asset Value Summary Q/Q Change Change in Asset Values (dollar amounts in millions) (dollar amounts in millions) 4Q 1Q Asset Type % % $ % 2019 2020 4Q 2019 $1,576 Securities $1,271.7 81 $268.9 45 $1,002.8 79 Market Gain/Loss $(48) Preferred/ $286.1 18 $306.1 52 $20.0 7 Purchases $103 Mezzanine Sales $(1,038) Joint Venture $18.3 1 $18.3 3 — — 1Q 2020 $593 Total $1,576.1 100 $593.3 100 $982.8 62 21 See Glossary and End Notes in the Appendix.
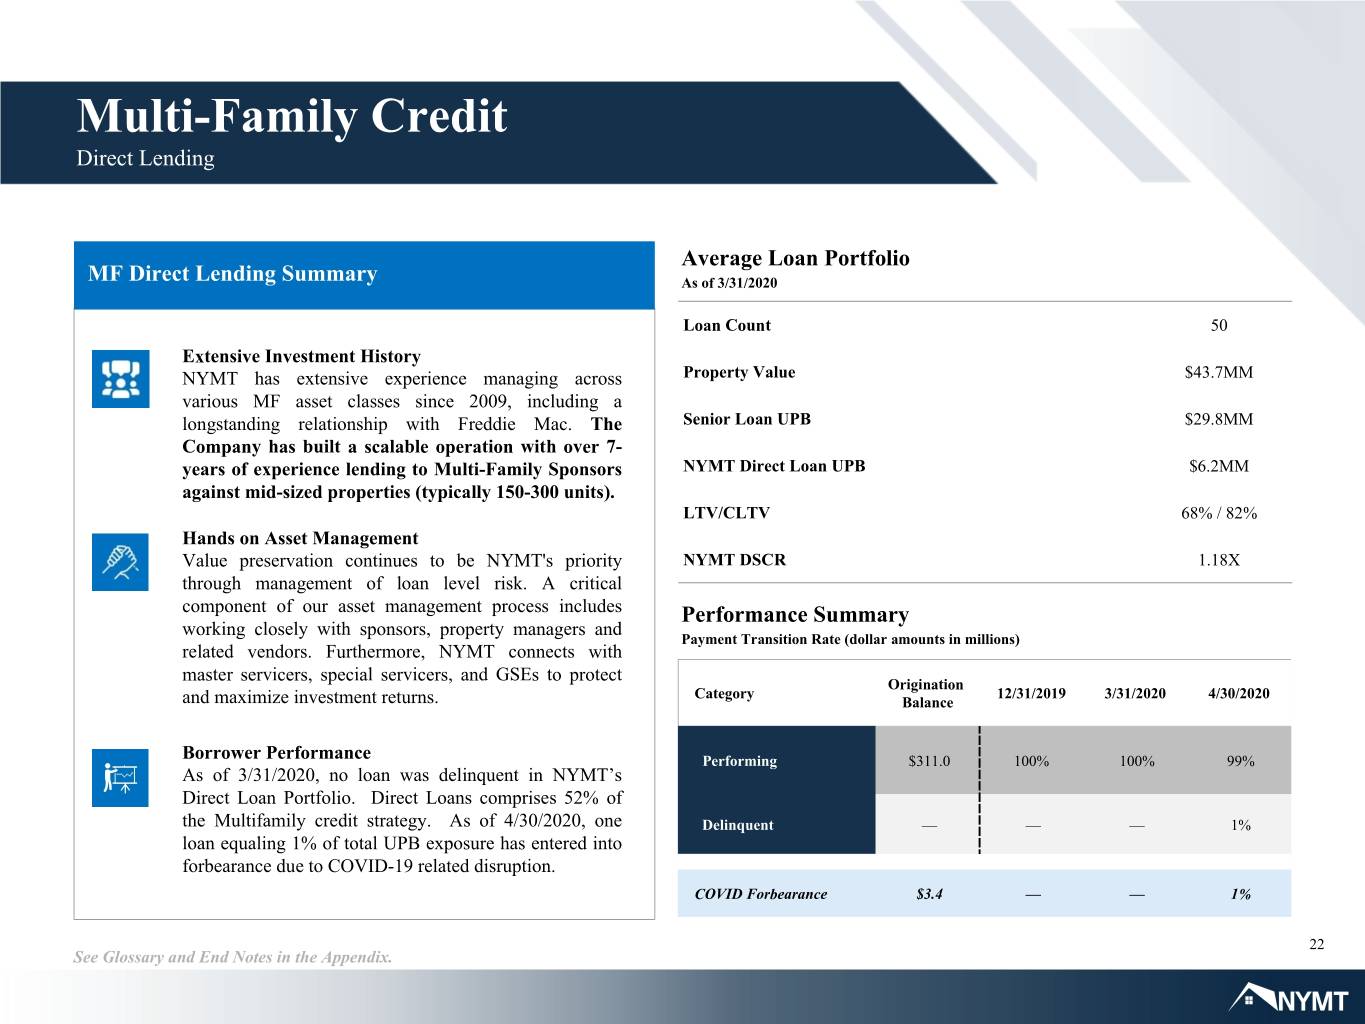
Multi-Family Credit Direct Lending Average Loan Portfolio MF Direct Lending Summary As of 3/31/2020 Loan Count 50 Extensive Investment History NYMT has extensive experience managing across Property Value $43.7MM various MF asset classes since 2009, including a longstanding relationship with Freddie Mac. The Senior Loan UPB $29.8MM Company has built a scalable operation with over 7- years of experience lending to Multi-Family Sponsors NYMT Direct Loan UPB $6.2MM against mid-sized properties (typically 150-300 units). LTV/CLTV 68% / 82% Hands on Asset Management Value preservation continues to be NYMT's priority NYMT DSCR 1.18X through management of loan level risk. A critical component of our asset management process includes Performance Summary working closely with sponsors, property managers and Payment Transition Rate (dollar amounts in millions) related vendors. Furthermore, NYMT connects with master servicers, special servicers, and GSEs to protect Origination Category 12/31/2019 3/31/2020 4/30/2020 and maximize investment returns. Balance Borrower Performance Performing $311.0 100% 100% 99% As of 3/31/2020, no loan was delinquent in NYMT’s Direct Loan Portfolio. Direct Loans comprises 52% of the Multifamily credit strategy. As of 4/30/2020, one Delinquent — — — 1% loan equaling 1% of total UPB exposure has entered into forbearance due to COVID-19 related disruption. COVID Forbearance $3.4 — — 1% 22 See Glossary and End Notes in the Appendix.
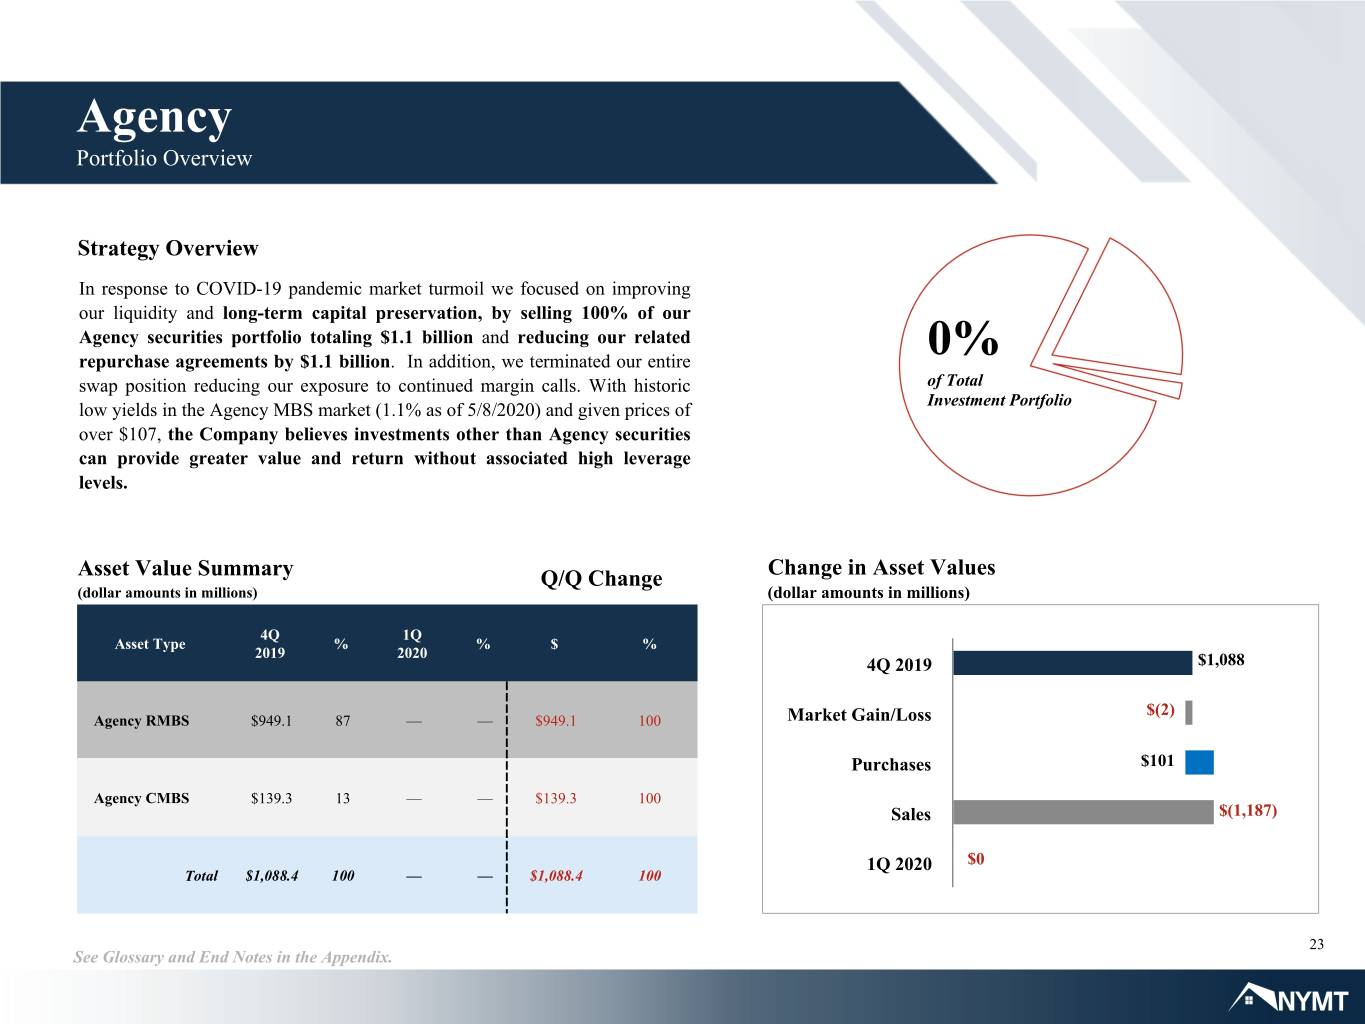
Agency Portfolio Overview Strategy Overview In response to COVID-19 pandemic market turmoil we focused on improving our liquidity and long-term capital preservation, by selling 100% of our Agency securities portfolio totaling $1.1 billion and reducing our related repurchase agreements by $1.1 billion. In addition, we terminated our entire 0% swap position reducing our exposure to continued margin calls. With historic of Total Investment Portfolio low yields in the Agency MBS market (1.1% as of 5/8/2020) and given prices of over $107, the Company believes investments other than Agency securities can provide greater value and return without associated high leverage levels. Asset Value Summary Q/Q Change Change in Asset Values (dollar amounts in millions) (dollar amounts in millions) 4Q 1Q Asset Type % % $ % 2019 2020 4Q 2019 $1,088 $(2) Agency RMBS $949.1 87 — — $949.1 100 Market Gain/Loss Purchases $101 Agency CMBS $139.3 13 — — $139.3 100 Sales $(1,187) 1Q 2020 $0 Total $1,088.4 100 — — $1,088.4 100 23 See Glossary and End Notes in the Appendix.
Business Summary First Quarter 2020
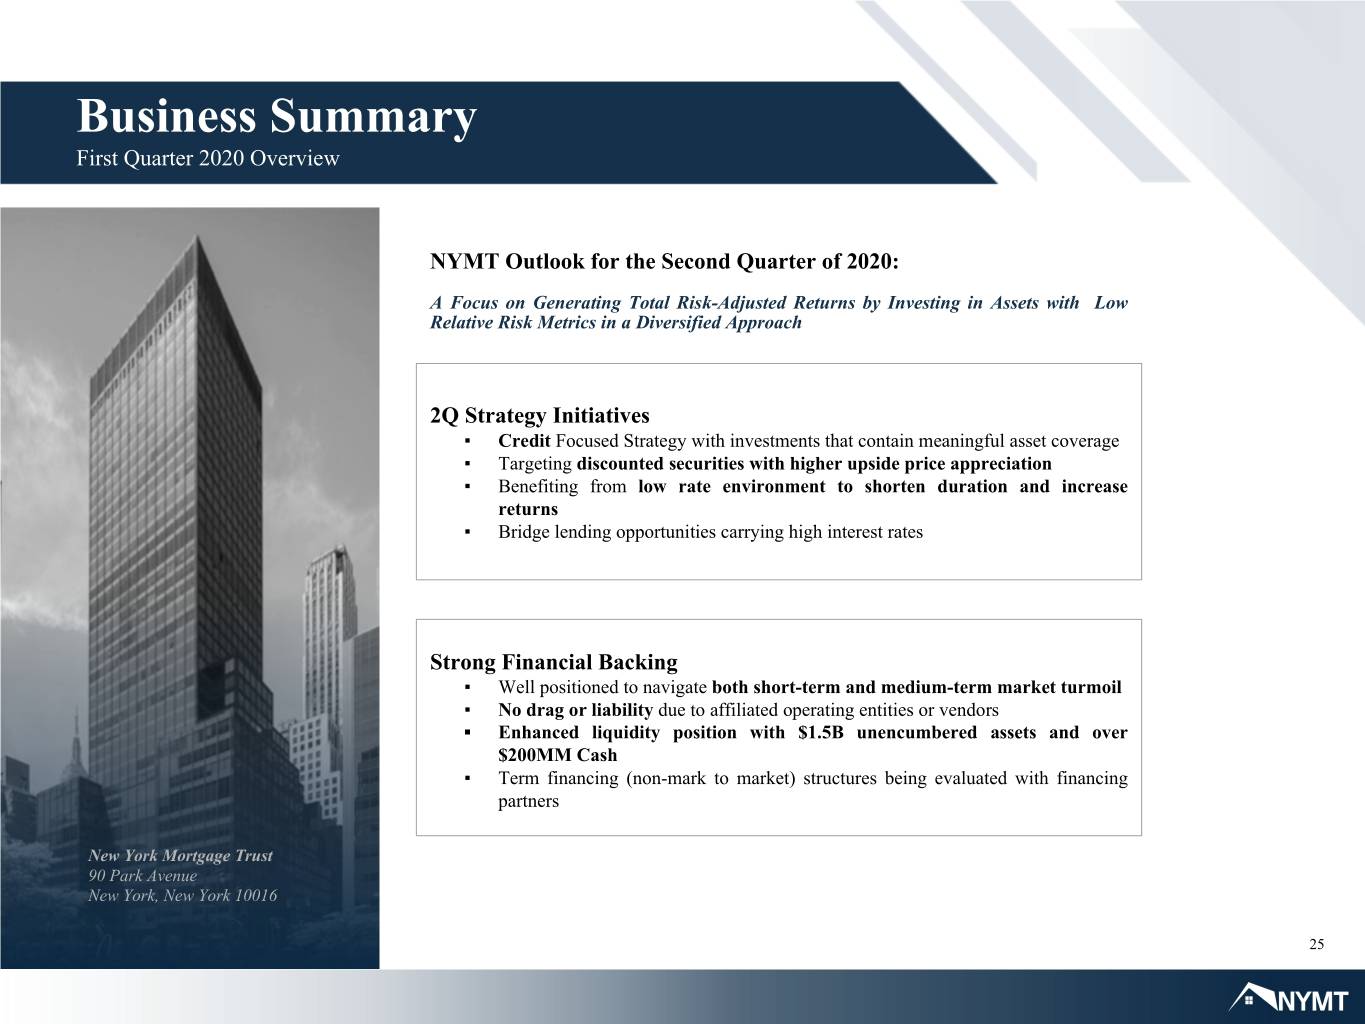
Business Summary First Quarter 2020 Overview NYMT Outlook for the Second Quarter of 2020: A Focus on Generating Total Risk-Adjusted Returns by Investing in Assets with Low Relative Risk Metrics in a Diversified Approach 2Q Strategy Initiatives ▪ Credit Focused Strategy with investments that contain meaningful asset coverage ▪ Targeting discounted securities with higher upside price appreciation ▪ Benefiting from low rate environment to shorten duration and increase returns ▪ Bridge lending opportunities carrying high interest rates Strong Financial Backing ▪ Well positioned to navigate both short-term and medium-term market turmoil ▪ No drag or liability due to affiliated operating entities or vendors ▪ Enhanced liquidity position with $1.5B unencumbered assets and over $200MM Cash ▪ Term financing (non-mark to market) structures being evaluated with financing partners New York Mortgage Trust 90 Park Avenue New York, New York 10016 25
Quarterly Comparative Financial Information
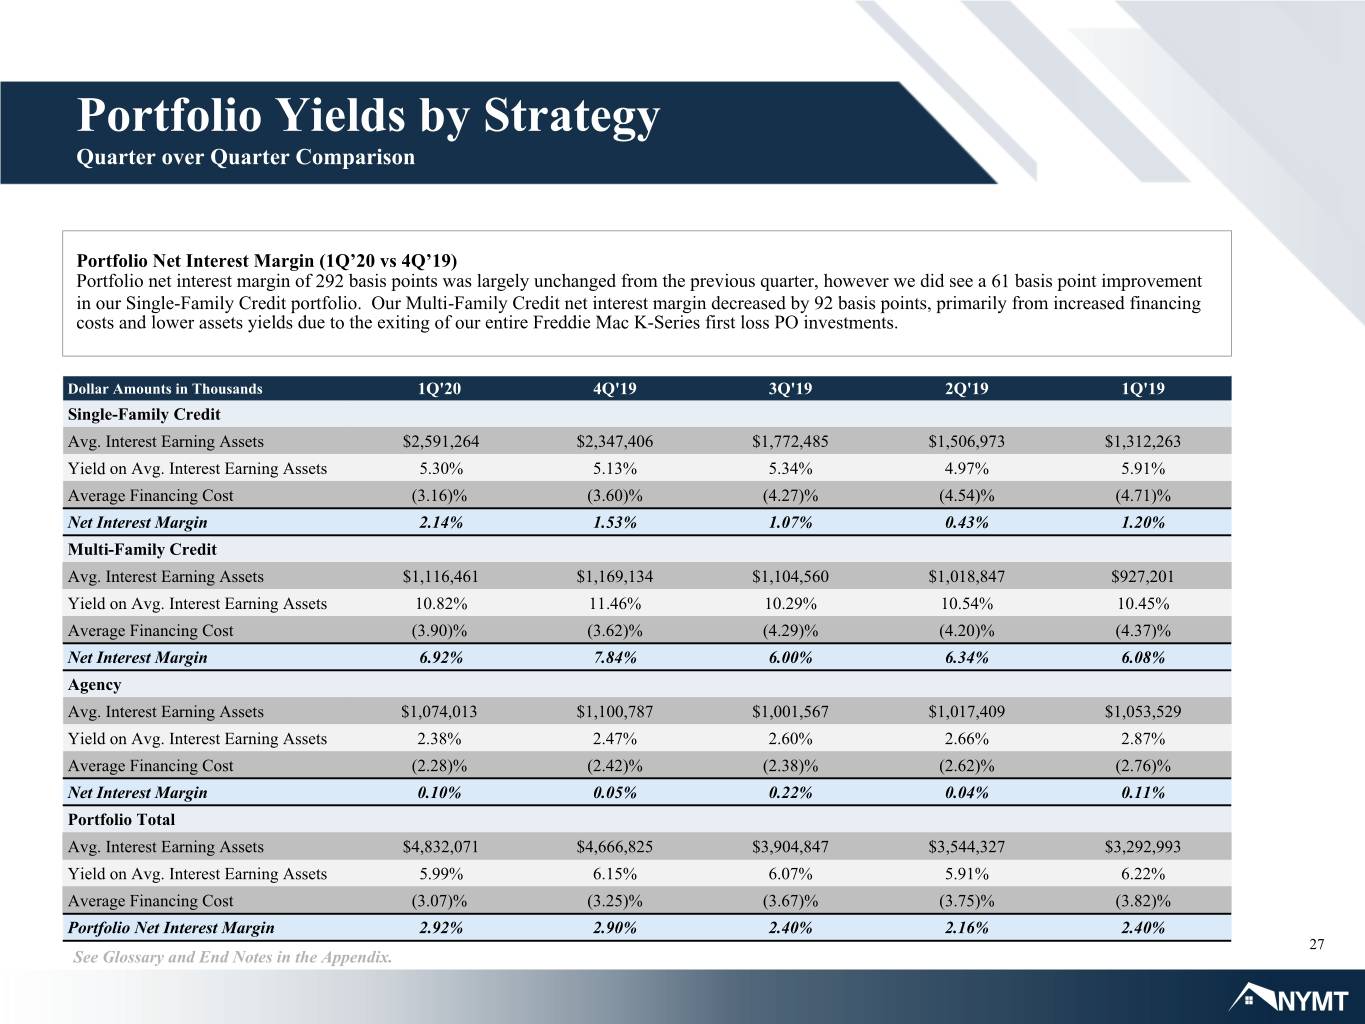
Portfolio Yields by Strategy Quarter over Quarter Comparison Portfolio Net Interest Margin (1Q’20 vs 4Q’19) Portfolio net interest margin of 292 basis points was largely unchanged from the previous quarter, however we did see a 61 basis point improvement in our Single-Family Credit portfolio. Our Multi-Family Credit net interest margin decreased by 92 basis points, primarily from increased financing costs and lower assets yields due to the exiting of our entire Freddie Mac K-Series first loss PO investments. Dollar Amounts in Thousands 1Q'20 4Q'19 3Q'19 2Q'19 1Q'19 Single-Family Credit Avg. Interest Earning Assets $2,591,264 $2,347,406 $1,772,485 $1,506,973 $1,312,263 Yield on Avg. Interest Earning Assets 5.30% 5.13% 5.34% 4.97% 5.91% Average Financing Cost (3.16)% (3.60)% (4.27)% (4.54)% (4.71)% Net Interest Margin 2.14% 1.53% 1.07% 0.43% 1.20% Multi-Family Credit Avg. Interest Earning Assets $1,116,461 $1,169,134 $1,104,560 $1,018,847 $927,201 Yield on Avg. Interest Earning Assets 10.82% 11.46% 10.29% 10.54% 10.45% Average Financing Cost (3.90)% (3.62)% (4.29)% (4.20)% (4.37)% Net Interest Margin 6.92% 7.84% 6.00% 6.34% 6.08% Agency Avg. Interest Earning Assets $1,074,013 $1,100,787 $1,001,567 $1,017,409 $1,053,529 Yield on Avg. Interest Earning Assets 2.38% 2.47% 2.60% 2.66% 2.87% Average Financing Cost (2.28)% (2.42)% (2.38)% (2.62)% (2.76)% Net Interest Margin 0.10% 0.05% 0.22% 0.04% 0.11% Portfolio Total Avg. Interest Earning Assets $4,832,071 $4,666,825 $3,904,847 $3,544,327 $3,292,993 Yield on Avg. Interest Earning Assets 5.99% 6.15% 6.07% 5.91% 6.22% Average Financing Cost (3.07)% (3.25)% (3.67)% (3.75)% (3.82)% Portfolio Net Interest Margin 2.92% 2.90% 2.40% 2.16% 2.40% 27 See Glossary and End Notes in the Appendix.
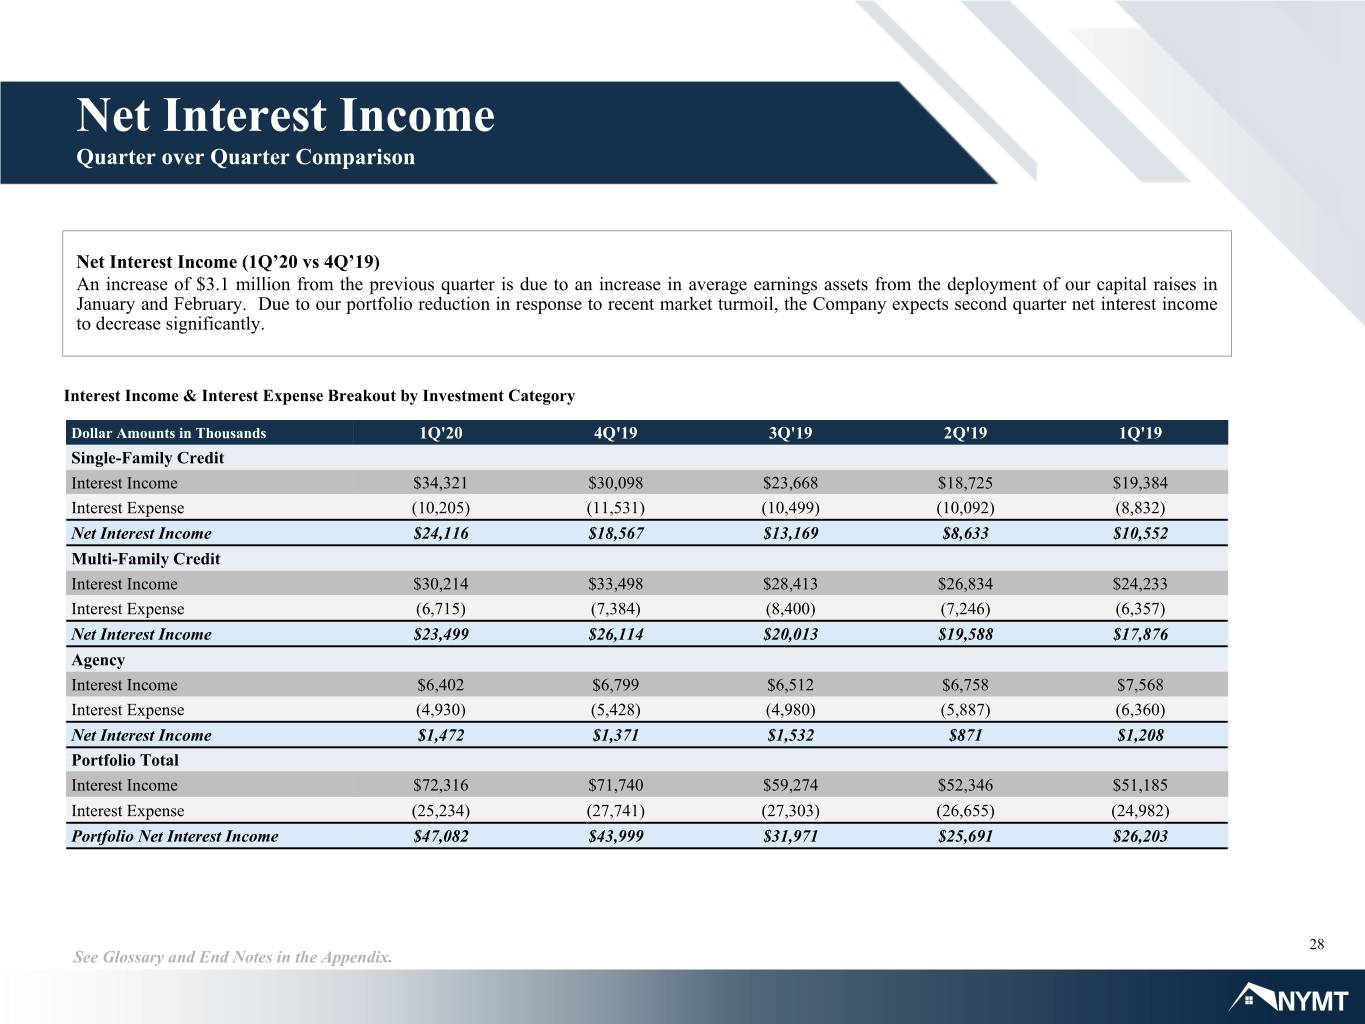
Net Interest Income Quarter over Quarter Comparison Net Interest Income (1Q’20 vs 4Q’19) An increase of $3.1 million from the previous quarter is due to an increase in average earnings assets from the deployment of our capital raises in January and February. Due to our portfolio reduction in response to recent market turmoil, the Company expects second quarter net interest income to decrease significantly. Interest Income & Interest Expense Breakout by Investment Category Dollar Amounts in Thousands 1Q'20 4Q'19 3Q'19 2Q'19 1Q'19 Single-Family Credit Interest Income $34,321 $30,098 $23,668 $18,725 $19,384 Interest Expense (10,205) (11,531) (10,499) (10,092) (8,832) Net Interest Income $24,116 $18,567 $13,169 $8,633 $10,552 Multi-Family Credit Interest Income $30,214 $33,498 $28,413 $26,834 $24,233 Interest Expense (6,715) (7,384) (8,400) (7,246) (6,357) Net Interest Income $23,499 $26,114 $20,013 $19,588 $17,876 Agency Interest Income $6,402 $6,799 $6,512 $6,758 $7,568 Interest Expense (4,930) (5,428) (4,980) (5,887) (6,360) Net Interest Income $1,472 $1,371 $1,532 $871 $1,208 Portfolio Total Interest Income $72,316 $71,740 $59,274 $52,346 $51,185 Interest Expense (25,234) (27,741) (27,303) (26,655) (24,982) Portfolio Net Interest Income $47,082 $43,999 $31,971 $25,691 $26,203 28 See Glossary and End Notes in the Appendix.
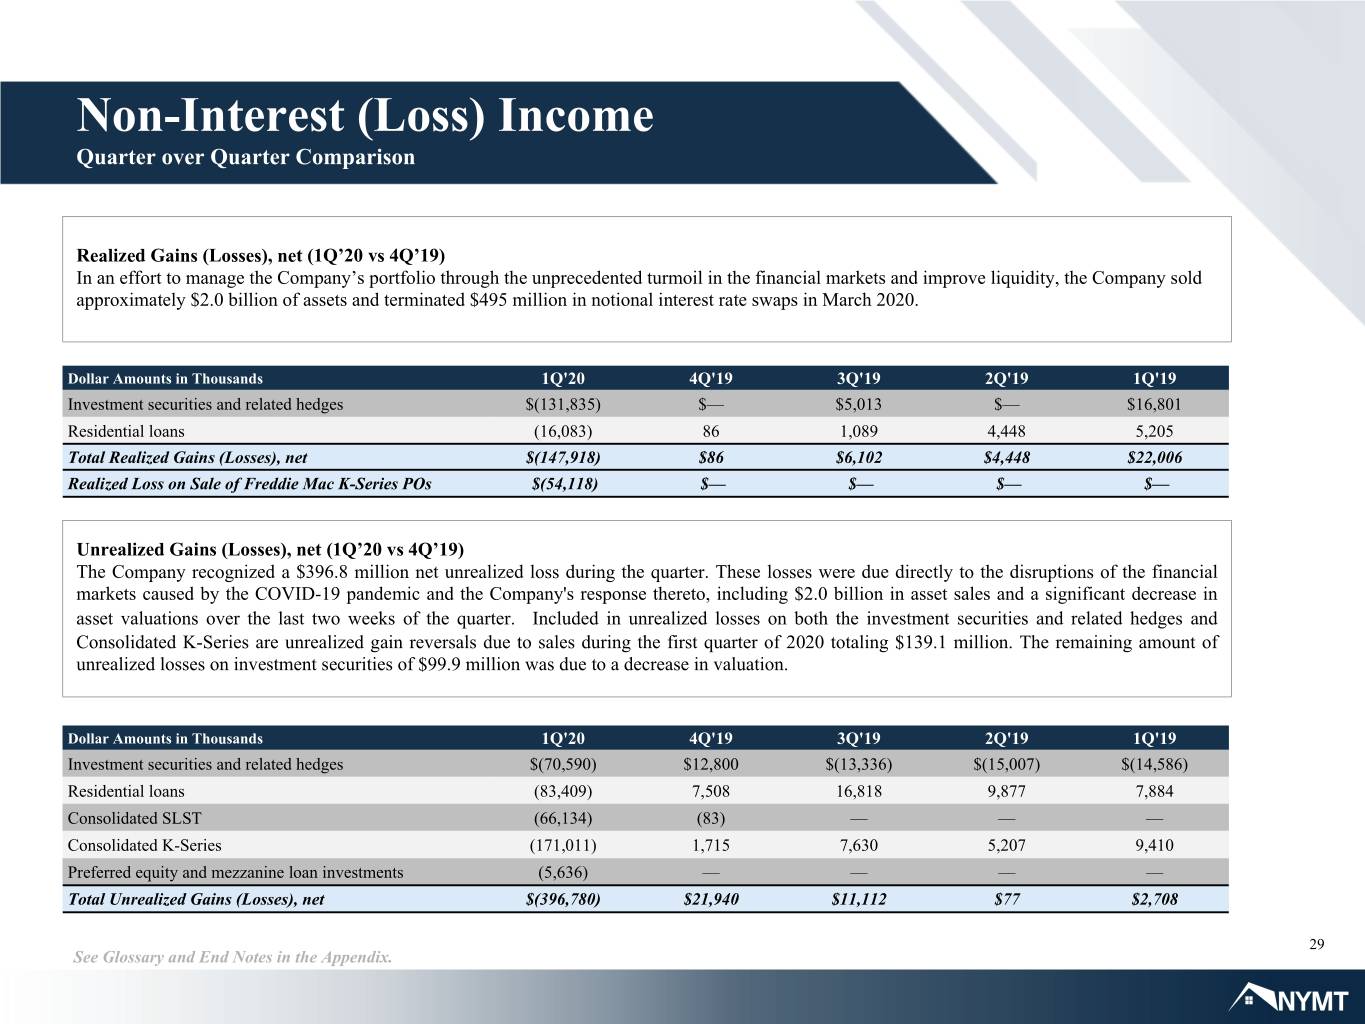
Non-Interest (Loss) Income Quarter over Quarter Comparison Realized Gains (Losses), net (1Q’20 vs 4Q’19) In an effort to manage the Company’s portfolio through the unprecedented turmoil in the financial markets and improve liquidity, the Company sold approximately $2.0 billion of assets and terminated $495 million in notional interest rate swaps in March 2020. Dollar Amounts in Thousands 1Q'20 4Q'19 3Q'19 2Q'19 1Q'19 Investment securities and related hedges $(131,835) $— $5,013 $— $16,801 Residential loans (16,083) 86 1,089 4,448 5,205 Total Realized Gains (Losses), net $(147,918) $86 $6,102 $4,448 $22,006 Realized Loss on Sale of Freddie Mac K-Series POs $(54,118) $— $— $— $— Unrealized Gains (Losses), net (1Q’20 vs 4Q’19) The Company recognized a $396.8 million net unrealized loss during the quarter. These losses were due directly to the disruptions of the financial markets caused by the COVID-19 pandemic and the Company's response thereto, including $2.0 billion in asset sales and a significant decrease in asset valuations over the last two weeks of the quarter. Included in unrealized losses on both the investment securities and related hedges and Consolidated K-Series are unrealized gain reversals due to sales during the first quarter of 2020 totaling $139.1 million. The remaining amount of unrealized losses on investment securities of $99.9 million was due to a decrease in valuation. Dollar Amounts in Thousands 1Q'20 4Q'19 3Q'19 2Q'19 1Q'19 Investment securities and related hedges $(70,590) $12,800 $(13,336) $(15,007) $(14,586) Residential loans (83,409) 7,508 16,818 9,877 7,884 Consolidated SLST (66,134) (83) — — — Consolidated K-Series (171,011) 1,715 7,630 5,207 9,410 Preferred equity and mezzanine loan investments (5,636) — — — — Total Unrealized Gains (Losses), net $(396,780) $21,940 $11,112 $77 $2,708 29 See Glossary and End Notes in the Appendix.
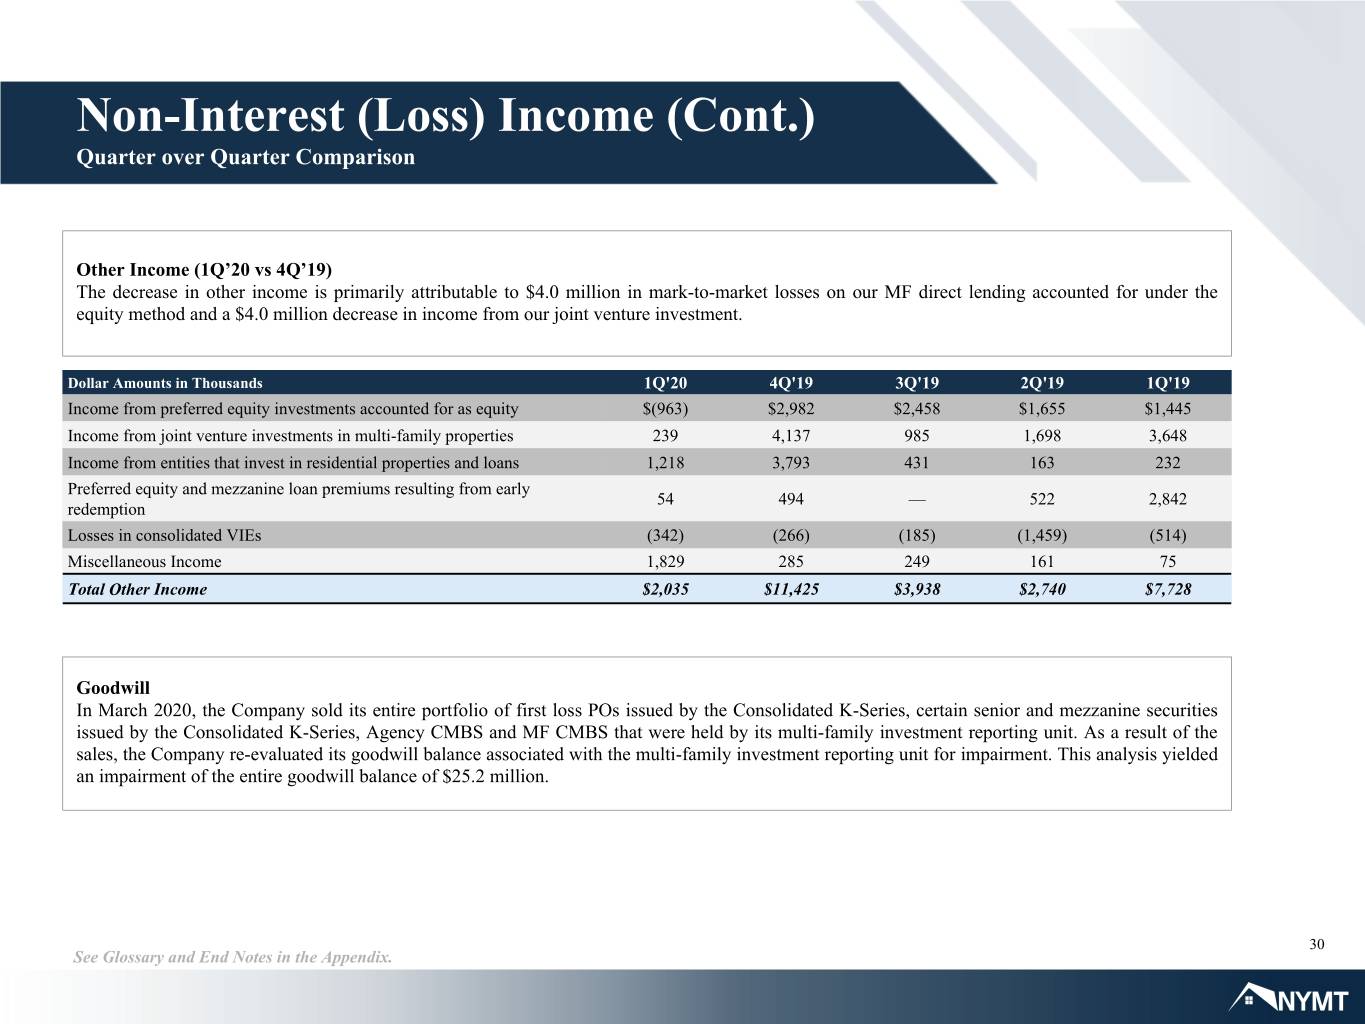
Non-Interest (Loss) Income (Cont.) Quarter over Quarter Comparison Other Income (1Q’20 vs 4Q’19) The decrease in other income is primarily attributable to $4.0 million in mark-to-market losses on our MF direct lending accounted for under the equity method and a $4.0 million decrease in income from our joint venture investment. Dollar Amounts in Thousands 1Q'20 4Q'19 3Q'19 2Q'19 1Q'19 Income from preferred equity investments accounted for as equity $(963) $2,982 $2,458 $1,655 $1,445 Income from joint venture investments in multi-family properties 239 4,137 985 1,698 3,648 Income from entities that invest in residential properties and loans 1,218 3,793 431 163 232 Preferred equity and mezzanine loan premiums resulting from early 54 494 — 522 2,842 redemption Losses in consolidated VIEs (342) (266) (185) (1,459) (514) Miscellaneous Income 1,829 285 249 161 75 Total Other Income $2,035 $11,425 $3,938 $2,740 $7,728 Goodwill In March 2020, the Company sold its entire portfolio of first loss POs issued by the Consolidated K-Series, certain senior and mezzanine securities issued by the Consolidated K-Series, Agency CMBS and MF CMBS that were held by its multi-family investment reporting unit. As a result of the sales, the Company re-evaluated its goodwill balance associated with the multi-family investment reporting unit for impairment. This analysis yielded an impairment of the entire goodwill balance of $25.2 million. 30 See Glossary and End Notes in the Appendix.
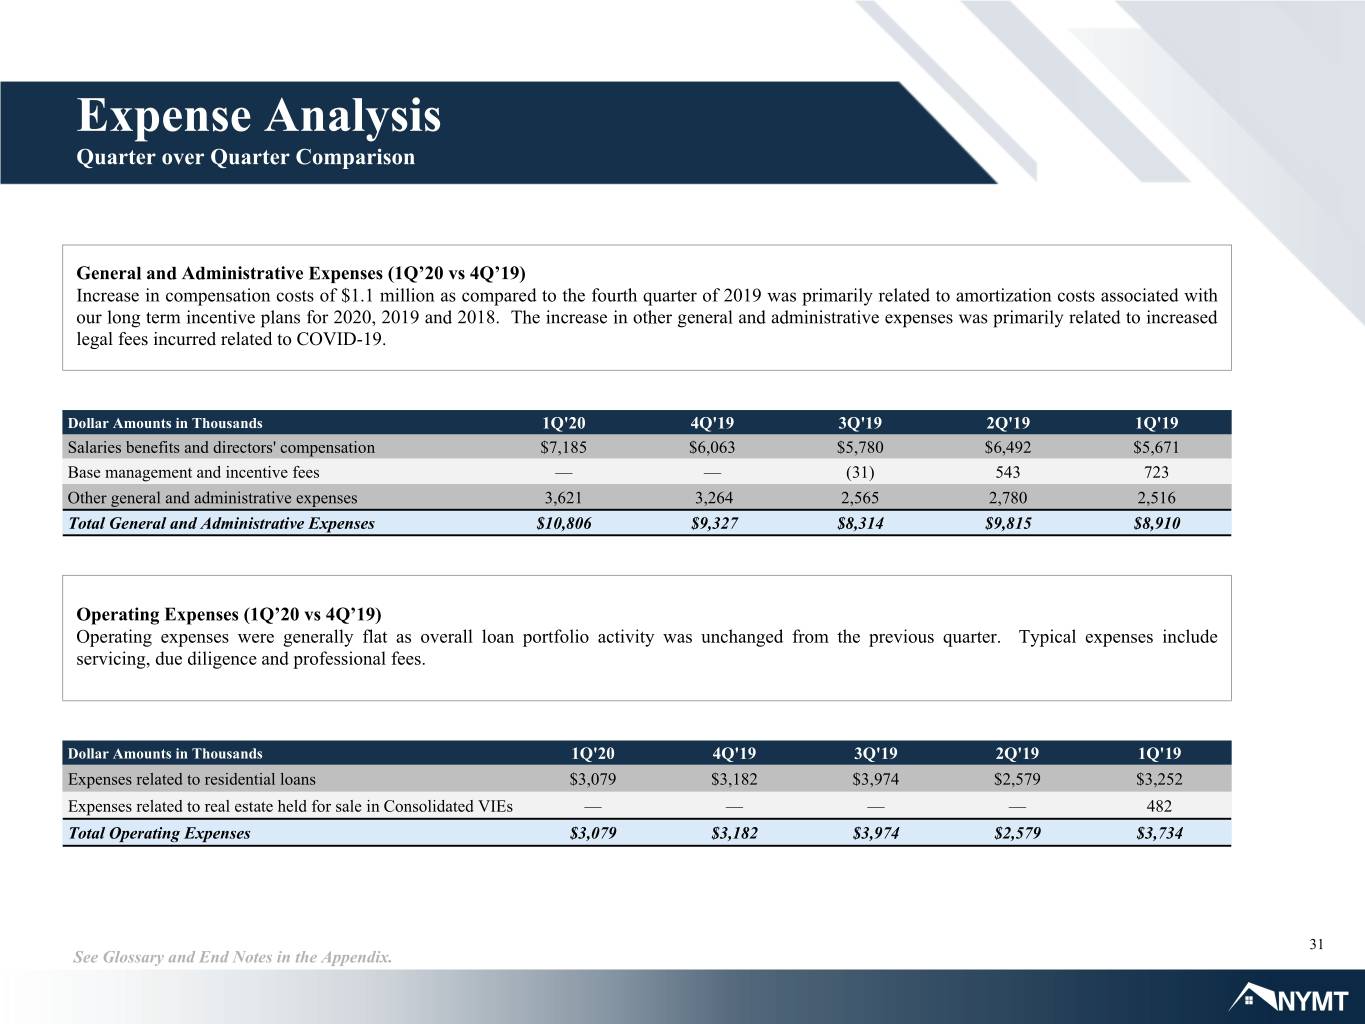
Expense Analysis Quarter over Quarter Comparison General and Administrative Expenses (1Q’20 vs 4Q’19) Increase in compensation costs of $1.1 million as compared to the fourth quarter of 2019 was primarily related to amortization costs associated with our long term incentive plans for 2020, 2019 and 2018. The increase in other general and administrative expenses was primarily related to increased legal fees incurred related to COVID-19. Dollar Amounts in Thousands 1Q'20 4Q'19 3Q'19 2Q'19 1Q'19 Salaries benefits and directors' compensation $7,185 $6,063 $5,780 $6,492 $5,671 Base management and incentive fees — — (31) 543 723 Other general and administrative expenses 3,621 3,264 2,565 2,780 2,516 Total General and Administrative Expenses $10,806 $9,327 $8,314 $9,815 $8,910 Operating Expenses (1Q’20 vs 4Q’19) Operating expenses were generally flat as overall loan portfolio activity was unchanged from the previous quarter. Typical expenses include servicing, due diligence and professional fees. Dollar Amounts in Thousands 1Q'20 4Q'19 3Q'19 2Q'19 1Q'19 Expenses related to residential loans $3,079 $3,182 $3,974 $2,579 $3,252 Expenses related to real estate held for sale in Consolidated VIEs — — — — 482 Total Operating Expenses $3,079 $3,182 $3,974 $2,579 $3,734 31 See Glossary and End Notes in the Appendix.
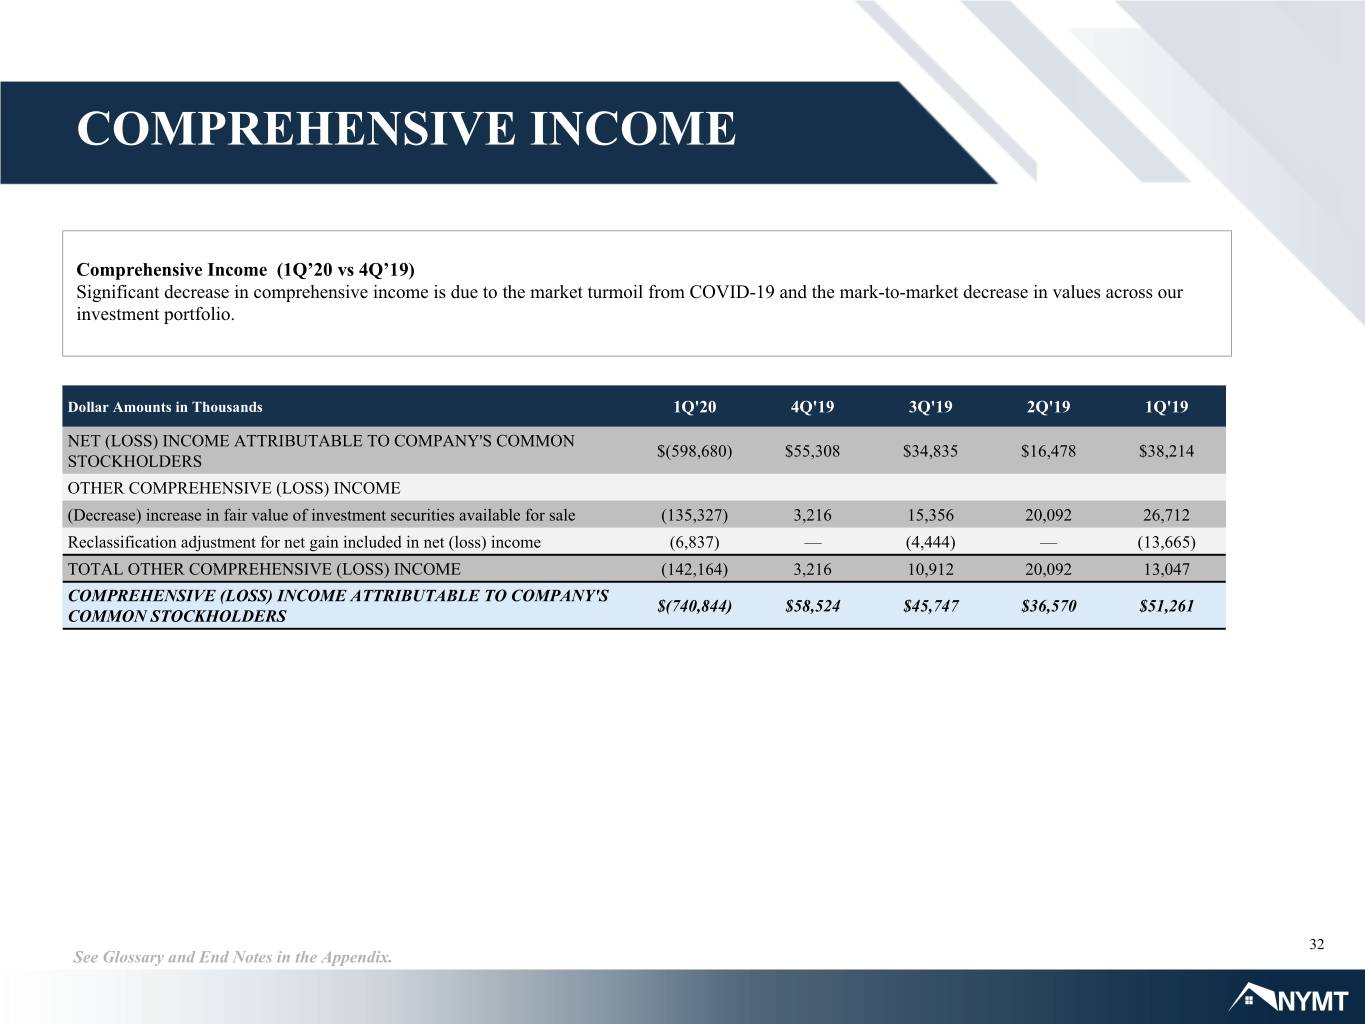
COMPREHENSIVE INCOME Comprehensive Income (1Q’20 vs 4Q’19) Significant decrease in comprehensive income is due to the market turmoil from COVID-19 and the mark-to-market decrease in values across our investment portfolio. Dollar Amounts in Thousands 1Q'20 4Q'19 3Q'19 2Q'19 1Q'19 NET (LOSS) INCOME ATTRIBUTABLE TO COMPANY'S COMMON $(598,680) $55,308 $34,835 $16,478 $38,214 STOCKHOLDERS OTHER COMPREHENSIVE (LOSS) INCOME (Decrease) increase in fair value of investment securities available for sale (135,327) 3,216 15,356 20,092 26,712 Reclassification adjustment for net gain included in net (loss) income (6,837) — (4,444) — (13,665) TOTAL OTHER COMPREHENSIVE (LOSS) INCOME (142,164) 3,216 10,912 20,092 13,047 COMPREHENSIVE (LOSS) INCOME ATTRIBUTABLE TO COMPANY'S $(740,844) $58,524 $45,747 $36,570 $51,261 COMMON STOCKHOLDERS 32 See Glossary and End Notes in the Appendix.
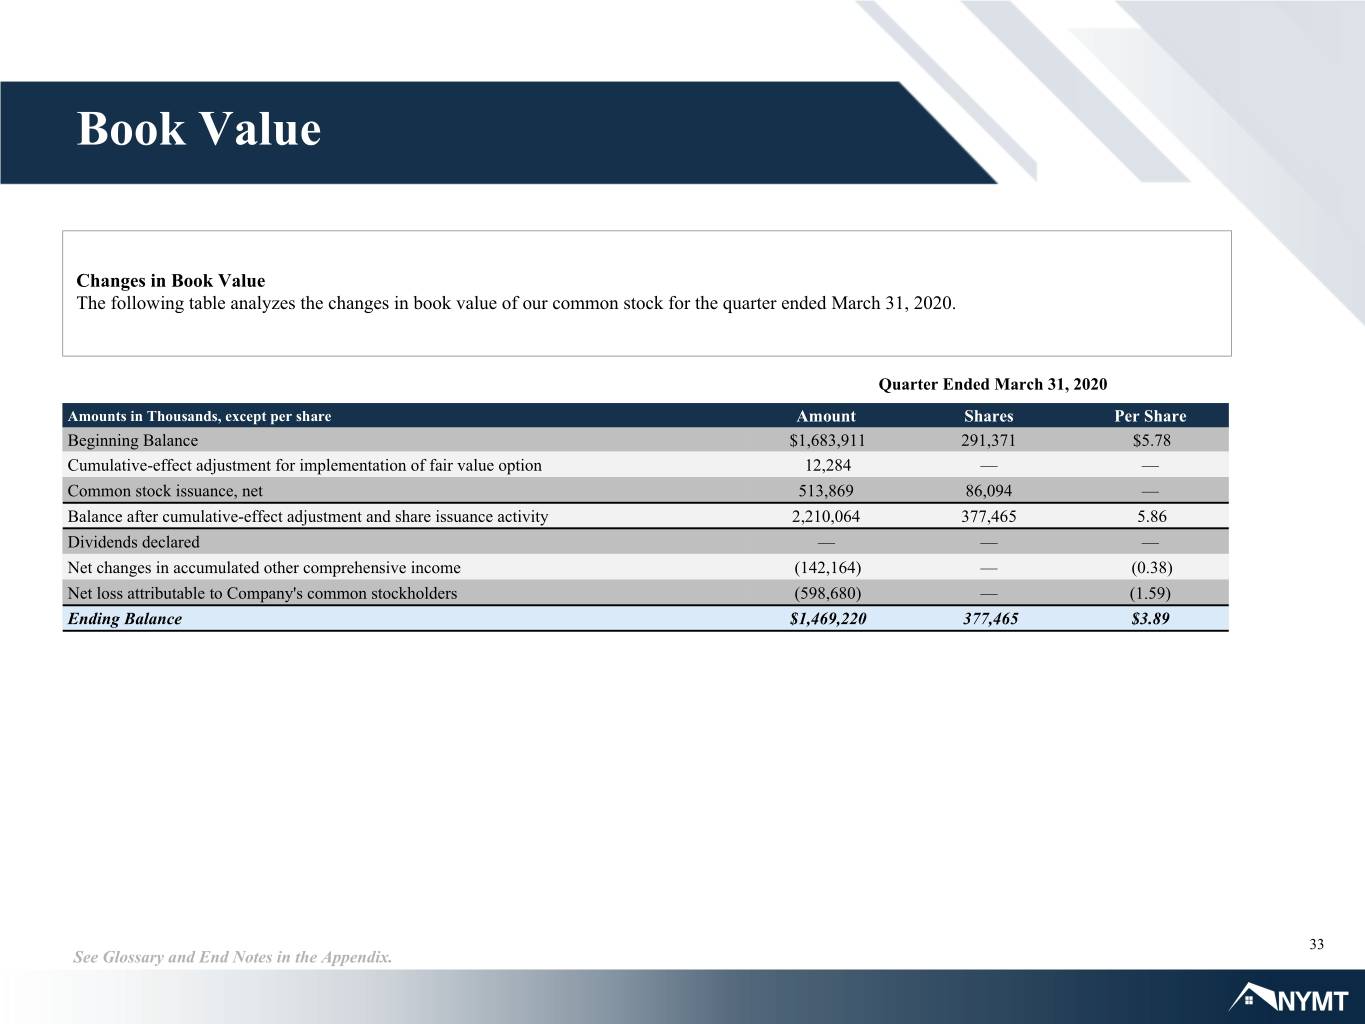
Book Value Changes in Book Value The following table analyzes the changes in book value of our common stock for the quarter ended March 31, 2020. Quarter Ended March 31, 2020 Amounts in Thousands, except per share Amount Shares Per Share Beginning Balance $1,683,911 291,371 $5.78 Cumulative-effect adjustment for implementation of fair value option 12,284 — — Common stock issuance, net 513,869 86,094 — Balance after cumulative-effect adjustment and share issuance activity 2,210,064 377,465 5.86 Dividends declared — — — Net changes in accumulated other comprehensive income (142,164) — (0.38) Net loss attributable to Company's common stockholders (598,680) — (1.59) Ending Balance $1,469,220 377,465 $3.89 33 See Glossary and End Notes in the Appendix.
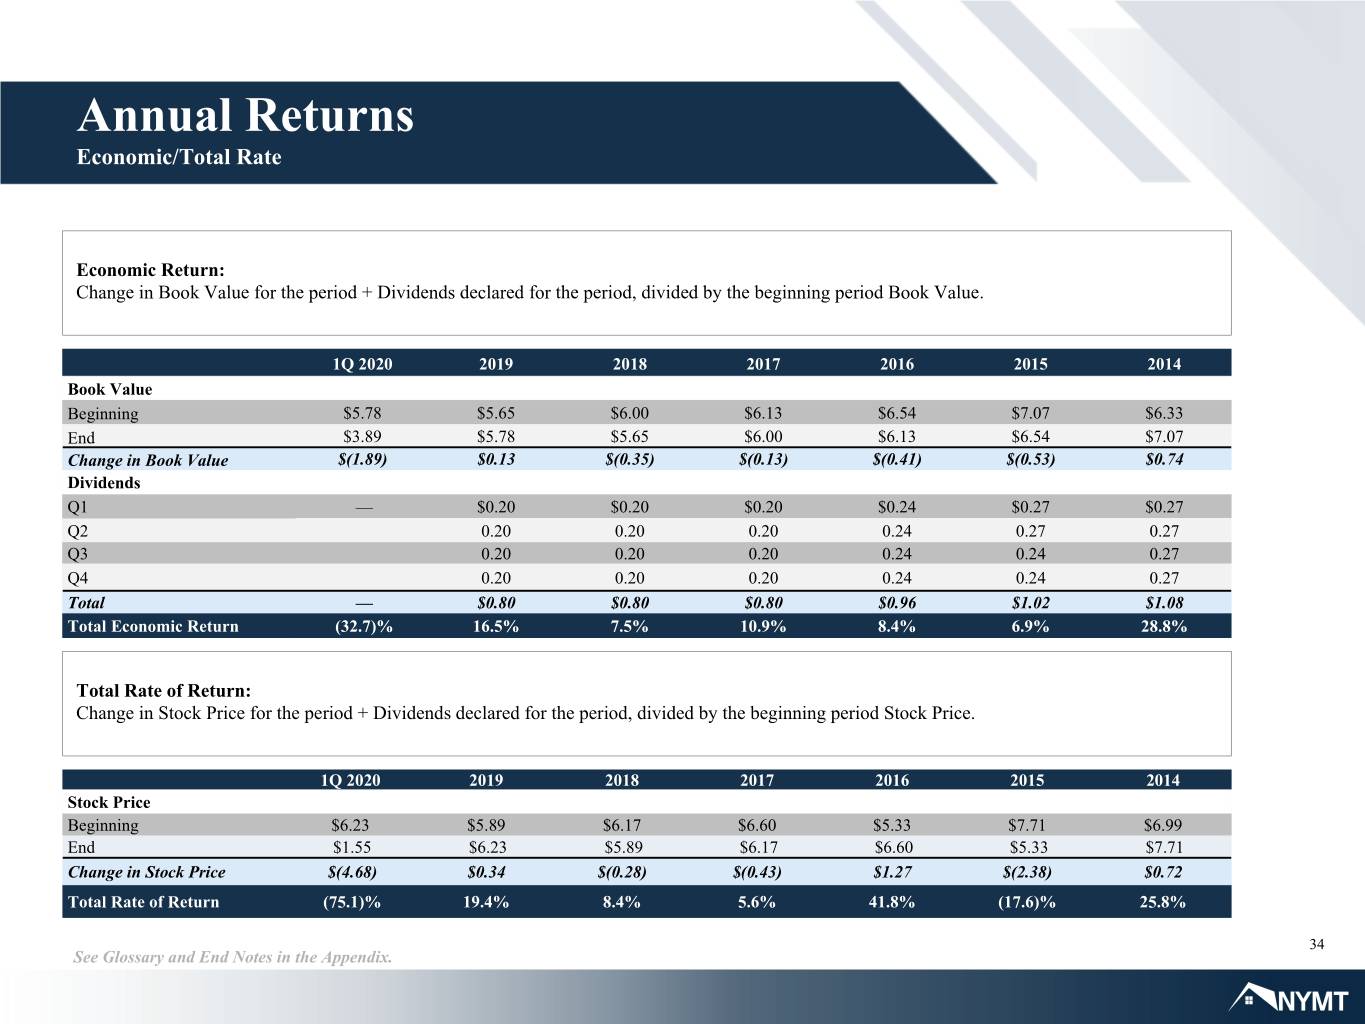
Annual Returns Economic/Total Rate Economic Return: Change in Book Value for the period + Dividends declared for the period, divided by the beginning period Book Value. 1Q 2020 2019 2018 2017 2016 2015 2014 Book Value Beginning $5.78 $5.65 $6.00 $6.13 $6.54 $7.07 $6.33 End $3.89 $5.78 $5.65 $6.00 $6.13 $6.54 $7.07 Change in Book Value $(1.89) $0.13 $(0.35) $(0.13) $(0.41) $(0.53) $0.74 Dividends Q1 — $0.20 $0.20 $0.20 $0.24 $0.27 $0.27 Q2 0.20 0.20 0.20 0.24 0.27 0.27 Q3 0.20 0.20 0.20 0.24 0.24 0.27 Q4 0.20 0.20 0.20 0.24 0.24 0.27 Total — $0.80 $0.80 $0.80 $0.96 $1.02 $1.08 Total Economic Return (32.7)% 16.5% 7.5% 10.9% 8.4% 6.9% 28.8% Total Rate of Return: Change in Stock Price for the period + Dividends declared for the period, divided by the beginning period Stock Price. 1Q 2020 2019 2018 2017 2016 2015 2014 Stock Price Beginning $6.23 $5.89 $6.17 $6.60 $5.33 $7.71 $6.99 End $1.55 $6.23 $5.89 $6.17 $6.60 $5.33 $7.71 Change in Stock Price $(4.68) $0.34 $(0.28) $(0.43) $1.27 $(2.38) $0.72 Total Rate of Return (75.1)% 19.4% 8.4% 5.6% 41.8% (17.6)% 25.8% 34 See Glossary and End Notes in the Appendix.
Appendix
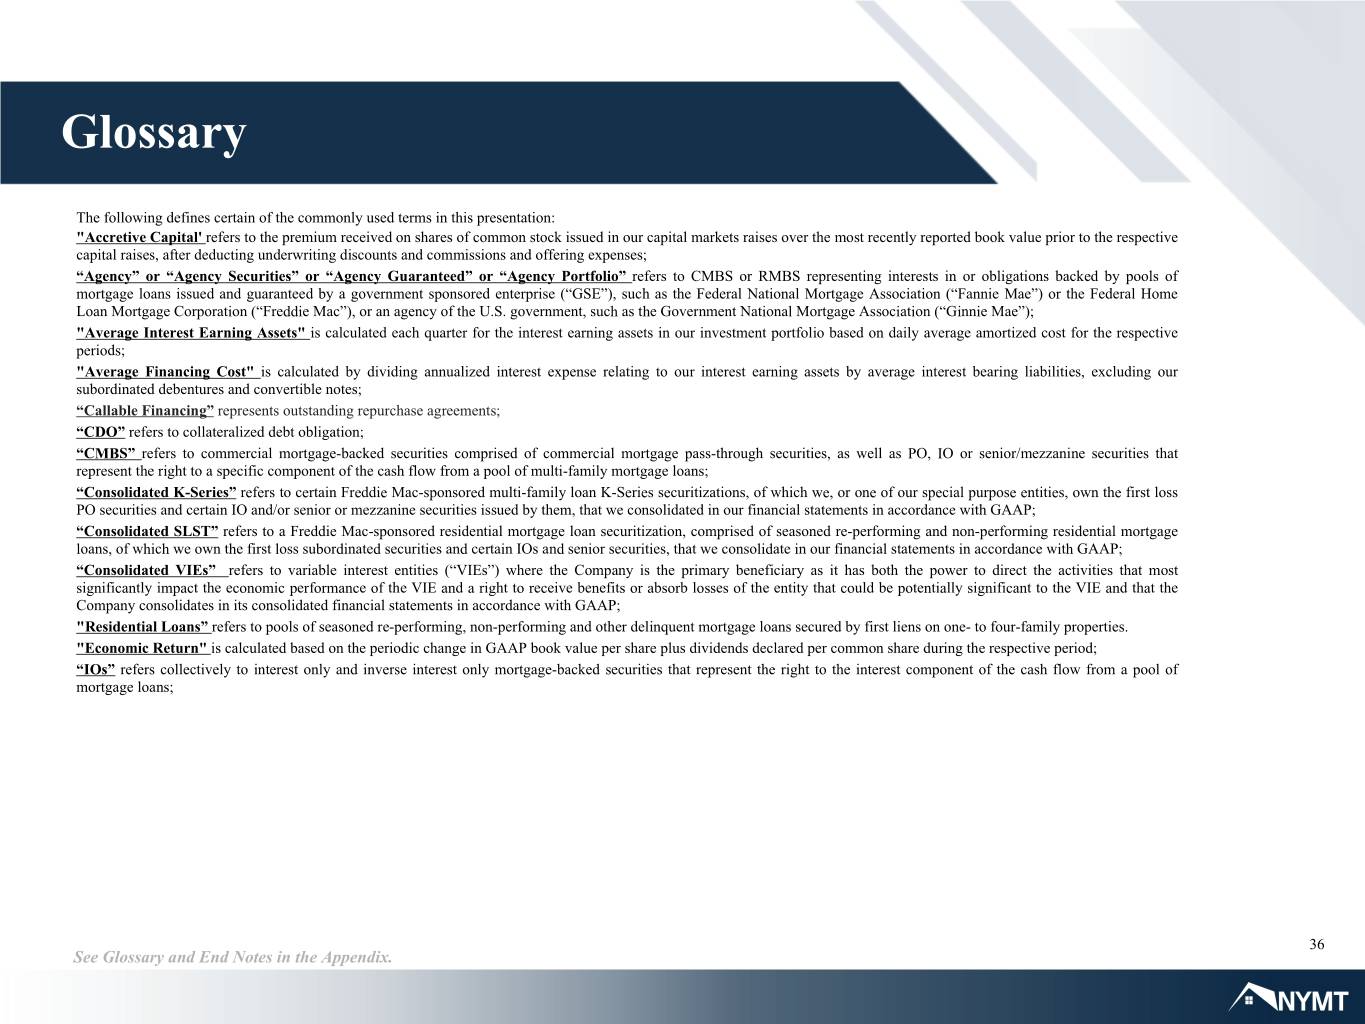
Glossary The following defines certain of the commonly used terms in this presentation: "Accretive Capital' refers to the premium received on shares of common stock issued in our capital markets raises over the most recently reported book value prior to the respective capital raises, after deducting underwriting discounts and commissions and offering expenses; “Agency” or “Agency Securities” or “Agency Guaranteed” or “Agency Portfolio” refers to CMBS or RMBS representing interests in or obligations backed by pools of mortgage loans issued and guaranteed by a government sponsored enterprise (“GSE”), such as the Federal National Mortgage Association (“Fannie Mae”) or the Federal Home Loan Mortgage Corporation (“Freddie Mac”), or an agency of the U.S. government, such as the Government National Mortgage Association (“Ginnie Mae”); "Average Interest Earning Assets" is calculated each quarter for the interest earning assets in our investment portfolio based on daily average amortized cost for the respective periods; "Average Financing Cost" is calculated by dividing annualized interest expense relating to our interest earning assets by average interest bearing liabilities, excluding our subordinated debentures and convertible notes; “Callable Financing” represents outstanding repurchase agreements; “CDO” refers to collateralized debt obligation; “CMBS” refers to commercial mortgage-backed securities comprised of commercial mortgage pass-through securities, as well as PO, IO or senior/mezzanine securities that represent the right to a specific component of the cash flow from a pool of multi-family mortgage loans; “Consolidated K-Series” refers to certain Freddie Mac-sponsored multi-family loan K-Series securitizations, of which we, or one of our special purpose entities, own the first loss PO securities and certain IO and/or senior or mezzanine securities issued by them, that we consolidated in our financial statements in accordance with GAAP; “Consolidated SLST” refers to a Freddie Mac-sponsored residential mortgage loan securitization, comprised of seasoned re-performing and non-performing residential mortgage loans, of which we own the first loss subordinated securities and certain IOs and senior securities, that we consolidate in our financial statements in accordance with GAAP; “Consolidated VIEs” refers to variable interest entities (“VIEs”) where the Company is the primary beneficiary as it has both the power to direct the activities that most significantly impact the economic performance of the VIE and a right to receive benefits or absorb losses of the entity that could be potentially significant to the VIE and that the Company consolidates in its consolidated financial statements in accordance with GAAP; "Residential Loans” refers to pools of seasoned re-performing, non-performing and other delinquent mortgage loans secured by first liens on one- to four-family properties. "Economic Return" is calculated based on the periodic change in GAAP book value per share plus dividends declared per common share during the respective period; “IOs” refers collectively to interest only and inverse interest only mortgage-backed securities that represent the right to the interest component of the cash flow from a pool of mortgage loans; 36 See Glossary and End Notes in the Appendix.
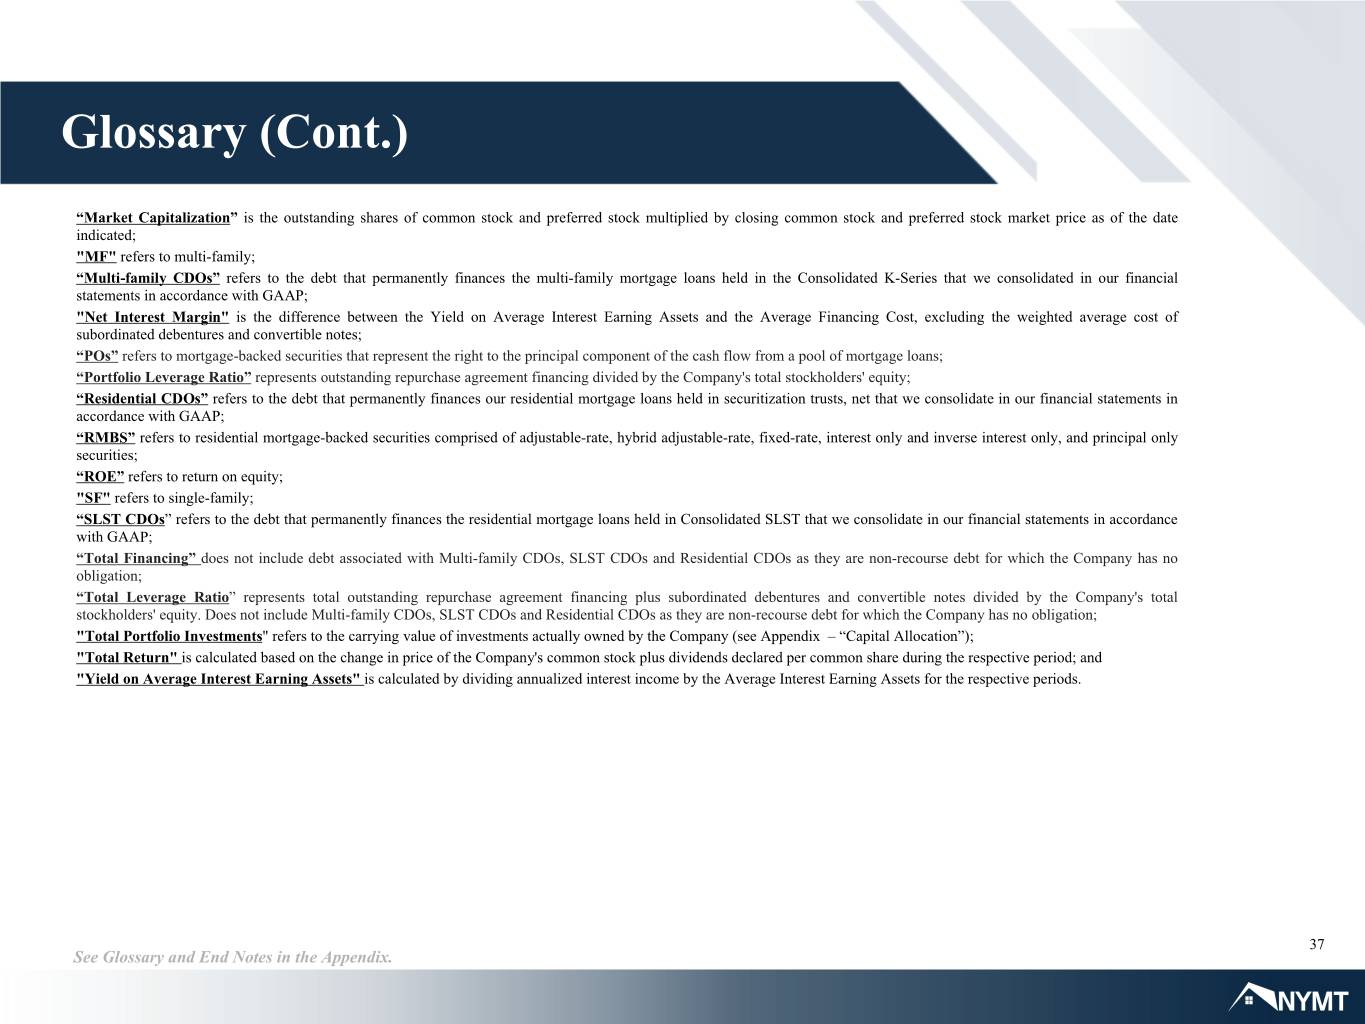
Glossary (Cont.) “Market Capitalization” is the outstanding shares of common stock and preferred stock multiplied by closing common stock and preferred stock market price as of the date indicated; "MF" refers to multi-family; “Multi-family CDOs” refers to the debt that permanently finances the multi-family mortgage loans held in the Consolidated K-Series that we consolidated in our financial statements in accordance with GAAP; "Net Interest Margin" is the difference between the Yield on Average Interest Earning Assets and the Average Financing Cost, excluding the weighted average cost of subordinated debentures and convertible notes; “POs” refers to mortgage-backed securities that represent the right to the principal component of the cash flow from a pool of mortgage loans; “Portfolio Leverage Ratio” represents outstanding repurchase agreement financing divided by the Company's total stockholders' equity; “Residential CDOs” refers to the debt that permanently finances our residential mortgage loans held in securitization trusts, net that we consolidate in our financial statements in accordance with GAAP; “RMBS” refers to residential mortgage-backed securities comprised of adjustable-rate, hybrid adjustable-rate, fixed-rate, interest only and inverse interest only, and principal only securities; “ROE” refers to return on equity; "SF" refers to single-family; “SLST CDOs” refers to the debt that permanently finances the residential mortgage loans held in Consolidated SLST that we consolidate in our financial statements in accordance with GAAP; “Total Financing” does not include debt associated with Multi-family CDOs, SLST CDOs and Residential CDOs as they are non-recourse debt for which the Company has no obligation; “Total Leverage Ratio” represents total outstanding repurchase agreement financing plus subordinated debentures and convertible notes divided by the Company's total stockholders' equity. Does not include Multi-family CDOs, SLST CDOs and Residential CDOs as they are non-recourse debt for which the Company has no obligation; "Total Portfolio Investments" refers to the carrying value of investments actually owned by the Company (see Appendix – “Capital Allocation”); "Total Return" is calculated based on the change in price of the Company's common stock plus dividends declared per common share during the respective period; and "Yield on Average Interest Earning Assets" is calculated by dividing annualized interest income by the Average Interest Earning Assets for the respective periods. 37 See Glossary and End Notes in the Appendix.
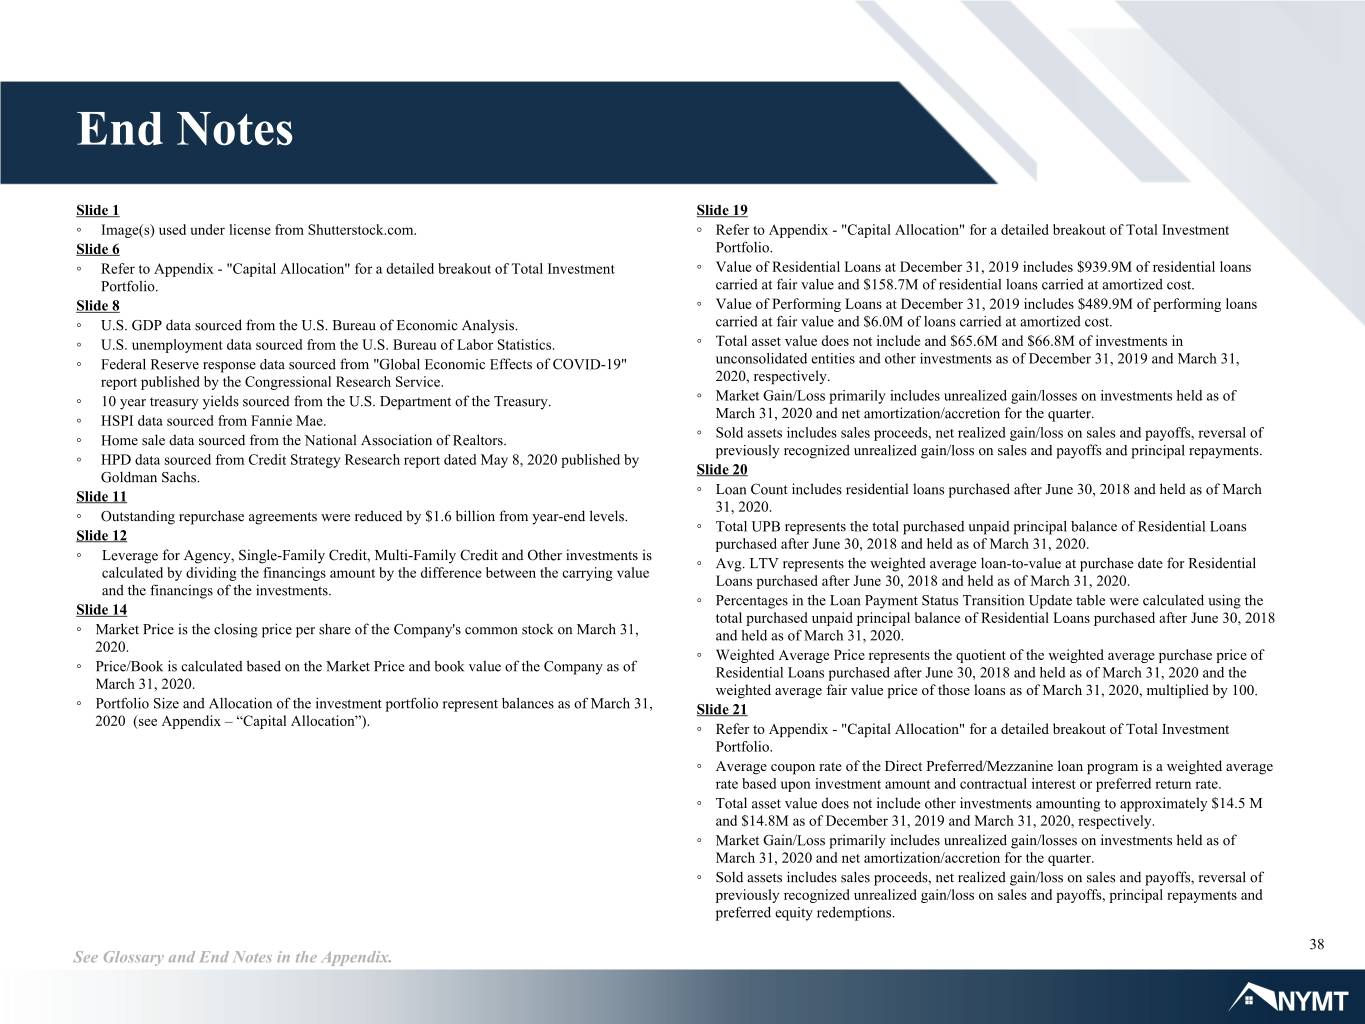
End Notes Slide 1 Slide 19 ◦ Image(s) used under license from Shutterstock.com. ◦ Refer to Appendix - "Capital Allocation" for a detailed breakout of Total Investment Slide 6 Portfolio. ◦ Refer to Appendix - "Capital Allocation" for a detailed breakout of Total Investment ◦ Value of Residential Loans at December 31, 2019 includes $939.9M of residential loans Portfolio. carried at fair value and $158.7M of residential loans carried at amortized cost. Slide 8 ◦ Value of Performing Loans at December 31, 2019 includes $489.9M of performing loans ◦ U.S. GDP data sourced from the U.S. Bureau of Economic Analysis. carried at fair value and $6.0M of loans carried at amortized cost. ◦ U.S. unemployment data sourced from the U.S. Bureau of Labor Statistics. ◦ Total asset value does not include and $65.6M and $66.8M of investments in ◦ Federal Reserve response data sourced from "Global Economic Effects of COVID-19" unconsolidated entities and other investments as of December 31, 2019 and March 31, report published by the Congressional Research Service. 2020, respectively. ◦ 10 year treasury yields sourced from the U.S. Department of the Treasury. ◦ Market Gain/Loss primarily includes unrealized gain/losses on investments held as of ◦ HSPI data sourced from Fannie Mae. March 31, 2020 and net amortization/accretion for the quarter. ◦ Home sale data sourced from the National Association of Realtors. ◦ Sold assets includes sales proceeds, net realized gain/loss on sales and payoffs, reversal of previously recognized unrealized gain/loss on sales and payoffs and principal repayments. ◦ HPD data sourced from Credit Strategy Research report dated May 8, 2020 published by Slide 20 Goldman Sachs. Slide 11 ◦ Loan Count includes residential loans purchased after June 30, 2018 and held as of March 31, 2020. ◦ Outstanding repurchase agreements were reduced by $1.6 billion from year-end levels. ◦ Total UPB represents the total purchased unpaid principal balance of Residential Loans Slide 12 purchased after June 30, 2018 and held as of March 31, 2020. ◦ Leverage for Agency, Single-Family Credit, Multi-Family Credit and Other investments is ◦ Avg. LTV represents the weighted average loan-to-value at purchase date for Residential calculated by dividing the financings amount by the difference between the carrying value Loans purchased after June 30, 2018 and held as of March 31, 2020. and the financings of the investments. ◦ Percentages in the Loan Payment Status Transition Update table were calculated using the Slide 14 total purchased unpaid principal balance of Residential Loans purchased after June 30, 2018 ◦ Market Price is the closing price per share of the Company's common stock on March 31, and held as of March 31, 2020. 2020. ◦ Weighted Average Price represents the quotient of the weighted average purchase price of ◦ Price/Book is calculated based on the Market Price and book value of the Company as of Residential Loans purchased after June 30, 2018 and held as of March 31, 2020 and the March 31, 2020. weighted average fair value price of those loans as of March 31, 2020, multiplied by 100. ◦ Portfolio Size and Allocation of the investment portfolio represent balances as of March 31, Slide 21 2020 (see Appendix – “Capital Allocation”). ◦ Refer to Appendix - "Capital Allocation" for a detailed breakout of Total Investment Portfolio. ◦ Average coupon rate of the Direct Preferred/Mezzanine loan program is a weighted average rate based upon investment amount and contractual interest or preferred return rate. ◦ Total asset value does not include other investments amounting to approximately $14.5 M and $14.8M as of December 31, 2019 and March 31, 2020, respectively. ◦ Market Gain/Loss primarily includes unrealized gain/losses on investments held as of March 31, 2020 and net amortization/accretion for the quarter. ◦ Sold assets includes sales proceeds, net realized gain/loss on sales and payoffs, reversal of previously recognized unrealized gain/loss on sales and payoffs, principal repayments and preferred equity redemptions. 38 See Glossary and End Notes in the Appendix.
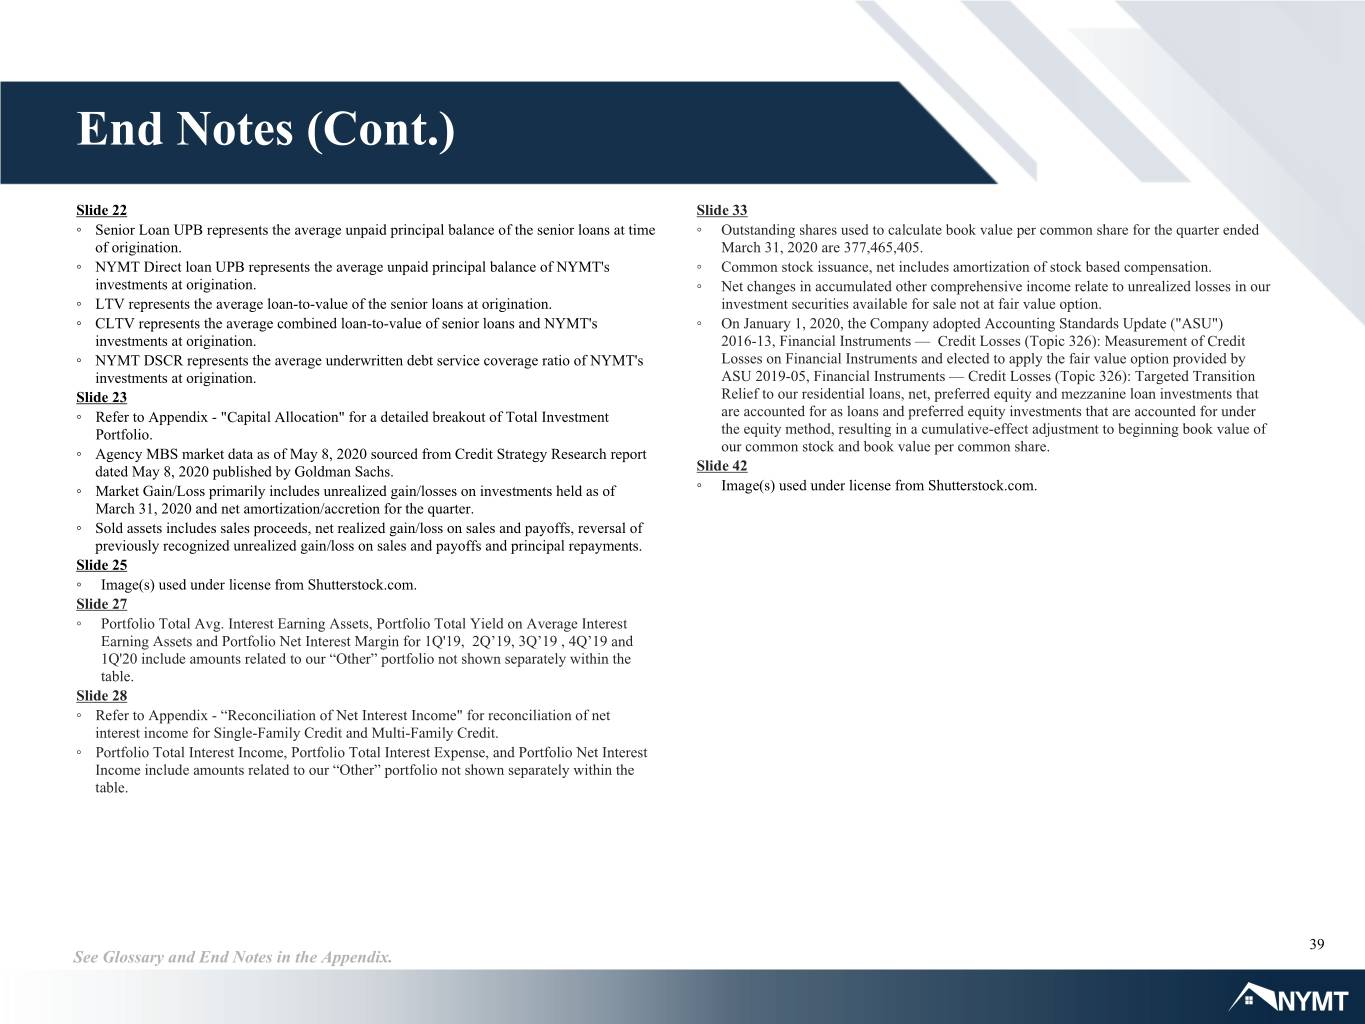
End Notes (Cont.) Slide 22 Slide 33 ◦ Senior Loan UPB represents the average unpaid principal balance of the senior loans at time ◦ Outstanding shares used to calculate book value per common share for the quarter ended of origination. March 31, 2020 are 377,465,405. ◦ NYMT Direct loan UPB represents the average unpaid principal balance of NYMT's ◦ Common stock issuance, net includes amortization of stock based compensation. investments at origination. ◦ Net changes in accumulated other comprehensive income relate to unrealized losses in our ◦ LTV represents the average loan-to-value of the senior loans at origination. investment securities available for sale not at fair value option. ◦ CLTV represents the average combined loan-to-value of senior loans and NYMT's ◦ On January 1, 2020, the Company adopted Accounting Standards Update ("ASU") investments at origination. 2016-13, Financial Instruments — Credit Losses (Topic 326): Measurement of Credit ◦ NYMT DSCR represents the average underwritten debt service coverage ratio of NYMT's Losses on Financial Instruments and elected to apply the fair value option provided by investments at origination. ASU 2019-05, Financial Instruments — Credit Losses (Topic 326): Targeted Transition Slide 23 Relief to our residential loans, net, preferred equity and mezzanine loan investments that ◦ Refer to Appendix - "Capital Allocation" for a detailed breakout of Total Investment are accounted for as loans and preferred equity investments that are accounted for under Portfolio. the equity method, resulting in a cumulative-effect adjustment to beginning book value of ◦ Agency MBS market data as of May 8, 2020 sourced from Credit Strategy Research report our common stock and book value per common share. dated May 8, 2020 published by Goldman Sachs. Slide 42 ◦ Market Gain/Loss primarily includes unrealized gain/losses on investments held as of ◦ Image(s) used under license from Shutterstock.com. March 31, 2020 and net amortization/accretion for the quarter. ◦ Sold assets includes sales proceeds, net realized gain/loss on sales and payoffs, reversal of previously recognized unrealized gain/loss on sales and payoffs and principal repayments. Slide 25 ◦ Image(s) used under license from Shutterstock.com. Slide 27 ◦ Portfolio Total Avg. Interest Earning Assets, Portfolio Total Yield on Average Interest Earning Assets and Portfolio Net Interest Margin for 1Q'19, 2Q’19, 3Q’19 , 4Q’19 and 1Q'20 include amounts related to our “Other” portfolio not shown separately within the table. Slide 28 ◦ Refer to Appendix - “Reconciliation of Net Interest Income" for reconciliation of net interest income for Single-Family Credit and Multi-Family Credit. ◦ Portfolio Total Interest Income, Portfolio Total Interest Expense, and Portfolio Net Interest Income include amounts related to our “Other” portfolio not shown separately within the table. 39 See Glossary and End Notes in the Appendix.
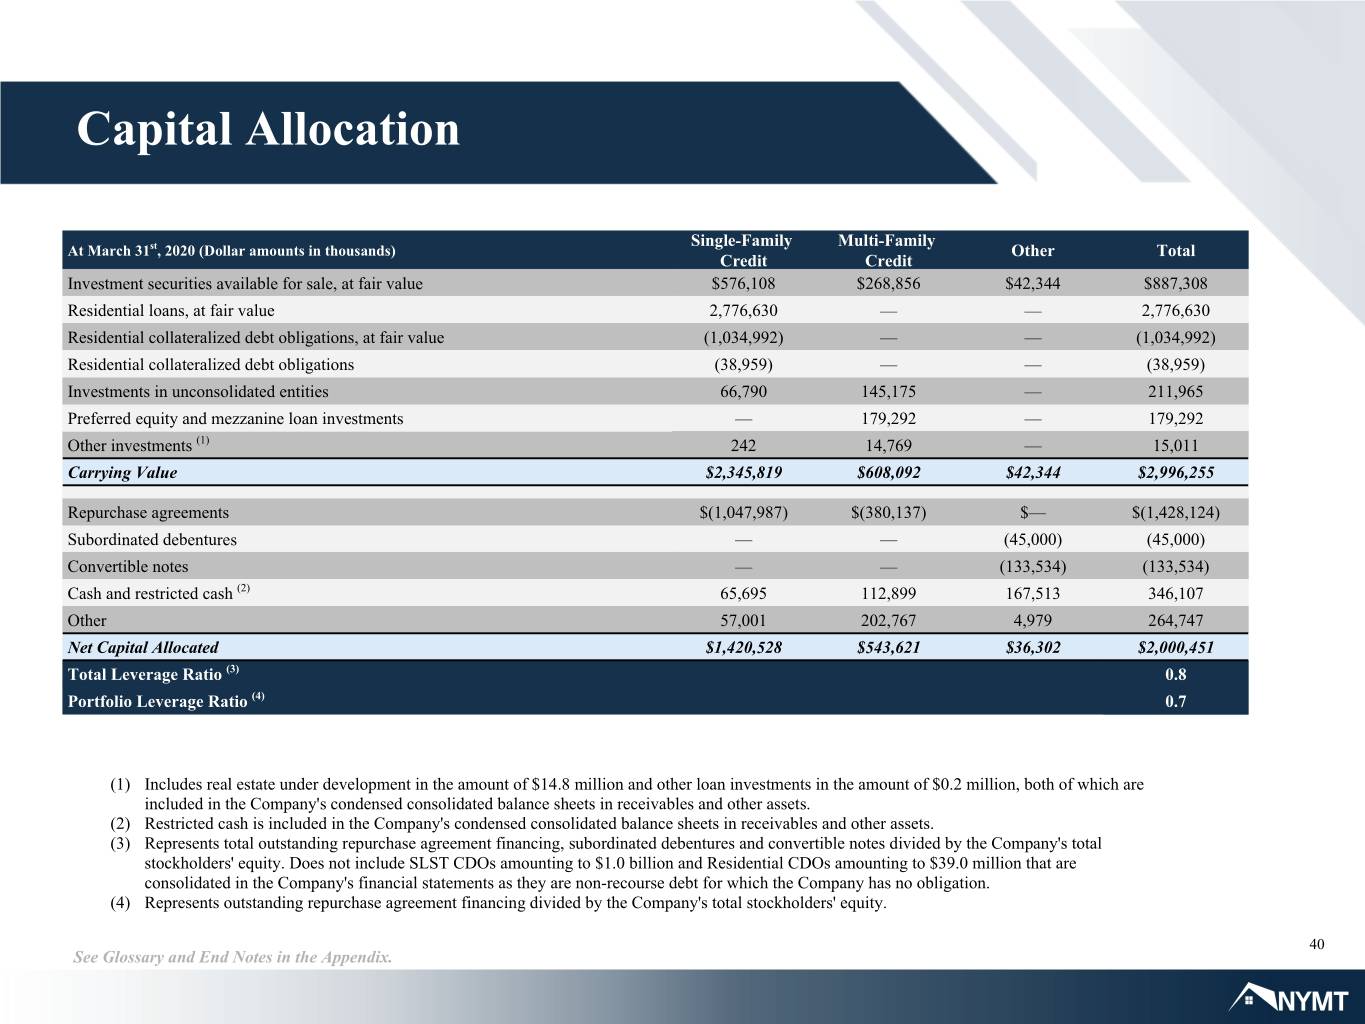
Capital Allocation Single-Family Multi-Family At March 31st, 2020 (Dollar amounts in thousands) Other Total Credit Credit Investment securities available for sale, at fair value $576,108 $268,856 $42,344 $887,308 Residential loans, at fair value 2,776,630 — — 2,776,630 Residential collateralized debt obligations, at fair value (1,034,992) — — (1,034,992) Residential collateralized debt obligations (38,959) — — (38,959) Investments in unconsolidated entities 66,790 145,175 — 211,965 Preferred equity and mezzanine loan investments — 179,292 — 179,292 Other investments (1) 242 14,769 — 15,011 Carrying Value $2,345,819 $608,092 $42,344 $2,996,255 Repurchase agreements $(1,047,987) $(380,137) $— $(1,428,124) Subordinated debentures — — (45,000) (45,000) Convertible notes — — (133,534) (133,534) Cash and restricted cash (2) 65,695 112,899 167,513 346,107 Other 57,001 202,767 4,979 264,747 Net Capital Allocated $1,420,528 $543,621 $36,302 $2,000,451 Total Leverage Ratio (3) 0.8 Portfolio Leverage Ratio (4) 0.7 (1) Includes real estate under development in the amount of $14.8 million and other loan investments in the amount of $0.2 million, both of which are included in the Company's condensed consolidated balance sheets in receivables and other assets. (2) Restricted cash is included in the Company's condensed consolidated balance sheets in receivables and other assets. (3) Represents total outstanding repurchase agreement financing, subordinated debentures and convertible notes divided by the Company's total stockholders' equity. Does not include SLST CDOs amounting to $1.0 billion and Residential CDOs amounting to $39.0 million that are consolidated in the Company's financial statements as they are non-recourse debt for which the Company has no obligation. (4) Represents outstanding repurchase agreement financing divided by the Company's total stockholders' equity. 40 See Glossary and End Notes in the Appendix.
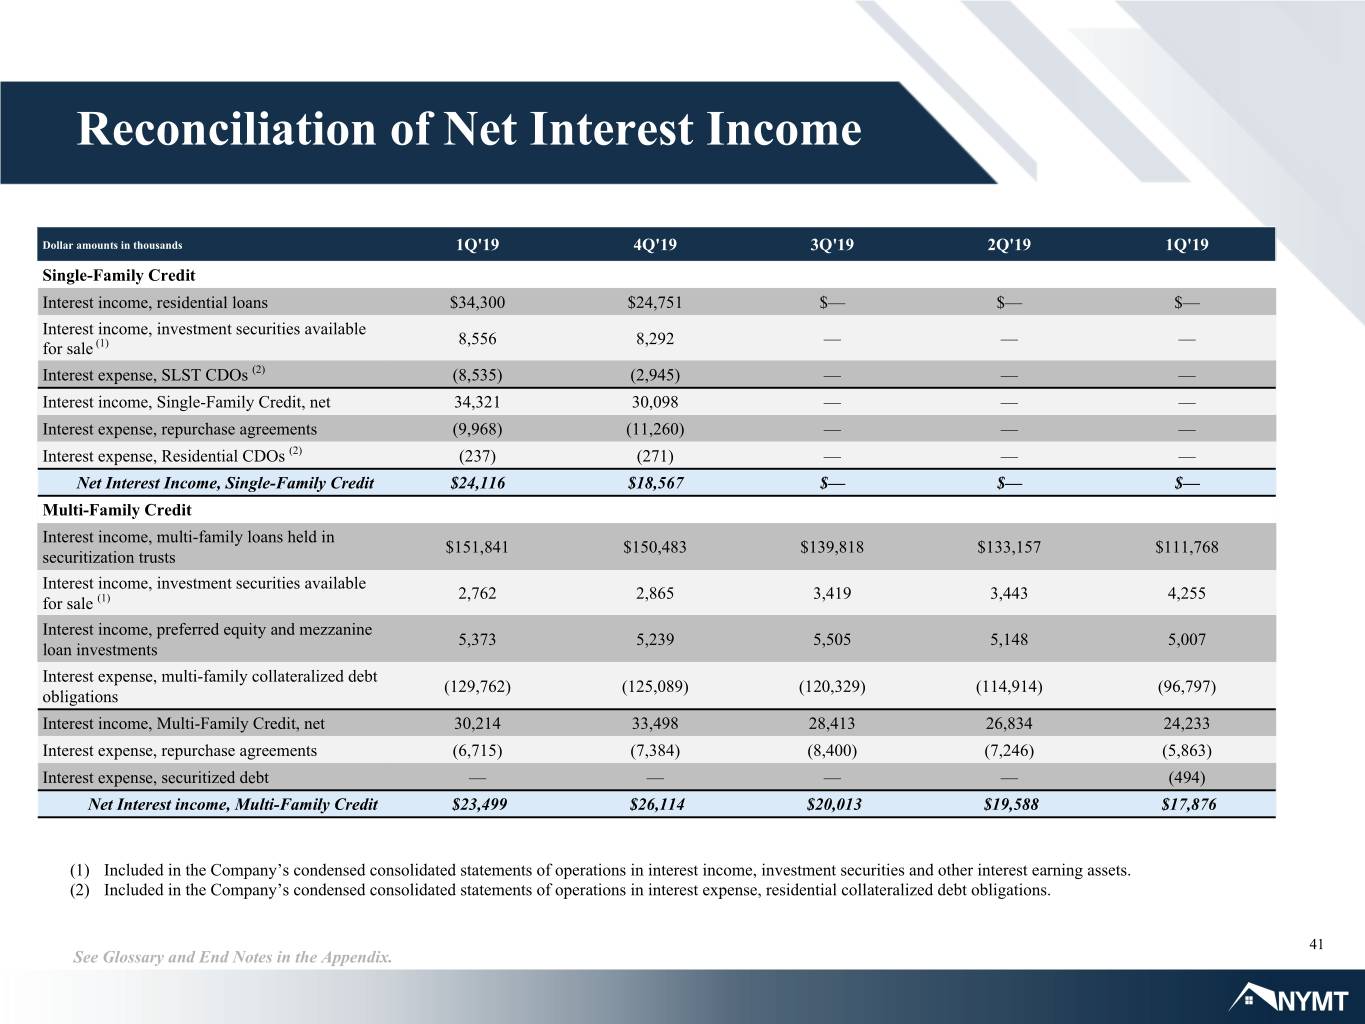
Reconciliation of Net Interest Income Dollar amounts in thousands 1Q'19 4Q'19 3Q'19 2Q'19 1Q'19 Single-Family Credit Interest income, residential loans $34,300 $24,751 $— $— $— Interest income, investment securities available 8,556 8,292 — — — for sale (1) Interest expense, SLST CDOs (2) (8,535) (2,945) — — — Interest income, Single-Family Credit, net 34,321 30,098 — — — Interest expense, repurchase agreements (9,968) (11,260) — — — Interest expense, Residential CDOs (2) (237) (271) — — — Net Interest Income, Single-Family Credit $24,116 $18,567 $— $— $— Multi-Family Credit Interest income, multi-family loans held in $151,841 $150,483 $139,818 $133,157 $111,768 securitization trusts Interest income, investment securities available 2,762 2,865 3,419 3,443 4,255 for sale (1) Interest income, preferred equity and mezzanine 5,373 5,239 5,505 5,148 5,007 loan investments Interest expense, multi-family collateralized debt (129,762) (125,089) (120,329) (114,914) (96,797) obligations Interest income, Multi-Family Credit, net 30,214 33,498 28,413 26,834 24,233 Interest expense, repurchase agreements (6,715) (7,384) (8,400) (7,246) (5,863) Interest expense, securitized debt — — — — (494) Net Interest income, Multi-Family Credit $23,499 $26,114 $20,013 $19,588 $17,876 (1) Included in the Company’s condensed consolidated statements of operations in interest income, investment securities and other interest earning assets. (2) Included in the Company’s condensed consolidated statements of operations in interest expense, residential collateralized debt obligations. 41 See Glossary and End Notes in the Appendix.

Thank You From all of us at NYMT
