Attached files
| file | filename |
|---|---|
| 8-K - FORM 8-K - SELECTIVE INSURANCE GROUP INC | tm2020231d1_8k.htm |
Exhibit 99.1

1 INVESTOR PRESENTATION FIRST QUARTER 2020

2 SAFE HARBOR STATEMENT In this presentation, we make certain statements and reference other information that are “forward - looking statements” as define d in the Private Securities Litigation Reform Act of 1995 (“PSLRA”). The PSLRA provides a safe harbor under the Securities Act of 1933, as am end ed, and the Securities Exchange Act of 1934, as amended, for forward - looking statements that relate to our intentions, beliefs, projections, estimations, or forecasts of future events or our future financial performance. Forward - looking statements involve known and unknown risks, unc ertainties, and other factors that may result in materially differing actual results. We can give no assurance that our expectations express ed in forward - looking statements will prove to be correct. Factors that could cause our actual results to differ materially from those projected, forecasted, or estimated by us in forw ard - looking statements are discussed in further detail in Selective’s public filings with the United States Securities and Exchange Commission. We und ertake no obligation to publicly update or revise any forward - looking statements – whether as a result of new information, future events o r otherwise – other than as the federal securities laws may require. This presentation also includes certain non - GAAP financial measures within the meaning of Regulation G, including “non - GAAP oper ating earnings per share,” “non - GAAP operating income,” and “non - GAAP operating return on equity.” Definitions of these non - GAAP meas ures and a reconciliation to the most comparable GAAP figures pursuant to Regulation G are available in our Annual Report on Form 10 - K an d our Supplemental Investor Package, which can be found on our website < www.selective.com > under “Investors/Reports, Earnings and Presentations.” We believe investors and other interested persons find these measurements beneficial and useful. We have co nsi stently provided these financial measurements in previous investor communications so they have a consistent basis for comparing our r esu lts between quarters and with our industry competitors. These non - GAAP measures, however, may not be comparable to similarly titled measure s used outside of the insurance industry. Investors are cautioned not to place undue reliance on these non - GAAP measures in assessing our overall financial performance. SAFE HARBOR STATEMENT

3 OVERVIEW

4 2019 Non - GAAP Operating ROE OF 13.3%* State Footprint ** 27 Market Cap (as of 5/18/2020) $3.0B Years of Financial Strength and Superior Execution 90+ 2019 NPW ( up 7% Y/Y ) $ 2.7B 2019 GAAP Combined Ratio 93.7% A TRACK RECORD OF SUPERIOR EXECUTION STRONG UNDERWRITING PERFORMANCE WITH SIX CONSECUTIVE YEARS OF DOUBLE - DIGIT ROES *Refer to “Safe Harbor Statement” on page 2 of this presentation for further detail regarding certain non - GAAP financial measures . **State Footprint refers to Commercial Lines only
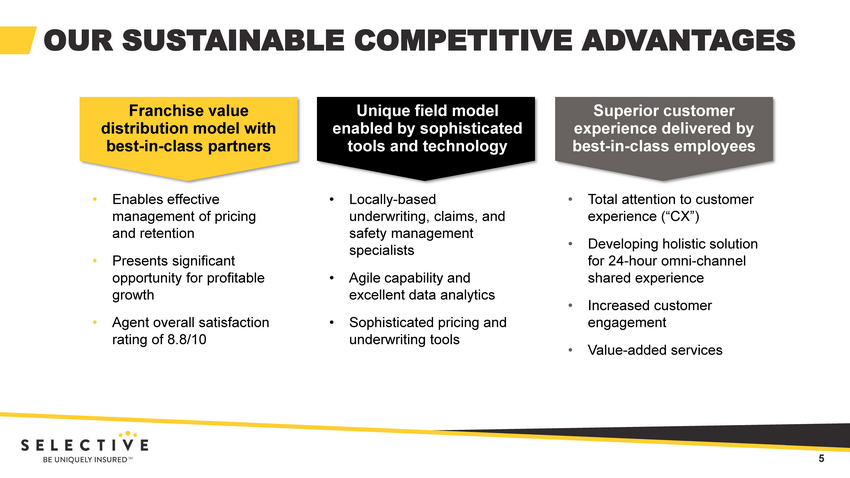
5 • Enables effective management of pricing and retention • Presents significant opportunity for profitable growth • Agent overall satisfaction rating of 8.8/10 • Locally - based underwriting, claims, and safety management specialists • Agile capability and excellent data analytics • Sophisticated pricing and underwriting tools • Total attention to customer experience (“CX”) • Developing holistic solution for 24 - hour omni - channel shared experience • Increased customer engagement • Value - added services Franchise value distribution model with best - in - class partners Unique field model enabled by sophisticated tools and technology Superior customer experience delivered by best - in - class employees OUR SUSTAINABLE COMPETITIVE ADVANTAGES

6 SUMMARY OF OUR OPERATIONS Commercial Lines (80% of NPW) • Focused on disciplined growth • Strong calendar year profitability; Commercial Auto improving, but remains an area of focus • Drivers of profitability include strong new business growth and retention, and accelerating renewal pure price increases Personal Lines (11% of NPW) • Targeting a 90% homeowners combined ratio in a normal CAT year (~14 points) • Competitive market conditions hurting personal auto growth • Third largest “Write Your Own” National Flood Insurance Program participant; partial hedge for catastrophe losses Excess & Surplus (9% of NPW) • Focus on achieving target combined ratio ; top - line will depend on market conditions • “E&S light” product mix • Margin improvement through targeted price increases, exiting challenged segments, and claim outcome improvements
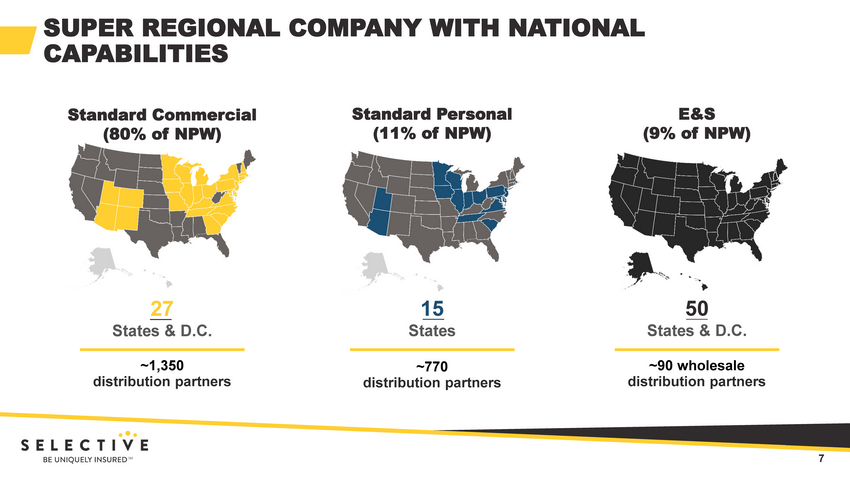
7 SUPER REGIONAL COMPANY WITH NATIONAL CAPABILITIES ~1,350 distribution partners ~ 770 distribution partners Standard Commercial (80% of NPW) Standard Personal (11% of NPW) E&S (9% of NPW) ~90 wholesale distribution partners Note: NPW breakdown as of full - year 2019 27 States & D.C. 15 States 50 States & D.C.
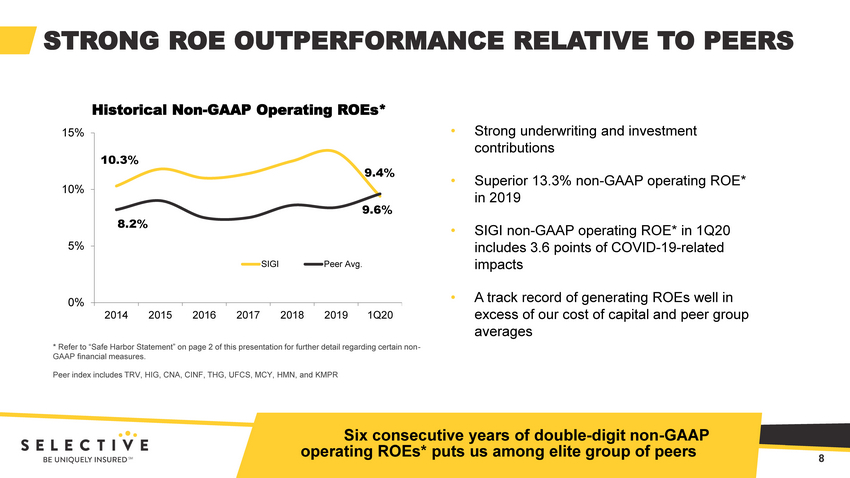
8 STRONG ROE OUTPERFORMANCE RELATIVE TO PEERS Historical Non - GAAP Operating ROEs* Peer index includes TRV, HIG, CNA, CINF, THG, UFCS, MCY, HMN, and KMPR * Refer to “Safe Harbor Statement” on page 2 of this presentation for further detail regarding certain non - GAAP financial measures. 10.3% 9.4% 8.2% 9.6% 0% 5% 10% 15% 2014 2015 2016 2017 2018 2019 1Q20 SIGI Peer Avg. • Strong underwriting and investment contributions • Superior 13.3% non - GAAP operating ROE* in 2019 • SIGI non - GAAP operating ROE* in 1Q20 includes 3.6 points of COVID - 19 - related impacts • A track record of generating ROEs well in excess of our cost of capital and peer group averages PAGE 8 Six consecutive years of double - digit non - GAAP operating ROEs* puts us among elite group of peers

9 EXCELLENT HISTORICAL OPERATING RESULTS 95.2% 92.9% 92.5% ** 95.8% 93.7% 97.0% 85% 90% 95% 100% 2014 2015 2016 2017 2018 2019 2020F** Underlying Combined Ratio* Reported Combined Ratio 2020 UPDATED GUIDANCE (INCLUDING ESTIMATED COVID - 19 IMPACT): • Underlying combined r atio between 92% and 93% (assuming no prior year casualty reserve development) • Catastrophe losses of 4.5% • $160 million of after - tax net investment income • 18.5% tax rate • 60.5 million outstanding shares Guidance for 2020 includes estimated impact from COVID - 19 on financial results * Underlying GAAP combined ratio excludes catastrophe losses and prior year casualty reserve development Historical GAAP Combined Ratios ** 2020F u nderlying combined ratio is the midpoint of guidance range of 92.0% - 93.0%

10 MAJOR UPDATES TO 2020 GUIDANCE Our 2020 guidance reflects the current estimated full - year impact of COVID - 19 on our industry and our insurance and investment operations: • A GAAP combined ratio (excluding catastrophe losses) of 92.0% - 93.0%, an increase from prior guidance of 91.5%, primarily due to expense ratio pressure from the estimated full - year impact of COVID - 19. Assumes no additional prior - year development • Catastrophe losses of 4.5 points, an increase from prior guidance of 3.5 points, reflecting higher than expected year - to - date losses including $35M for two storms in April, and lower expected earned premium • After - tax net investment income of approximately $ 160M, down from prior guidance of $185M, reflecting expectations for $10M - $15M in after - tax net investment losses from our alternative investments

11 IMPACT OF COVID - 19 ON 1Q RESULTS Pre - Tax Income ($ in M) EPS Combined Ratio ROE • Bad Debt Expense $ (10.5) $ (0.14) 1.6 pts (1.6 pts) • Property Incurred but not Reported (IBNR) $ (10.0) $ (0.13) 1.5 pts (1.5 pts) • Return Premium Accrual ($75M) $ (3.9) $ (0.05) 0.5 pts (0.6 pts) TOTAL COVID - 19 IMPACT $ (24.4) $ (0.32) 3.5 pts (3.6 pts) May not foot due to rounding.

12 MANAGEABLE UNDERWRITING COVID - 19 - RELATED EXPOSURE Standard Commercial Lines • All property and business owner policies require “direct physical damage,” and have specific exclusions for virus and bacteria • Approximately 6% of policies have sub - limited, extra expense coverage for up to $25K for property cleanup (included in $10M IBNR established in 1Q) • Limited exposure to workers compensation for healthcare and first responders Excess & Surplus • Property accounts for ~30% of our E&S book, and only ~25 % of property policies include business interruption coverage • All property policies require “direct physical damage” to property to trigger business interruption exposure • Book comprised primarily of small, low hazard risks, with focus on contractors and habitational classes Reinsurance Protection • Main catastrophe XOL program has $735M of coverage in excess of $40M retention • Retention drops to $5M for non - footprint states (including some of our largest E&S states) • Casualty reinsurance contract provides $88M of coverage in excess of $2M retention for workers compensation and general liability

13 OUR STRATEGIC INITIATIVES

14 Deploy sophisticated underwriting and pricing tools to achieve price increases ≥ loss trends Expanding “share of wallet” and new agent appointments; geo - expansion Continue to deliver superior omni - channel customer experience CONTINUED PROFITABLE GROWTH LEVERAGE SOPHISTICATED TOOLS TO ACHIEVE ADEQUATE PRICING EXCELLENT CUSTOMER SERVICE OUR MAJOR STRATEGIC INITIATIVES CULTURE FOCUSED ON INNOVATION AND SUSTAINABILITY A culture of innovation and ideation , built around principles of sustainability

15 CONSISTENTLY ACHIEVING PRICE INCREASES IN ALIGNMENT WITH LOSS TREND • Selective’s renewal pure price increases exceeded industry averages between 2009 and 2018 • Commercial Lines cumulative renewal pure price between 2015 and 2019 was ~16.5% vs. ~8% for CLIPS index • Ability to obtain appropriate price enabled by: • Strong distribution partner relationships • Sophisticated tools and actionable data • Culture of underwriting discipline 85% 76% 80% 84% 88% -2.0% 2.0% 6.0% 2009 2010 2011 2012 2013 2014 2015 2016 2017 2018 2019 YTD 2020 SIGI Pricing CLIPS Pricing SIGI Retention CLIPS: Willis Towers Watson Commercial Lines Insurance Pricing Survey Retention (%) Renewal Pure Price (%) April 2020 Commercial Lines renewal pure price increases of 4%, in line with first quarter average

16 A GRANULAR APPROACH TO PRICING AND UNDERWRITING Commercial Lines Pricing by Retention Group 65% 75% 85% 95% 0% 3% 6% 9% Above Average Average Below Average Low Very Low Renewal Pure Price Pure Rate % Premium Renewed Point of Renewal Retention % of Premium 48% 25% 16% 8% 4 % As of March 31 , 2020 • Portfolio management approach yields higher retention and rate • Account - specific pricing, including: • Predictive modeling • Relative loss frequency and severity • Pricing deviation • Hazard and segment consideration Strong focus on developing tools and technologies that enable more efficient decision making
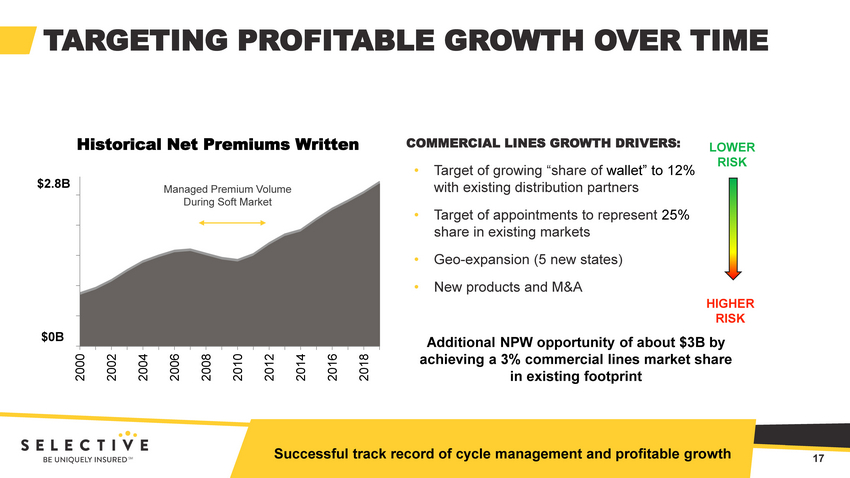
17 TARGETING PROFITABLE GROWTH OVER TIME PAGE 17 Historical Net Premiums Written COMMERCIAL LINES GROWTH DRIVERS: • Target of growing “share of wallet” to 12% with existing distribution partners • Target of appointments to represent 25% share in existing markets • Geo - expansion (5 new states) • New products and M&A Additional NPW opportunity of about $3B by achieving a 3% commercial lines market share in existing footprint LOWER RISK HIGHER RISK 2000 2002 2004 2006 2008 2010 2012 2014 2016 2018 $0B Managed Premium Volume During Soft Market $2.8B Successful track record of cycle management and profitable growth

18 DELIVER A SUPERIOR OMNI - CHANNEL EXPERIENCE “360 - DEGREE” VIEW OF CUSTOMER PROACTIVE MESSAGING VALUE - ADDED SERVICES SUCH AS SELECTIVE ® DRIVE FULL DIGITAL - ENABLED CAPABILITIES Customer - centricity is core to who we are as a company OMNI - CHANNEL CX IN 24/7 ENVIRONMENT • Changing expectations from customers, and potential disruptive threats from traditional and non - traditional competitors • Partnering with agents to provide a seamless customer experience • Identifying value - added services to increase new business hit ratios and retention rates: • Customized proactive messaging for product recall, notice of loss, or policy changes • Full digital capabilities • Additional service offerings such as Selective ® Drive and Security Mentor ®
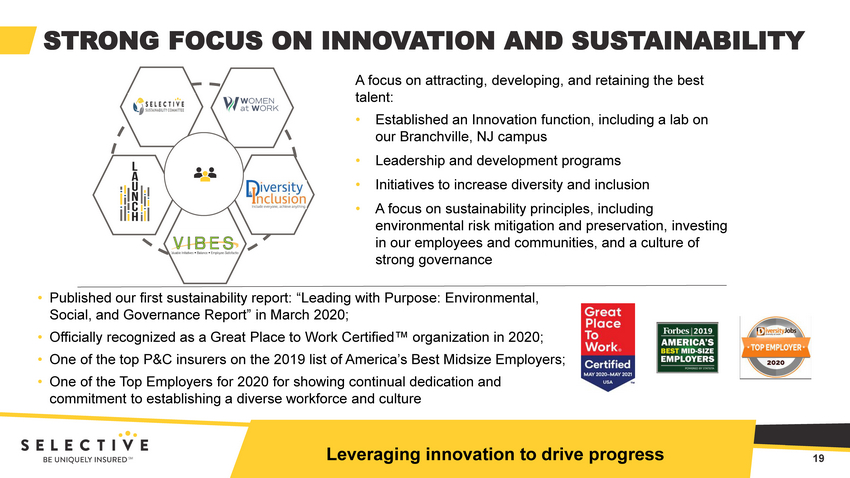
19 STRONG FOCUS ON INNOVATION AND SUSTAINABILITY Leveraging innovation to drive progress A focus on attracting , developing, and retaining the best talent: • Established an Innovation function, including a lab on our Branchville, NJ campus • Leadership and development programs • I nitiatives to increase diversity and inclusion • A focus on sustainability principles, including environmental risk mitigation and preservation, investing in our employees and communities, and a culture of strong governance • Published our first sustainability report: “Leading with Purpose: Environmental, Social, and Governance Report” in March 2020; • Officially recognized as a Great Place to Work Certified™ organization in 2020; • One of the top P&C insurers on the 2019 list of America’s Best Midsize Employers; • One of the Top Employers for 2020 for showing continual dedication and commitment to establishing a diverse workforce and culture

20 FINANCIAL OVERVIEW

21 LOWER RISK PROFILE AND STRONG FINANCIAL STRENGTH A LOWER RISK PROFILE • Strong balance sheet underpinned by a conservative approach to: • Managing the investment portfolio • Purchasing reinsurance protection • Loss reserving • Conservative business and balance sheet profile allows for higher operating leverage • Each full point on combined ratio = ~1 point of ROE • Each full point of pre - tax investment yield = ~2.5 points of ROE Low to Medium Hazard Writer AM Best A S&P A Moody’s A2 Fitch A+

22 A WRITER OF PREDOMINANTLY LOW - TO MEDIUM - HAZARD RISKS A lower volatility portfolio of risks Percent of Policies with TIV * or Limits of $1M or Less Property Casualty Standard Commercial Lines 79% 87%** Standard Personal Lines 85% 98% E&S Lines 97% 98% Notes: * TIV refers to t otal i nsured v alue ** Excludes workers compensation policies, which do not have statutory policy limits • Manage volatility of underwriting results, in part through maintaining a smaller limit profile • Low account sizes (premium per policyholder) averaging: • $12K for Standard Commercial • $2K for Standard Personal • $3K for E&S • Low reinsurance attachment points of $2M per event for property and casualty risks
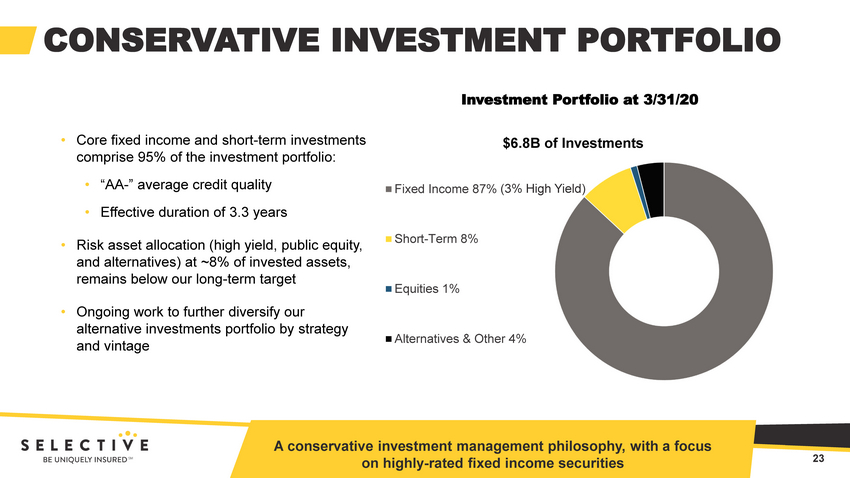
23 Fixed Income 87% Short-Term 8% Equities 1% Alternatives & Other 4% ( 3 % High Yield) CONSERVATIVE INVESTMENT PORTFOLIO Investment Portfolio at 3 /31/20 $ 6.8B of Investments • Core fixed income and short - term investments comprise 95% of the investment portfolio: • “AA - ” average credit quality • Effective duration of 3.3 years • Risk asset allocation (high yield, public equity, and alternatives) at ~8% of invested assets, remains below our long - term target • Ongoing work to further diversify our alternative investments portfolio by strategy and vintage A conservative investment management philosophy, with a focus on highly - rated fixed income securities

24 ACTIVE PORTFOLIO MANAGEMENT DRIVES INVESTMENT RESULTS Historical After - Tax Fixed Income Portfolio Yields • Current fixed income and short - term portfolio duration of 3.3 years • AA - average credit rating • Forecasting after - tax net investment income of $160M in 2020, driven by • $10M - 15M of expected alternative investment portfolio losses for the year • Continued pressure on new money yields for fixed income investments • Reinvestment of strong operating cash flows 2.2% 1.9% 1.9% 2.1% 2.8% 2.9% 2.7% 1.0% 2.0% 3.0% 2014 2015 2016 2017 2018 2019 1Q20 After - tax yield on our fixed income portfolio was 2.7% for 1Q20

25 HISTORICAL CATASTROPHE LOSS IMPACT BELOW INDUSTRY AVERAGE Impact of Catastrophe Losses on Combined Ratio Note: Catastrophe impact for P&C industry based on AM Best estimates • Catastrophe loss impact over the past 17 years has averaged: • 5.1 percentage points for the P&C industry • 2.9 percentage points for Selective • Catastrophe loss mitigation initiatives include: • Strict guidelines around coastal properties • Focus on geographic diversification and growth that minimizes peak catastrophe aggregations • Conservative reinsurance program Relatively low historical volatility from catastrophe losses on our combined ratio 0 6 12 2003 2005 2007 2009 2011 2013 2015 2017 2019 P&C Industry pts SIGI

26 CONSERVATIVE REINSURANCE PROGRAM 1% 1% 2% 2% 3% 5% 18% 0% 6% 12% 18% 24% 25 50 100 150 200 250 500 (Return Period in Years) Net Single - Event Hurricane Loss* as a % of Equity * Single event hurricane losses are net of reinsurance, after tax, and reinstatement premiums as of 1/1/20. GAAP equity as of 12/31/19 . • 2020 property catastrophe treaty structure : • Coverage of $ 735M in excess of $40M retention • $242M in collateralized limit, primarily in the top layer of the program • Additional earnings volatility protection from our non - footprint $35M in excess of $5M layer • Property XOL treaty covers losses up to $58M in excess of $2M retention • Casualty XOL treaty covers losses up to $88M in excess of $2M retention Balance sheet protection through conservative program and strong panel of reinsurance partners

27 STRONG RESERVING TRACK RECORD • Disciplined reserving practices: • Quarterly actuarial reserve reviews • Semi - annual independent review • Independent year - end opinion • Favorable reserve development in Workers Compensation was partially offset by modest strengthening in Commercial Auto, Personal Auto, and E&S lines during 2019 Impact of Casualty Reserve Development on our Combined Ratio 0.0% 2.0% 4.0% 2006 2007 2008 2009 2010 2011 2012 2013 2014 2015 2016 2017 2018 2019 1Q20 Fourteen consecutive years of net favorable casualty reserve development

28 STRONG CAPITAL AND LIQUIDITY POSITION, GREATER FOCUS ON EXPENSES • Upward pressure from COVID - 19 related items in short - term, but greater expense leverage over longer term • Restructured long - term stock compensation program resulting in corporate expense savings • Areas for operational enhancements include: • Workflow and process improvements • Robotics • Artificial intelligence • Talent development • Product innovation EXPENSE MANAGEMENT • Debt - to - capital ratio of 28.9% includes issuance of $302M of short - term debt in 1Q to bolster liquidity, although $50 M credit revolver borrowing repaid in May 2020 • NPW to surplus ratio of ~1.4x is at the low end of historical range • Investing in the business currently provides the most attractive capital deployment opportunities • Parent company cash and investments is well in excess of our two times annual outflow target CAPITAL AND LIQUIDITY PLAN

29 A FOCUS ON ROE AND GROWTH IN BOOK VALUE PER SHARE Strong Track Record of Book Value per Share Growth and Shareholder Value Creation Over Time $0 $500 $1,000 $1,500 $2,000 $2,500 $0 $10 $20 $30 $40 $50 2010 2011 2012 2013 2014 2015 2016 2017 2018 2019 1Q20 ($ in millions) GAAP Stockholders' Equity Book Value Per Share Generating non - GAAP operating ROE* in line with our long - term target Superior growth in book value per share Higher total shareholder returns over time Sustainable growth rate is ~8 - 9 % (or 75 - 80% of non - GAAP operating ROE*) * Refer to “Safe Harbor Statement” on page 2 of this presentation for further detail regarding certain non - GAAP financial measures.

30 TOTAL SHAREHOLDER RETURNS HAVE OUTPERFORMED BENCHMARKS - 20.4% 12.9% 13.9% - 6.9% 6.7% 10.5% - 12.1% 8.0% 11.4% -30% -20% -10% 0% 10% 20% 30% 40% SIGI S&P 500 S&P Prop/Cas 1 Year 5 Years 10 Years Total Shareholder Return Note: Total shareholder return calculations as of March 31, 2020 • Solid long - term outperformance in total shareholder return relative to S&P P&C insurance index and S&P 500 index over the past 5 - and 10 - year periods • Share price performance has reflected our ability to generate strong and consistent financial results PAGE 30 PAGE 30 Our stock has significantly outperformed peers and equity markets over the past 5 - and 10 - year periods

31 OUR VALUE PROPOSITION Selective delivers high - tech, high - touch insurance solutions while leveraging a unique distribution model to generate long - term value * Refer to “Safe Harbor Statement” on page 2 of this presentation for further detail regarding certain non - GAAP financial measures Leveraging our competitive strengths to generate sustained financial outperformance o Franchise value distribution model with best - in - class partners o Unique field model enabled by sophisticated technology o Strong customer experience Excellent growth opportunities within footprint and geo - expansion Solid underwriting margins, and non - GAAP operating ROEs* in line with our financial targets Conservative approach to risk selection and balance sheet management
32 INVESTOR PRESENTATION FIRST QUARTER 2020