Attached files
| file | filename |
|---|---|
| 8-K - 8-K - ICC Holdings, Inc. | icch-20200520x8k.htm |
ICC Holdings, Inc. Annual Shareholders Meeting May 20, 2020

FORWARD-LOOKING STATEMENTS As a reminder, we will be presenting certain forward-looking statements, within the meaning of the Private Securities Litigation Reform Act of 1995, or the Reform Act, during this presentation which may include, but are not limited to, statements regarding the Company’s, plans, objectives, expectations and intentions and other statements contained in this presentation that are not historical facts. The forward-looking statements are based on management's current views and assumptions regarding future events and operating performance, and are inherently subject to significant business, economic, and competitive uncertainties and contingencies and changes in circumstances, many of which are beyond the Company’s control. The statements in this presentation are made as of the date of this presentation, even if subsequently made available by the Company on its website or otherwise. The Company does not undertake any obligation to update or revise these statements to reflect events or circumstances occurring after the date of this presentation. Although the Company does not make forward-looking statements unless it believes it has a reasonable basis for doing so, the Company cannot guarantee their accuracy. Certain factors could cause actual results to differ materially from those described in these forward-looking statements. For a list of factors which could affect the Company’s results, see the Company’s filings with the Securities and Exchange Commission, “Item 2. Management's Discussion and Analysis of Financial Condition and Results of Operations,” including “Forward-Looking Information,” set forth in the Company’s Quarterly Report on Form 10-Q for the period ended March 31, 2020. No undue reliance should be placed on any forward-looking statements.
 CONTENTS COVID-19 Update Results Examined Continued Expansion
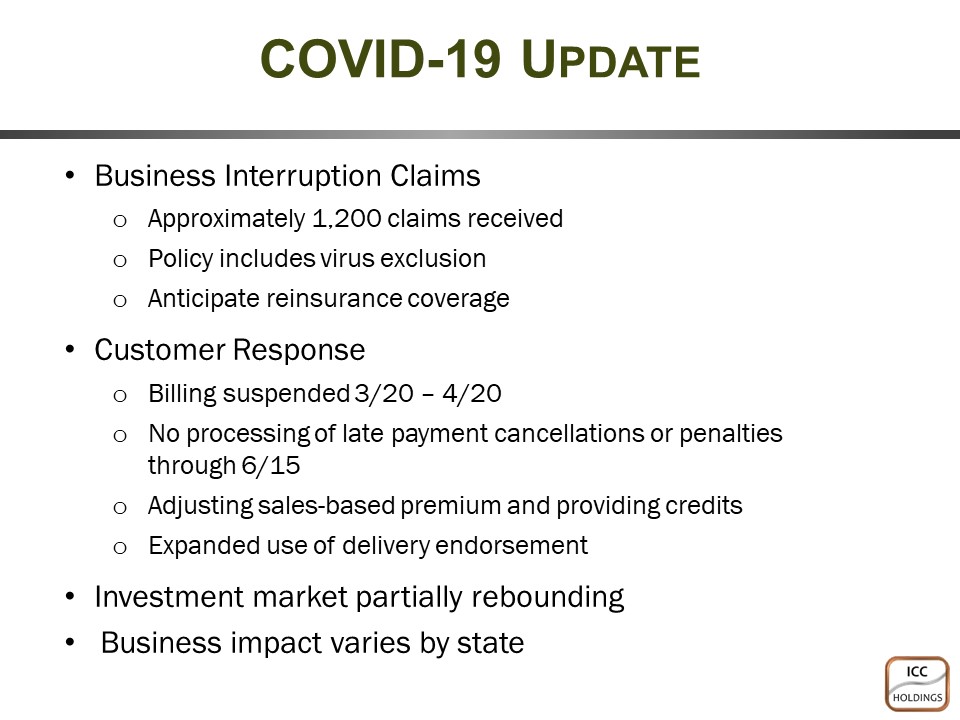
COVID-19 Update Business interruption claims approximately 1,200 claims received policy includes virus exclusion anticipate reinsurance coverage customer response billing suspended 3/20 – 4/20 no processing of late payment cancellations or penalties through 6/15 adjusting sales-based premium providing credits expanded use of delivery endorsement investment market partially rebounding business impact varies by state
CONTENTS COVID-19 Update Results Examined Continued Expansion
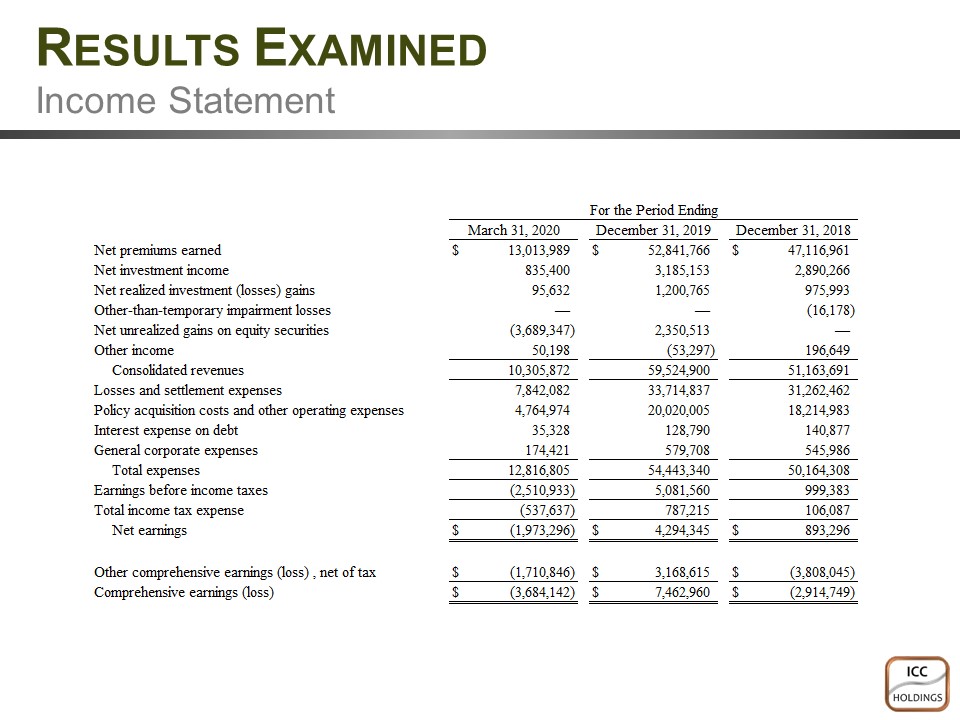
RESULTS EXAMINED Income Statement For the period ending March 31, 2020 December 31, 2019 December 31, 2018 Net premiums earned 13,013,989 52,841,766 47,116,961 Net investment income 835,400 3,185,153 2,890,266 Net realized investment (losses) gains 95,632 1,200,765 975,993 Other-than-temporary impairment losses (16,178) Net unrealized gains on equity securities (3,689,347) 2,350,513 Other income 50,198 (53,297) 196,649 Consolidated revenues 10,305,872 59,524,900 51,163,691 Losses and settlement expenses 7,842,082 33,714,837 31,262,462 Policy acquisition costs and other operating expenses 4,764,974 20,020,005 18,214,983 Interest expense on debt 35,328 128,790 140,877 General corporate expenses 174,421 579,708 545,986 Total expenses 12,816,805 54,443,340 50,164,308 Earnings before income taxes (2,510,933) 5,081,560 999,383 Total income tax expense (537,637) 787,215 106,087 Net earnings (1,973,296) 4,294,345 893,296 Other comprehensive earnings (loss) , net of tax (1,710,846) 3,168,615 (3,808,045) Comprehensive earnings (loss) (3,684,142) 7,462,960 (2,914,749) Unaudited
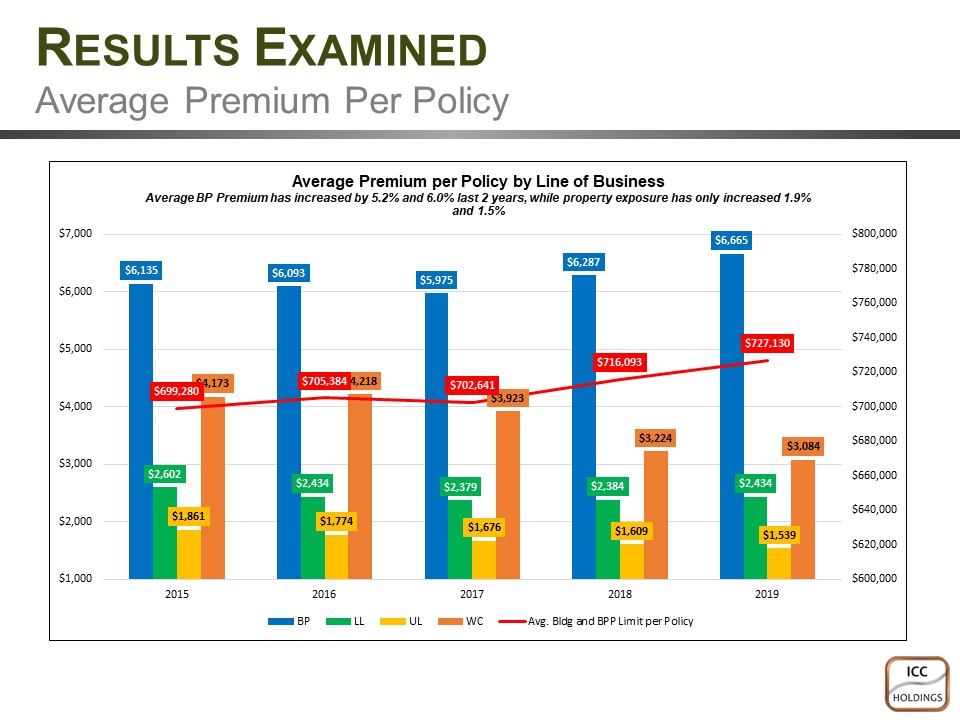
RESULTS EXAMINED average premium per policy average premium per policy by line of business average BP premium has increased by 5.2% and 6.0% last 2 years while property exposure has only increased 1.9% and 1.5%
6,135 2,602 699,280 1,861 4,173 6,093 705,384 2,434 1,774 4,218 5,975 702,641 2,379 3,923 1,676 6,287 716,093 2,384 1,609 3,224 6,665 727,130 2,434 3,084 1,539 BP LL UL WC Avg. bldg. and BPP limit per policy
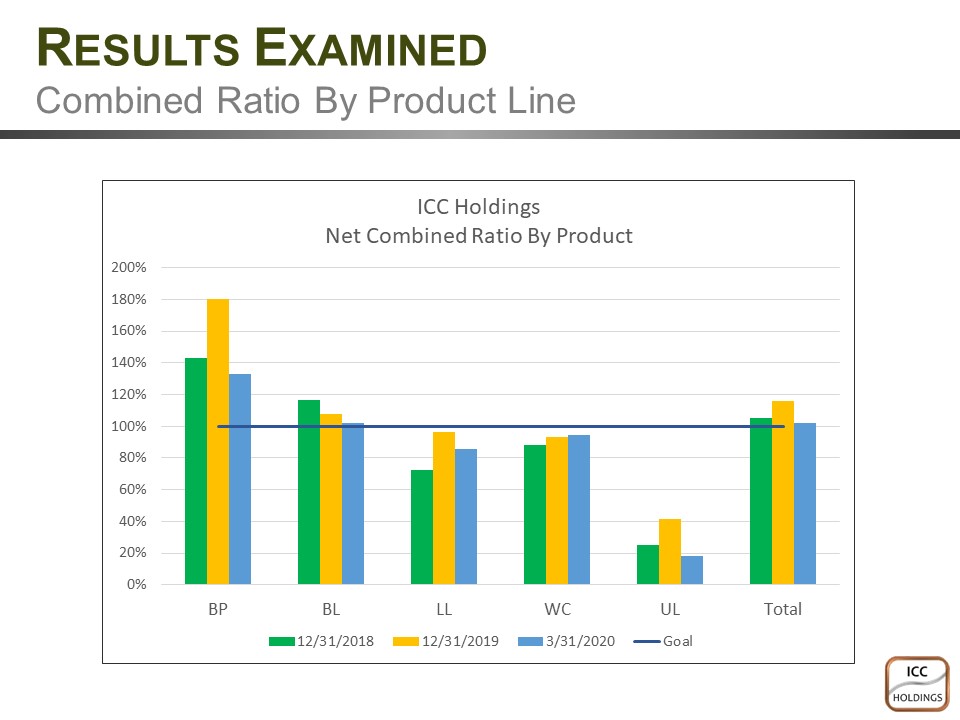
RESULTS EXAMINED net Combined Ratio By Product 200% 180% 160% 140% 120% 100% 80% 60% 40% 20% 0% ICC Holdings Net Combined Ratio By Product BP BL LL WC UL Total 12/31/2018 12/31/2019 3/31/2020 Goal
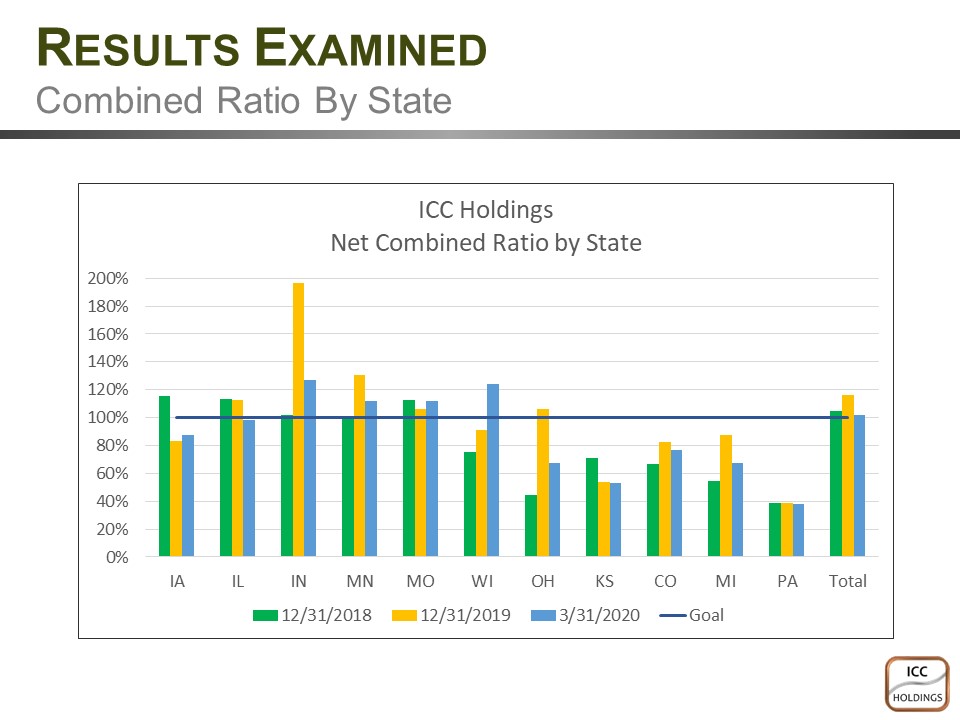 RESULTS EXAMINED Net Combined Ratio By State 200% 180% 160% 140% 120% 100% 80% 60% 40% 20% 0% ICC Holdings Net Combined Ratio by State IA IL IN MN MO WI OH KS CO MI PA Total 12/31/2018 12/31/2019 3/31/2020 Goal
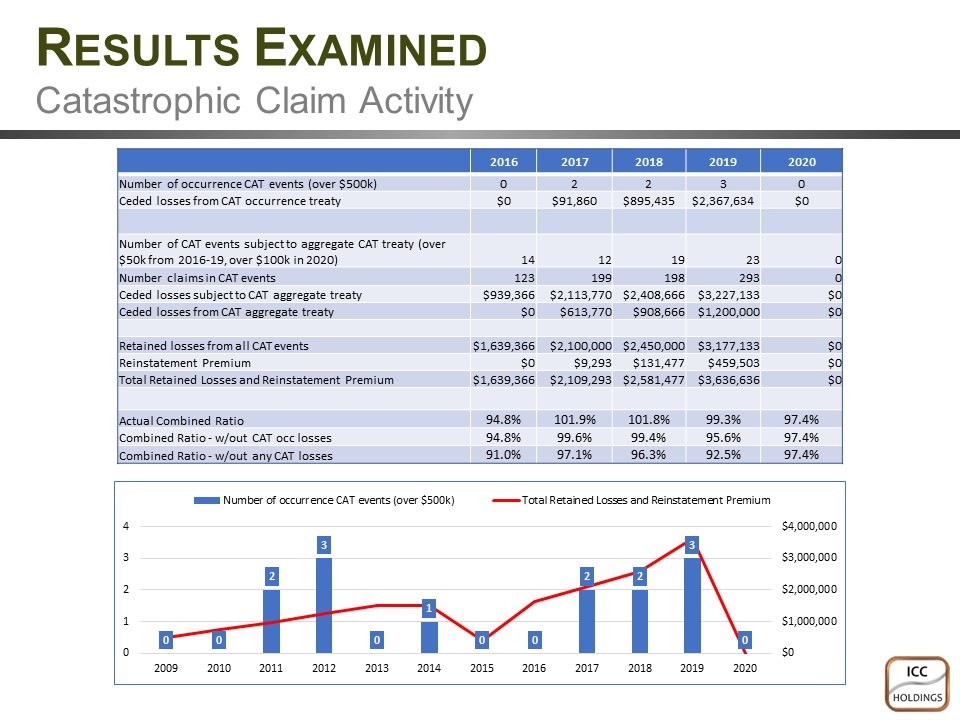 RESULTS EXAMINED Catastrophic Claim Activity number of occurrence CAT events over $500k ceded losses from cat occurrence treaty number of CAT events subject to aggregate CAT treaty over $50k from 2016-19 over $100k in 2020 number of claims in CAT events ceded losses subject to CAT aggregate treaty ceded losses from CAT aggregate treaty retained losses from all CAT events reinstatement premium total retained losses and reinstatement premium actual combined ratio combined ration – w/out CAT occ losses combined ration w/out any cat losses 2016 2017 2018 2019 2020 0 2 2 3 0 0 91,860 895,435 2,367,634 0 14 12 19 23 0 123 199 198 293 0 939,366 2,113,770 2,408,666 3,227,133 0 0 613,770 908,666 1,200,000 0 1,639,366 2,100,000 2,450,000 3,177,133 0 0 0 9,293 131,477 459,503 0 1,639,366 2,109,293 2,581,477 3,636,636 0 94.8% 101.9% 101.8% 99.3% 97.4% 94.8% 99.6% 99.4% 95.6% 97.4% 91.0% 97.1% 96.3% 92.5% 97.4% number of occurrence CAT events over $500k total retained losses and reinstatement premium 0 0 2 3 0 1 0 0 2 2 3 0 2009 2010 2011 2012 2013 2014 2015 2016 2017 2018 2019 2020
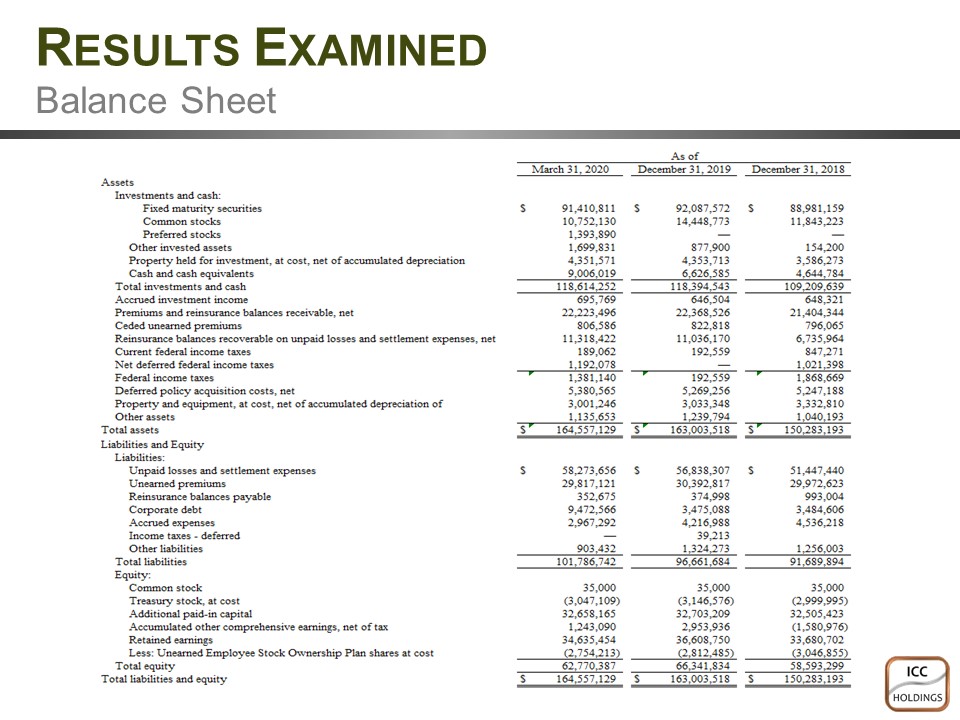
RESULTS EXAMINED Balance Sheet As of March 31, 2020 December 31, 2019 December 31, 2018 Assets Investments and cash: Fixed maturity securities 91,410,811 92,087,572 88,981,159 Common stocks 10,752,130 14,448,773 11,843,223 Preferred stocks 1,393,890 Other invested assets 1,699,831 877,900 154,200 Property held for investment, at cost, net of accumulated depreciation 4,351,571 4,353,713 3,586,273 Cash and cash equivalents 9,006,019 6,626,585 4,644,784 Total investments and cash 118,614,252 118,394,543 109,209,639 Accrued investment 695,769 646,504 648,321 Premiums and reinsurance balances receivable, net 22,223,496 22,368,526 21,404,344 Ceded unearned premiums 806,586 822,818 796,065 Reinsurance balances recoverable on unpaid losses and settlement expenses, net 11,318,422 11,036,170 6,735,964 Current federal income taxes 189,062 192,559 847,271 Net deferred federal income taxes 1,192,078 1,021,398 Federal income taxes 1,381,140 192,559 1,868,669 Deferred policy acquisition costs, net 5,380,565 5,269,256 5,247,188 Property and equipment, at cost, net of accumulated depreciation of 3,001,246 3,033,348 3,332,810 Other assets 1,135,653 1,239,794 1,040,193 Total assets 164,557,129 163,003,518 150,283,193 Liabilities and Equity Liabilities: Unpaid losses and settlement expenses 58,273,656 56,838,307 51,447,440 Unearned premiums 29,817,121 30,392,817 29,972,623 Reinsurance balances payable 352,675 374,998 993,004 Corporate debt 9,472,566 3,475,088 3,484,606 Accrued expenses 2,967,292 4,216,988 4,536,218 income taxes – deferred 39,213 Other liabilities 903,432 1,324,273 1,256,003 Total liabilities 101,786,742 96,661,684 91,689,894 Equity: Common stock 35,000 35,000 35,000 Treasury stock, at cost (3,047,109) (3,146,576) (2,999,995) Additional paid-in capital 32,658,165 32,703,209 32,505,423 Accumulated other comprehensive earnings, net of tax 1,243,090 2,953,936 (1,580,976) Retained earnings 34,635,454 36,608,750 33,680,702 Less: Unearned Employee Stock Ownership Plan shares at cost (2,754,213) (2,812,485) (3,046,855) Total equity 62,77,387 66,341,834 58,593,299 Total liabilities and equity 164,557,129 163,003,518 150,283,193
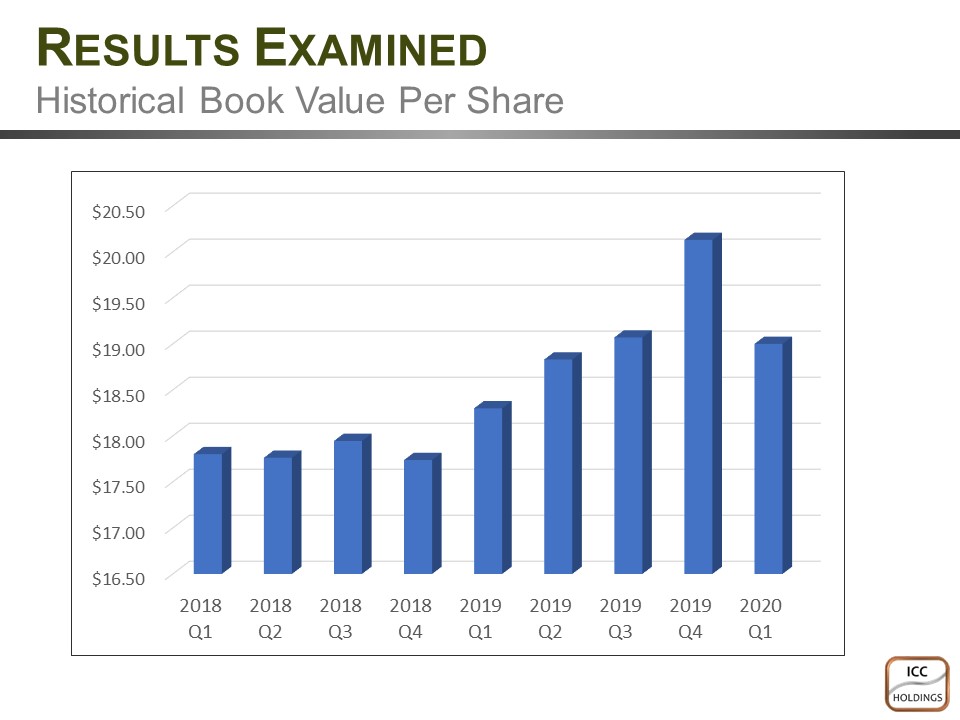 RESULTS EXAMINED Historical Book Value Per Share 2018 Q1 2018 Q2 2018 Q3 2018 Q4 2019 Q1 2019 Q2 2019 Q3 2019 Q4 2020 Q1
 CONTENTS COVID-19 Update Results Examined Continued Expansion
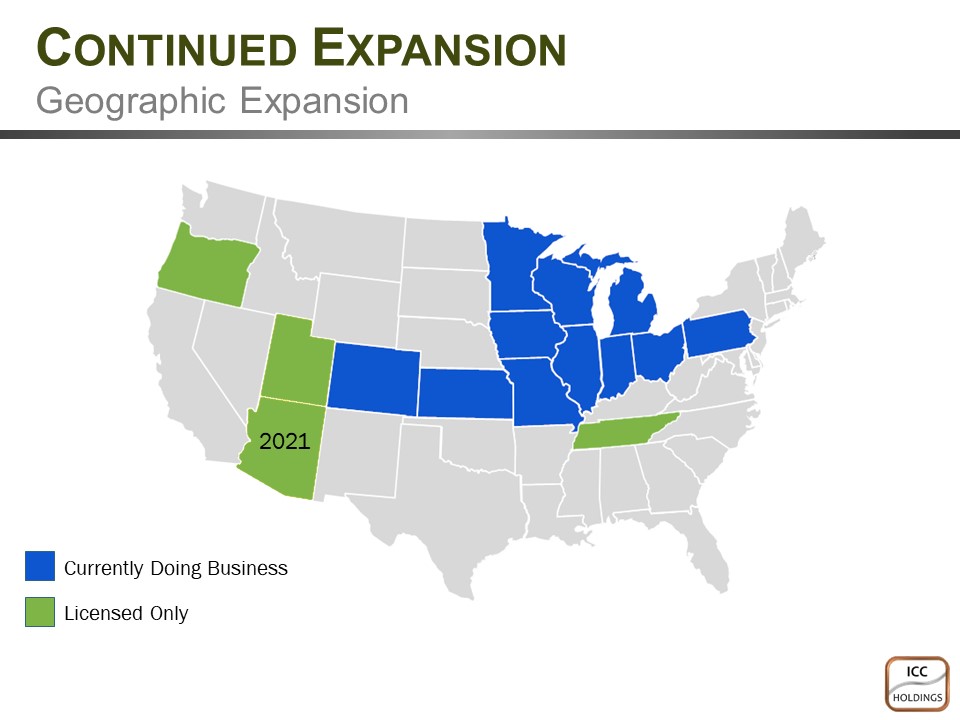
Continued expansion geographic expansion currently doing business licensed only 2021
 QUESTIONS?
 THANK YOU!