Attached files
| file | filename |
|---|---|
| EX-99.1 - EX-99.1 - CENTURY CASINOS INC /CO/ | cnty-20200520xex99_1.htm |
| 8-K - 8-K - CENTURY CASINOS INC /CO/ | cnty-20200520x8k.htm |
Exhibit 99.2
 CE
CE
NTURY CASINOS Financial Results Q1 2020 Century Casinos 1
Forward-Looking Statements, Business Environment and Risk Factors This presentation may contain “forward-looking statements” within the meaning of Section 27A of the Securities Act of 1933, as amended, Section 21E of the Securities Exchange Act of 1934, as amended (the “Exchange Act”), and the Private Securities Litigation Reform Act of 1995. In addition, Century Casinos, Inc. (together with its subsidiaries, the “Company”) may make other written and oral communications from time to time that contain such statements. Forward-looking statements include statements as to industry trends and future expectations of the Company and other matters that do not relate strictly to historical facts and are based on certain assumptions by management at the time such statements are made. Forward-looking statements in this presentation include statements regarding future results of operations, including the impact of the acquisition of Mountaineer Casino, Racetrack & Resort, Century Casino Cape Girardeau and Century Casino Caruthersville (the “Acquired Casinos”) on the Company’s results, the impact of the current coronavirus (COVID-19) pandemic and timing for reopening our casinos, the adequacy of cash flows from operations and available cash to meet our future liquidity needs, particularly during extended periods of time in which we cannot open or operate our casinos, operating efficiencies, synergies and operational performance, the integration of the Acquired Casinos into the Company’s business, the prospects for and timing and costs of new projects, projects in development and other opportunities, the credit agreement with Macquarie (as defined herein), debt repayment, investments in joint ventures, outcomes of legal proceedings, changes in our tax provisions or exposure to additional income tax liabilities, and plans for our casinos and our Company. These statements are often identified by the use of words such as “may,” “will,” “expect,” “believe,” “anticipate,” “intend,” “could,” “estimate,” or “continue,” and similar expressions or variations. These statements are based on the beliefs and assumptions of the management of the Company based on information currently available to management. Such forward-looking statements are subject to risks, uncertainties and other factors that could cause actual results to differ materially from future results expressed or implied by such forward-looking statements. Important factors that could cause actual results to differ materially from the forward-looking statements include, among others, the risks described in the section entitled “Risk Factors” under Item 1A in our Annual Report on Form 10-K for the year ended December 31, 2019 (the “2019 Annual Report”), in Item 8.01 of our Form 8-K filed with the SEC on May 8, 2020, and our subsequent periodic and current reports filed with the SEC. We caution the reader to carefully consider such factors. Furthermore, such forward-looking statements speak only as of the date on which such statements are made. We undertake no obligation to update any forward-looking statements to reflect events or circumstances after the date of such statements. Century Casinos 2
Notes on Presentation In this presentation the term “USD” refers to US dollars, the term “CAD” refers to Canadian dollars, the term “PLN” refers to Polish zloty and the term “GBP” refers to the British pound. Adjusted EBITDA and Adjusted EBITDA margin are non-GAAP financial measures. See Appendix A for the definition and reconciliation of Adjusted EBITDA and Adjusted EBITDA margin. Amounts presented are rounded. As such, rounding differences could occur in period-over-period changes and percentages reported throughout this presentation. The names of the Company’s subsidiaries and certain operating segments are abbreviated on certain of the following slides. See Appendix A for a list of the subsidiaries and their abbreviations. Century Casinos 3
COVID-19 In late 2019, an outbreak of COVID-19 was identified in China and has since spread throughout much of the world. The COVID-19 pandemic has had an adverse effect on the Company’s first quarter 2020 results of operations and financial condition, and we expect this situation will have an adverse impact on our second quarter 2020 results. The trends below are not the only items that could impact the Company’s future performance, and the views of management are preliminary based on currently available information. Between March 14, 2020 and March 17, 2020, the Company closed all of its casinos, hotels and other facilities to comply with quarantines issued by governments to contain the spread of COVID-19. The Company anticipates a phased approach to reopening will be recommended by government officials in the jurisdictions where it operates, which could include reduced levels of gaming space, social distancing at slot machines and table games or reduced capacity within the casino, limited restaurant operating hours or continued closure of restaurants, requirements to wear face masks, including the potential to require guests to wear face masks, increased frequency of disinfecting surfaces and other measures to account for varying levels of demand. The Company’s casinos rely on a local customer base and, as such, the Company anticipates that its operations could resume at a quicker rate than those of casinos at destination resorts. The timing for reopening the Company’s closed locations will depend on determinations by governments in each jurisdiction. The Company reopened its Poland casinos on May 18, 2020. Based on information currently available, the Company is anticipating reopening most of its other locations beginning in June 2020 and no later than August 2020. However, the Company cannot predict how quickly customers will return to its casinos. The Company permanently closed Century Casino Bath in March 2020 and four of the ship-based casinos that the Company operated prior to their closures in March 2020 will not reopen due to expiration of the Company’s concession agreements for those casinos. Due to the temporary closures of its casinos, hotels and other facilities, the Company has taken actions to reduce operating costs, including furloughing most of its personnel and implementing reduced work weeks for other personnel. During the closures, the Company will continue to pay benefits to its United States and Canadian employees, inclusive of part time employees, through May 2020. In Poland, all employees were paid reduced salaries based on local employment laws. In March 2020, as a proactive measure to increase its cash position and preserve financial flexibility in light of the uncertainty resulting from the COVID-19 pandemic, the Company borrowed an additional $17.4 million on its revolving credit facility with Macquarie Capital (“Macquarie”) and its credit agreement with UniCredit Bank Austria AG (“UniCredit”). The Company has no remaining availability under these credit facilities. As of April 30, 2020, the Company had $50.0 million in cash on hand. The Company currently is not generating any revenue from its properties, and estimates that the net cash outflow during the time the operations continue to be fully suspended will be, on average, approximately $8.0 million per month. Management estimates that the Company will need approximately $19.8 million to reopen operations and cover short-term cash needs at the casinos. During the first quarter of 2020, the Company concluded that the COVID-19 pandemic and associated closure of its casinos were triggering events that could indicate possible impairment of its goodwill and indefinite-lived intangible assets. The Company performed a quantitative and qualitative impairment analysis and determined that goodwill and casino licenses related to certain reporting units were impaired. As a result, the Company recorded $33.0 million to impairment – goodwill and intangible assets on its condensed consolidated statement of (loss) earnings for the three months ended March 31, 2020. Century Casinos 4
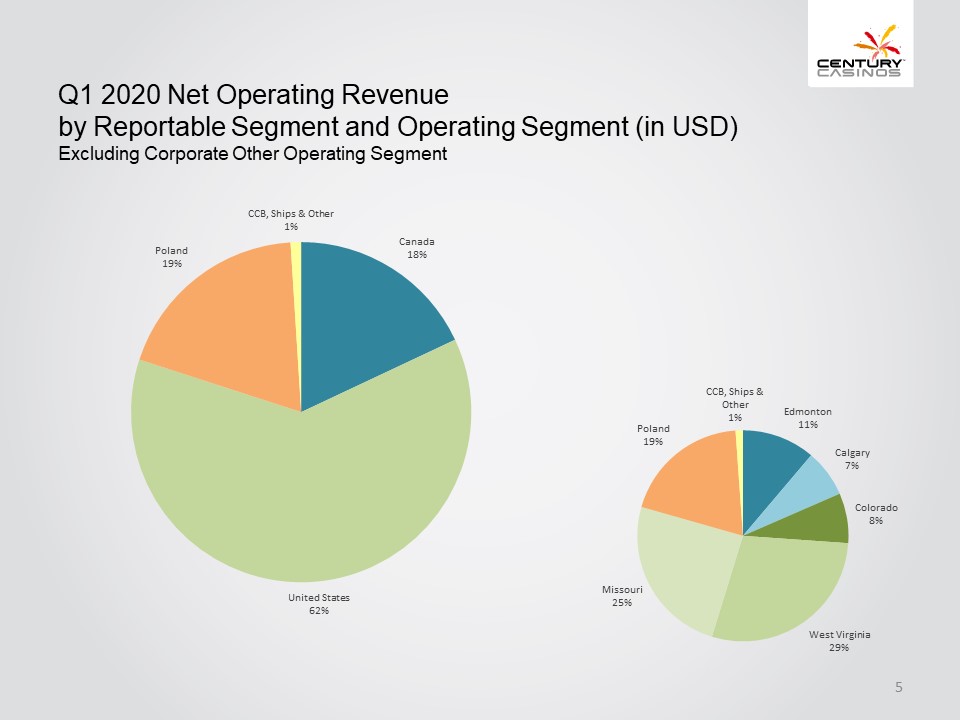
Q1 2020 Net Operating Revenue by Reportable Segment and Operating Segment (in USD) Excluding Corporate Other Operating Segment United States 62% Poland 19% CCB, Ships & Other 1% Canada 18% Missouri 25% Poland 19% CCB, Ships & Other 1% Edmonton 11% Calgary 7% Colorado 8% West Virginia 29% Century Casinos 5
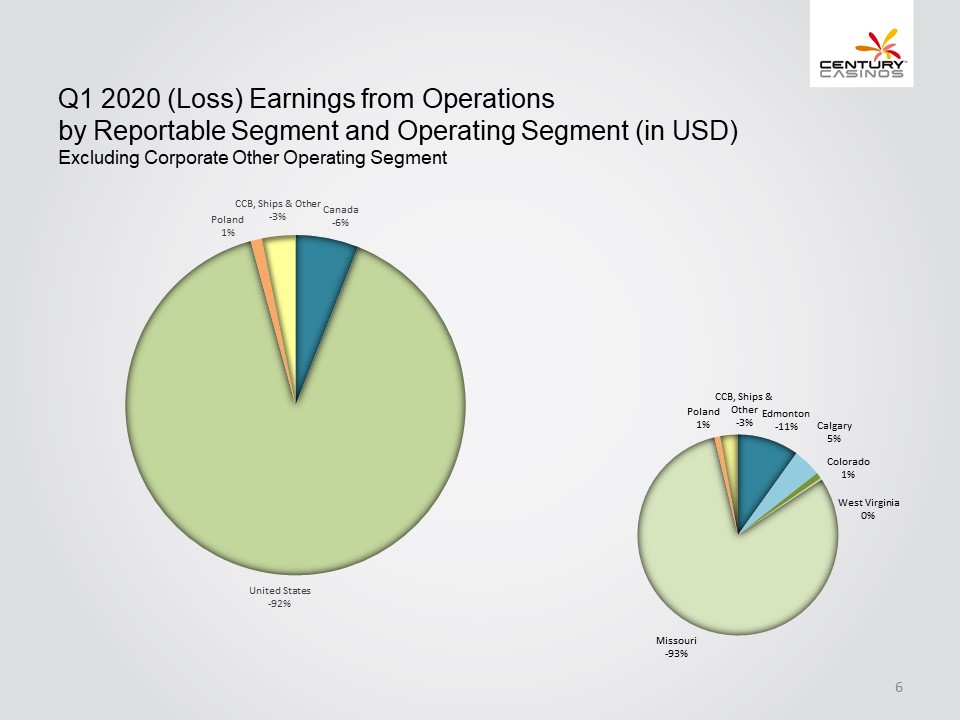
Q1 2020 (Loss) Earnings from Operations by Reportable Segment and Operating Segment (in USD) Excluding Corporate Other Operating Segment Poland 1% CCB, Ships & Other -3% Canada -6% United States -92% Missouri -93% Poland 1% CCB, Ships & Other -3% Edmonton -11% Calgary 5% Colorado 1% West Virginia 0% Century Casinos 6
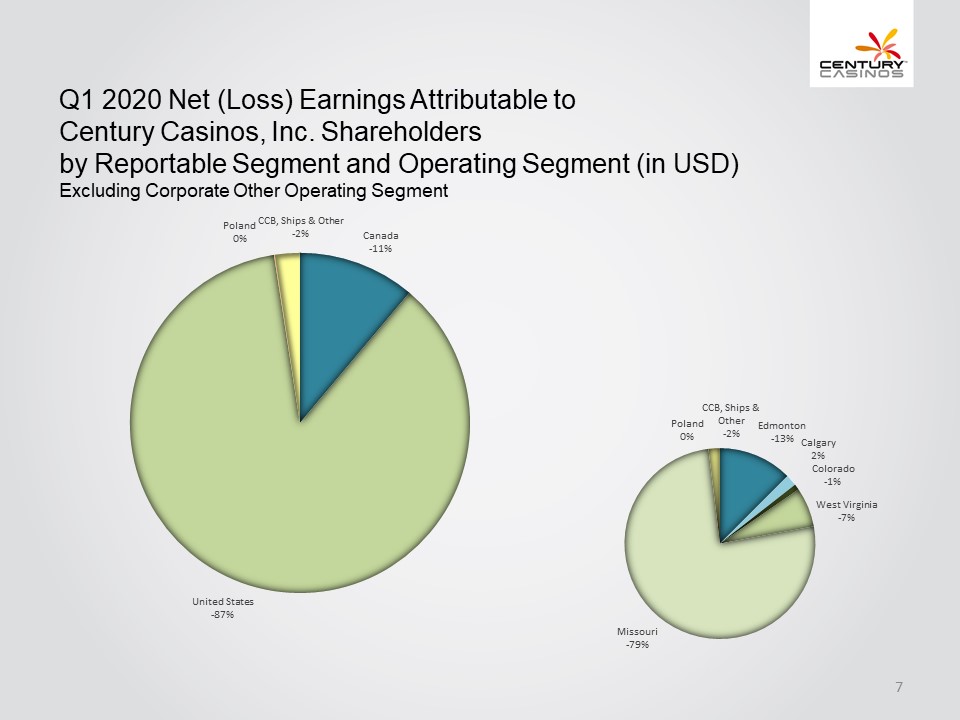
Q1 2020 Net (Loss) Earnings Attributable to Century Casinos, Inc. Shareholders by Reportable Segment and Operating Segment (in USD) Excluding Corporate Other Operating Segment United States -87% Poland 0% CCB, Ships & Other -2% Canada -11% Missouri -79% Poland 0% CCB, Ships & Other -2% Edmonton -13% Calgary 2% Colorado -1% West Virginia -7% Century Casinos 7
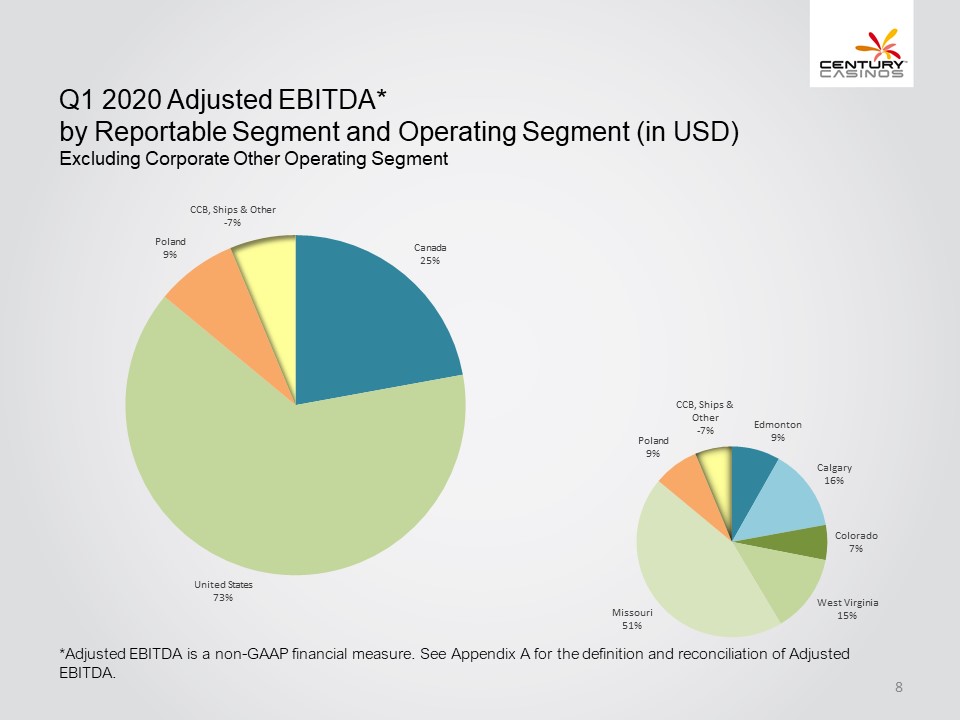
Q1 2020 Adjusted EBITDA* by Reportable Segment and Operating Segment (in USD) Excluding Corporate Other Operating Segment United States 73% Poland 9% CCB, Ships & Other -7% Canada 25% Missouri 51% Poland 9% CCB, Ships & Other -7% Edmonton 9% Calgary 16% Colorado 7% West Virginia 15% *Adjusted EBITDA is a non-GAAP financial measure. See Appendix A for the definition and reconciliation of Adjusted EBITDA. Century Casinos 8
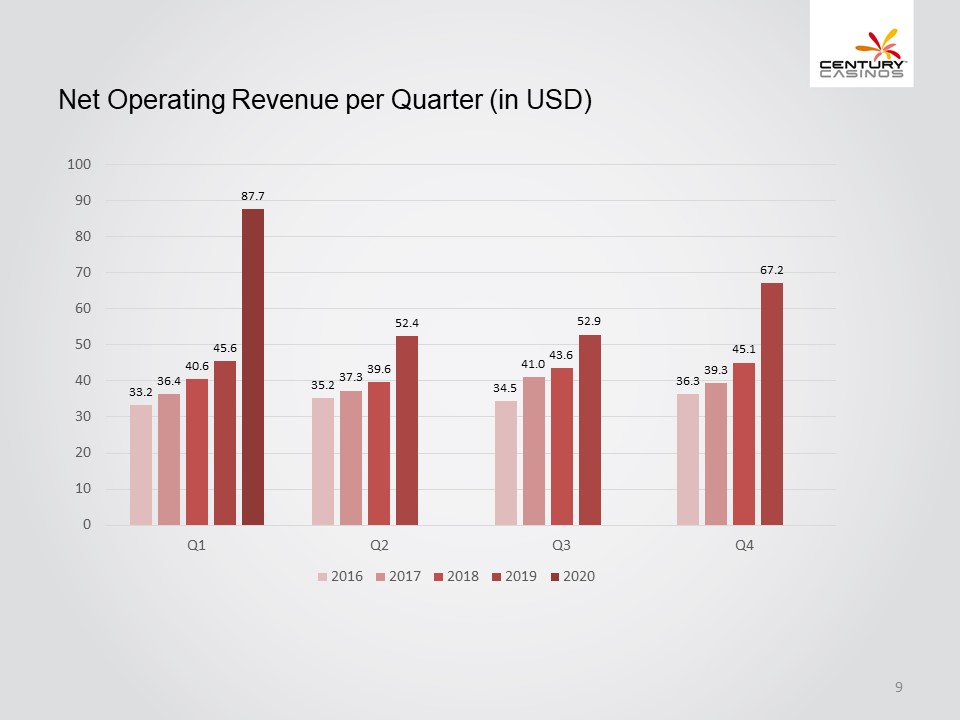
Net Operating Revenue per Quarter (in USD) 0 10 20 30 40 50 60 70 80 90 100 Q1 33.2 36.4 40.6 45.6 87.7 Q2 35.2 37.3 39.6 52.4 Q3 34.5 41.0 43.6 52.9 Q4 36.3 39.3 45.1 67.2 2016 2017 2018 2019 2020 Century Casinos 9
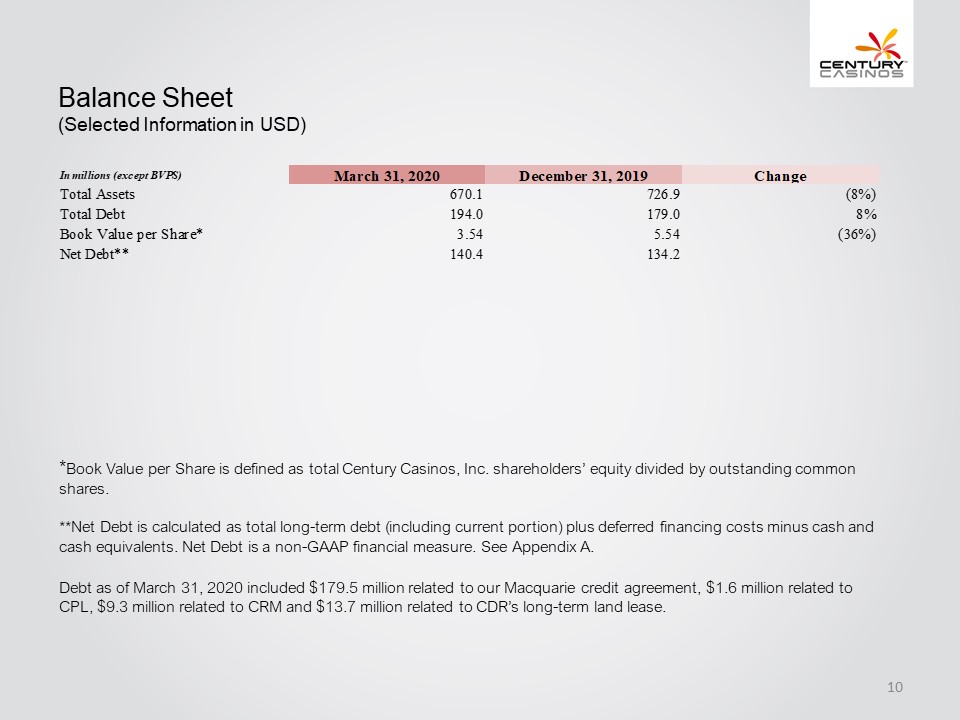
Balance Sheet (Selected Information in USD) In millions (except BVPS) March 31, 2020 December 31,2019 Change Total Assets 670.1 726.9 (8%) Total Debt 194.0 179.0 8% Book Value per Share* 3.54 5.54 (36%) Net Debt** 140.4 134.2 *Book Value per Share is defined as total Century Casinos, Inc. shareholders’ equity divided by outstanding common shares. **Net Debt is calculated as total long-term debt (including current portion) plus deferred financing costs minus cash and cash equivalents. Net Debt is a non-GAAP financial measure. See Appendix A. Debt as of March 31, 2020 included $179.5 million related to our Macquarie credit agreement, $1.6 million related to CPL, $9.3 million related to CRM and $13.7 million related to CDR’s long-term land lease. Century Casinos 10
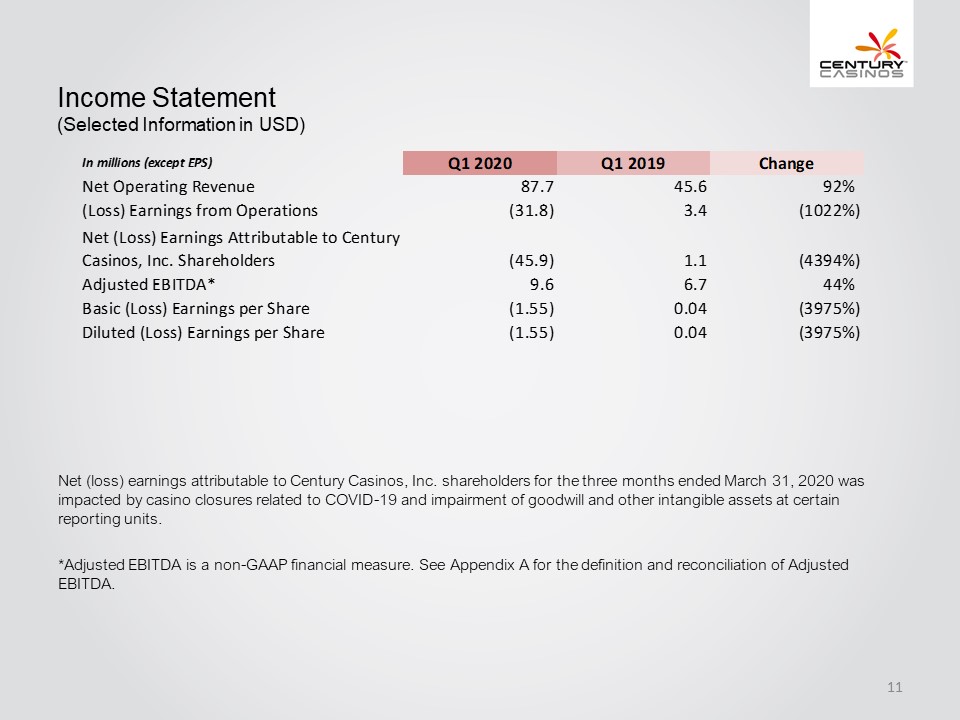
Income Statement (Selected Information in USD) In millions (except EPS) Q1 2020 Q1 2019 Change Net Operating Revenue 87.7 45.6 92% (Loss) Earnings from Operations (31.8) 3.4 (1022%) Net (Loss) Earnings Attributable to Century Casinos, Inc. Shareholders (45.9) 1.1 (4394%) Adjusted EBITDA* 9.6 6.7 44% Basic (Loss) Earnings per Share (1.55) 0.04 (3975%) Diluted (Loss) Earnings per Share (1.55) 0.04 (3975%) Net (loss) earnings attributable to Century Casinos, Inc. shareholders for the three months ended March 31, 2020 was impacted by casino closures related to COVID-19 and impairment of goodwill and other intangible assets at certain reporting units. *Adjusted EBITDA is a non-GAAP financial measure. See Appendix A for the definition and reconciliation of Adjusted EBITDA. Century Casinos 11
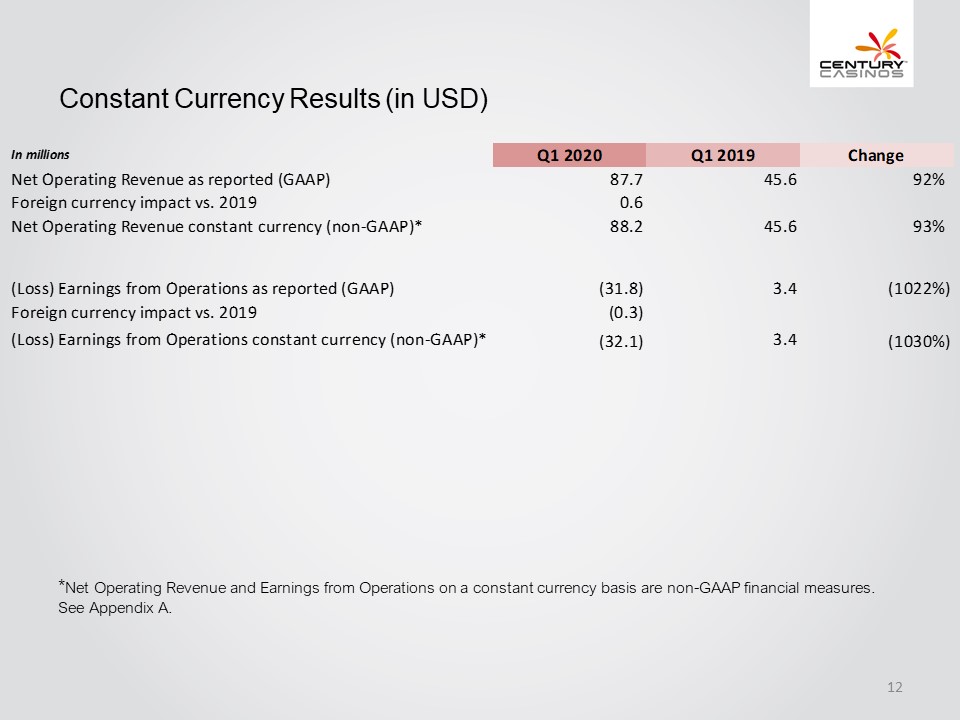
Constant Currency Results (in USD) In millions Q1 2020 Q12019 Change Net Operating Revenue as reported (GAAP) 87.7 45.6 92% Foreign currency impact vs. 2019 0.6 Net Operating Revenue constant currency (non-GAAP)* 88.2 45.6 93% (Loss) Earnings from Operations as reported (GAAP) (31.8) 3.4 (1022%) Foreign currency impact vs. 2019 (0.3) (Loss) Earnings from Operations constant currency (non-GAAP)* (32.1) 3.4 (1030%) *Net Operating Revenue and Earnings from Operations on a constant currency basis are non-GAAP financial measures. See Appendix A. Century Casinos 12
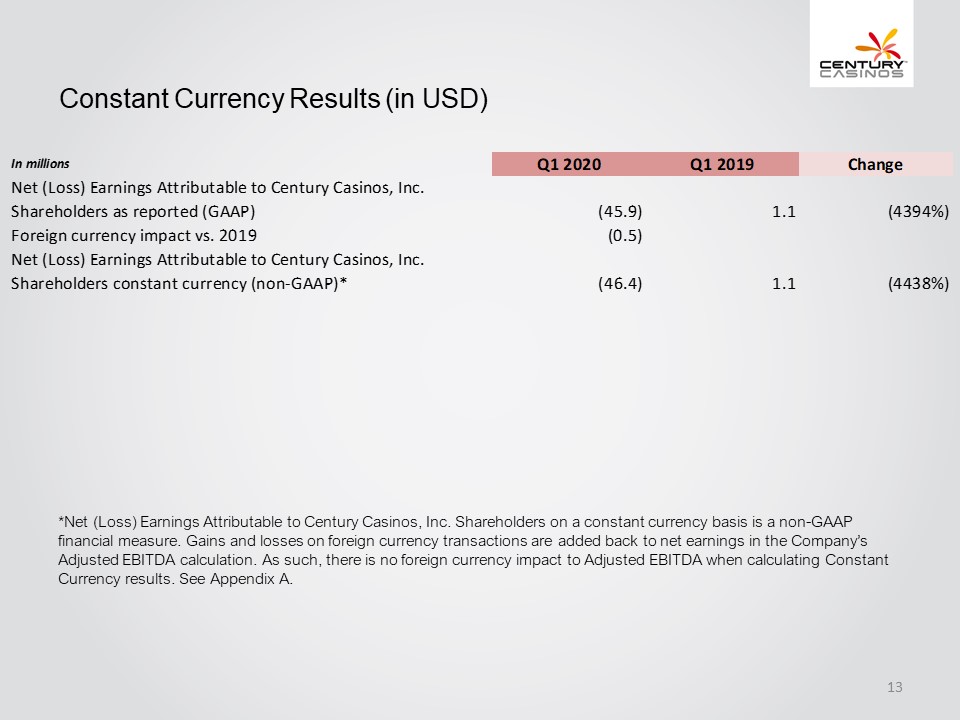
Constant Currency Results (in USD) In millions Q1 2020 Q1 2019 Change Net (Loss) Earnings Attributable to Century Casinos, Inc. Shareholders as reported (GAAP) (45.9) 1.1 (4394%) Foreign currency impact vs. 2019 (0.5) Net (Loss) Earnings Attributable to Century Casinos, Inc. Shareholders constant currency (non-GAAP)* (46.4) 1.1 (4438%) *Net (Loss) Earnings Attributable to Century Casinos, Inc. Shareholders on a constant currency basis is a non-GAAP financial measure. Gains and losses on foreign currency transactions are added back to net earnings in the Company’s Adjusted EBITDA calculation. As such, there is no foreign currency impact to Adjusted EBITDA when calculating Constant Currency results. See Appendix A. Century Casinos 13
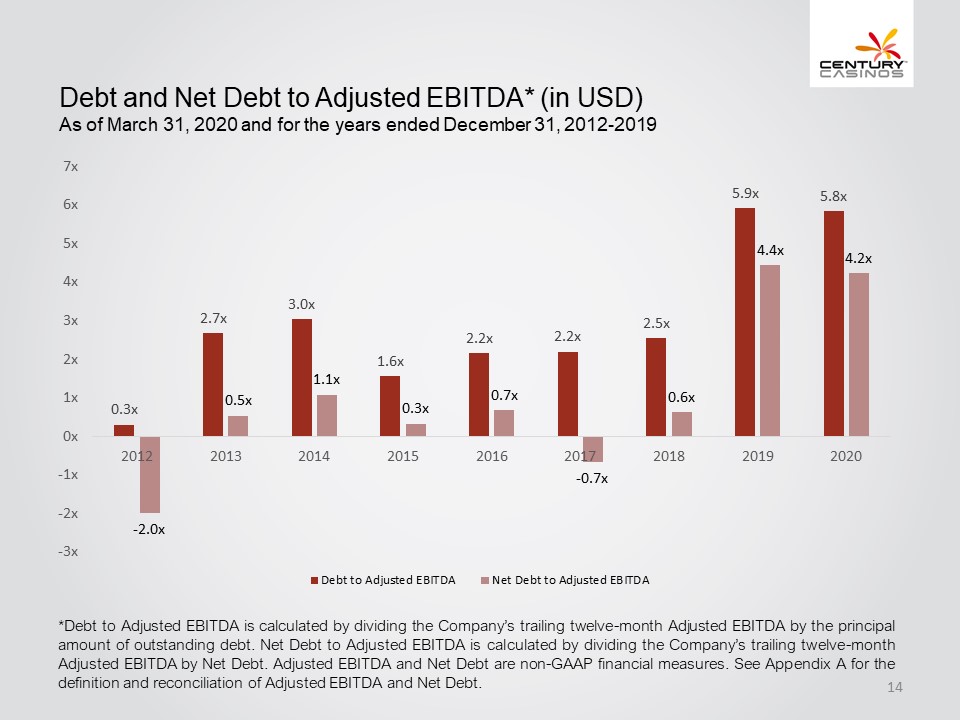
Debt and Net Debt to Adjusted EBITDA* (in USD) As of March 31, 2020 and for the years ended December 31, 2012-2019 -3x -2x -1x 0x 1x 2x 3x 4x 5x 6x 7x 2012 0.3x -2.0x 2013 0.5x 2.7x 2014 1.1x 3.0x 2015 0.3x 1.6x 2016 2.2x 0.7x 2017 2.2x -0.7x 2018 2.5x 0.6x 2019 5.9x 4.4x 2020 5.8x 4.2x Debt to Adjusted EBITDA Net Debt to Adjusted EBITDA *Debt to Adjusted EBITDA is calculated by dividing the Company’s trailing twelve-month Adjusted EBITDA by the principal amount of outstanding debt. Net Debt to Adjusted EBITDA is calculated by dividing the Company’s trailing twelve-month Adjusted EBITDA by Net Debt. Adjusted EBITDA and Net Debt are non-GAAP financial measures. See Appendix A for the definition and reconciliation of Adjusted EBITDA and Net Debt. Century Casinos 14
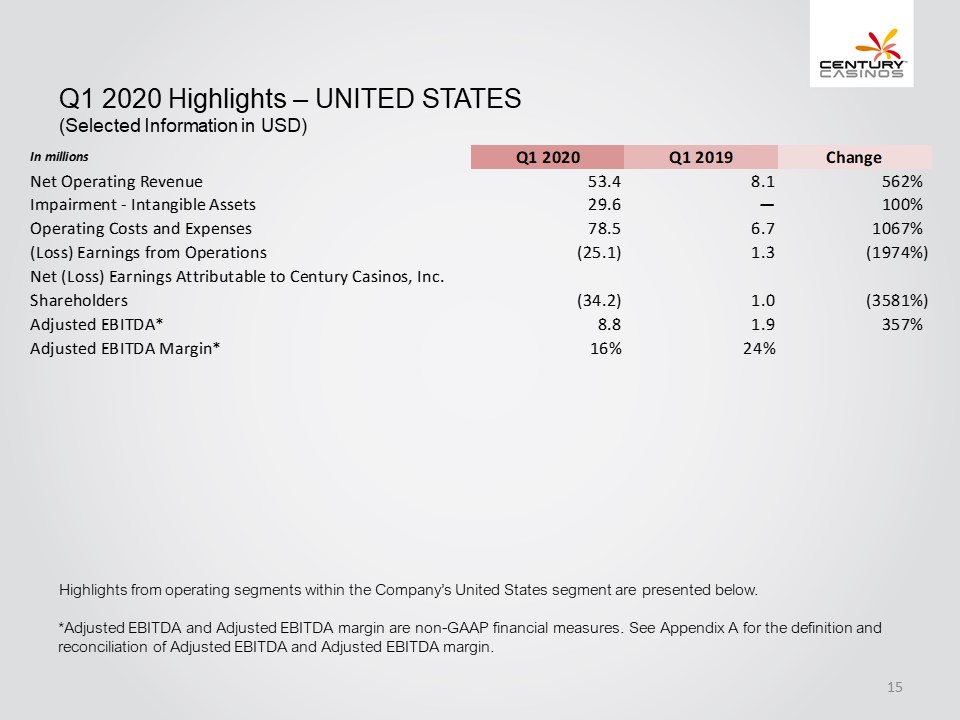
Q1 2020 Highlights – UNITED STATES (Selected Information in USD) In millions Q12020 Q12019 Change Net Operating Revenue 53.4 8.1 562% Impairment - Intangible Assets 29.6 — 100% Operating Costs and Expenses 78.5 6.7 1067% (Loss) Earnings from Operations (25.1) 1.3 (1974%) Net (Loss) Earnings Attributable to Century Casinos, Shareholders (34.2) 1.0 (3581%) Adjusted EBITDA* 8.8 1.9 357% Adjusted EBITDA Margin* 16% 24% Highlights from operating segments within the Company’s United States segment are presented below. *Adjusted EBITDA and Adjusted EBITDA margin are non-GAAP financial measures. See Appendix A for the definition and reconciliation of Adjusted EBITDA and Adjusted EBITDA margin. Century Casinos 15
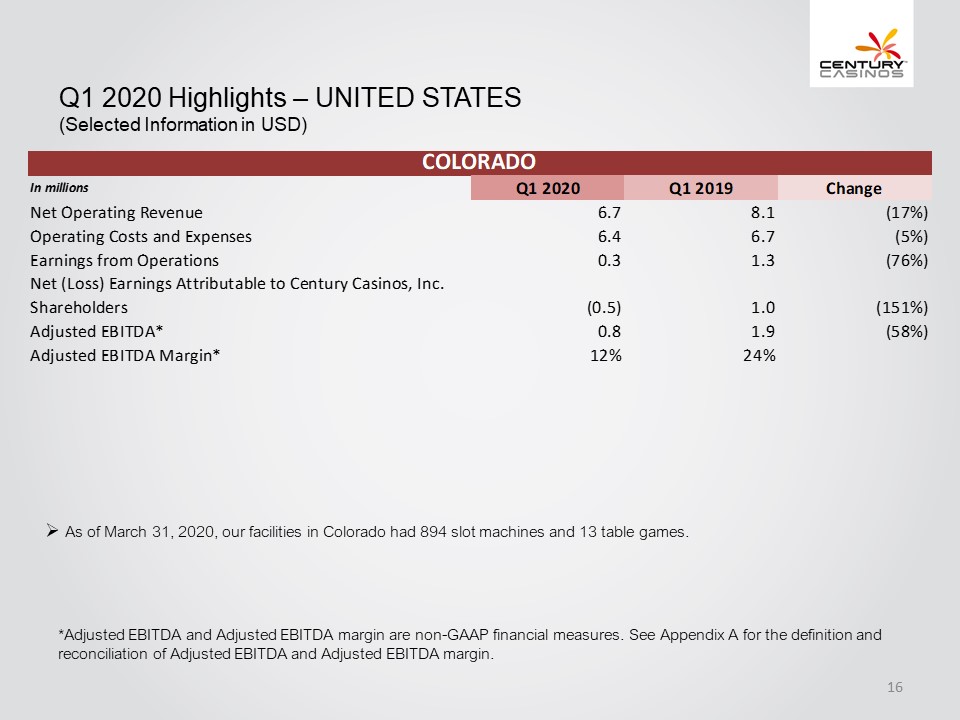
Q1 2020 Highlights – UNITED STATES (Selected Information in USD) COLORADO In millions Q1 2020 Q1 2019 Change Net Operating Revenue 6.7 8.1 (17%) Operating Costs and Expenses .4 6.7 (5%) Earnings from Operations 0.3 1.3 (76%) Net (Loss) Earnings Attributable to Century Casinos, Inc. Shareholders (0.5) 1.0 (151%) Adjusted EBITDA* 0.8 1.9 (58%) Adjusted EBITDA Margin* 12% 24% As of March 31, 2020, our facilities in Colorado had 894 slot machines and 13 table games. *Adjusted EBITDA and Adjusted EBITDA margin are non-GAAP financial measures. See Appendix A for the definition and reconciliation of Adjusted EBITDA and Adjusted EBITDA margin. Century Casinos 16

Q1 2020 Highlights – UNITED STATES (Selected Information in USD) WEST VIRGINIA In millions Ql 2020 Net Operating Revenue 25.1 Impairment - Intangible Assets 0.4 Operating Costs and Expenses 25.2 Loss from Operations (0.1) Net Loss Attributable to Century Casinos, Inc. Shareholders (2.6) Adjusted EBITDA* 1.8 Adjusted EBITDA Margin* 7% As of March 31, 2020, our facility in West Virginia had 1,100 slot machines and 42 table games. *Adjusted EBITDA and Adjusted EBITDA margin are non-GAAP financial measures. See Appendix A for the definition and reconciliation of Adjusted EBITDA and Adjusted EBITDA margin. Century Casinos 17
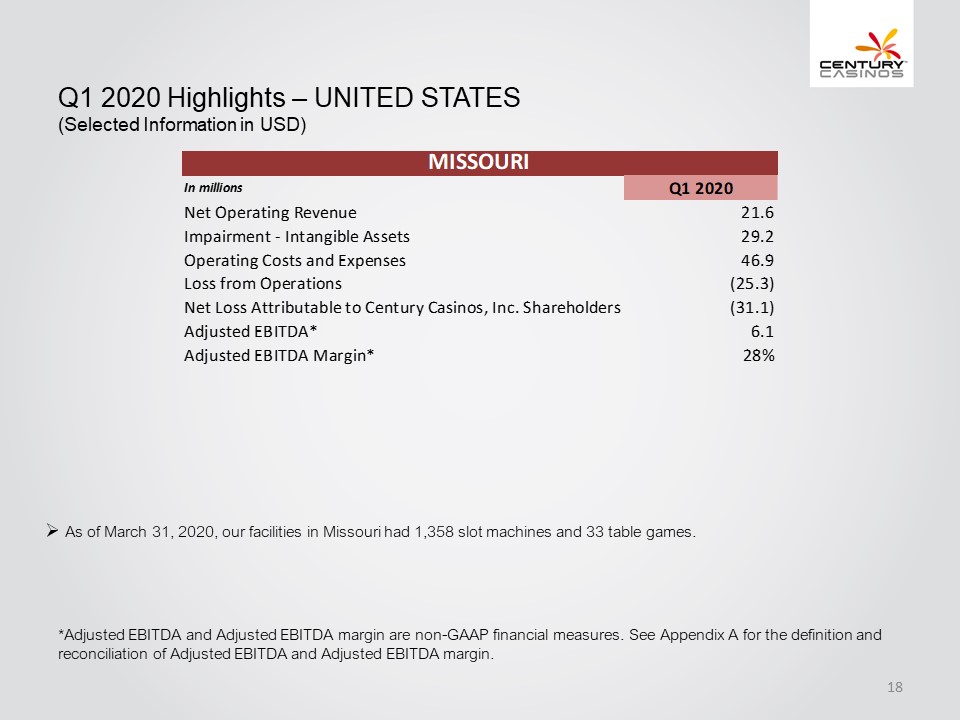
Q1 2020 Highlights – UNITED STATES (Selected Information in USD) MISSOURI In millions Q1 2020 Net Operating Revenue 21.6 Impairment - Intangible Assets 29.2 Operating Costs and Expenses 46.9 Loss from Operations (25.3) Net Loss Attributable to Century Casinos, Inc. Shareholders (31.1) Adjusted EBITDA* 6.1 Adjusted EBITDA Margin* 28% As of March 31, 2020, our facilities in Missouri had 1,358 slot machines and 33 table games. *Adjusted EBITDA and Adjusted EBITDA margin are non-GAAP financial measures. See Appendix A for the definition and reconciliation of Adjusted EBITDA and Adjusted EBITDA margin. Century Casinos 18
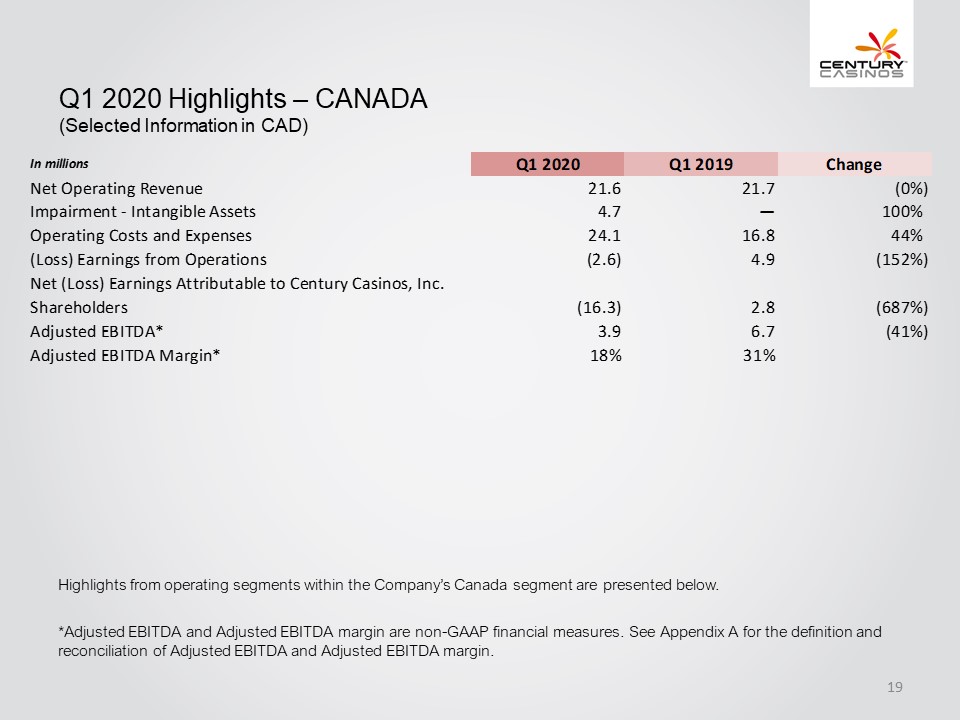
Q1 2020 Highlights – CANADA (Selected Information in CAD) In millions Q12020 Q12019 Change Net Operating Revenue 21.6 21.7 (0%) Impairment - Intangible Assets 4.7 — 100% Operating Costs and Expenses 24.1 16.8 44% (Loss) Earnings from Operations (2.6) 4.9 (152%) Net (Loss) Earnings Attributable to Century Casinos, Shareholders (16.3) 2.8 (687%) Adjusted EBITDA* 3.9 6.7 (41%) Adjusted EBITDA Margin* 18% 31% Highlights from operating segments within the Company’s Canada segment are presented below. *Adjusted EBITDA and Adjusted EBITDA margin are non-GAAP financial measures. See Appendix A for the definition and reconciliation of Adjusted EBITDA and Adjusted EBITDA margin. Century Casinos 19
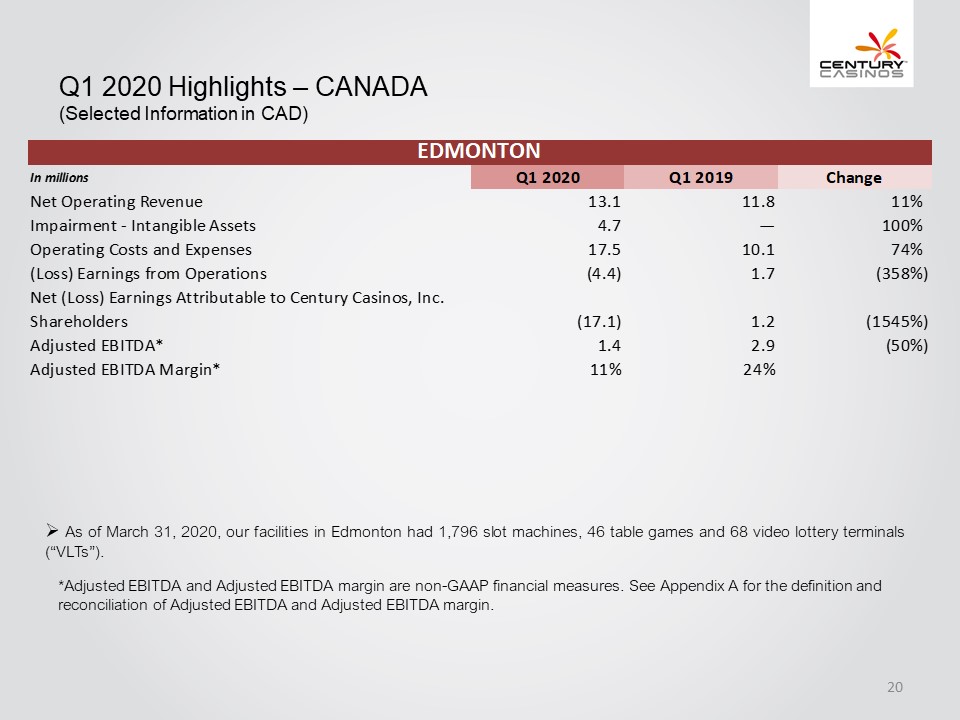
Q1 2020 Highlights – CANADA (Selected Information in CAD) EDMONTON In millions Q1 2020 Q12019 Change Net Operating Revenue 13.1 11.8 11% Impairment - Intangible Assets 4.7 – 100% Operating Costs and Expenses 17.5 10.1 74% (Loss) Earnings from Operations (4.4) 1.7 (358%) Net (Loss) Earnings Attributable to Century Casinos, Inc. Shareholders (17.1) 1.2 (1545%) Adjusted EBITDA* 1.4 2.9 (50%) Adjusted EBITDA Margin* 11% 24% As of March 31, 2020, our facilities in Edmonton had 1,796 slot machines, 46 table games and 68 video lottery terminals (“VLTs”). *Adjusted EBITDA and Adjusted EBITDA margin are non-GAAP financial measures. See Appendix A for the definition and reconciliation of Adjusted EBITDA and Adjusted EBITDA margin. Century Casinos 20
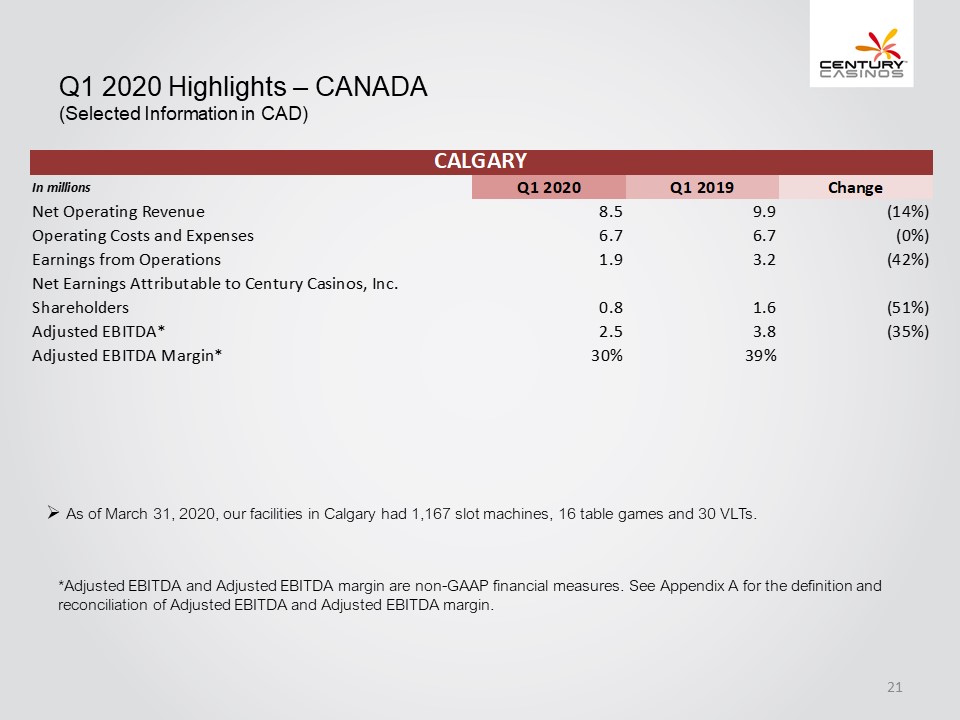
Q1 2020 Highlights – CANADA (Selected Information in CAD) CALGARY In millions Q1 2020 Q12019 Change Net Operating Revenue 8.5 9.9 (14%) Operating Costs and Expenses 6.7 6.7 (0%) Earnings from Operations 1.9 3.2 (42%) Net Earnings Attributable to Century Casinos, Inc. Shareholders 0.8 1.6 (51%) Adjusted EBITDA* 2.5 3.8 (35%) Adjusted EBITDA Margin* 30% 39% As of March 31, 2020, our facilities in Calgary had 1,167 slot machines, 16 table games and 30 VLTs. *Adjusted EBITDA and Adjusted EBITDA margin are non-GAAP financial measures. See Appendix A for the definition and reconciliation of Adjusted EBITDA and Adjusted EBITDA margin. Century Casinos 21
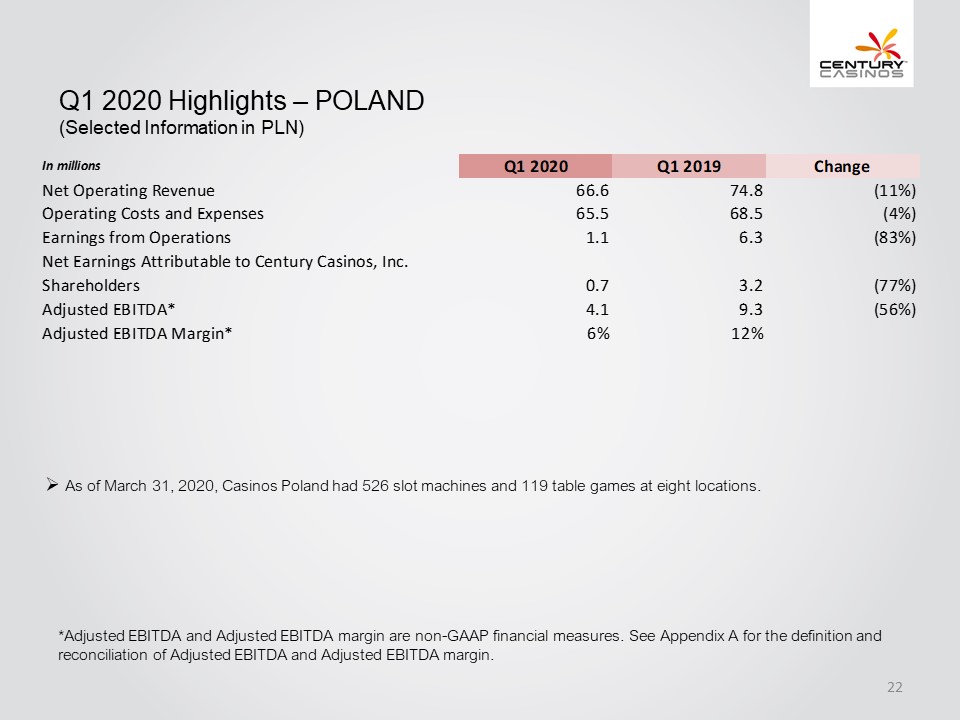
Q1 2020 Highlights – POLAND (Selected Information in PLN) In millions Q12020 Q12019 Change Net Operating Revenue 66.6 74.8 (11%) Operating Costs and Expenses 65.5 68.5 (4%) Earnings from Operations 1.1 6.3 (83%) Net Earnings Attributable to Century Casinos, Inc. Shareholders 0.7 3.2 (77%) Adjusted EBITDA* 4.1 9.3 (56%) Adjusted EBITDA Margin* 6% 12% As of March 31, 2020, Casinos Poland had 526 slot machines and 119 table games at eight locations. *Adjusted EBITDA and Adjusted EBITDA margin are non-GAAP financial measures. See Appendix A for the definition and reconciliation of Adjusted EBITDA and Adjusted EBITDA margin. Century Casinos 22
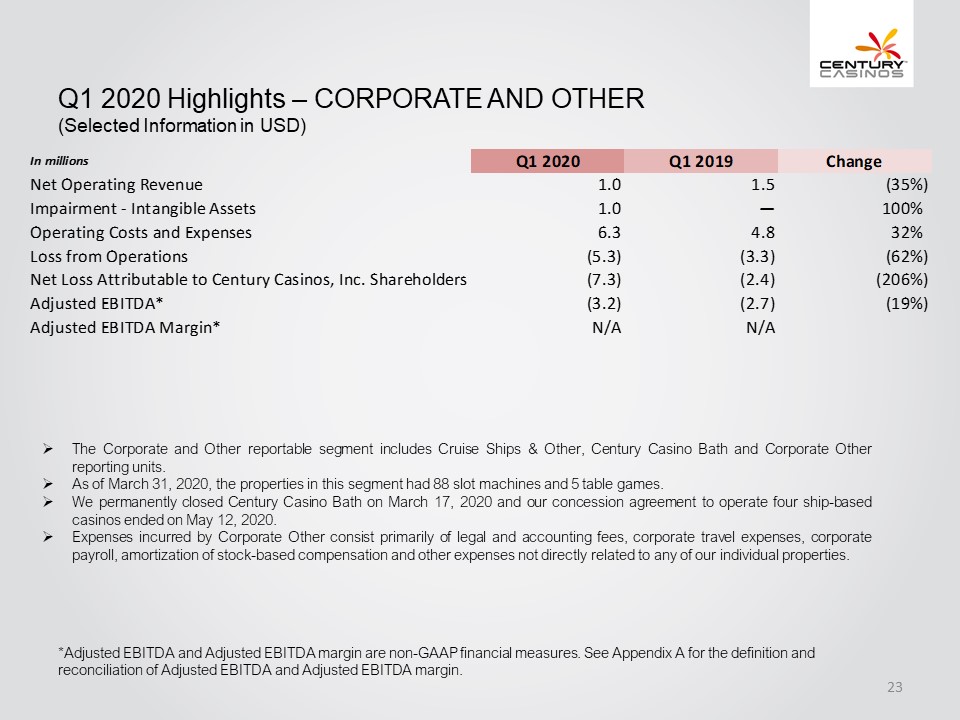
Q1 2020 Highlights – CORPORATE AND OTHER (Selected Information in USD) In millions Q1 2020 Q12019 Change Net Operating Revenue 1.0 1.5 (35%) Impairment - Intangible Assets 1.0 — 100% Operating Costs and Expenses 6.3 4.8 32% Loss from Operations 5.3) (3.3) (62%) Net Loss Attributable to Century Casinos, Inc. Shareholders (7.3) (2.4) (206%) Adjusted EBITDA*(3.2) (2.7) (19%) Adjusted EBITDA Margin* N/A N/A The Corporate and Other reportable segment includes Cruise Ships & Other, Century Casino Bath and Corporate Other reporting units. As of March 31, 2020, the properties in this segment had 88 slot machines and 5 table games. We permanently closed Century Casino Bath on March 17, 2020 and our concession agreement to operate four ship-based casinos ended on May 12, 2020. Expenses incurred by Corporate Other consist primarily of legal and accounting fees, corporate travel expenses, corporate payroll, amortization of stock-based compensation and other expenses not directly related to any of our individual properties. *Adjusted EBITDA and Adjusted EBITDA margin are non-GAAP financial measures. See Appendix A for the definition and reconciliation of Adjusted EBITDA and Adjusted EBITDA margin. Century Casinos 23

Q1 2020 Highlights – ADDITIONAL PROJECTS UNDER DEVELOPMENT Bermuda In August 2017, the Company announced that, together with Hamilton Properties Limited, it had submitted a casino license application to the Bermudan government for a casino at the Hamilton Princess Hotel & Beach Club in Hamilton, Bermuda. The Company’s subsidiary, CRM, entered into a long-term management agreement with Hamilton Properties Limited pursuant to which the Company will assist with the license application and manage the operations of the casino for which it will receive a management fee, should the license be awarded. In September 2017, the Bermuda Casino Gaming Commission granted a provisional casino gaming license, which is subject to certain conditions and approvals including the adoption of certain rules and regulations by the Bermudan government. The Parliament of Bermuda has not taken action on this project, and we do not currently expect the project to go forward. Century Casinos 24
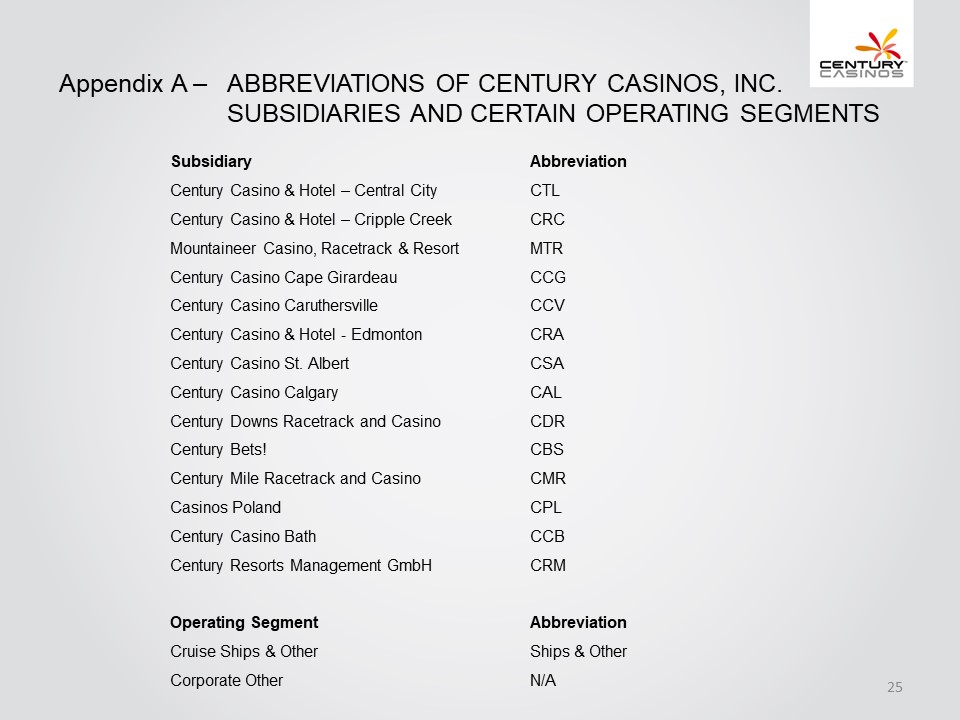
Appendix A – ABBREVIATIONS OF CENTURY CASINOS, INC. SUBSIDIARIES AND CERTAIN OPERATING SEGMENTS Subsidiary Abbreviation Century Casino & Hotel – Central City CTL Century Casino & Hotel – Cripple Creek CRC Mountaineer Casino, Racetrack & Resort MTR Century Casino Cape Girardeau CCG Century Casino Caruthersville CCV Century Casino & Hotel - Edmonton CRA Century Casino St. Albert CSA Century Casino Calgary CAL Century Downs Racetrack and Casino CDR Century Bets! CBS Century Mile Racetrack and Casino CMR Casinos Poland CPL Century Casino Bath CCB Century Resorts Management GmbH CRM Operating Segment Abbreviation Cruise Ships & Other Ships & Other Corporate Other N/A Century Casinos 25
Appendix A – NON-GAAP FINANCIAL MEASURES The Company supplements its consolidated financial statements prepared in accordance with U.S. generally accepted accounting principles (“GAAP”) by using the following non-GAAP financial measures, which management believes are useful in properly understanding the Company’s short-term and long-term financial trends. Management uses these non-GAAP financial measures to forecast and evaluate the operational performance of the Company as well as to compare results of current periods to prior periods on a consolidated basis. Adjusted EBITDA Adjusted EBITDA margin Constant currency results Net Debt Management believes presenting the non-GAAP financial measures used in this presentation provides investors greater transparency to the information used by management for financial and operational decision-making and allows investors to see the Company’s results “through the eyes” of management. Management also believes providing this information better enables our investors to understand the Company’s operating performance and evaluate the methodology used by management to evaluate and measure such performance. The adjustments made to GAAP financial measures result from facts and circumstances that vary in frequency and impact on the Company’s results of operations. The following is an explanation of each of the adjustments that management excludes in calculating its non-GAAP financial measures. Century Casinos 26
Appendix A – NON-GAAP FINANCIAL MEASURES The Company defines Adjusted EBITDA as net earnings (loss) attributable to Century Casinos, Inc. shareholders before interest expense (income), net, income taxes (benefit), depreciation and amortization, non-controlling interests net earnings (loss) and transactions, pre-opening expenses, acquisition costs, non-cash stock-based compensation charges, asset impairment costs, (gain) loss on disposition of fixed assets, discontinued operations, (gain) loss on foreign currency transactions, cost recovery income and other, gain on business combination and certain other one-time transactions. Expense related to the triple net master lease for the three Acquired Casino properties (the “Master Lease”) and CDR land lease is included in the interest expense (income), net line item. Intercompany transactions consisting primarily of management and royalty fees and interest, along with their related tax effects, are excluded from the presentation of net earnings (loss) attributable to Century Casinos, Inc. shareholders and Adjusted EBITDA reported for each segment. Not all of the aforementioned items occur in each reporting period, but have been included in the definition based on historical activity. These adjustments have no effect on the consolidated results as reported under GAAP. Adjusted EBITDA is not considered a measure of performance recognized under GAAP. Management believes that Adjusted EBITDA is a valuable measure of the relative performance of the Company and its properties. The gaming industry commonly uses Adjusted EBITDA as a method of arriving at the economic value of a casino operation. Management uses Adjusted EBITDA to compare the relative operating performance of separate operating units by eliminating the above-mentioned items associated with the varying levels of capital expenditures for infrastructure required to generate revenue and the often high cost of acquiring existing operations. Adjusted EBITDA is used by the Company’s lending institution to gauge operating performance. The Company’s computation of Adjusted EBITDA may be different from, and therefore may not be comparable to, similar measures used by other companies within the gaming industry. Please see the reconciliation of Adjusted EBITDA to net earnings (loss) attributable to Century Casinos, Inc. shareholders below. The Company defines Adjusted EBITDA margin as Adjusted EBITDA divided by net operating revenue. Management uses this margin as one of several measures to evaluate the efficiency of the Company’s casino operations. Century Casinos 27
Appendix A – NON-GAAP FINANCIAL MEASURES The impact of foreign exchange rates is highly variable and difficult to predict. The Company uses a Constant Currency basis to show the impact from foreign exchange rates on current period financial information compared to prior period financial information using the prior period’s foreign exchange rates. In order to properly understand the underlying business trends and performance of the Company’s ongoing operations, management believes that investors may find it useful to consider the impact of excluding changes in foreign exchange rates from the Company’s net operating revenue, earnings from operations and net earnings (loss) attributable to Century Casinos, Inc. shareholders. Constant currency results are calculated by dividing the current year to date local currency segment results excluding the local currency impact of foreign currency gains and losses, by the prior year’s average exchange rate for the year to date and comparing them to actual U.S. dollar results for the prior year to date. The average exchange rates for the current quarter and prior year first quarter are reported in Item 1 of the Company’s Quarterly Report on Form 10-Q for the quarter ended March 31, 2020. Constant currency information is not a measure of financial performance under GAAP and should not be considered a substitute for net operating revenue, earnings from operations or net earnings (loss) attributable to Century Casinos, Inc. shareholders as determined in accordance with GAAP. The Company defines Net Debt as total long-term debt (including current portion) plus deferred financing costs minus cash and cash equivalents. Net Debt is not considered a liquidity measure recognized under GAAP. Management believes that Net Debt is a valuable measure of our overall financial situation. Net Debt provides investors with an indication of our ability to pay off all of our long-term debt if it became due simultaneously. Century Casinos 28
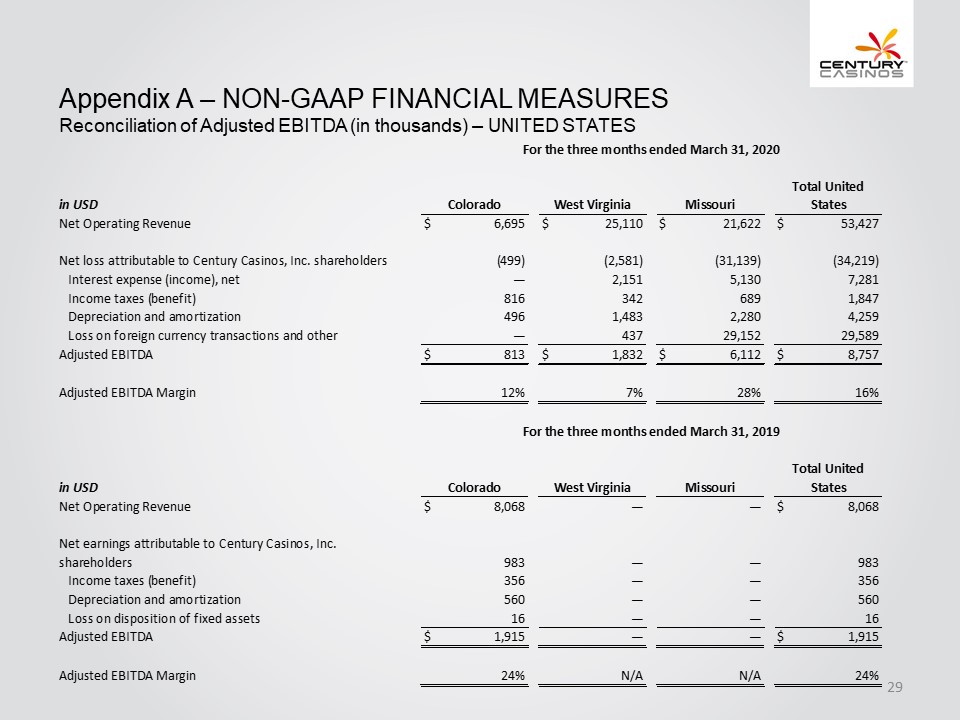
Appendix A – NON-GAAP FINANCIAL MEASURES Reconciliation of Adjusted EBITDA (in thousands) – UNITED STATES For the three months ended March 31, 2020 in USD Colorado West Virginia Missouri Total United States Net Operating Revenue $ 6,695 $ 25,110 $ 21,622 $ 53,427 Net loss attributable to Century Casinos, Inc. shareholders (499) (2,581) (31,139) (34,219) Interest expense (income), net — 2,151 5,130 7,281 Income taxes (benefit) 816 342 689 1,847 Depreciation and amortization 496 1,483 2,280 4,259 Loss on foreign currency transactions and other — 437 29,152 29,589 Adjusted EBITDA $ 813 $ 1,832 $ 6,112 $ 8,757 Adjusted EBITDA Margin 12% 7% 28% 16% For the three months ended March 31, 2019 in USD Colorado West Virginia Total United Missouri States Net Operating Revenue $ 8,068 — - $ 8,068 Net earnings attributable to Century Casinos, Inc. shareholders 983 — — 983 Income taxes (benefit) 356 — — 356 Depreciation and amortization 560 — — 560 Loss on disposition of fixed assets 16 — — 16 Adjusted EBITDA $ 1,915 — - $ 1,915 24% N/A N/A 24% Adjusted EBITDA Margin Century Casinos 29
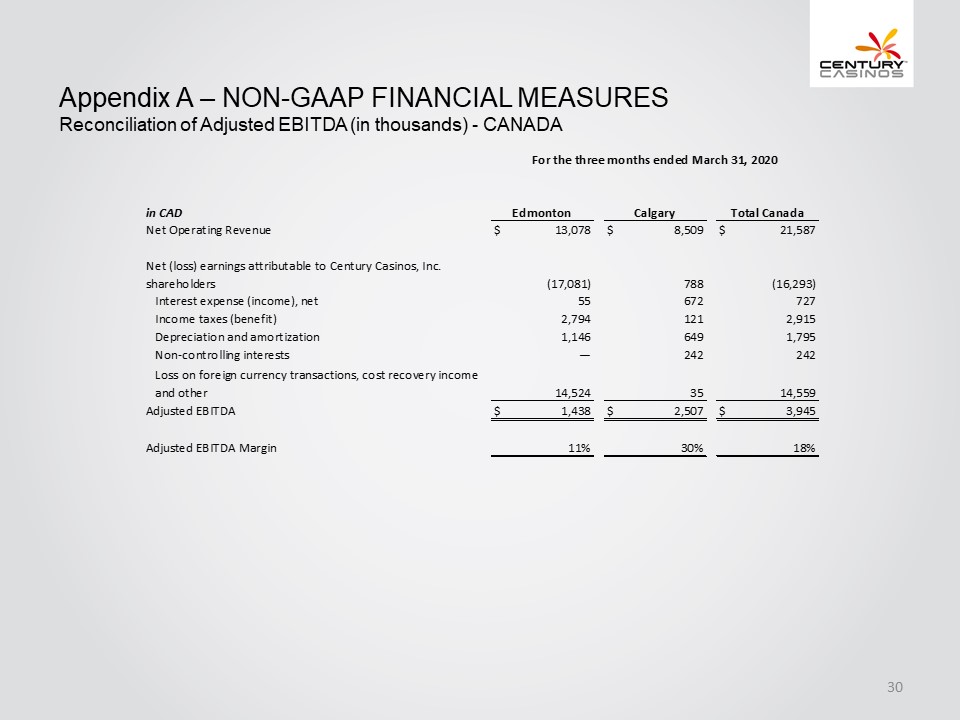
Appendix A – NON-GAAP FINANCIAL MEASURES Reconciliation of Adjusted EBITDA (in thousands) – CANADA in CAD Net Operating Revenue Net (loss) earnings attributable to Century Casinos, Inc. shareholders Interest expense (income), net Income taxes (benefit) Depreciation and amortization Non-controlling interests Loss on foreign currency transactions, cost recovery income and other Adjusted EBITDA Adjusted EBITDA Margin For the three months ended March 31, 2020 Edmonton Calgary Total Canada $ 13,078 $ 8,509 $ 21,587 (17,081) 788 (16,293) 55 672 727 2,794 121 2,915 1,146 649 1,795 — 242 242 14,524 35 14,559 $ 1,438 $ 2,507 $ 3,945 11% 30% 18% Century Casinos 30
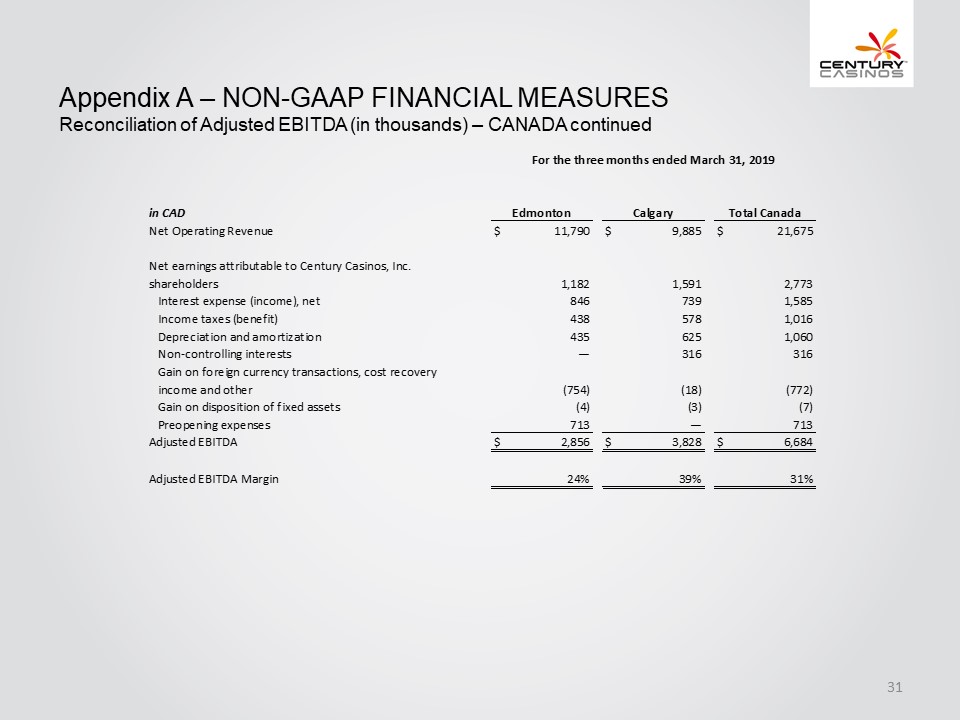
Appendix A – NON-GAAP FINANCIAL MEASURES Reconciliation of Adjusted EBITDA (in thousands) – CANADA continued in CAD Net Operating Revenue Net earnings attributable to Century Casinos, Inc. shareholders Interest expense (income), net Income taxes (benefit) Depreciation and amortization Non-controlling interests Gain on foreign currency transactions, cost recovery income and other Gain on disposition of fixed assets Preopening expenses Adjusted EBITDA Adjusted EBITDA Margin For the three months ended March 31, 2019 Edmonton Calgary Total Canada $ 11,790 $ 9,885 $ 21,675 1,182 1,591 2,773 846 739 1,585 438 578 1,016 435 625 1,060 — 316 316 (754) (18) (772) (4) (3) (7) 713 — 713 $ 2,856 $ 3,828 $ 6,684 24% 39% 31% Century Casinos 31
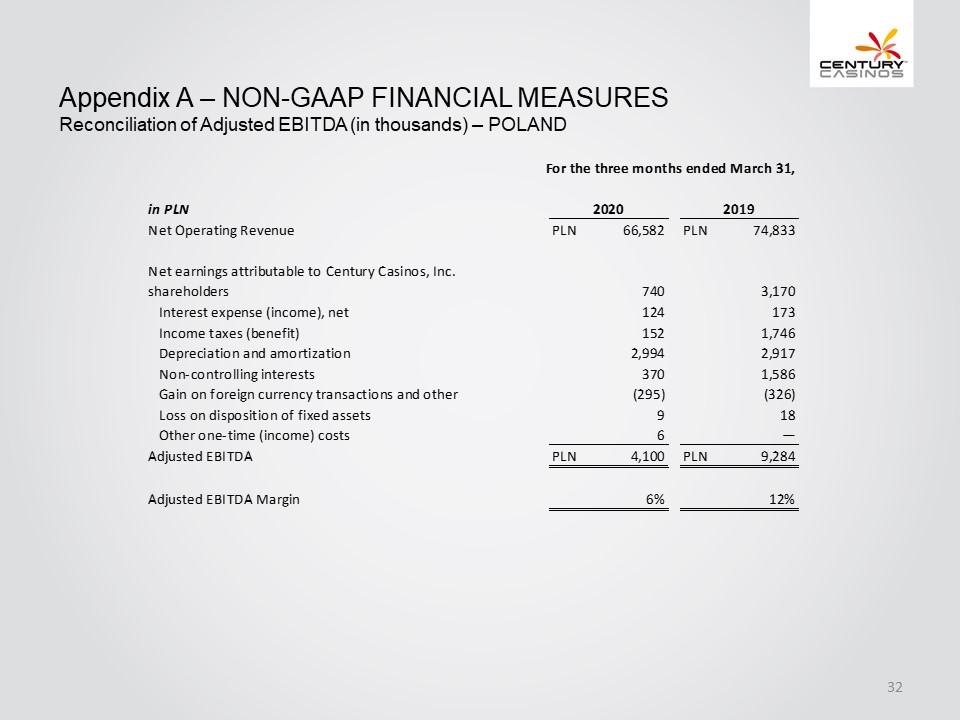
Appendix A – NON-GAAP FINANCIAL MEASURES Reconciliation of Adjusted EBITDA (in thousands) – POLAND in PLN Net Operating Revenue Net earnings attributable to Century Casinos, Inc. shareholders Interest expense (income), net Income taxes (benefit) Depreciation and amortization Non-controlling interests Gain on foreign currency transactions and other Loss on disposition of fixed assets Other one-time (income) costs Adjusted EBITDA Adjusted EBITDA Margin For the three months ended March 31, 2020 2019 PLN 66,582 PLN 74,833 740 3,170 124 173 152 1,746 2,994 2,917 370 1,586 (295) (326) 9 18 6 — PLN 4,100 PLN 9,284 6% 12% Century Casinos 32
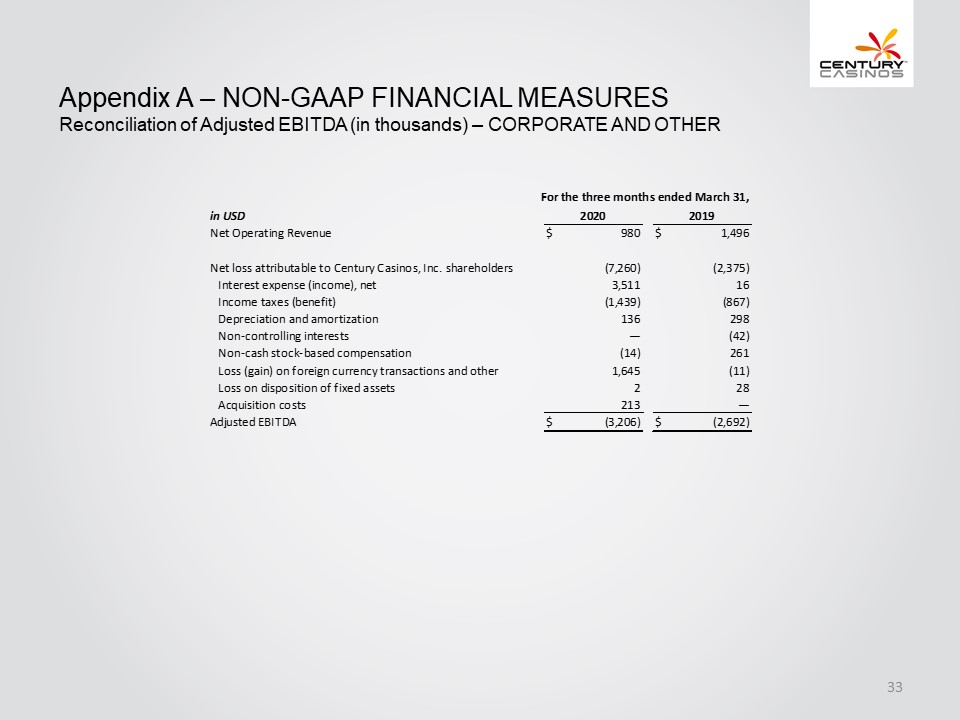
Appendix A – NON-GAAP FINANCIAL MEASURES Reconciliation of Adjusted EBITDA (in thousands) – CORPORATE AND OTHER For the three months ended March 31, in USD 2020 2019 Net Operating Revenue $ 980 $ 1,496 Net loss attributable to Century Casinos, Inc. shareholders (7,260) (2,375) Interest expense (income), net 3,511 16 Income taxes (benefit) (1,439) (867) Depreciation and amortization 136 298 Non-control ling interests — (42) Non-cash stock-based compensation (14) 261 Loss (gain) on foreign currency transactions and other 1,645 (11) Loss on disposition of fixed assets 2 28 Acquisition costs 213 — Adjusted EBITDA $ (3,206) $ (2,692) Century Casinos 33
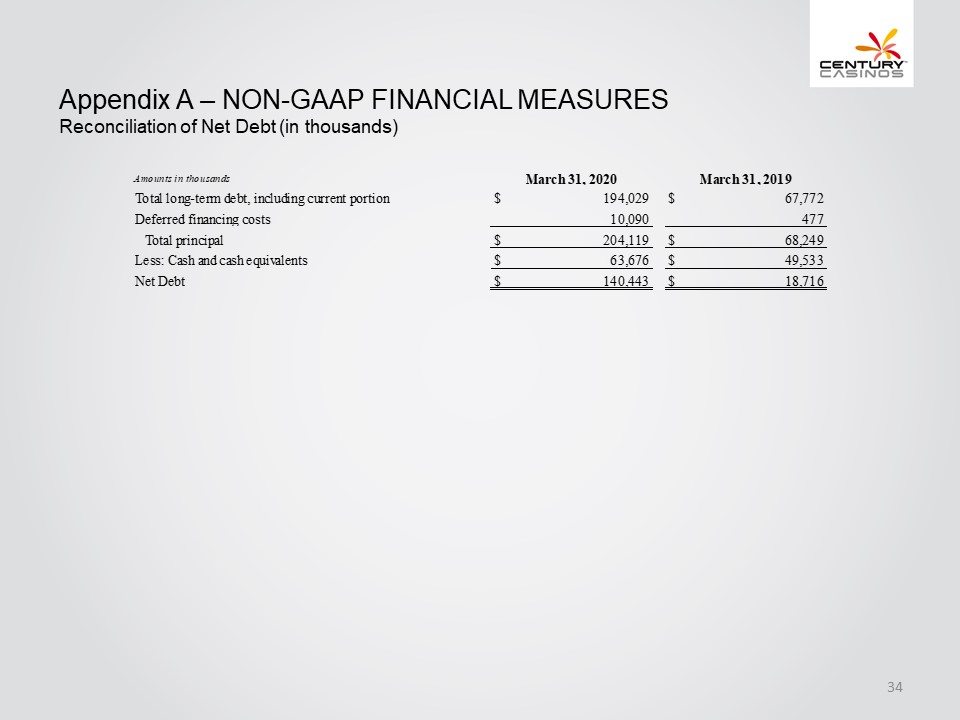
Appendix A – NON-GAAP FINANCIAL MEASURES Reconciliation of Net Debt (in thousands) Amounts in thousands Total long-term debt, including current portion Deferred financing costs Total principal Less: Cash and cash equivalents Net Debt March 31, 2020 $ 194.029 10.090 $ 204.119 $ 63,676 $ 140.443 March 31, 2019 $ 67,772 411 $ 68,249 $ 49,533 $ 18.716 Century Casinos 34