Attached files
| file | filename |
|---|---|
| 8-K - FORM 8-K - Village Bank & Trust Financial Corp. | tm2020236d1_8k.htm |

You're a Neighbor, Not a Number 2020 Annual Shareholders Meeting Exhibit 99.1

Cautionary Statement Regarding Forward - Looking Statements This presentation contains forward - looking statements within the meaning of the Private Securities Litigation Reform Act of 1995. These forward - looking statements include, but are not limited to, statements about (i) the Company’s plans, objectives, expectations and intentions and other statements contained in this presentation that are not historical facts; and (ii) other statements identified by words such as “expects” “anticipates,” “intends,” “plans,” “believes,” “seeks,” “estimates,” “targets,” “projects,” or words of similar meaning generally intended to identify forward - looking statements. These forward - looking statements are based on the current beliefs and expectations of the Company’s management and are inherently subject to significant business, economic and competitive uncertainties and contingencies, many of which are beyond management’s control. In addition, these forward - looking statements are subject to assumptions with respect to future business strategies and decisions that are subject to change. Actual results may differ materially from the anticipated results discussed or implied in these forward - looking statements because of numerous possible uncertainties. The following factors, among others, could cause actual results to differ materially from the anticipated results or other expectations expressed in the forward - looking statements: (1) adverse governmental or regulatory policies may be enacted; (2) the interest rate environment may compress margins and adversely affect net interest income; (3) results may be adversely affected by continued diversification of assets and adverse changes to credit quality; (4) competition from other financial services companies in the Company’s markets could adversely affect operations; (5) a change in the current economic environment could adversely affect credit quality and loan originations ; (6) adverse effects due to COVID - 19 on the Company and its customers, counterparties, employees, and third - party service provides, and the adverse impacts to our business, financial position, results of operations, and prospects; and (7) social and political conditions such as war, political unrest and terrorism or natural disasters could have unpredictable negative effects on our businesses and the economy. Additional factors that could cause actual results to differ materially from those expressed in the forward - looking statements are discussed in the Company’s reports (such as our Annual Report on Form 10 - K, Quarterly Reports on Form 10 - Q and Current Reports on Form 8 - K) filed with the Securities and Exchange Commission and available on the SEC’s website at www.sec.gov. 1
Non - GAAP Financial Measures The accounting and reporting polices of the Company conform to generally accepted accounting principles (“GAAP”) in the United States and prevailing practices in the banking industry. However, management uses certain non - GAAP measures to supplement the evaluation of the Company’s performance. These measures include core operating income for the consolidated entity, the commercial banking segment, and the mortgage banking segment. Management believes presentations of these non - GAAP financial measures provide useful supplemental information that is essential to a proper understanding of the operating results of the Company’s core businesses. These non - GAAP disclosures should not be viewed as a substitute for operating results determined in accordance with GAAP, nor are they necessarily comparable to non - GAAP performance measures that may be presented by other companies. Reconciliations of GAAP to non - GAAP disclosures are included as tables at the end of this presentation. 2

Our Strategy Is Built Around Delivering Top Quartile Long Term Returns To Our Shareholders This Means… • Top Quartile Return on Tangible Common Equity • Sustained High Single Digit Earnings Per Share Growth • Best Quartile Asset Quality in Worst Part of Cycle • Best Quartile Earnings Volatility 3
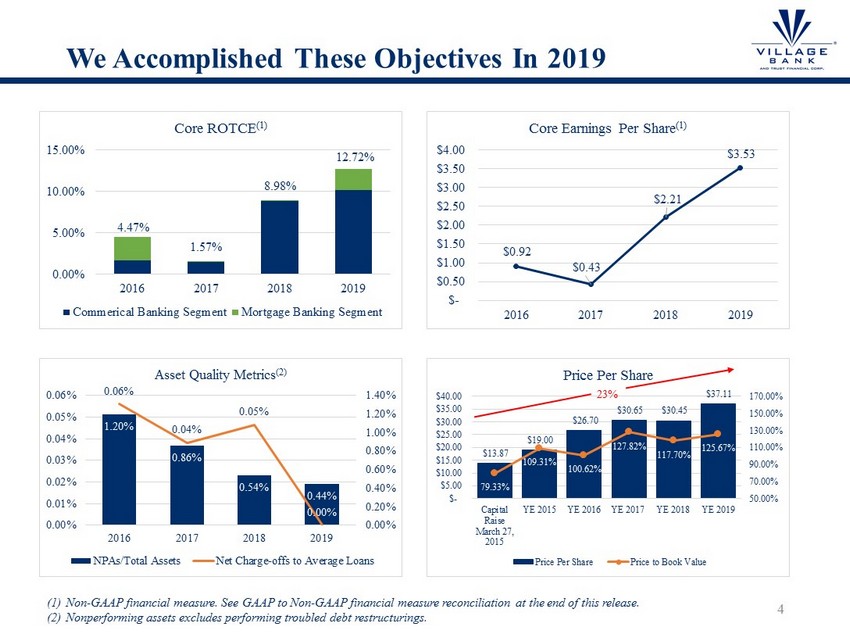
We Accomplished These Objectives In 2019 4 $13.87 $19.00 $26.70 $30.65 $30.45 $37.11 79.33% 109.31% 100.62% 127.82% 117.70% 125.67% 50.00% 70.00% 90.00% 110.00% 130.00% 150.00% 170.00% $- $5.00 $10.00 $15.00 $20.00 $25.00 $30.00 $35.00 $40.00 Capital Raise March 27, 2015 YE 2015 YE 2016 YE 2017 YE 2018 YE 2019 Price Per Share Price Per Share Price to Book Value 23% (1) Non - GAAP financial measure. See GAAP to Non - GAAP financial measure reconciliation at the end of this release . (2) Nonperforming assets excludes performing troubled debt restructurings. 1.20% 0.86% 0.54% 0.44% 0.06% 0.04% 0.05% 0.00% 0.00% 0.20% 0.40% 0.60% 0.80% 1.00% 1.20% 1.40% 2016 2017 2018 2019 0.00% 0.01% 0.02% 0.03% 0.04% 0.05% 0.06% Asset Quality Metrics (2) NPAs/Total Assets Net Charge-offs to Average Loans 4.47% 1.57% 8.98% 12.72% 0.00% 5.00% 10.00% 15.00% 2016 2017 2018 2019 Core ROTCE (1) Commerical Banking Segment Mortgage Banking Segment $0.92 $0.43 $2.21 $3.53 $- $0.50 $1.00 $1.50 $2.00 $2.50 $3.00 $3.50 $4.00 2016 2017 2018 2019 Core Earnings Per Share (1)

In Q1 2020, We Reported Improvement In Many Areas, But Felt The Impact of The Pandemic in NIM and Provision Factors positively impacting Q1 results : • Solid core loan growth (+1.74% vs. Q4 2019 and +7.09% vs. Q1 2019) • Very strong noninterest bearing deposit growth (+6.43% vs. Q4 2019 and +13.62% vs. Q1 2019) • Commercial Banking service charge growth (+13.10% vs. Q1 2019) • Commercial Banking noninterest expense reductions ( - 4.04% vs. Q1 2019) • Strong mortgage purchase and refinance market due to low rates and warm weather Factors negatively impacting Q1 results : • Margin pressure vs. Q1 2019 due to aggressive Fed interest rate cuts (but improvement from Q4 2019) • Provision Expense largely due to changes in economic conditions but not yet evident in credit quality metrics 5 (Dollars in thousands, expect per share amounts) March 31, December 31, March 31, 2020 2019 2019 Balance Sheet Data Total assets $ 570,205 $ 540,313 $ 522,274 Investment securities 39,081 46,937 41,835 Loans held for sale (1) 17,219 12,722 5,218 Loans, net 432,494 426,873 415,520 Deposits 468,843 443,208 443,400 Borrowings 50,368 48,676 35,335 Shareholders' equity 44,162 42,914 38,313 Book value per share $ 30.38 $ 29.53 $ 26.64 Total shares outstanding 1,453,759 1,453,009 1,438,430 (Dollars in thousands, expect per share amounts) Three Months Ended March 31, December 31, March 31, 2020 2019 2019 Select Operating Data Commercial Banking Segment Net interest income $ 4,333 $ 4,412 $ 4,403 Provision for loan losses 400 135 - Non - interest income 733 749 774 Non - interest expense 3,917 3,737 4,082 Income before income tax expense 749 1,289 1,095 Mortgage Banking Segment Income (loss) before income tax expense 388 360 (110) Consolidated Income before income tax expense $ 1,137 $ 1,649 $ 985 Select Ratios Return on average equity 8.23% 12.11% 8.69% Earnings per share $ 0.62 $ 0.90 $ 0.56 Net Interest Margin 3.55% 3.52% 3.83% Nonperforming assets to total assets 0.32% 0.44% 0.51% Net charge - offs (recoveries) to average loans 0.13% 0.05% 0.02% (1) During the first quarter of 2020, the Company elected to begin using fair value accounting for its entire portfolio of loans hel d for sale in accordance with ASC 820 - Fair Value Measurement and Disclosures.
COVID - 19 Topics 6 • Actions Taken To Manage Through The Pandemic • Loan Deferral Approach and Activity • Credit Exposure to Higher Risk Segments • Paycheck Protection Program Activity • Market Opportunity
Actions Taken To Manage Through The Pandemic 7 • Implemented our Pandemic Plan • Orchestrated table top exercises trying to prepare for extreme scenarios • Engaged business community in Richmond and Williamsburg to equip them with crisis management resources • Moved quickly to remote working for 80% of non - branch team members • Moved to drive - thru only at our branches with lobby access by appointment • Instituted conservative self - quarantining • Instituted enhanced sanitation and hygiene practices • Required masks and gloves in branches
Actions Taken To Manage Through The Pandemic 8 • Added substantial low cost balance sheet liquidity…just in case • Tested resiliency and succession preparedness of executive and branch teams • Updated credit loss and capital stress testing • Began working with borrowers on loan payment deferrals for up to six months • Very active with Small Business Administration's (“SBA”) Paycheck Protection Program (“PPP”) • We have received consistent positive feedback from our team members, clients and community
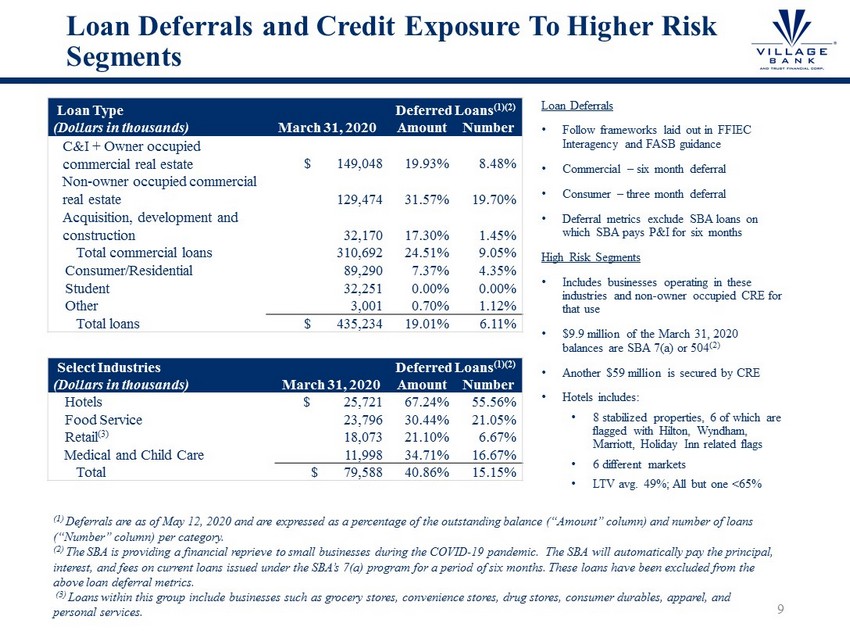
Loan Deferrals and Credit Exposure To Higher Risk Segments 9 Loan Type Deferred Loans (1)(2) (Dollars in thousands) March 31, 2020 Amount Number C&I + Owner occupied commercial real estate $ 149,048 19.93% 8.48% Non - owner occupied commercial real estate 129,474 31.57% 19.70% Acquisition, development and construction 32,170 17.30% 1.45% Total commercial loans 310,692 24.51% 9.05% Consumer/Residential 89,290 7.37% 4.35% Student 32,251 0.00% 0.00% Other 3,001 0.70% 1.12% Total loans $ 435,234 19.01% 6.11% (1) Deferrals are as of May 12, 2020 and are expressed as a percentage of the outstanding balance (“Amount” column) and number of loans (“Number” column) per category. (2) The SBA is providing a financial reprieve to small businesses during the COVID - 19 pandemic. The SBA will automatically pay the principal, interest, and fees on current loans issued under the SBA’s 7(a) program for a period of six months. These loans have been exc lud ed from the above loan deferral metrics. (3) Loans within this group include businesses such as grocery stores , convenience stores, drug stores, consumer durables, apparel, and personal services. Select Industries Deferred Loans (1)(2) (Dollars in thousands) March 31, 2020 Amount Number Hotels $ 25,721 67.24% 55.56% Food Service 23,796 30.44% 21.05% Retail (3) 18,073 21.10% 6.67% Medical and Child Care 11,998 34.71% 16.67% Total $ 79,588 40.86% 15.15% Loan Deferrals • Follow frameworks laid out in FFIEC Interagency and FASB guidance • Commercial – six month deferral • Consumer – three month deferral • Deferral metrics exclude SBA loans on which SBA pays P&I for six months High Risk Segments • Includes businesses operating in these industries and non - owner occupied CRE for that use • $9.9 million of the March 31, 2020 balances are SBA 7(a) or 504 (2) • Another $59 million is secured by CRE • Hotels includes: • 8 stabilized properties, 6 of which are flagged with Hilton, Wyndham, Marriott, Holiday Inn related flags • 6 different markets • LTV avg. 49%; All but one <65%
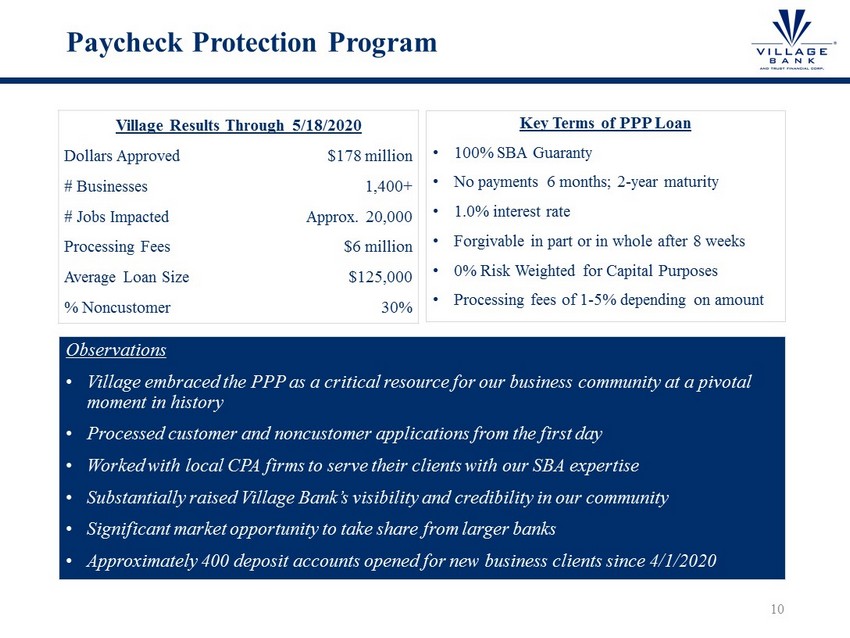
Paycheck Protection Program Village Results Through 5/18/2020 Dollars Approved $178 million # Businesses 1,400+ # Jobs Impacted Approx. 20,000 Processing Fees $6 million Average Loan Size $125,000 % Noncustomer 30% Observations • Village embraced the PPP as a critical resource for our business community at a pivotal moment in history • Processed customer and noncustomer applications from the first day • Worked with local CPA firms to serve their clients with our SBA expertise • Substantially raised Village Bank’s visibility and credibility in our community • Significant market opportunity to take share from larger banks • Approximately 400 deposit accounts opened for new business clients since 4/1/2020 10 Key Terms of PPP Loan • 100% SBA Guaranty • No payments 6 months; 2 - year maturity • 1.0% interest rate • Forgivable in part or in whole after 8 weeks • 0% Risk Weighted for Capital Purposes • Processing fees of 1 - 5% depending on amount
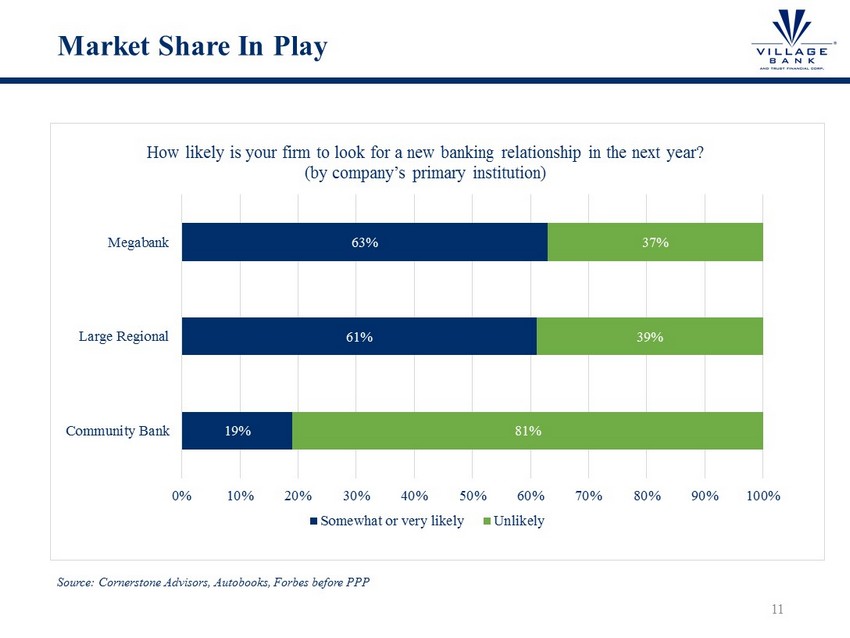
Market Share In Play 11 19% 61% 63% 81% 39% 37% 0% 10% 20% 30% 40% 50% 60% 70% 80% 90% 100% Community Bank Large Regional Megabank How likely is your firm to look for a new banking relationship in the next year? (by company’s primary institution) Somewhat or very likely Unlikely Source: Cornerstone Advisors, Autobooks , Forbes before PPP

Our Team Transformed the Company Over The Last 8 Years…And Can Lead Us Through This 12 Metric 2012 2019 Q1 2020 Profitability ( Dollars in thousands , except per share amounts) Net income (loss) available to common shareholders $ (10,399) $ 4,477 $ 898 Return on average equity (32.28%) 11.16% 8.23% Return on average assets (1.95%) 0.84% 0.67% Earnings (loss) per share (1) $ (42.40) $ 3.10 $ 0.62 Asset Quality Nonperforming assets/total assets 8.98% 0.44% 0.32% Net - charge - offs (recoveries) to average loans 3.64% 0.00% 0.13% Adversely classified assets/Tier 1 capital + ALLL 211.87% 5.74% 9.60% Allowance for loan losses/nonperforming loans 42.21% 170.57% 261.58% Bank Regulatory Capital Ratios Tier 1 leverage ratio 6.53% 9.69% 10.10% Total risk based capital ratio 10.14% 12.56% 12.64% Equity to assets (consolidated) 4.89% 7.94% 7.76% Funding Noninterest bearing deposits/total deposits 15.04% 29.61% 29.79% Time deposits/total deposits 64.99% 30.96% 29.24% (1) Earnings per share for 2012 was adjusted as a result of the 16 for 1 reverse stock split completed in 2013.

Management Team 13 Bill Foster President & CEO Jay Hendricks Chief Risk Officer Chief Operating Officer Donnie Kaloski Chief Financial Officer • CEO of the Company and the Bank since March 1, 2014. President of the Company and the Bank since August 2013. • Joined as Chief Credit Officer of the Bank in March 2012. • Independent consultant focusing on business restructuring, turnaround and strategic planning from 2008 - 2012. • 18 years with SunTrust/Crestar including Group EVP of Mid - Atlantic Commercial Banking, Group EVP of Mid - Atlantic Commercial Real Estate Banking and Senior MD/Chief Credit Officer of Corporate and Investment Banking. • More than 30 years experience in the banking industry . • Chief Operating Officer and Chief Risk Officer of the Bank since December 2016. • Chief Credit Officer of the Bank since September 2013. • 23 years with SunTrust/Crestar including roles as Chief Operational Risk Officer for mortgage and Credit and Compliance O fficer for consumer banking. • Prior to 1990, served as Bank Examiner for the Comptroller of the Currency. • More than 30 years experience in the banking industry. • Chief Financial Officer of the Company and the Bank since May 2018. • Previously served as Senior Vice President of Accounting of the Bank. • From 2007 to 2013 supervised audit teams on financial institutions throughout the country with BDO USA, LLP. • Holds a BA in Accounting and a MBA from Troy University. • Is a Certified Public Accountant and Charted Global Management Accountant. • More than 12 years experience in the accounting and banking industry.
Management Team 14 • Executive Vice President – Retail Banking since September 2009. • Previously served as Vice President Retail Manager of the Bank since 2006. • Prior to joining the Bank served in retail banking leadership roles with First Market Bank and Central Fidelity Bank. • More than 40 years experience in the banking industry . • President and Chief Executive Officer of Village Bank Mortgage Corporation since December 2017. • Member of mortgage leadership team since 2009. Served as Senior Vice President and Risk Manager. • From 1998 until 2009 served in several leadership roles with Benchmark Mortgage. • More than 20 years mortgage banking experience. Max Morehead Commercial Banking Clif Winn President & CEO Village Bank Mortgage Corp Joy Kline Retail Banking • Executive Vice President – Commercial Banking since March 2014. • 25 years with SunTrust/Crestar including leadership roles in commercial banking. • More than 30 years experience in the banking industry .

Why Village Vision, Discipline, Execution – We think and behave like long term investors Market – Strong market position in a very attractive market Opportunity – Excellent opportunity to take m arket share Differentiated – A strong community bank with a successful mortgage company Transparency and Candor – Effective shareholder communications We Deliver Results – Excellent shareholder returns over the last five years. 15
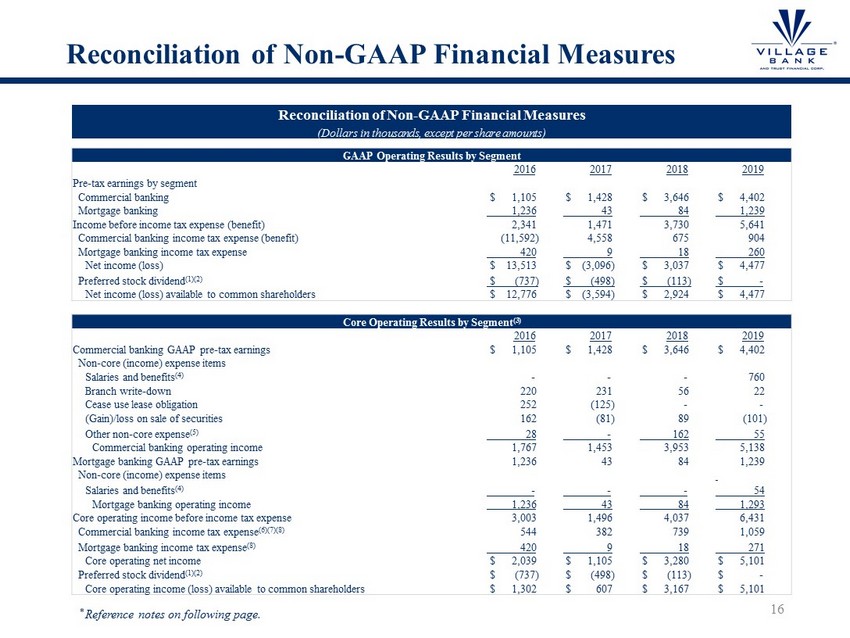
Reconciliation of Non - GAAP Financial Measures 16 Reconciliation of Non - GAAP Financial Measures (Dollars in thousands, except per share amounts) GAAP Operating Results by Segment 2016 2017 2018 2019 Pre - tax earnings by segment Commercial banking $ 1,105 $ 1,428 $ 3,646 $ 4,402 Mortgage banking 1,236 43 84 1,239 Income before income tax expense (benefit) 2,341 1,471 3,730 5,641 Commercial banking income tax expense (benefit) (11,592) 4,558 675 904 Mortgage banking income tax expense 420 9 18 260 Net income (loss) $ 13,513 $ (3,096) $ 3,037 $ 4,477 Preferred stock dividend (1)(2) $ (737) $ (498) $ (113) $ - Net income (loss) available to common shareholders $ 12,776 $ (3,594) $ 2,924 $ 4,477 Core Operating Results by Segment (3) 2016 2017 2018 2019 Commercial banking GAAP pre - tax earnings $ 1,105 $ 1,428 $ 3,646 $ 4,402 Non - core (income) expense items Salaries and benefits (4) - - - 760 Branch write - down 220 231 56 22 Cease use lease obligation 252 (125) - - (Gain)/loss on sale of securities 162 (81) 89 (101) Other non - core expense (5) 28 - 162 55 Commercial banking operating income 1,767 1,453 3,953 5,138 Mortgage banking GAAP pre - tax earnings 1,236 43 84 1,239 Non - core (income) expense items Salaries and benefits (4) - - - 54 Mortgage banking operating income 1,236 43 84 1,293 Core operating income before income tax expense 3,003 1,496 4,037 6,431 Commercial banking income tax expense (6)(7)(8) 544 382 739 1,059 Mortgage banking income tax expense (8) 420 9 18 271 Core operating net income $ 2,039 $ 1,105 $ 3,280 $ 5,101 Preferred stock dividend (1)(2) $ (737) $ (498) $ (113) $ - Core operating income (loss) available to common shareholders $ 1,302 $ 607 $ 3,167 $ 5,101 * Reference notes on following page.
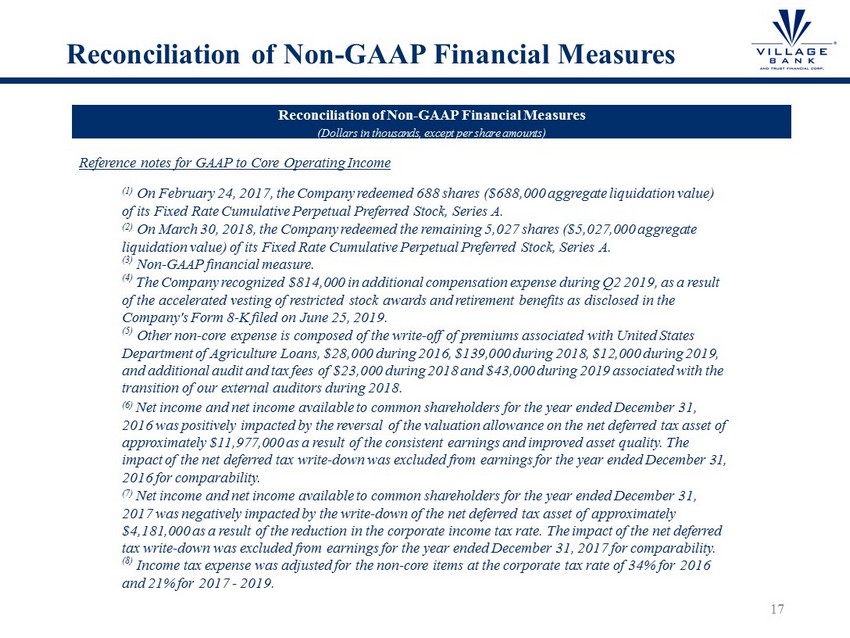
Reconciliation of Non - GAAP Financial Measures 17 Reconciliation of Non - GAAP Financial Measures (Dollars in thousands, except per share amounts) (1) On February 24, 2017, the Company redeemed 688 shares ($688,000 aggregate liquidation value) of its Fixed Rate Cumulative Perpetual Preferred Stock, Series A. (2) On March 30, 2018, the Company redeemed the remaining 5,027 shares ($5,027,000 aggregate liquidation value) of its Fixed Rate Cumulative Perpetual Preferred Stock, Series A. (3) Non - GAAP financial measure. (4) The Company recognized $814,000 in additional compensation expense during Q2 2019, as a result of the accelerated vesting of restricted stock awards and retirement benefits as disclosed in the Company's Form 8 - K filed on June 25, 2019. (5) Other non - core expense is composed of the write - off of premiums associated with United States Department of Agriculture Loans, $28,000 during 2016, $139,000 during 2018, $12,000 during 2019, and additional audit and tax fees of $23,000 during 2018 and $43,000 during 2019 associated with the transition of our external auditors during 2018. (6) Net income and net income available to common shareholders for the year ended December 31, 2016 was positively impacted by the reversal of the valuation allowance on the net deferred tax asset of approximately $11,977,000 as a result of the consistent earnings and improved asset quality. The impact of the net deferred tax write - down was excluded from earnings for the year ended December 31, 2016 for comparability. (7) Net income and net income available to common shareholders for the year ended December 31, 2017 was negatively impacted by the write - down of the net deferred tax asset of approximately $4,181,000 as a result of the reduction in the corporate income tax rate. The impact of the net deferred tax write - down was excluded from earnings for the year ended December 31, 2017 for comparability. (8) Income tax expense was adjusted for the non - core items at the corporate tax rate of 34% for 2016 and 21% for 2017 - 2019. Reference notes for GAAP to Core Operating Income
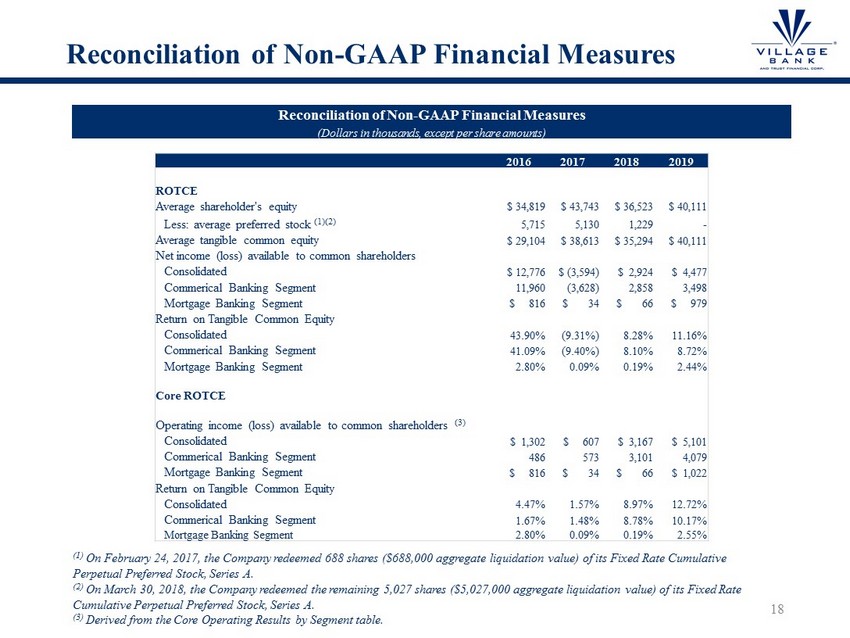
Reconciliation of Non - GAAP Financial Measures 18 Reconciliation of Non - GAAP Financial Measures (Dollars in thousands, except per share amounts) 2016 2017 2018 2019 ROTCE Average shareholder's equity $ 34,819 $ 43,743 $ 36,523 $ 40,111 Less: average preferred stock (1)(2) 5,715 5,130 1,229 - Average tangible common equity $ 29,104 $ 38,613 $ 35,294 $ 40,111 Net income (loss) available to common shareholders Consolidated $ 12,776 $ (3,594) $ 2,924 $ 4,477 Commerical Banking Segment 11,960 (3,628) 2,858 3,498 Mortgage Banking Segment $ 816 $ 34 $ 66 $ 979 Return on Tangible Common Equity Consolidated 43.90% (9.31%) 8.28% 11.16% Commerical Banking Segment 41.09% (9.40%) 8.10% 8.72% Mortgage Banking Segment 2.80% 0.09% 0.19% 2.44% Core ROTCE Operating income (loss) available to common shareholders (3) Consolidated $ 1,302 $ 607 $ 3,167 $ 5,101 Commerical Banking Segment 486 573 3,101 4,079 Mortgage Banking Segment $ 816 $ 34 $ 66 $ 1,022 Return on Tangible Common Equity Consolidated 4.47% 1.57% 8.97% 12.72% Commerical Banking Segment 1.67% 1.48% 8.78% 10.17% Mortgage Banking Segment 2.80% 0.09% 0.19% 2.55% (1) On February 24, 2017, the Company redeemed 688 shares ($688,000 aggregate liquidation value) of its Fixed Rate Cumulative Perpetual Preferred Stock, Series A. (2) On March 30, 2018, the Company redeemed the remaining 5,027 shares ($5,027,000 aggregate liquidation value) of its Fixed Rate Cumulative Perpetual Preferred Stock, Series A. (3) Derived from the Core Operating Results by Segment table.
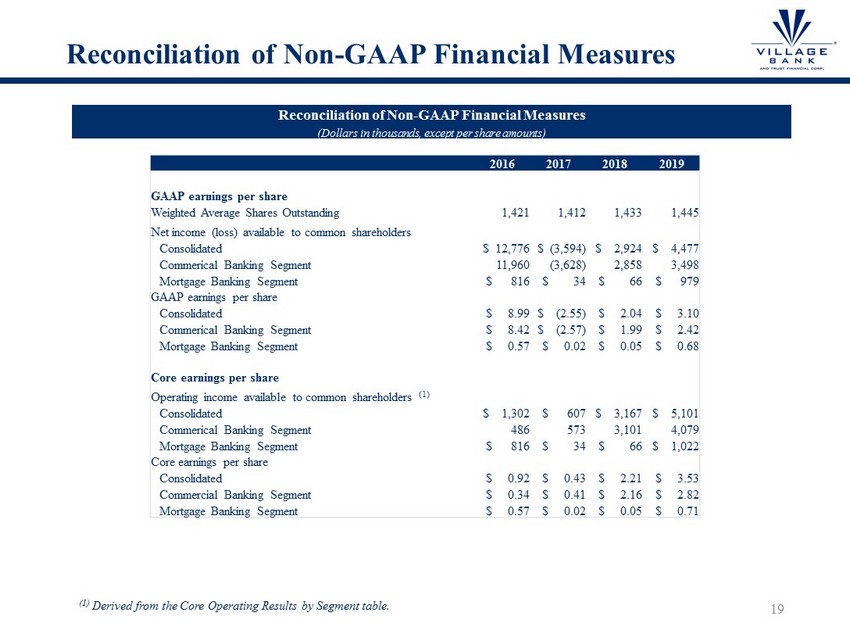
Reconciliation of Non - GAAP Financial Measures 19 Reconciliation of Non - GAAP Financial Measures (Dollars in thousands, except per share amounts) 2016 2017 2018 2019 GAAP earnings per share Weighted Average Shares Outstanding 1,421 1,412 1,433 1,445 Net income (loss) available to common shareholders Consolidated $ 12,776 $ (3,594) $ 2,924 $ 4,477 Commerical Banking Segment 11,960 (3,628) 2,858 3,498 Mortgage Banking Segment $ 816 $ 34 $ 66 $ 979 GAAP earnings per share Consolidated $ 8.99 $ (2.55) $ 2.04 $ 3.10 Commerical Banking Segment $ 8.42 $ (2.57) $ 1.99 $ 2.42 Mortgage Banking Segment $ 0.57 $ 0.02 $ 0.05 $ 0.68 Core earnings per share Operating income available to common shareholders (1) Consolidated $ 1,302 $ 607 $ 3,167 $ 5,101 Commerical Banking Segment 486 573 3,101 4,079 Mortgage Banking Segment $ 816 $ 34 $ 66 $ 1,022 Core earnings per share Consolidated $ 0.92 $ 0.43 $ 2.21 $ 3.53 Commercial Banking Segment $ 0.34 $ 0.41 $ 2.16 $ 2.82 Mortgage Banking Segment $ 0.57 $ 0.02 $ 0.05 $ 0.71 (1) Derived from the Core Operating Results by Segment table.