Attached files
| file | filename |
|---|---|
| 8-K - 8-K - FAUQUIER BANKSHARES, INC. | fbss-8k_20200519.htm |

2 + Fauquier Bankshares, Inc. 2020 Annual Shareholders’ Meeting May 19, 2020
Today’s presentations may include forward-looking statements. These statements represent the Company’s beliefs regarding future events that, by their nature, are uncertain and outside of the Company’s control. The Company’s actual results and financial condition may differ, possibly materially, from what is indicated in these forward-looking statements. Additional information concerning the Company and its business, including additional factors that could materially affect the Company’s financial results, is included in the Company’s Annual Report on Form 10-K for the year ended December 31, 2019 under “Management’s Discussion and Analysis of Financial Condition and Results of Operation.” Safe Harbor Statement
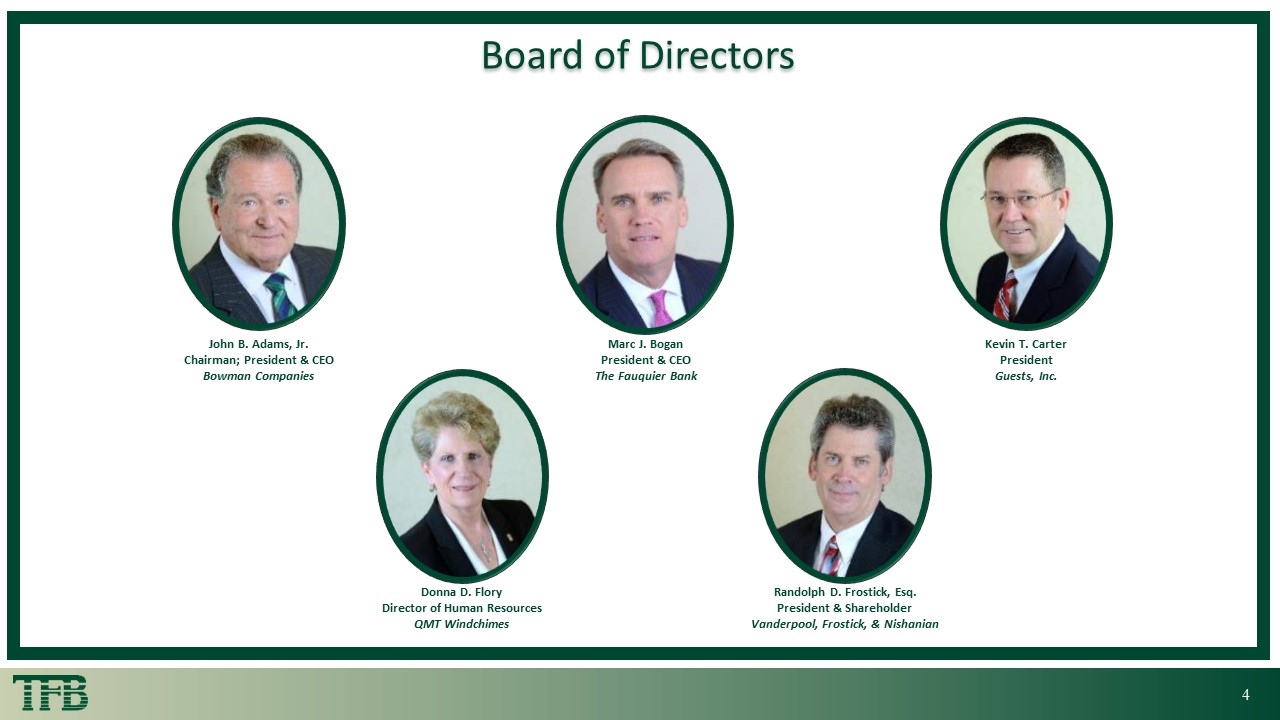
2 + Board of Directors Randolph D. Frostick, Esq. President & Shareholder Vanderpool, Frostick, & Nishanian Donna D. Flory Director of Human Resources QMT Windchimes Kevin T. Carter President Guests, Inc. John B. Adams, Jr. Chairman; President & CEO Bowman Companies Marc J. Bogan President & CEO The Fauquier Bank
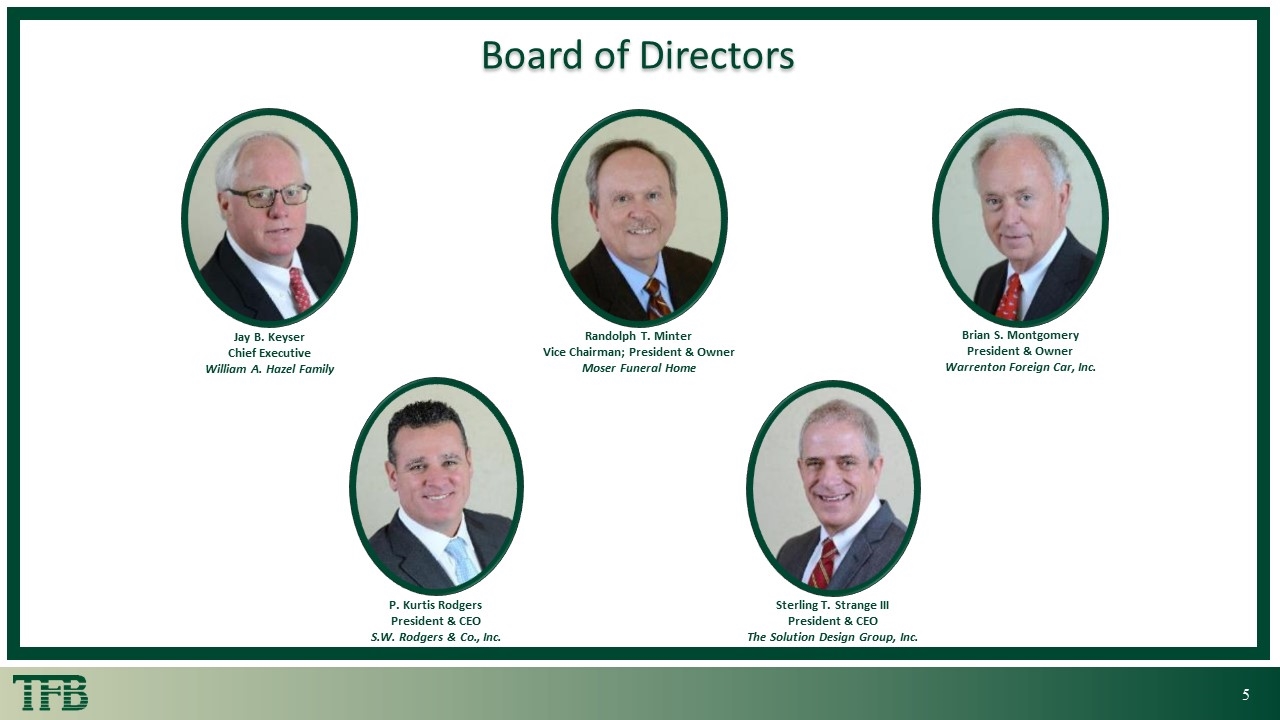
2 + Board of Directors Sterling T. Strange III President & CEO The Solution Design Group, Inc. P. Kurtis Rodgers President & CEO S.W. Rodgers & Co., Inc. Brian S. Montgomery President & Owner Warrenton Foreign Car, Inc. Randolph T. Minter Vice Chairman; President & Owner Moser Funeral Home Jay B. Keyser Chief Executive William A. Hazel Family
The Fauquier Bank seeks Excellence through an Engaged and Empowered Team, building valued Relationships with our Customers and Community
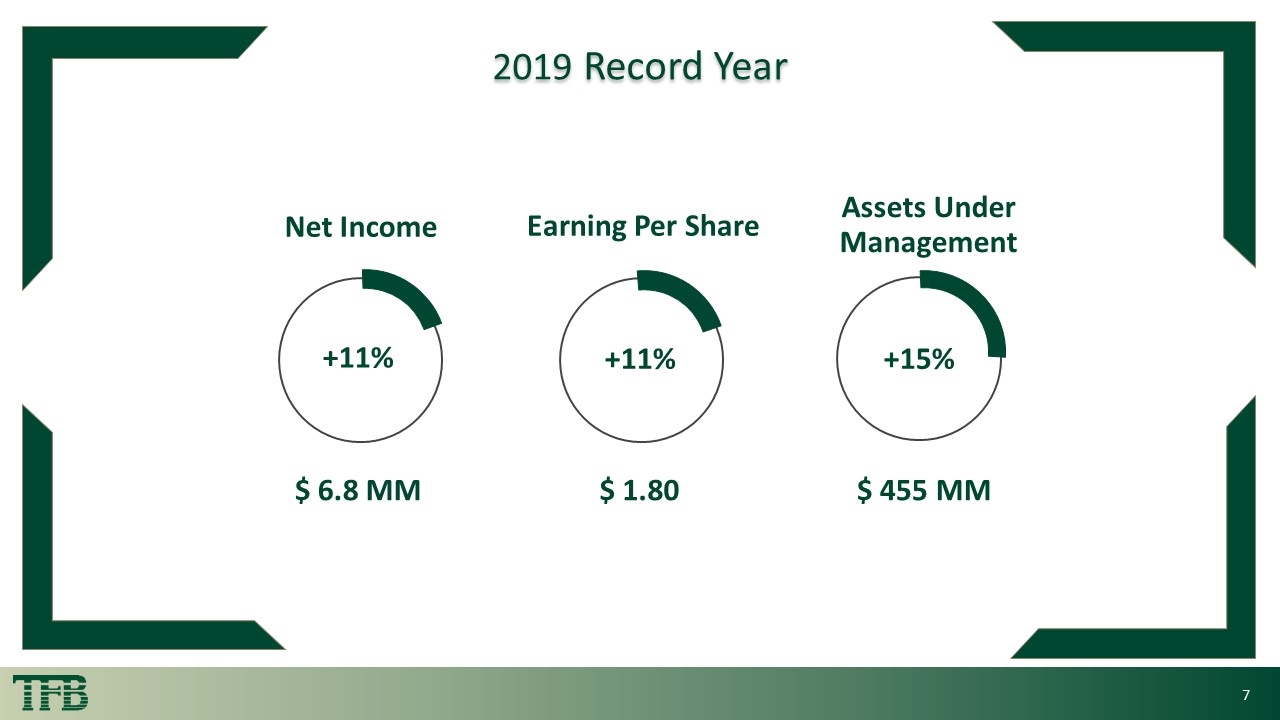
2 + 2 + Title 2019 Record Year $ 6.8 MM +11% Net Income $ 1.80 +11% Earning Per Share $ 455 MM +15% Assets Under Management
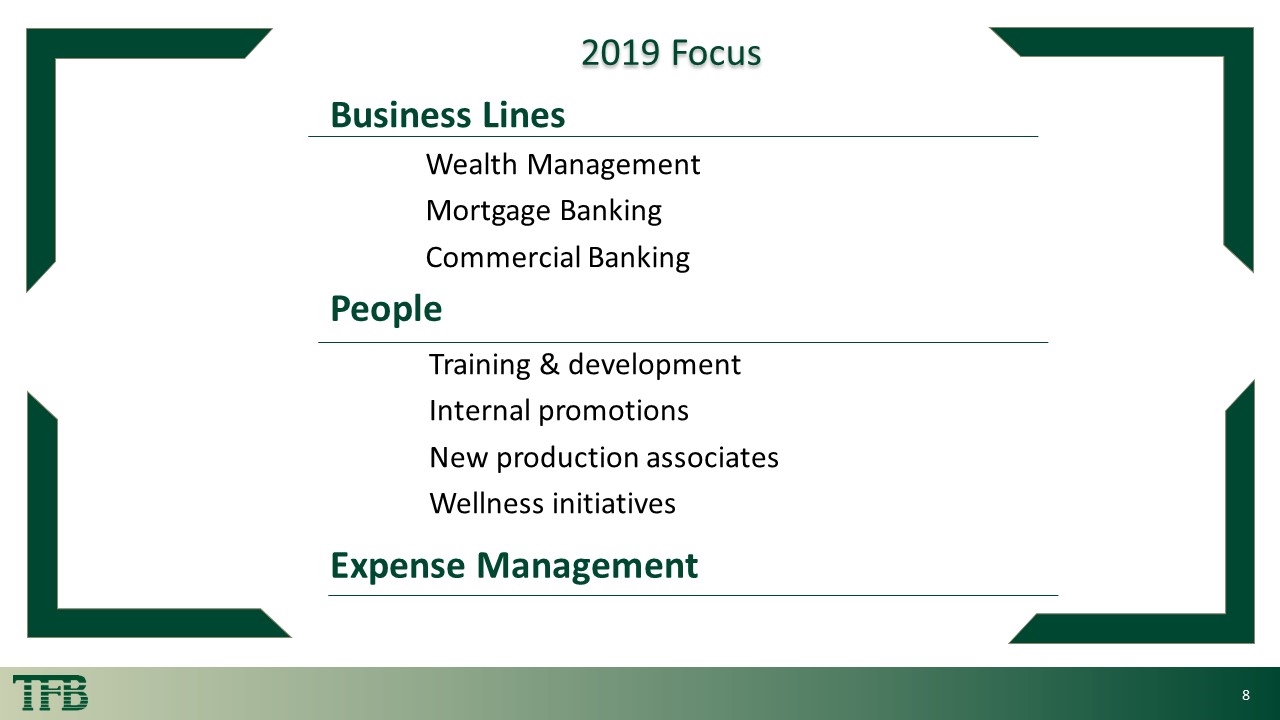
Expense Management Wealth Management Mortgage Banking Commercial Banking 2 + 2 + Title 2019 Focus Business Lines People Training & development Internal promotions New production associates Wellness initiatives
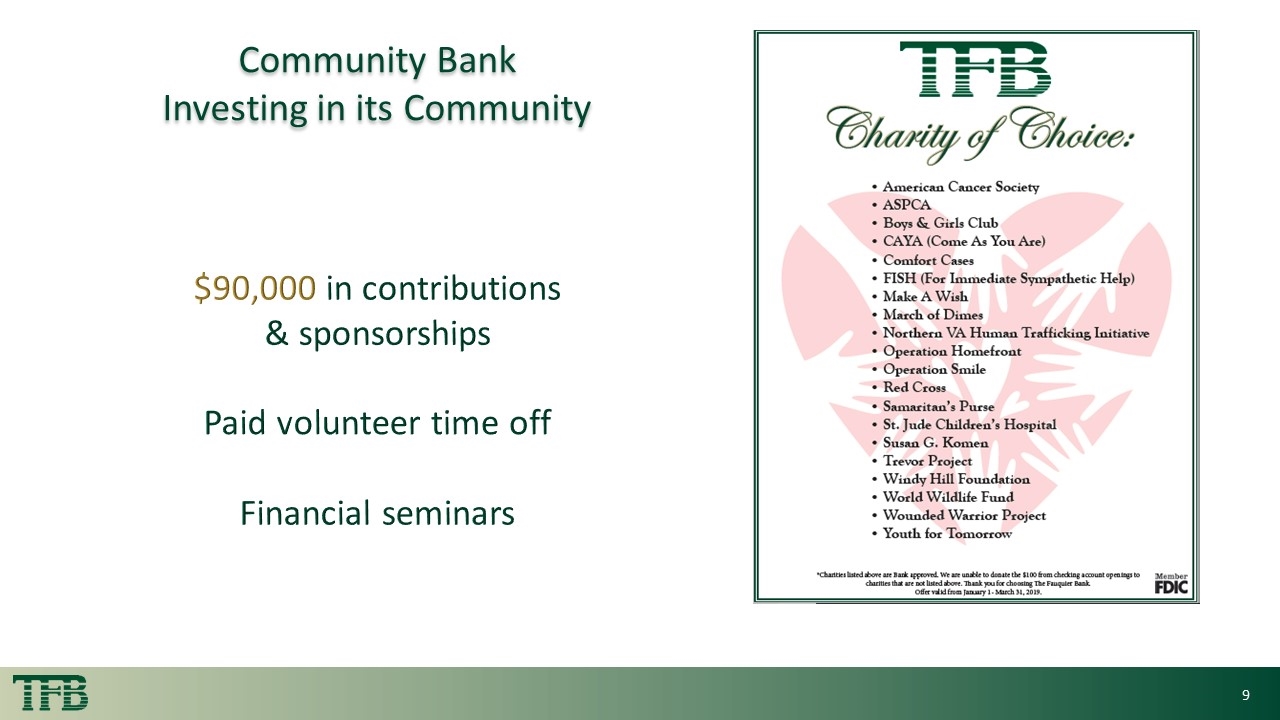
2 + 2 + Title $90,000 in contributions & sponsorships Paid volunteer time off Financial seminars Community Bank Investing in its Community
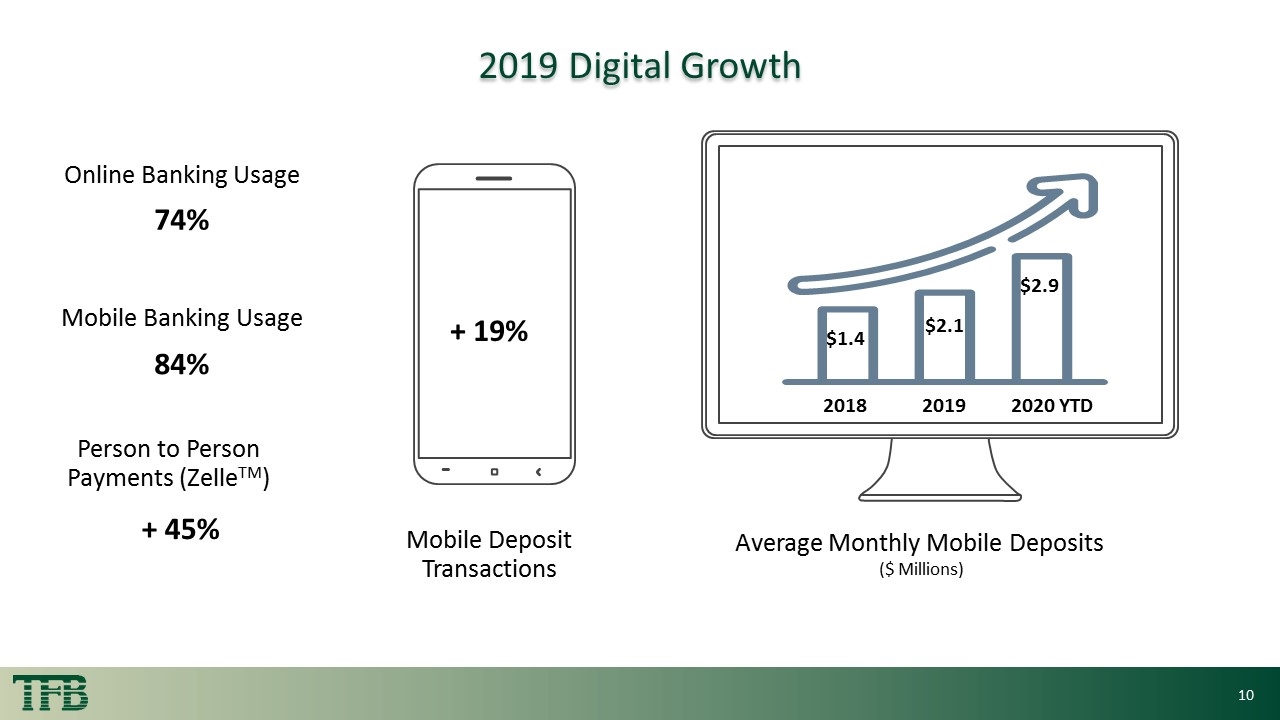
2 + 2 + Title 2019 Digital Growth + 19% Mobile Deposit Transactions 2019 74% Mobile Banking Usage Average Monthly Mobile Deposits ($ Millions) $1.4 Online Banking Usage $2.9 $2.1 2018 2020 YTD 84% Person to Person Payments (ZelleTM) + 45%
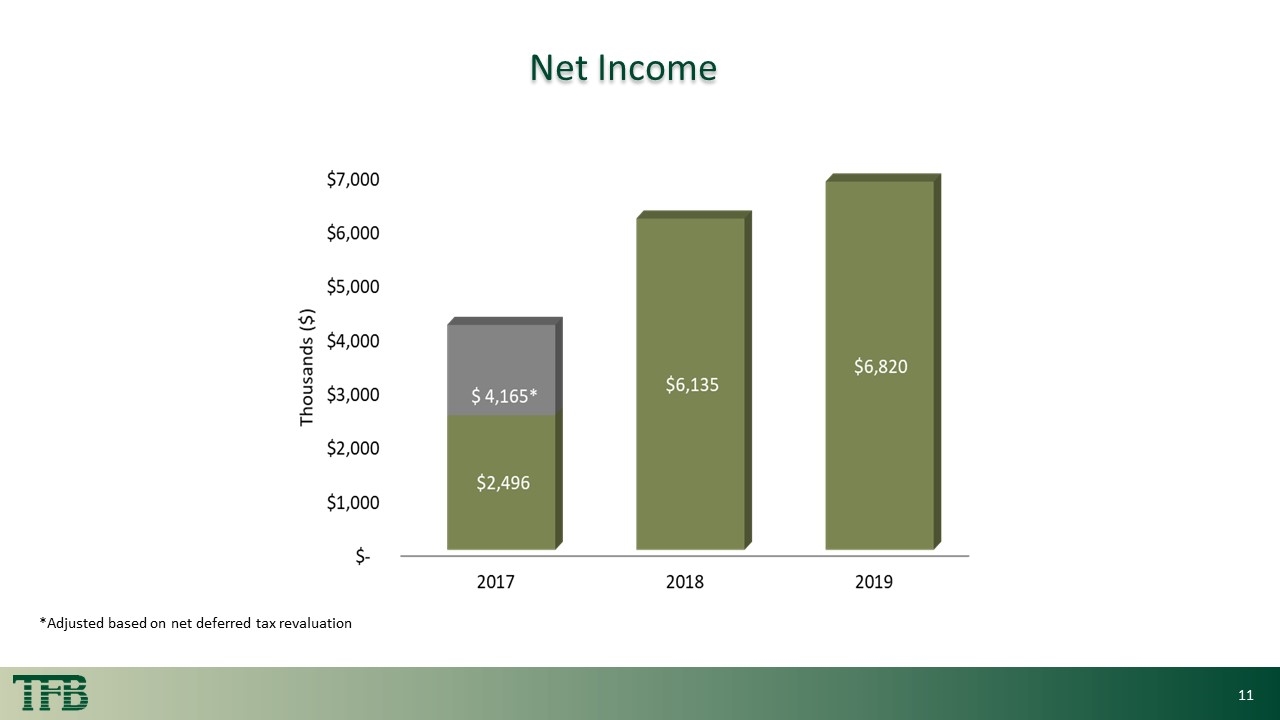
2 + 2 + Title *Adjusted based on net deferred tax revaluation Net Income
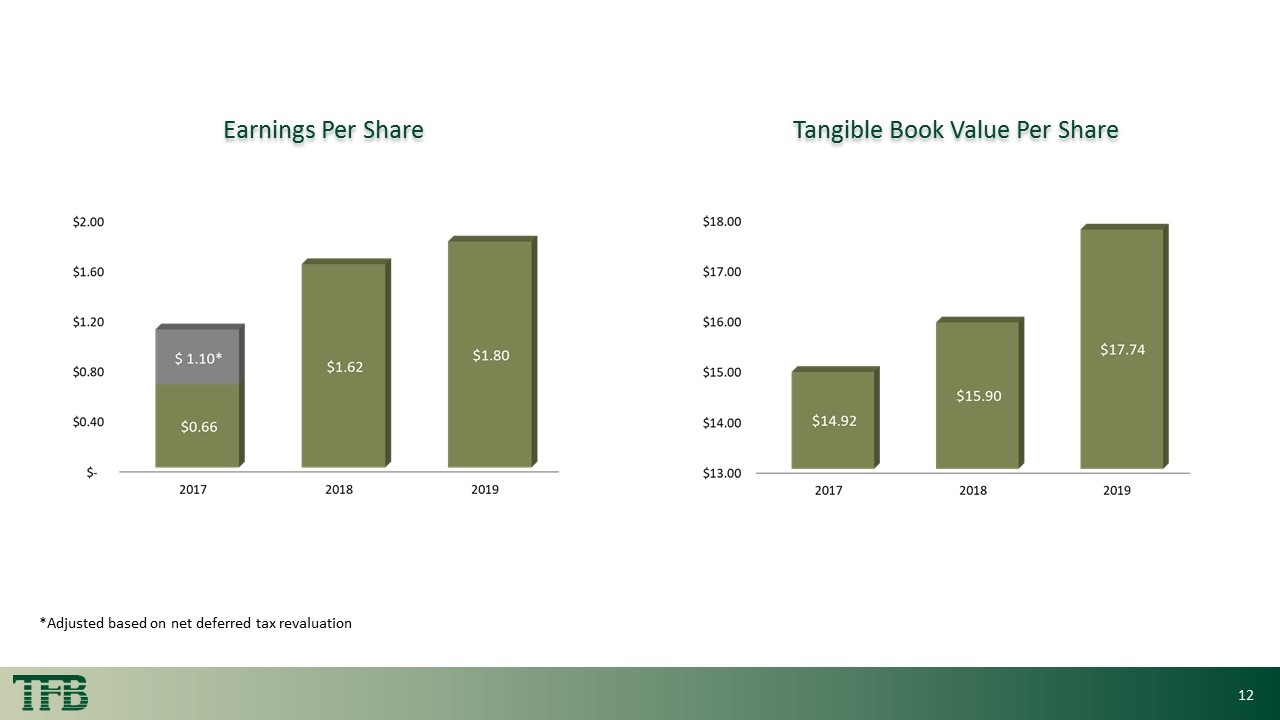
2 + Title Earnings Per Share Tangible Book Value Per Share *Adjusted based on net deferred tax revaluation
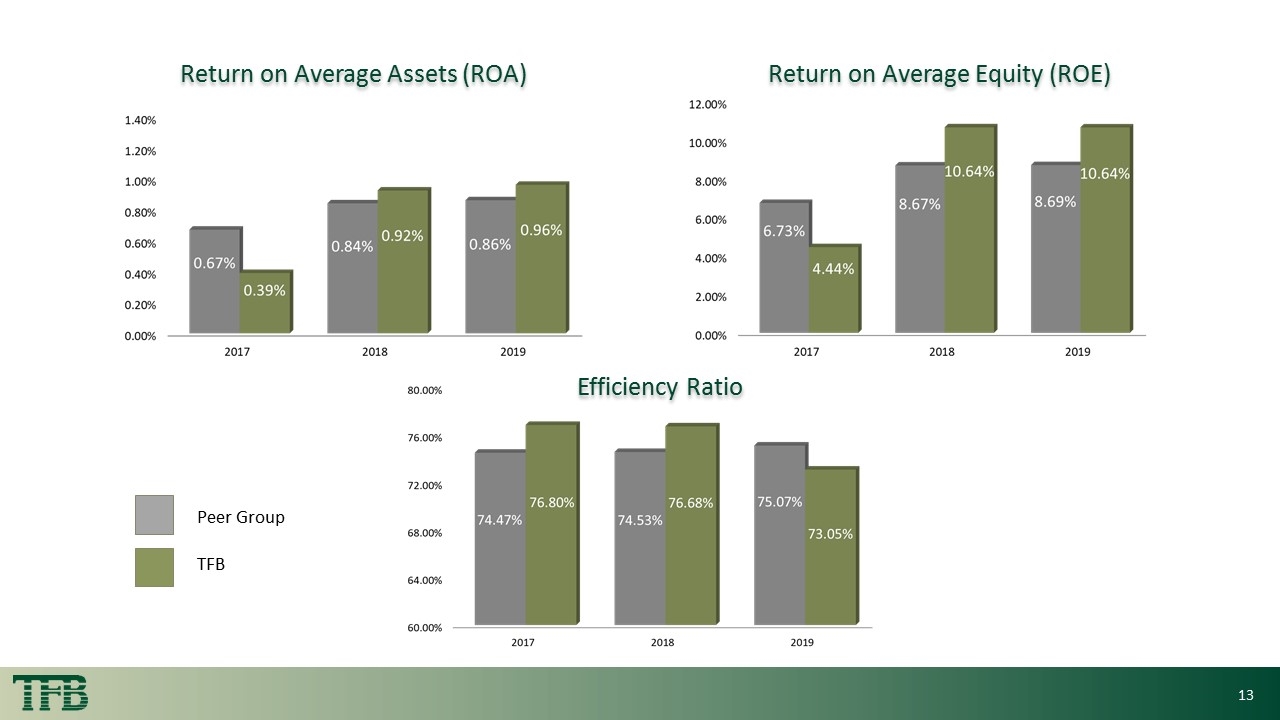
2 + Title Return on Average Assets (ROA) Efficiency Ratio Return on Average Equity (ROE) Peer Group TFB
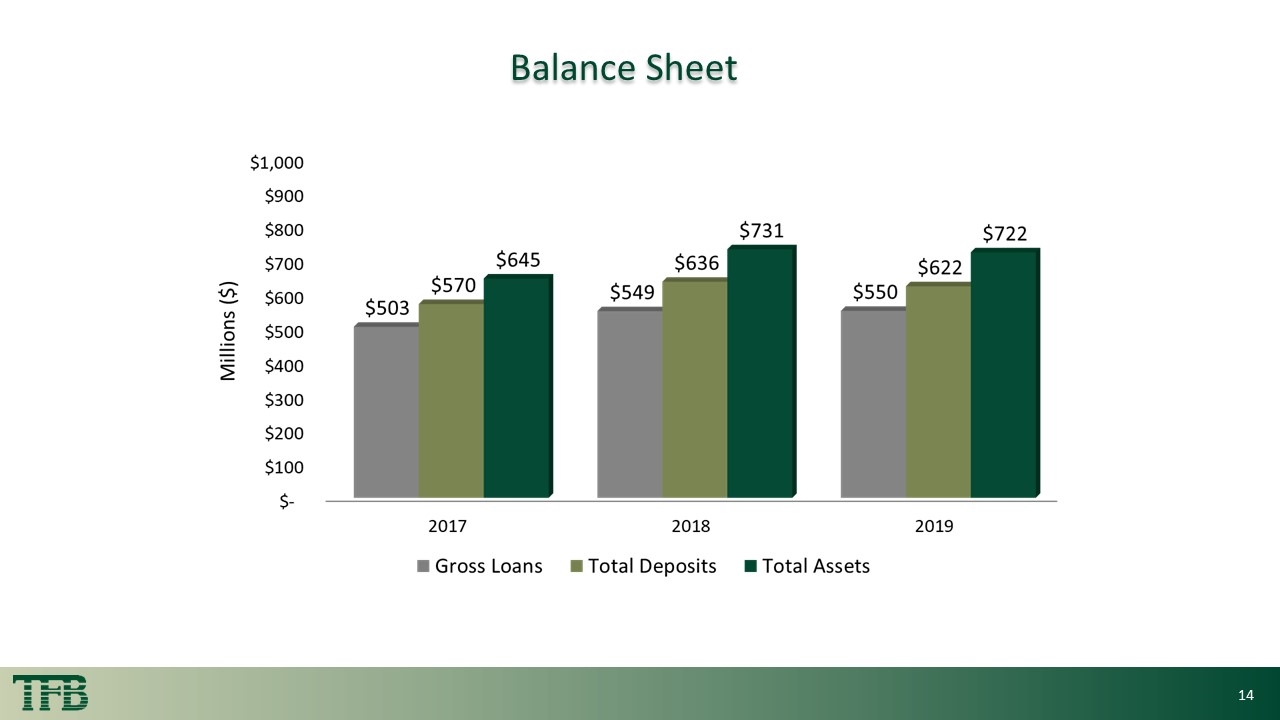
2 + 2 + Title Balance Sheet
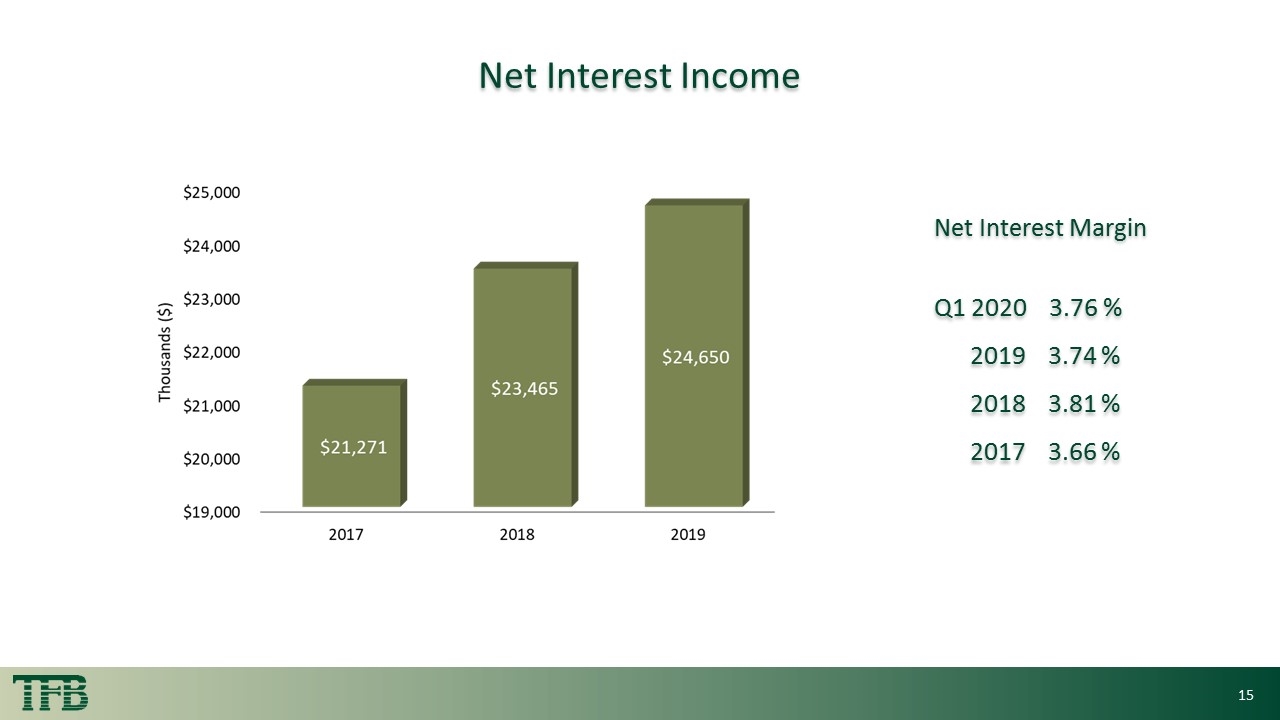
2 + Title Net Interest Income Net Interest Margin Q1 2020 3.76 % 2019 3.74 % 2018 3.81 % 2017 3.66 %
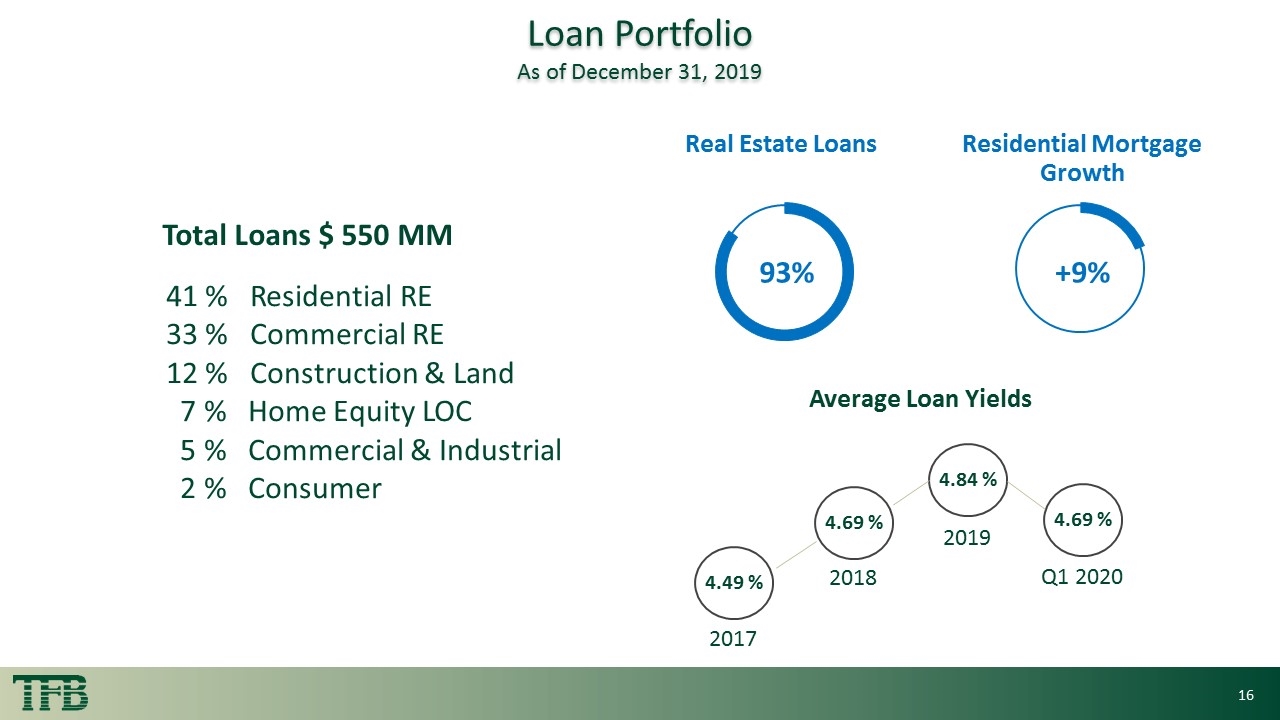
2 + Title Total Loans $ 550 MM Average Loan Yields Loan Portfolio As of December 31, 2019 +9% Residential Mortgage Growth 2017 2018 2019 4.84 % 4.69 % 4.49 % 41 % Residential RE 33 % Commercial RE 12 % Construction & Land 7 % Home Equity LOC 5 % Commercial & Industrial 2 % Consumer Q1 2020 4.69 % 93% Real Estate Loans
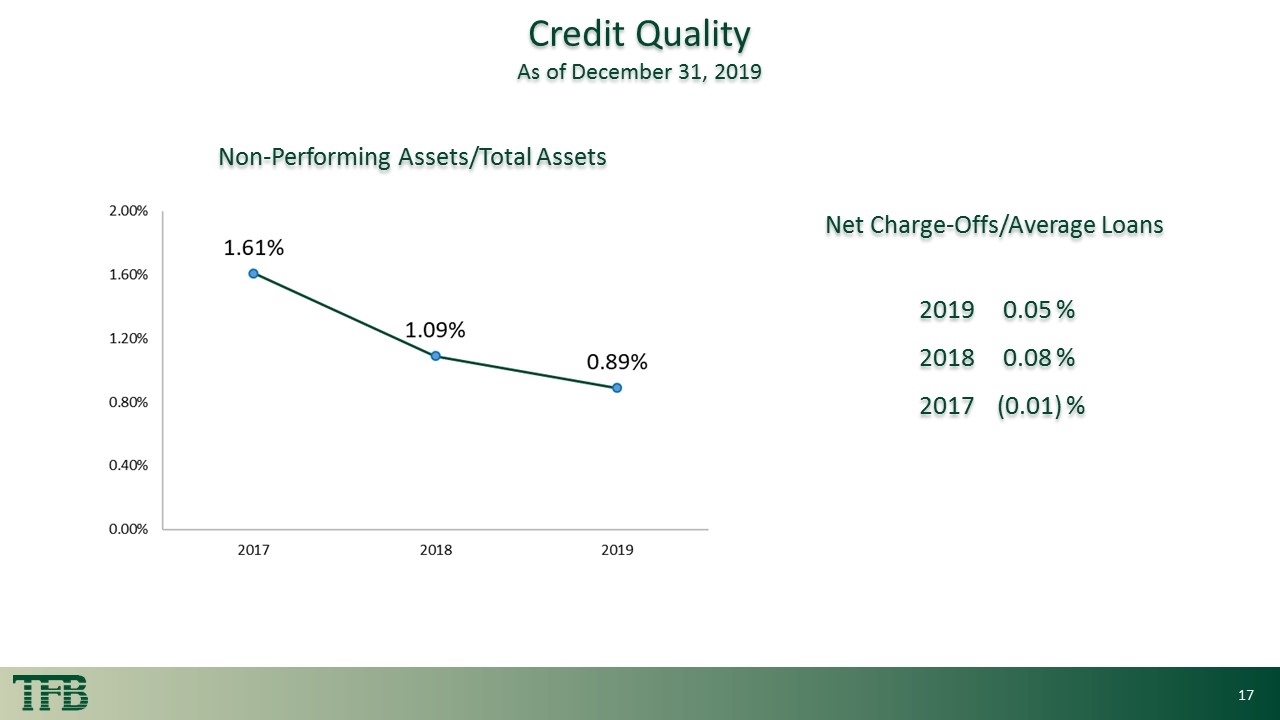
2 + Title Non-Performing Assets/Total Assets Net Charge-Offs/Average Loans 2019 0.05 % 2018 0.08 % 2017 (0.01) % Credit Quality As of December 31, 2019
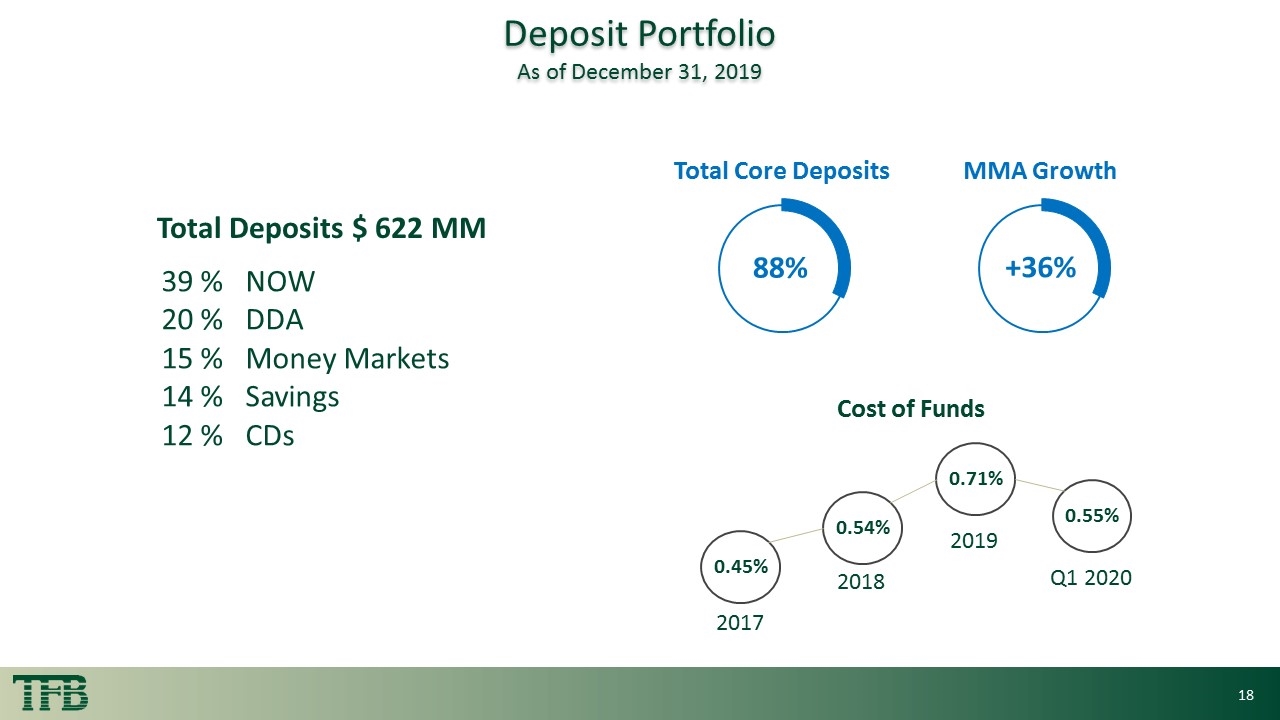
2 + Title 2017 2018 2019 Deposit Portfolio As of December 31, 2019 Total Deposits $ 622 MM +36% MMA Growth 0.71% 0.54% 0.45% Cost of Funds 39 % NOW 20 % DDA 15 % Money Markets 14 % Savings 12 % CDs 88% Q1 2020 0.55% Total Core Deposits
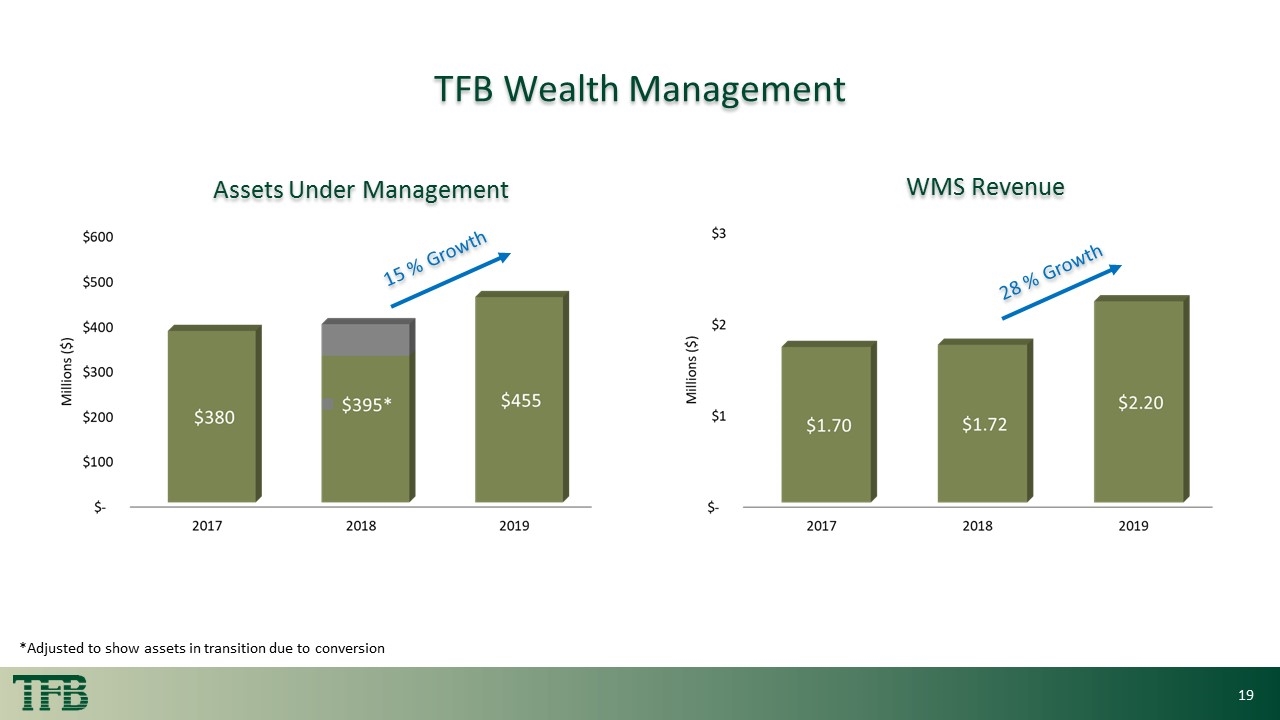
28 % Growth 2 + Title TFB Wealth Management *Adjusted to show assets in transition due to conversion Assets Under Management WMS Revenue 15 % Growth
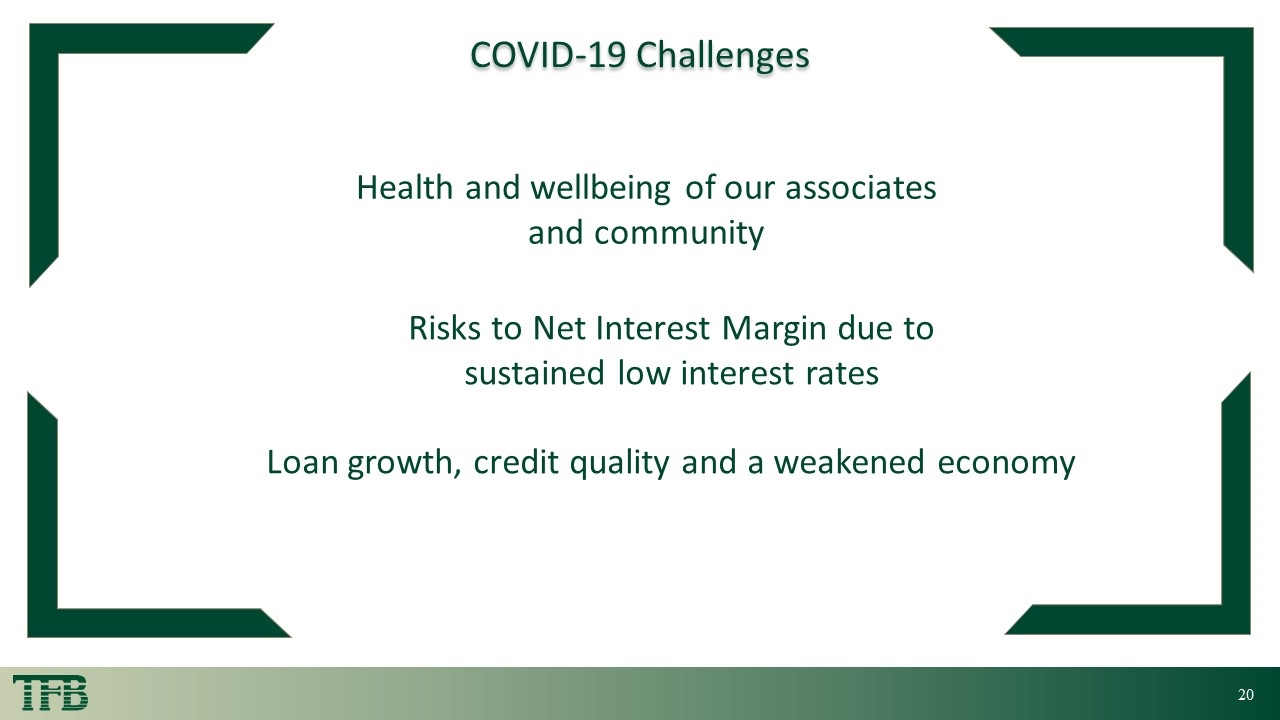
2 + COVID-19 Challenges Health and wellbeing of our associates and community Risks to Net Interest Margin due to sustained low interest rates Loan growth, credit quality and a weakened economy
2 + TFB’s Response Associates Clients Community Shareholders
2 + Our Associates Launched Business Continuity Plan and Pandemic Response Team Enabled remote work, enforced social distancing for on-site employees & closed lobbies Enhanced cleaning protocol for all TFB locations Reallocated resources Cancelled non-essential business travel & events Provided emergency paid sick & family medical leave Provided childcare financial assistance
2 + Our Clients Education on online and mobile financial services Full suite of services available at drive through windows Full service call center Enhanced website and digital communications Loan payment deferrals on 210 loans totaling $110 MM
2 + Community Two rounds of SBA/PPP loan funding $53 MM in SBA Loans to 536 Clients 100% approval of SBA loans requested and certified Promotion of local businesses on social media Cash donations & food drives
2 + Shareholders Focus on TFB Vision & Values Safe and sound operations Enterprise Risk Management Virtual Shareholder Annual Meeting Sustainable core earnings Maintain liquidity, minimize losses & protect capital
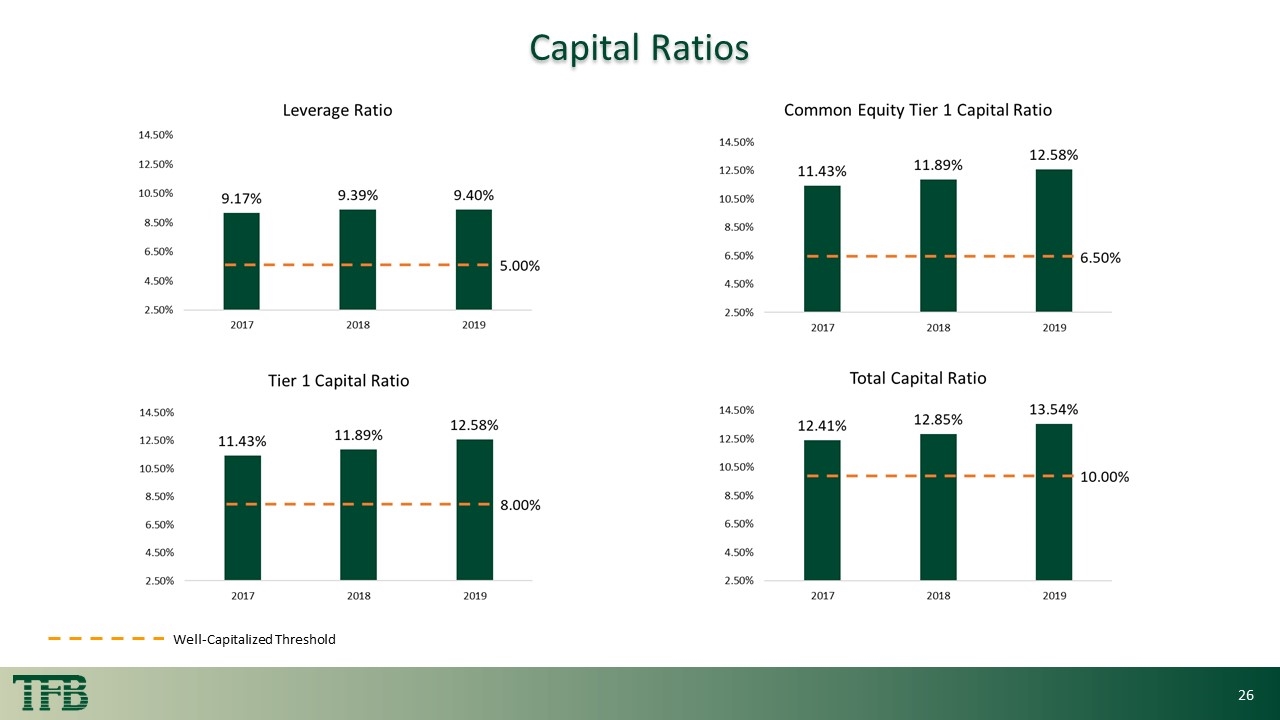
2 + Title Capital Ratios Well-Capitalized Threshold
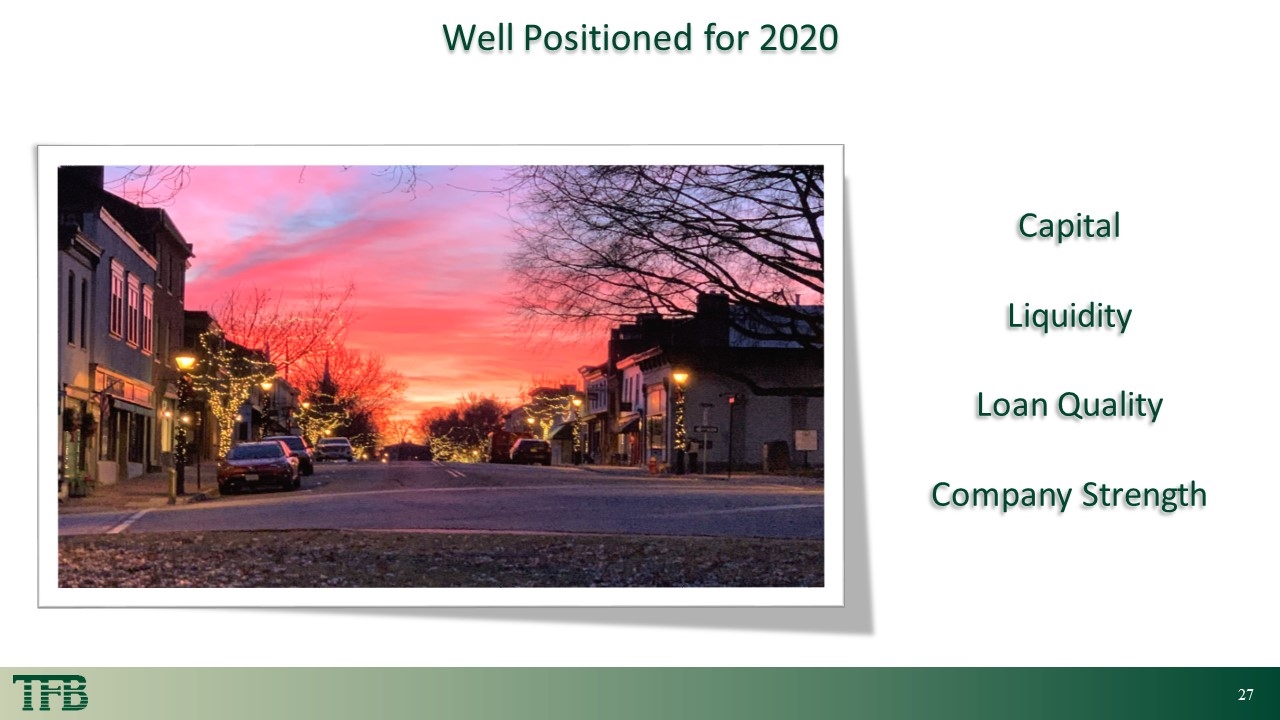
Capital Liquidity Loan Quality Company Strength 2 + Well Positioned for 2020
2 + 2 + Contact information Marc J. Bogan President & Chief Executive Officer marc.bogan@tfb.bank Christine E. Headly Executive Vice President & Chief Financial Officer chris.headly@tfb.bank Tammy P. Frazier, CPA Senior Vice President & Controller tammy.frazier@tfb.bank www.tfb.bank
Title THANK YOU
Title Photo Attributions “Center Street, Old Town Manassas” by Jon Cornwell is licensed under CC BY 2.0
