Attached files
| file | filename |
|---|---|
| 8-K - 8-K - PINNACLE FINANCIAL PARTNERS INC | pnfp-20200518.htm |
First Quarter 2020 Update – May 18, 2020 M. TERRY TURNER, PRESIDENT AND CEO HAROLD R. CARPENTER, EVP AND CFO TIM HUESTIS, EVP AND CHIEF CREDIT OFFICER
Safe Harbor Statements Forward Looking Statements All statements, other than statements of historical fact, included in this presentation, are forward-looking statements within the meaning of the Private Securities Litigation Reform Act of 1995, Section 27A of the Securities Act of 1933 and Section 21E of the Securities Exchange Act of 1934. The words "expect," "anticipate," "intend," "may," "should," "plan," "believe," "seek," "estimate" and similar expressions are intended to identify such forward-looking statements, but other statements not based on historical information may also be considered forward-looking statements. These forward-looking statements are subject to known and unknown risks, uncertainties and other factors that could cause the actual results to differ materially from the statements, including, but not limited to: (i) deterioration in the financial condition of borrowers of Pinnacle Bank and its subsidiaries or BHG resulting in significant increases in credit losses and provisions for those losses and, in the case of BHG, substitutions; (ii) the effects of the emergence of widespread health emergencies or pandemics, including the magnitude and duration of the COVID-19 pandemic and its impact on general economic and financial market conditions and on Pinnacle Financial's and its customers' business, results of operations, asset quality and financial condition; (iii) the ability to grow and retain low-cost core deposits and retain large, uninsured deposits, including during times when Pinnacle Bank is seeking to lower rates it pays on deposits; (iv) the inability of Pinnacle Financial, or entities in which it has significant investments, like BHG, to maintain the historical growth rate of its, or such entities', loan portfolio; (v) changes in loan underwriting, credit review or loss reserve policies associated with economic conditions, examination conclusions, or regulatory developments; (vi) effectiveness of Pinnacle Financial's asset management activities in improving, resolving or liquidating lower-quality assets; (vii) the impact of competition with other financial institutions, including pricing pressures and the resulting impact on Pinnacle Financial’s results, including as a result of compression to net interest margin; (viii) adverse conditions in the national or local economies including in Pinnacle Financial's markets throughout Tennessee, North Carolina, Georgia, South Carolina and Virginia, particularly in commercial and residential real estate markets; (ix) fluctuations or differences in interest rates on loans or deposits from those that Pinnacle Financial is modeling or anticipating, including as a result of Pinnacle Bank's inability to better match deposit rates with the changes in the short-term rate environment, or that affect the yield curve or changes to the interest rate at which commercial banks borrow and lend their excess reserves to each other overnight to include a possible negative interest rate environment; (x) the results of regulatory examinations; (xi) Pinnacle Financial's ability to identify potential candidates for, consummate, and achieve synergies from, potential future acquisitions; (xii) difficulties and delays in integrating acquired businesses or fully realizing costs savings and other benefits from acquisitions; (xiii) BHG's ability to profitably grow its business and successfully execute on its business plans; (xiv) risks of expansion into new geographic or product markets including the recent expansion into the Atlanta, Georgia metro market; (xv) any matter that would cause Pinnacle Financial to conclude that there was impairment of any asset, including goodwill or other intangible assets; (xvi) reduced ability to attract additional financial advisors (or failure of such advisors to cause their clients to switch to Pinnacle Bank), to retain financial advisors (including as a result of the competitive environment for associates) or otherwise to attract customers from other financial institutions; (xvii) deterioration in the valuation of other real estate owned and increased expenses associated therewith; (xviii) inability to comply with regulatory capital requirements, including those resulting from changes to capital calculation methodologies, required capital maintenance levels or regulatory requests or directives, particularly if Pinnacle Bank's level of applicable commercial real estate loans were to exceed percentage levels of total capital in guidelines recommended by its regulators; (xix) approval of the declaration of any dividend by Pinnacle Financial's board of directors; (xx) the vulnerability of Pinnacle Bank's network and online banking portals, and the systems of parties with whom Pinnacle Bank contracts, to unauthorized access, computer viruses, phishing schemes, spam attacks, human error, natural disasters, power loss and other security breaches; (xxi) the possibility of increased compliance and operational costs as a result of increased regulatory oversight (including by the Consumer Financial Protection Bureau), including oversight of companies in which Pinnacle Financial or Pinnacle Bank have significant investments, like BHG, and the development of additional banking products for Pinnacle Bank's corporate and consumer clients; (xxii) the risks associated with Pinnacle Financial and Pinnacle Bank being a minority investor in BHG, including the risk that the owners of a majority of the equity interests in BHG decide to sell the company if not prohibited from doing so by Pinnacle Financial or Pinnacle Bank; (xxiii) changes in state and federal legislation, regulations or policies applicable to banks and other financial service providers, like BHG, including regulatory or legislative developments; (xxiv) the availability of and access to capital; (xxv) adverse results (including costs, fines, reputational harm, inability to obtain necessary approvals and/or other negative effects) from current or future litigation, regulatory examinations or other legal and/or regulatory actions, including as a result of Pinnacle Bank's participation in and execution of government programs related to the COVID-19 pandemic, such as the Paycheck Protection Program; and (xxvi) general competitive, economic, political and market conditions. Additional factors which could affect the forward looking statements can be found in Pinnacle Financial's Annual Report on Form 10-K, Quarterly Reports on Form 10-Q, and Current Reports on Form 8-K filed with the SEC and available on the SEC's website at http://www.sec.gov, which risks may be heightened by the disruption and uncertainty resulting from the COVID-19 pandemic. Pinnacle Financial disclaims any obligation to update or revise any forward-looking statements contained in this presentation, which speak only as of the date hereof, whether as a result of new information, future events or otherwise. 2

Safe Harbor Statements Non-GAAP Financial Matters This presentation contains certain non-GAAP financial measures, including, without limitation, earnings per diluted share, and pre-tax pre-provision income, excluding in certain instances the impact of expenses related to other real estate owned, gains or losses on sale of investment securities, the charges associated with Pinnacle Financial's branch rationalization project, the sale of the remaining portion of Pinnacle Bank's non-prime automobile portfolio, the revaluation of Pinnacle Financial’s deferred tax assets and other matters for the accounting periods presented. This presentation also includes non-GAAP financial measures which exclude expenses associated with Pinnacle Financial’s acquisitions of BNC Bank, Avenue Bank, Magna Bank and CapitalMark Bank & Trust. This presentation may also contain certain other non-GAAP capital ratios and performance measures that exclude the impact of goodwill and core deposit intangibles associated with Pinnacle Financial's acquisitions with these banks and others and other acquisitions which collectively are less material to the non-GAAP measure. The presentation of the non-GAAP financial information is not intended to be considered in isolation or as a substitute for any measure prepared in accordance with GAAP. Because non-GAAP financial measures presented in this presentation are not measurements determined in accordance with GAAP and are susceptible to varying calculations, these non-GAAP financial measures, as presented, may not be comparable to other similarly titled measures presented by other companies. Pinnacle Financial believes that these non-GAAP financial measures facilitate making period-to-period comparisons and are meaningful indications of its operating performance. In addition, because intangible assets such as goodwill and the core deposit intangible, and the other items excluded each vary extensively from company to company, Pinnacle Financial believes that the presentation of this information allows investors to more easily compare Pinnacle Financial's results to the results of other companies. Pinnacle Financial's management utilizes this non-GAAP financial information to compare Pinnacle Financial's operating performance for 2020 versus certain periods in 2019 and to internally prepared projections. 3

1Q20 Financial Information Our key success measures such as asset quality, loan and core deposit growth, deposit betas and fee growth all pointed to an outstanding quarter prior to the impact of COVID-19. 4

1Q20 Summary Results of Key GAAP Measures Total Revenues FD EPS Net Income Total Loans Total Deposits Book Value per Share (millions) (millions) NPA/ Loans & OREO Classified Asset Ratio NCOs 5
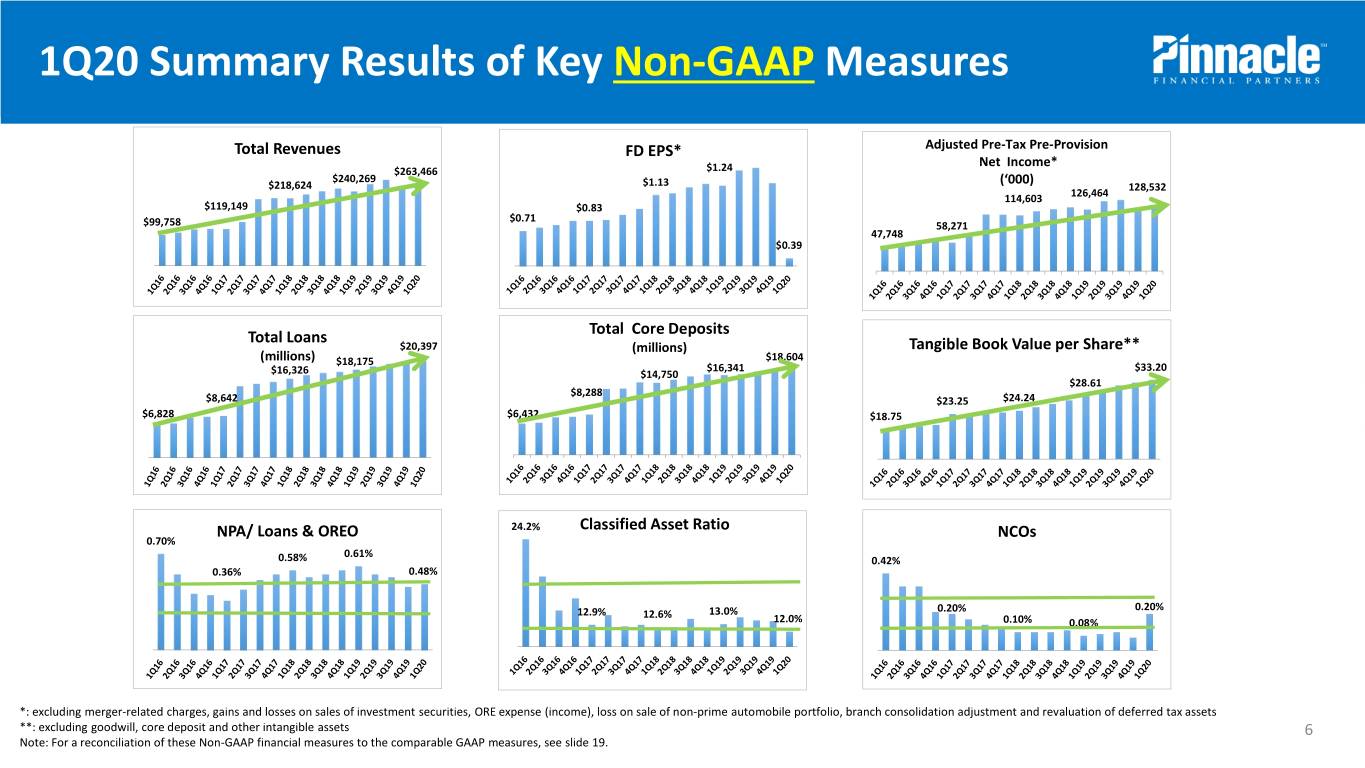
1Q20 Summary Results of Key Non-GAAP Measures Total Revenues FD EPS* Adjusted Pre-Tax Pre-Provision Net Income* $263,466 $1.24 $240,269 (‘000) $218,624 $1.13 128,532 114,603 126,464 $119,149 $0.83 $0.71 $99,758 58,271 47,748 $0.39 Total Loans Total Core Deposits $20,397 (millions) Tangible Book Value per Share** (millions) $18,175 $18,604 $16,341 $33.20 $16,326 $14,750 $28.61 $8,288 $8,642 $23.25 $24.24 $6,828 $6,432 $18.75 NPA/ Loans & OREO 24.2% Classified Asset Ratio NCOs 0.70% 0.61% 0.58% 0.42% 0.36% 0.48% 0.20% 0.20% 12.9% 12.6% 13.0% 12.0% 0.10% 0.08% *: excluding merger-related charges, gains and losses on sales of investment securities, ORE expense (income), loss on sale of non-prime automobile portfolio, branch consolidation adjustment and revaluation of deferred tax assets **: excluding goodwill, core deposit and other intangible assets 6 Note: For a reconciliation of these Non-GAAP financial measures to the comparable GAAP measures, see slide 19.

Pinnacle and COVID-19 PinnacleAssociate responded Protection quickly and decisively to protect associates and clients • Many of the markets in which we operate are in Cumulative Covid- COVID-19 Rate per the first phase of reopening. Generally, across PNFP Markets 19 Cases Population 100,000 our footprint Atlanta 13,752 4,381,201 313.89 Charlotte 2,969 1,594,726 186.18 • State and local governments working together; Raleigh-Durham-Chapel Hill 2,809 1,717,058 163.59 • Priorities: Work from home, masks in public Triad 1,293 745,567 173.43 spaces recommended, schools remain closed, Charleston 800 802,122 99.74 social distancing, gatherings limited to 10 or less, Greenville/Spartanburg 1,692 1,204,784 140.44 high-risk groups encouraged to shelter in place, Chattanooga 319 367,804 86.73 Knoxville 372 601,662 61.83 increased testing; Memphis 3,542 937,166 377.95 • Businesses coming back online: Restaurants, Nashville/Murfreesboro 6,450 1,740,454 370.59 Retail, Hospitality limited to 50% capacity; Roanoke 235 100,033 234.92 • Elective medical and dental procedures permitted; Totals 34,233 14,192,577 241.20 • Inconsistent across footprint: Parks/playgrounds, Other Comparables Churches, Gyms, Salons/Barbershops; and Chicago 34,413 2,706,000 1,271.73 • Still shuttered: Sporting and large venue events. Los Angeles 33,628 3,990,000 842.81 Taverns and bars. Assisted living and skilled New York City 186,293 8,399,000 2,218.04 nursing basically off-limits to visitors. Sources: Departments of Health, Governmental Websites. Case data as of 5/15. 7

Pinnacle and COVID-19 PinnacleAssociate responded Protection quickly and decisively to protect associates and clients • PNFP branch offices were converted to drive-thru only service. Planning currently underway for reopening lobby service. • PPE is being deployed throughout the franchise in preparation of reopening of branch lobbies • Reopening date not currently set. PNFP will monitor and re-open lobbies when PNFP determines it is safe • “Work from home” remains the default position. Associates permitted in offices based on business requirements. • Continue to support a proactive quarantine stance to encourage people to self-quarantine if they believe they have been exposed to virus. • Five associates have been positively diagnosed with COVID-19. None were infected by other employees. All are either back at work or working from home. 8

Pinnacle and COVID-19 PinnacleAssociate enhanced Protection its reputation for valuing long-term relationships in PPP roll-out • Conducted PPP webinars that have been attended and/or subsequently viewed over 16,000 times • Frequent communications to client base throughout process • Significant positive feedback from client base • Roughly 14,000 applications and $2.4B in funding • Fees +$70mm PPP Loan Stratification Table as of 5/14/20 SBA App Approved Average Fee Count* Dollars* Ticket 1% 148 534,898,941 3,614,182 3% 1,284 944,943,281 735,937 5% 12,570 868,327,862 69,079 14,002 2,348,170,083 *Application count and approved dollars have been reduced for PPP loans returned to the SBA as of May 14, 2020 – approximately $98.5mm returned 9

Shift in Asset Mix will Influence 2Q20 Net Interest Margin PPP Program and Liquidity “Insurance” to Drive Significant but Temporary Change in 2Q Earning Asset Mix (1Q20 Actual) FFS & Other 3% • Liquidity build and PPP will add meaningful footings Securities 16% to balance sheet Loans • No real impact to regulatory capital ratios given 81% essentially 0% risk weighted asset adds. Additionally assets will test lower limits of our TER guidance but it will be short-lived. Earning Asset Mix (2Q20 Estimates) • No PPP forgiveness anticipated in 2Q20. Emphasis FFS & Other on loan floors on variable rate loans getting traction ~ 9% Securities throughout footprint. ~14% PPP Loans Non-PPP ~7% Loans ~70% 10

Liquidity Build will be Impactful During the Second Quarter UncertainConsumer market conditions and in early Small March prompted Business liquidity build Programsstrategy Quarterly Avg. FFS and Cash $2,000 3.20% • 2Q20 liquidity build status $1,750 2.80% • No real impact to 2Q20 Net Interest Income $1,500 2.40% $1,250 2.00% • Estimated negative impact to NIM of approximately 0.20% $1,000 1.60% to 0.30% $ millions $ $750 1.20% • Likely to gradually reduce liquidity through remainder of 2020. $500 0.80% $250 0.40% • Wholesale deposit acquisitions in 2Q20 of $1.5B to $2.0B with $0 0.00% weighted maturities of 2 years – approximately 0.60% WAR 4Q17 1Q18 2Q18 3Q18 4Q18 1Q19 2Q19 3Q19 4Q19 1Q20 2Q20 ranges • Core deposit growth continues to be strong in 2Q20 Avg FFS and Cash Yield on FFS and Cash Line Draws – Commercial and $9,600 Consumer Products 54.0% • Draws on lines of credit decreasing thus far in 2Q both in terms $9,400 53.5% $9,200 53.0% of volumes and %’s $9,000 52.5% • Will monitor to determine liquidity impact for 2Q $8,800 52.0% ($ millions) ($ $8,600 51.5% $8,400 51.0% $8,200 50.5% $8,000 50.0% 1Q19 2Q19 3Q19 4Q19 1Q20 Apr. 2020 11

Bankers Healthcare Group Business Model Continues to Provide High Quality Growth to Licensed Professionals BHG Total Loans and Borrowings Total BHG Loan Originations At Year End $1,800,000 $1,200,000 $1,442,000 $1,000,000 $1,500,000 $800,000 $1,200,000 $662,764 $600,000 $872,000 $900,000 Thousands $395,138 Thousands $711,000 $400,000 $314,982 $605,000 $600,000 $193,014 $200,000 $150,370 $88,423 $300,000 $0 Dec. 31, 2017 Dec. 31, 2018 Dec. 31, 2019 Forecast $- 12/31/20 Total Loans on Balance Sheet Total Borrowings 2016 2017 2018 2019 Forecast 2020 BHG Net Earnings Growth $200,000 $150,000 $182,461 $100,000 Thousands $121,194 $50,000 $77,953 $0 2017 2018 2019 Forecast 2020 12

PNFP Will Focus on Defense During This Pandemic TheConsumer length and depth of andthe pandemic Small are unknown, Business but we remain Programs confident in our model 2Q20 Outlook (in relation to Notes Full Year 2020 1Q20) Low to mid-single Outlook excludes impact of PPP program which will increase balances in the Average Loan Growth digit growth near term. Anticipate significant PPP payoff’s before y/e with significant PPP (annualized) fee recognition as well Mid to high-single Will continue to build liquidity in 2Q20 with several scheduled wholesale fund Average Deposit Growth digit growth acquisitions. Anticipate tax payments to offset core growth in both 2Q and (annualized) 3Q GAAP margin compression likely with reduced PAA and liquidity build but NII Net interest income Up should be higher due to larger balance sheet Believe BHG performance will be flat to down. Mortgage revenues likely to Fee income Down be flat to up based on volumes and rate volatility. Wealth management should be stable based on overall market dynamics Full Year Guidance Withheld at this time Expenses should be down from 1Q20. No anticipated meaningful change in Expenses Down expense base contemplated at this time. Have throttled back hiring plans meaningfully for 2020. Net Charge off’s Pending more information regarding pandemic’s depth and subsequent Return on Average Assets Withheld recovery prior to offering any prospective outlook Return on Tangible Common Equity Longer term Anticipate TCE to be within our longer-term operating range over time. Tangible Common Equity operating range of Liquidity build will test the lower end of range at end of 2Q20. 8.75% to 9.75% 13

Moving Forward in this Pandemic All the impacts of the COVID-19 pandemic are unknown as yet. Severity is likely a function of duration. But there can be little doubt that its impacts will be far reaching on our nation in general, and banks in particular. At this juncture, it is critical that we continue our aggressive focus on protecting our associates, clients, communities and shareholders. 14
PNFP Will Focus on Defense During This Pandemic WeConsumer have and seek to andcontinue Small to build liquidity,Business reserves Programs and capital during this crisis First Quarter 2020 Scoreboard • Increased liquidity • Q1 was strongest core deposit growth in recent history; improving liquidity position • Completing liquidity build from uncollateralized deposit sources. Wholesale book allows us to de-lever when need for liquidity subsides. • Prudent sources will be utilized for additional loan fundings (ex. PPP funding offset by use of PPPLF). • Increased allowance for credit losses • In addition to the CECL conversion, we built the ACL meaningfully in Q1 • Further provisioning meaningfully dependent upon depth and length of pandemic impact on the economy • Under CECL, economic forecast modeling has meaningful impact on ACL calculation • Unemployment, GDP and CRE pricing are primary forecast metrics with unemployment as the most impactful influencer • Increased capital • We expect to produce earnings, albeit at a slower pace than anticipated for 2020 • Pre-provision net income should hold up • We have suspended our stock buy back program. • We intend to continue our dividend • Reduce the noninterest expense build by limiting hiring 15

PNFP Will Focus on Defense During This Pandemic WeConsumer have and seek to andcontinue Small to build liquidity,Business reserves Programs and capital during this crisis 2020 Game Plan • Defend the franchise value of the firm • Assess and de-risk the loan portfolio • Loans with payment deferrals – approximately $4.2B at May 14, 2020 • Collect current and prospective borrower information • Determine opportunities to improve PNFP’s position with borrowers • Develop a proactive loan modification plan if required Loan deferral table as of May 14, 2020 Deferred $ Deferred $ %age of Deferred $ %age of Volume at Volume at Loans by Volume at Loans by Mar. 31, 2020 Apr. 15, 2020 NAIC (4/15) May 14, 2020 NAIC (5/14) Hotels $131,261 $634,910 77% $703,012 84% Restaurants $75,574 $138,253 43% $155,507 48% Entertainment $31,687 $121,559 34% $129,187 37% Retail $46,988 $96,361 17% $113,895 21% All others $494,409 $2,291,023 13% $3,181,716 16% Totals $779,919 $3,282,106 16% $4,283,317 22% 16
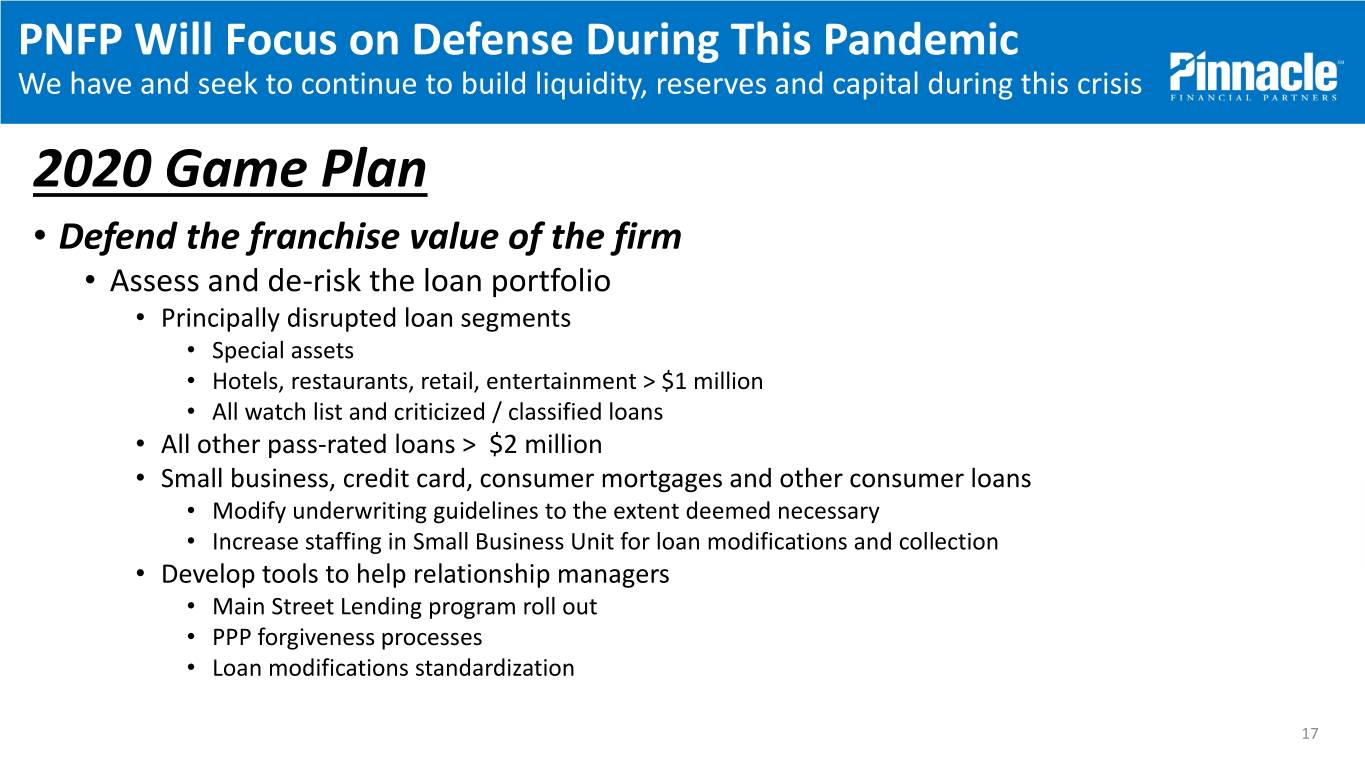
PNFP Will Focus on Defense During This Pandemic WeConsumer have and seek to andcontinue Small to build liquidity,Business reserves Programs and capital during this crisis 2020 Game Plan • Defend the franchise value of the firm • Assess and de-risk the loan portfolio • Principally disrupted loan segments • Special assets • Hotels, restaurants, retail, entertainment > $1 million • All watch list and criticized / classified loans • All other pass-rated loans > $2 million • Small business, credit card, consumer mortgages and other consumer loans • Modify underwriting guidelines to the extent deemed necessary • Increase staffing in Small Business Unit for loan modifications and collection • Develop tools to help relationship managers • Main Street Lending program roll out • PPP forgiveness processes • Loan modifications standardization 17

PNFP Will Focus on Defense During This Pandemic WeConsumer have and seek to andcontinue Small to build liquidity,Business reserves Programs and capital during this crisis 2020 Game Plan • Defend the franchise value of the firm • Build Core Liquidity while Lowering Cost of Funds • Focus on net depositors • Key deposit initiatives • HSAs • Community Associations • IOLTAs • Qualified settlement account • Captive Insurance • Tactically reduce cost of deposits • Lower maturing CD rates • Review and lower higher priced accounts • Cautiously Execute Offensive Game Plan • Continue to invest in Atlanta • Support new FAs as they consolidate their books • Build “share of wallet” from our clients 18

Reconciliation of Non-GAAP Financial Measures 19
