Attached files
| file | filename |
|---|---|
| EX-99.2 - EX-99.2 - Avantor, Inc. | d907406dex992.htm |
| EX-23.1 - EX-23.1 - Avantor, Inc. | d907406dex231.htm |
| 8-K - 8-K - Avantor, Inc. | d907406d8k.htm |
Exhibit 99.1
| VWR CORPORATION |
||||
| 2 | ||||
| Audited Consolidated Financial Statements as of December 31, 2016 and 2015 and for each of the three years in the period ended December 31, 2016 |
| |||
| 3 | ||||
| 4 | ||||
| 5 | ||||
| 6 | ||||
| Consolidated statements of redeemable equity and stockholders’ equity |
7 | |||
| 8 | ||||
| 9 | ||||
1
VWR Corporation
| Description | ||
| Company, we, us, our | VWR Corporation and its consolidated subsidiaries | |
| 2014 Plan | the VWR Corporation 2014 Equity Incentive Plan | |
| Americas | a segment covering North, Central and South America | |
| A/R Facility | an accounts receivable securitization facility due 2018 | |
| AOCI | accumulated other comprehensive income or loss | |
| Annual Report | our Annual Report on Form 10-K filed with the SEC on February 4, 2017 | |
| Avantor | Avantor, Inc., a company with which we are agreed to merge | |
| Biopharma | the combination of the pharmaceutical and biotechnology sectors | |
| Board | the Board of Directors of VWR Corporation | |
| EMEA-APAC | a segment covering Europe, Middle East, Africa and Asia-Pacific | |
| EURIBOR | the applicable interest rate determined by the Banking Federation of the European Union | |
| FASB | the Financial Accounting Standards Board | |
| GAAP | United States generally accepted accounting principles | |
| German, French, and UK Plans | the defined benefit plans in Germany, France and the United Kingdom | |
| IPO | our initial public offering which occurred in 2014 | |
| ITRA | the income tax receivable agreement between us and Varietal | |
| LIBOR | the applicable British Bankers Association London Interbank Offered Rate | |
| LIFO | last-in, first-out inventory method | |
| SEC | the United States Securities and Exchange Commission | |
| SG&A expenses | selling, general and administrative expenses | |
| U.S. Retirement Plan | the defined benefit plan in the United States | |
| Varietal | Varietal Distribution Holdings, LLC, a significant stockholder and affiliate | |
| VWR Funding | VWR Funding, Inc., our wholly-owned subsidiary |
2
Report of Independent Registered Public Accounting Firm
The Board of Directors and Stockholders
VWR Corporation:
We have audited the accompanying consolidated balance sheets of VWR Corporation and subsidiaries as of December 31, 2016 and 2015, and the related consolidated statements of income, comprehensive income or loss, redeemable equity and stockholders’ equity and cash flows for each of the years in the three-year period ended December 31, 2016. These consolidated financial statements are the responsibility of the Company’s management. Our responsibility is to express an opinion on these consolidated financial statements based on our audits.
We conducted our audits in accordance with the standards of the Public Company Accounting Oversight Board (United States). Those standards require that we plan and perform the audit to obtain reasonable assurance about whether the financial statements are free of material misstatement. An audit includes examining, on a test basis, evidence supporting the amounts and disclosures in the financial statements. An audit also includes assessing the accounting principles used and significant estimates made by management, as well as evaluating the overall financial statement presentation. We believe that our audits provide a reasonable basis for our opinion.
In our opinion, the consolidated financial statements referred to above present fairly, in all material respects, the financial position of VWR Corporation and subsidiaries as of December 31, 2016 and 2015, and the results of their operations and their cash flows for each of the years in the three-year period ended December 31, 2016, in conformity with U.S. generally accepted accounting principles.
/s/ KPMG LLP
Philadelphia, Pennsylvania
February 24, 2017
3
VWR Corporation and subsidiaries
Consolidated balance sheets
| December 31, | ||||||||
| (in millions, except per share data) | 2016 | 2015 | ||||||
| Assets |
||||||||
| Current assets: |
||||||||
| Cash and cash equivalents |
$ | 168.7 | $ | 136.3 | ||||
| Trade accounts receivable, net of reserves of $10.5 and $12.0 |
607.2 | 583.2 | ||||||
| Inventories |
483.1 | 424.0 | ||||||
| Other current assets |
93.1 | 89.5 | ||||||
|
|
|
|
|
|||||
| Total current assets |
1,352.1 | 1,233.0 | ||||||
| Property and equipment, net of accumulated depreciation of $248.9 and $216.2 |
253.8 | 228.2 | ||||||
| Goodwill |
1,844.0 | 1,791.4 | ||||||
| Other intangible assets, net |
1,407.8 | 1,455.6 | ||||||
| Other assets |
104.8 | 85.6 | ||||||
|
|
|
|
|
|||||
| Total assets |
$ | 4,962.5 | $ | 4,793.8 | ||||
|
|
|
|
|
|||||
| Liabilities, redeemable equity and stockholders’ equity |
||||||||
| Current liabilities: |
||||||||
| Current portion of debt |
$ | 250.1 | $ | 92.8 | ||||
| Accounts payable |
476.3 | 474.5 | ||||||
| Employee-related liabilities |
79.3 | 61.4 | ||||||
| Current amount due to Varietal — ITRA |
27.7 | 78.1 | ||||||
| Other current liabilities |
152.7 | 112.3 | ||||||
|
|
|
|
|
|||||
| Total current liabilities |
986.1 | 819.1 | ||||||
| Debt, net of current portion |
1,766.9 | 1,896.2 | ||||||
| Amount due to Varietal — ITRA, net of current portion |
57.3 | 85.0 | ||||||
| Deferred income tax liabilities |
477.2 | 459.5 | ||||||
| Other liabilities |
159.4 | 158.8 | ||||||
|
|
|
|
|
|||||
| Total liabilities |
3,446.9 | 3,418.6 | ||||||
| Commitments and contingencies (Note 10) |
||||||||
| Redeemable equity, at redemption value |
21.2 | 38.8 | ||||||
| Stockholders’ equity: |
||||||||
| Preferred stock, $0.01 par value; 50.0 shares authorized, no shares issued or outstanding |
— | — | ||||||
| Common stock, $0.01 par value; 750.0 shares authorized, 131.6 and 131.4 shares issued and outstanding |
1.3 | 1.3 | ||||||
| Additional paid-in capital |
1,766.0 | 1,735.1 | ||||||
| Retained earnings |
154.5 | 6.3 | ||||||
| Accumulated other comprehensive loss |
(427.4 | ) | (406.3 | ) | ||||
|
|
|
|
|
|||||
| Total stockholders’ equity |
1,494.4 | 1,336.4 | ||||||
|
|
|
|
|
|||||
| Total liabilities, redeemable equity and stockholders’ equity |
$ | 4,962.5 | $ | 4,793.8 | ||||
|
|
|
|
|
|||||
See accompanying notes to consolidated financial statements.
4
VWR Corporation and subsidiaries
Consolidated income statements
| Year ended December 31, | ||||||||||||
| (in millions, except per share data) | 2016 | 2015 | 2014 | |||||||||
| Net sales |
$ | 4,514.2 | $ | 4,318.8 | $ | 4,375.3 | ||||||
| Cost of goods sold |
3,252.4 | 3,121.7 | 3,131.9 | |||||||||
|
|
|
|
|
|
|
|||||||
| Gross profit |
1,261.8 | 1,197.1 | 1,243.4 | |||||||||
| Selling, general and administrative expenses |
946.2 | 876.9 | 925.5 | |||||||||
|
|
|
|
|
|
|
|||||||
| Operating income |
315.6 | 320.2 | 317.9 | |||||||||
| Interest expense |
(79.7 | ) | (102.8 | ) | (166.3 | ) | ||||||
| Other income (expense), net |
(1.1 | ) | 45.4 | 90.9 | ||||||||
| Loss on extinguishment of debt |
(0.5 | ) | (32.7 | ) | (5.1 | ) | ||||||
|
|
|
|
|
|
|
|||||||
| Income before income taxes |
234.3 | 230.1 | 237.4 | |||||||||
| Income tax provision |
(86.1 | ) | (75.8 | ) | (84.8 | ) | ||||||
|
|
|
|
|
|
|
|||||||
| Net income |
148.2 | 154.3 | 152.6 | |||||||||
| Accretion of dividends on redeemable equity |
— | — | (29.4 | ) | ||||||||
|
|
|
|
|
|
|
|||||||
| Net income applicable to common stockholders |
$ | 148.2 | $ | 154.3 | $ | 123.2 | ||||||
|
|
|
|
|
|
|
|||||||
| Earnings per share: |
||||||||||||
| Basic |
$ | 1.13 | $ | 1.17 | $ | 2.50 | ||||||
| Diluted |
1.12 | 1.17 | 2.49 | |||||||||
| Weighted average shares outstanding: |
||||||||||||
| Basic |
131.5 | 131.4 | 49.3 | |||||||||
| Diluted |
131.8 | 131.8 | 49.5 | |||||||||
See accompanying notes to consolidated financial statements.
5
VWR Corporation and subsidiaries
Consolidated statements of comprehensive income or loss
| Year ended December 31, | ||||||||||||
| (in millions) | 2016 | 2015 | 2014 | |||||||||
| Net income |
$ | 148.2 | $ | 154.3 | $ | 152.6 | ||||||
| Other comprehensive loss: |
||||||||||||
| Foreign currency translation: |
||||||||||||
| Net unrealized loss arising during the period |
(22.4 | ) | (174.4 | ) | (204.2 | ) | ||||||
| Reclassification of net loss into earnings |
1.2 | — | — | |||||||||
| Derivative instruments: |
||||||||||||
| Net unrealized gain arising during the period |
9.1 | 3.0 | 0.7 | |||||||||
| Reclassification of net (gain) loss into earnings |
(2.3 | ) | (0.7 | ) | 1.1 | |||||||
| Defined benefit plans: |
||||||||||||
| Net unrealized loss arising during the period |
(9.4 | ) | (7.0 | ) | (27.0 | ) | ||||||
| Reclassification of net loss (gain) into earnings |
2.7 | 2.7 | (3.0 | ) | ||||||||
|
|
|
|
|
|
|
|||||||
| Other comprehensive loss |
(21.1 | ) | (176.4 | ) | (232.4 | ) | ||||||
|
|
|
|
|
|
|
|||||||
| Comprehensive income (loss) |
$ | 127.1 | $ | (22.1 | ) | $ | (79.8 | ) | ||||
|
|
|
|
|
|
|
|||||||
See accompanying notes to consolidated financial statements.
6
VWR Corporation and subsidiaries
Consolidated statements of redeemable equity and stockholders’ equity
| Redeemable equity, at redemption value |
Stockholders’ equity | |||||||||||||||||||||||||||
| Common stock | Additional paid-in capital |
Retained earnings (deficit) |
AOCI | Total | ||||||||||||||||||||||||
| (in millions) | Shares | Par value |
||||||||||||||||||||||||||
| Balance at December 31, 2013 |
$ | 670.6 | 0.1 | $ | — | $ | 723.9 | $ | (300.6 | ) | $ | 2.5 | $ | 425.8 | ||||||||||||||
| Redemption |
(11.5 | ) | — | — | 4.1 | — | — | 4.1 | ||||||||||||||||||||
| Accretion of dividends |
29.4 | — | — | (29.4 | ) | — | — | (29.4 | ) | |||||||||||||||||||
| Recapitalization: |
||||||||||||||||||||||||||||
| Retirement of prior stock |
(650.0 | ) | (0.1 | ) | — | (679.4 | ) | — | — | (679.4 | ) | |||||||||||||||||
| Issuance of new stock |
— | 102.0 | 1.0 | 1,328.4 | 1,329.4 | |||||||||||||||||||||||
| Payment of dividend |
— | — | — | (25.0 | ) | — | — | (25.0 | ) | |||||||||||||||||||
| Recognition of ITRA |
— | — | — | (172.9 | ) | — | — | (172.9 | ) | |||||||||||||||||||
| Issuance of common stock |
— | 29.4 | 0.3 | 582.3 | — | — | 582.6 | |||||||||||||||||||||
| Payment of stock issuance costs |
— | — | — | (4.8 | ) | — | — | (4.8 | ) | |||||||||||||||||||
| Stock-based compensation expense |
— | — | — | 2.0 | — | — | 2.0 | |||||||||||||||||||||
| Reclassifications to state redeemable equity at redemption value |
12.9 | — | — | (12.9 | ) | — | — | (12.9 | ) | |||||||||||||||||||
| Net income |
— | — | — | — | 152.6 | — | 152.6 | |||||||||||||||||||||
| Other comprehensive loss |
— | — | — | — | — | (232.4 | ) | (232.4 | ) | |||||||||||||||||||
|
|
|
|
|
|
|
|
|
|
|
|
|
|
|
|||||||||||||||
| Balance at December 31, 2014 |
51.4 | 131.4 | 1.3 | 1,716.3 | (148.0 | ) | (229.9 | ) | 1,339.7 | |||||||||||||||||||
| Issuance of common stock |
— | — | 1.3 | — | — | 1.3 | ||||||||||||||||||||||
| Stock-based compensation expense |
— | — | — | 4.9 | — | — | 4.9 | |||||||||||||||||||||
| Reclassifications to state redeemable equity at redemption value |
(12.6 | ) | — | — | 12.6 | — | — | 12.6 | ||||||||||||||||||||
| Net income |
— | — | — | — | 154.3 | — | 154.3 | |||||||||||||||||||||
| Other comprehensive loss |
— | — | — | — | — | (176.4 | ) | (176.4 | ) | |||||||||||||||||||
|
|
|
|
|
|
|
|
|
|
|
|
|
|
|
|||||||||||||||
| Balance at December 31, 2015 |
38.8 | 131.4 | 1.3 | 1,735.1 | 6.3 | (406.3 | ) | 1,336.4 | ||||||||||||||||||||
| Issuance of common stock |
— | 0.2 | — | 4.7 | — | — | 4.7 | |||||||||||||||||||||
| Stock-based compensation expense |
— | — | — | 8.6 | — | — | 8.6 | |||||||||||||||||||||
| Reclassifications to state redeemable equity at redemption value |
(17.6 | ) | — | — | 17.6 | — | — | 17.6 | ||||||||||||||||||||
| Net income |
— | — | — | — | 148.2 | — | 148.2 | |||||||||||||||||||||
| Other comprehensive loss |
— | — | — | — | — | (21.1 | ) | (21.1 | ) | |||||||||||||||||||
|
|
|
|
|
|
|
|
|
|
|
|
|
|
|
|||||||||||||||
| Balance at December 31, 2016 |
$ | 21.2 | 131.6 | $ | 1.3 | $ | 1,766.0 | $ | 154.5 | $ | (427.4 | ) | $ | 1,494.4 | ||||||||||||||
|
|
|
|
|
|
|
|
|
|
|
|
|
|
|
|||||||||||||||
See accompanying notes to consolidated financial statements.
7
VWR Corporation and subsidiaries
Consolidated statements of cash flows
| Year ended December 31, | ||||||||||||
| (in millions) | 2016 | 2015 | 2014 | |||||||||
| Cash flows from operating activities: |
||||||||||||
| Net income |
$ | 148.2 | $ | 154.3 | $ | 152.6 | ||||||
| Adjustments to reconcile net income to net cash provided by operating activities: |
||||||||||||
| Depreciation and amortization |
130.1 | 124.5 | 129.3 | |||||||||
| Net foreign currency remeasurement loss (gain) |
2.3 | (45.1 | ) | (95.7 | ) | |||||||
| Deferred income tax provision |
3.4 | 27.3 | 33.9 | |||||||||
| Loss on extinguishment of debt |
0.5 | 32.7 | 5.1 | |||||||||
| Other, net |
23.3 | 17.9 | 13.0 | |||||||||
| Changes in working capital, net of business acquisitions: |
||||||||||||
| Trade accounts receivable |
(25.8 | ) | (30.2 | ) | (30.1 | ) | ||||||
| Inventories |
(63.1 | ) | (43.8 | ) | (41.5 | ) | ||||||
| Accounts payable |
15.0 | 25.1 | 27.5 | |||||||||
| Other assets and liabilities |
32.3 | (37.7 | ) | (3.0 | ) | |||||||
|
|
|
|
|
|
|
|||||||
| Net cash provided by operating activities |
266.2 | 225.0 | 191.1 | |||||||||
|
|
|
|
|
|
|
|||||||
| Cash flows from investing activities: |
||||||||||||
| Acquisitions of businesses, net of cash acquired |
(142.8 | ) | (59.1 | ) | (89.9 | ) | ||||||
| Capital expenditures |
(59.9 | ) | (40.9 | ) | (33.6 | ) | ||||||
| Other investing activities |
— | 2.1 | 0.5 | |||||||||
|
|
|
|
|
|
|
|||||||
| Net cash used in investing activities |
(202.7 | ) | (97.9 | ) | (123.0 | ) | ||||||
|
|
|
|
|
|
|
|||||||
| Cash flows from financing activities: |
||||||||||||
| Proceeds from issuance of common stock |
4.7 | 1.3 | 582.6 | |||||||||
| Proceeds from debt |
674.4 | 2,767.0 | 742.2 | |||||||||
| Repayment of debt |
(623.8 | ) | (2,810.2 | ) | (1,353.8 | ) | ||||||
| Redemption of redeemable equity |
— | — | (8.9 | ) | ||||||||
| Payment of dividend |
— | — | (25.0 | ) | ||||||||
| Payment to Varietal under ITRA |
(78.1 | ) | (9.8 | ) | — | |||||||
| Payment of debt issuance costs and redemption premium |
(0.9 | ) | (41.9 | ) | (1.1 | ) | ||||||
| Other financing activities |
(3.1 | ) | (2.5 | ) | (7.8 | ) | ||||||
|
|
|
|
|
|
|
|||||||
| Net cash used in financing activities |
(26.8 | ) | (96.1 | ) | (71.8 | ) | ||||||
|
|
|
|
|
|
|
|||||||
| Effect of exchange rate changes on cash |
(4.3 | ) | (12.7 | ) | (13.9 | ) | ||||||
|
|
|
|
|
|
|
|||||||
| Net increase (decrease) in cash and cash equivalents |
32.4 | 18.3 | (17.6 | ) | ||||||||
| Cash and cash equivalents at beginning of period |
136.3 | 118.0 | 135.6 | |||||||||
|
|
|
|
|
|
|
|||||||
| Cash and cash equivalents at end of period |
$ | 168.7 | $ | 136.3 | $ | 118.0 | ||||||
|
|
|
|
|
|
|
|||||||
| Supplemental disclosures of cash flow information: |
||||||||||||
| Cash paid for interest |
$ | 79.2 | $ | 104.9 | $ | 158.9 | ||||||
| Cash paid for income taxes, net |
78.3 | 48.0 | 39.3 | |||||||||
See accompanying notes to consolidated financial statements.
8
VWR Corporation and subsidiaries
Notes to consolidated financial statements
| 1. | Nature of operations and basis of presentation |
We are a leading global independent provider of product and service solutions to laboratory and production customers. We have significant market positions in Europe and North America. We also have operations in Asia-Pacific and other key emerging markets to support our multinational customers across the globe. We serve a critical role in connecting customer sites with laboratory product suppliers across multiple industries and geographies. We offer a broad portfolio of branded and private label laboratory products, a full range of value-added services and custom manufacturing capabilities to meet our customers’ needs. Services represent a growing but currently small portion of our overall net sales. We offer a wide selection of unique products and have developed an extensive global infrastructure including thousands of sales and service-focused professionals. We deliver value to our customers by improving the costs, efficiency and effectiveness of their research laboratories and production operations. We deliver value to our suppliers by providing them with cost-effective channel access to a global and diverse customer base.
The following describes our corporate organization at December 31, 2016:
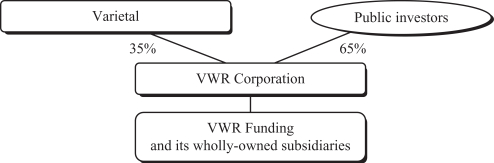
| • | Varietal — Following a 2007 merger, Varietal was our only stockholder until our IPO in October 2014 and since then had been our majority stockholder through March 2016. Private equity funds managed by Madison Dearborn Partners hold a controlling interest in Varietal. Our condensed consolidated balance sheets reflect significant amounts of goodwill and other intangible assets as a result of the 2007 merger. |
In April 2016, Varietal completed a sale of our common stock that caused it to no longer hold a majority ownership interest in us. As a result, we experienced a change in control under U.S. federal tax regulations which has impacted (i) the amount and timing of the utilization of our net operating loss carryforwards; (ii) the timing of payments under an ITRA with Varietal (see Note 20); and (iii) the amount of cash taxes we are paying.
| • | VWR Funding and its wholly-owned subsidiaries — VWR Funding is our wholly-owned subsidiary and the sole issuer of our debt. Certain of those debt agreements restrict its ability to make distributions to us. |
Basis of presentation
We report financial results on the basis of two segments organized by geographic region: the Americas and EMEA-APAC.
In 2014, we recapitalized our equity (see Note 12). For all periods presented, the number of shares of common stock outstanding has been adjusted for a stock split. Separately, a conversion of prior equity into newly-issued
9
shares of common stock is presented as a retirement and issuance of shares; share counts for periods prior to that conversion were not adjusted. The consolidated financial statements present the accretion of dividends on redeemable convertible preferred stock for periods prior to the recapitalization. Those dividends were never paid and became available to common stockholders following the recapitalization.
Principles of consolidation
The accompanying consolidated financial statements include the accounts of VWR Corporation and the redeemable equity of Varietal, each after the elimination of intercompany balances and transactions.
Use of estimates
The preparation of financial statements in conformity with GAAP requires management to make estimates and assumptions that affect the reported amounts of assets and liabilities and the disclosure of contingent assets and liabilities at the date of the financial statements and the reported amounts of revenue, expense, income and loss during the reporting period. Actual results could differ significantly from those estimates.
Additional disclosures about significant estimates are provided in the following areas: (i) impairment testing, particularly determining whether indicators of impairment were present and whether assets were impaired (see Note 21); (ii) estimating the valuation allowance on deferred tax assets, such as net operating loss carryforwards (see Note 18); (iii) accounting for defined benefit plans, in particular determining key assumptions such as discount rates and the expected return on plan assets (see Note 15); (iv) estimating outcomes of loss contingencies (see Note 10); and (v) estimating fair value, particularly related to measurements based on unobservable inputs (see Note 9).
| 2. | Summary of significant accounting policies |
Cash and cash equivalents
Cash and cash equivalents are comprised of highly liquid investments with original maturities of three months or less, primarily consisting of euro-denominated overnight deposits. Bank overdrafts are classified as current liabilities and presented as a financing activity on our consolidated statements of cash flows.
Trade accounts receivable, net of reserves
Trade accounts receivable are recorded at the invoiced amount and generally do not bear interest. The carrying amount of trade accounts receivable is presented net of a reserve representing our estimate of the amounts that will not be collected and for estimated sales returns and allowances. In addition to reviewing delinquent accounts receivable, we consider many factors in estimating our reserve, including historical data, experience, customer types, creditworthiness and economic trends. From time to time, we may adjust our assumptions for anticipated changes in any of these or other factors expected to affect collectability. Account balances are written off against the allowance when we determine it is probable that the receivable will not be recovered.
Inventories
Our inventories consist primarily of products held for sale. Inventories are valued at the lower of cost or market, cost being primarily determined by the LIFO method for certain of our U.S. subsidiaries and the first-in, first-out method for all other subsidiaries. We regularly review quantities of inventories on hand and compare these amounts to the expected use of each product or product line. We record a charge to cost of goods sold for the amount required to reduce the carrying value of inventory to net realizable value.
At December 31, 2016 and 2015, the percentage of inventories valued using the LIFO method was 36% for both years, and the excess of current cost over LIFO value for those inventories was $24.8 million and $24.6 million, respectively.
10
Property and equipment
Property and equipment are recorded at cost. Depreciation is recognized using the straight-line method over estimated useful lives of 10 to 40 years for buildings and improvements and 3 to 10 years for equipment and computer software. Leasehold improvements are amortized on a straight-line basis over the shorter of the estimated useful lives of the assets or the estimated remaining life of the lease. Costs for repairs and maintenance that do not significantly increase the value or estimated lives of property and equipment are expensed as incurred. Property and equipment held under capital leases were not material for any periods presented.
Impairment of long-lived assets
We evaluate the recoverability of long-lived assets when events or changes in circumstances indicate a possible inability to recover carrying amounts. We assess recoverability by comparing the carrying value of the asset to estimated undiscounted future cash flows expected to be generated by the asset. If an asset is impaired, the loss is measured as the amount by which the asset’s carrying value exceeds its fair value.
Goodwill and other intangible assets
Goodwill represents the excess of purchase price over the fair value of net assets acquired in a business combination. Other intangible assets consist of both amortizable and indefinite-lived intangible assets. Amortizable intangible assets are amortized over their estimated useful lives on a straight-line basis. Indefinite-lived intangible assets are not amortized.
We reevaluate the estimated useful lives of our amortizable intangible assets annually. For indefinite-lived intangible assets, we reevaluate annually whether they continue to have indefinite lives, considering whether they have any legal, regulatory, contractual, competitive or economic limitations and whether they are expected to contribute to the generation of cash flows indefinitely.
Goodwill and other indefinite-lived intangible assets are tested annually for impairment on October 1 of each year. Goodwill impairment testing is performed at the reporting unit level. Our reporting units are the same as our operating segments and reportable segments. All of our intangible assets, including goodwill, are tested for impairment whenever an indication of potential impairment arises. Events or circumstances that might require an interim evaluation include unexpected adverse business conditions, economic factors, unanticipated technological changes or competitive activities, loss of key personnel and acts or anticipated acts by governments and courts. Indefinite-lived intangible assets are tested for impairment prior to testing of goodwill or amortizable intangible assets.
The impairment analysis for goodwill and indefinite-lived intangible assets consists of an optional qualitative assessment potentially followed by a two-step quantitative analysis. If we determine that the carrying value of goodwill or indefinite-lived intangible assets exceeds its fair value, an impairment charge is recorded for the excess. Impairment charges cannot be reversed in subsequent periods.
The impairment analysis for amortizable intangible assets is performed in the same way as for our other long-lived assets, as previously discussed.
Fair value measurements
Fair value is defined as the price that would be received to sell an asset or paid to transfer a liability in an orderly transaction between market participants at a measurement date. Classification within the fair value hierarchy is based on the lowest of the following levels that is significant to the fair value measurement:
| • | Level 1 — Quoted prices (unadjusted) in active markets for identical assets or liabilities |
11
| • | Level 2 — Inputs that are observable for the asset or liability, either directly or indirectly through market corroboration, for substantially the full term of the asset or liability |
| • | Level 3 — Inputs that are unobservable for the asset or liability based on our evaluation of the assumptions market participants would use in pricing the asset or liability |
We exercise considerable judgment when estimating fair value, particularly when evaluating what assumptions market participants would likely make. The use of different assumptions or estimation methodologies could have a material effect on the estimated fair values.
Commitments and contingencies
Loss contingencies are reflected in the consolidated financial statements based on our assessments of the expected outcome of legal proceedings or the expected resolution of other contingencies. Liabilities for estimated losses are accrued if the potential loss from any claim or legal proceeding is considered probable and the amount can be reasonably estimated. Significant judgment is required to determine probability and whether the amount of an exposure is reasonably estimable. Due to uncertainties related to these matters, accruals are based only on the information available at the time. As additional information becomes available, we reassess potential liabilities related to pending claims and litigation and may revise our previous estimates.
Revenue recognition
We record product revenue on a gross basis when persuasive evidence of an arrangement exists, the price is fixed or determinable, title and risk of loss have been transferred to the customer and collectability of the resulting receivable is reasonably assured. Title and risk of loss is transferred at the time of shipment or upon delivery to customers, depending upon the terms of the arrangement with the customer. Products are delivered without post-sale obligations to the customer. Provisions for discounts, rebates to customers, sales returns and other adjustments are provided for as a reduction of sales in the period the related sales are recorded.
We record shipping and handling charges billed to customers in net sales and record shipping and handling costs in cost of goods sold for all periods presented. Sales taxes, value-added taxes and certain excise taxes collected from customers and remitted to governmental authorities are accounted for on a net basis and therefore are excluded from net sales.
Services represent a growing but currently small portion of our net sales and were not material to our consolidated financial statements.
Classification of expenses
Cost of goods sold includes the cost of the product, vendor rebates, inbound and outbound freight charges, as well as inventory adjustments. SG&A expenses include personnel and facility charges, advertising and promotional charges and other charges related to our global infrastructure operations.
Stock-Based compensation
Stock-based compensation consists primarily of stock options awarded to employees and directors. We measure expense using the grant-date fair value of awards ultimately expected to vest. Awards with service conditions are expensed on a straight-line basis from the date of grant through the end of the requisite service period. We issue new shares of common stock upon the exercise of stock options.
The grant-date fair value of stock options is measured using a closed-form option pricing model, using assumptions based on the terms of each stock option agreement, the expected behavior of grant recipients and
12
peer company data. We have limited historical data about our own awards upon which to base our assumptions. Expected volatility is calculated based on the observed equity volatility for a peer group over a period of time equal to the expected life of the stock options. The risk-free interest rate is based on U.S. Treasury observed market rates continuously compounded over the duration of the expected life. The expected life of stock options is determined using the simplified method, which is calculated as the midpoint of the weighted average vesting period and the contractual term.
We elect to recognize expense based on the number of awards ultimately expected to vest by use of an estimated forfeiture rate. The estimated forfeiture rate is based on historical data for the employee group awarded options and expected employee turnover rates, which management reevaluates each period.
Defined benefit plans
Some of our employees participate in defined benefit plans. The benefits include pension, salary continuance, life insurance and healthcare. Benefits are accrued over the employees’ service periods. We use actuarial methods and assumptions in the valuation of defined benefit obligations and the determination of net periodic pension income or expense. Differences between actual and expected results or changes in the value of defined benefit obligations and plan assets, if any, are not recognized in earnings as they occur but rather systematically over subsequent periods.
Foreign currency translation
Assets and liabilities of our foreign subsidiaries, where the functional currency is the local currency, are translated into U.S. dollars using period-end exchange rates. Revenues, expenses, income and losses are translated using average exchange rates. Resulting translation adjustments are reported in accumulated other comprehensive income or loss. Foreign currency remeasurement gains and losses related to financing activities are reported in other income (expense), net within our consolidated statements of operations, while gains and losses associated with operating activities are reported within the applicable component of operating income.
Income taxes
Income taxes are accounted for under the asset and liability method. Deferred tax assets and liabilities are recognized for the expected net tax effects of temporary differences between the carrying amounts of assets and liabilities for financial reporting and income tax purposes and for net operating loss and credit carryforwards. Deferred tax assets and liabilities are measured using the enacted tax rates expected to apply to taxable income in the years in which those temporary differences are expected to be recovered or settled. The effect on deferred tax assets and liabilities of a change in tax rates is recognized in income in the period that includes the enactment date. We record a valuation allowance to reduce deferred tax assets to the amount that is more likely than not to be realized.
We recognize the effect of income tax positions only if those positions are more likely than not to be sustained. Recognized income tax positions are measured at the largest amount that is more likely than not of being realized. Changes in recognition or measurement are reflected in the period in which a change in judgment occurs, as a result of information that arises or when a tax position is effectively settled. We recognize accrued interest and penalties related to unrecognized tax benefits as a component of income tax expense in our consolidated financial statements.
Due to Varietal — ITRA
We record the estimated amount payable to Varietal under an ITRA, entered into in connection with our IPO, as a noncurrent liability, except for the portion estimated to be payable within one year. The ITRA liability was initially recognized through an adjustment to additional paid-in capital and measured at its expected future value,
13
similar to the underlying deferred tax assets to which it relates. Subsequent changes to the value of the ITRA liability, if any, will be classified as other income (expense), net in the consolidated statements of operations. Cash payments under the ITRA are classified as a financing activity on the consolidated statements of cash flows.
| 3. | New accounting standards |
In March 2016, the FASB issued new guidance to simplify several aspects of accounting and presentation for stock-based compensation. The new guidance is effective for us beginning in the first quarter of 2017, with early adoption permitted. We early adopted the guidance beginning October 1, 2016. The guidance did not have a material impact to us upon adoption.
In February 2016, the FASB issued comprehensive new guidance about leases. Under the new guidance, most leases will be recognized on our consolidated balance sheet as liabilities with corresponding right-of-use assets. The new guidance carries forward a similar method of expense recognition for lessees. The new guidance is effective for us beginning in the first quarter of 2019, with early adoption permitted. The guidance must be adopted using a modified retrospective approach. Although, we are continuing to evaluate its impact, we expect that this new guidance will result in a significant increase to the assets and liabilities we present on our consolidated balance sheet.
In May 2014, the FASB issued comprehensive new revenue recognition guidance. The guidance provides a new model for revenue recognition that supersedes most current guidance and requires more disclosures about revenue including the components of revenue that are communicated to investors. The new guidance is effective for us beginning in the first quarter of 2018 and may be adopted using either a full retrospective or a modified retrospective approach. Although we are continuing to evaluate the impact of the new guidance, we expect that the new recognition model will primarily impact only certain portions of our business, and we expect to provide expanded disclosures and to adopt the new standard using the modified retrospective method.
There were no other new accounting standards that we expect to have a material impact to our financial position or results of operations upon adoption.
| 4. | Earnings per share |
The following table presents information about basic and diluted earnings per share:
| Year ended December 31, | ||||||||||||
| (in millions) | 2016 | 2015 | 2014 | |||||||||
| Reconciliation of weighted average shares outstanding: |
||||||||||||
| Basic |
131.5 | 131.4 | 49.3 | |||||||||
| Dilutive effect of stock-based instruments |
0.3 | 0.4 | 0.2 | |||||||||
|
|
|
|
|
|
|
|||||||
| Diluted |
131.8 | 131.8 | 49.5 | |||||||||
|
|
|
|
|
|
|
|||||||
| Number of anti-dilutive instruments excluded from dilutive effect |
4.0 | 2.0 | 0.9 | |||||||||
| 5. | Acquisitions |
During the three years ended December 31, 2016, we acquired businesses to broaden our product offerings and strengthen our market positions. Except for their effects on investing cash flow, none of these acquisitions, nor their related costs, were material individually or in the aggregate to our results of operations or financial condition.
14
The following table presents selected information about these acquisitions in the aggregate:
| Year ended December 31, | ||||||||||||
| (dollars in millions) | 2016 | 2015 | 2014 | |||||||||
| Number of businesses acquired |
5 | 4 | 4 | |||||||||
| Components of purchase price: |
||||||||||||
| Cash paid, net of cash acquired |
$ | 142.8 | $ | 59.1 | $ | 89.9 | ||||||
| Estimated fair value of contingent consideration |
13.8 | 13.6 | 8.4 | |||||||||
| Deferred purchase price, net of (settlements) |
3.2 | (3.4 | ) | 3.4 | ||||||||
| Other |
— | — | 13.0 | |||||||||
|
|
|
|
|
|
|
|||||||
| Purchase price |
$ | 159.8 | $ | 69.3 | $ | 114.7 | ||||||
|
|
|
|
|
|
|
|||||||
| Allocation of purchase price: |
||||||||||||
| Net tangible assets |
$ | 31.9 | $ | 9.5 | $ | 15.5 | ||||||
| Identifiable intangible assets |
50.1 | 23.2 | 44.1 | |||||||||
| Goodwill |
77.8 | 36.6 | 55.1 | |||||||||
|
|
|
|
|
|
|
|||||||
| Purchase price |
$ | 159.8 | $ | 69.3 | $ | 114.7 | ||||||
|
|
|
|
|
|
|
|||||||
| Weighted average life of acquired amortizable intangible assets |
9.9 years | 9.7 years | 12.2 years | |||||||||
The purchase price for the acquisitions was higher than the fair value of the acquired identifiable assets, resulting in goodwill, due to the existence of intangible assets not recognizable under GAAP and other market factors. During the years ended December 31, 2016, 2015 and 2014, we recorded goodwill of $65.1 million, $19.6 million and $29.0 million, respectively, that we expect to be deductible for tax purposes. The purchase price allocations for certain acquisitions completed in 2016 are preliminary pending finalization of opening balance sheets and may be adjusted subsequently.
The other component of purchase price represents cash paid to acquire a business that was subsequently rescinded. Since the amount was later refunded in full, we did not include it in the amount paid for acquisitions or the number of businesses acquired.
| 6. | Property and equipment, net |
The following table presents the components of property and equipment, net:
| December 31, | ||||||||
| (in millions) | 2016 | 2015 | ||||||
| Buildings and improvements |
$ | 199.1 | $ | 161.4 | ||||
| Equipment and computer software |
264.5 | 244.2 | ||||||
| Other |
39.1 | 38.8 | ||||||
|
|
|
|
|
|||||
| Property and equipment, gross |
502.7 | 444.4 | ||||||
| Accumulated depreciation |
(248.9 | ) | (216.2 | ) | ||||
|
|
|
|
|
|||||
| Property and equipment, net |
$ | 253.8 | $ | 228.2 | ||||
|
|
|
|
|
|||||
Depreciation expense was $44.7 million, $41.1 million and $40.4 million for the years ended December 31, 2016, 2015 and 2014, respectively.
15
| 7. | Goodwill and other intangible assets, net |
The following tables present information about goodwill by segment:
| (in millions) | Americas | EMEA-APAC | Total | |||||||||
| Balance at December 31, 2014 |
$ | 1,042.3 | $ | 811.3 | $ | 1,853.6 | ||||||
| Acquisitions (Note 5) |
19.7 | 16.9 | 36.6 | |||||||||
| Currency translation |
(15.7 | ) | (82.9 | ) | (98.6 | ) | ||||||
| Other |
— | (0.2 | ) | (0.2 | ) | |||||||
|
|
|
|
|
|
|
|||||||
| Balance at December 31, 2015 |
1,046.3 | 745.1 | 1,791.4 | |||||||||
| Acquisitions (Note 5) |
65.1 | 12.7 | 77.8 | |||||||||
| Currency translation |
2.7 | (26.0 | ) | (23.3 | ) | |||||||
| Other |
— | (1.9 | ) | (1.9 | ) | |||||||
|
|
|
|
|
|
|
|||||||
| Balance at December 31, 2016 |
$ | 1,114.1 | $ | 729.9 | $ | 1,844.0 | ||||||
|
|
|
|
|
|
|
|||||||
| December 31, 2016 | December 31, 2015 | |||||||||||||||||||||||
| (in millions) | Gross carrying amount |
Accumulated impairment losses |
Net carrying amount |
Gross carrying amount |
Accumulated impairment losses |
Net carrying amount |
||||||||||||||||||
| Americas |
$ | 1,320.7 | $ | 206.6 | $ | 1,114.1 | $ | 1,252.9 | $ | 206.6 | $ | 1,046.3 | ||||||||||||
| EMEA-APAC |
729.9 | — | 729.9 | 745.1 | — | 745.1 | ||||||||||||||||||
|
|
|
|
|
|
|
|
|
|
|
|
|
|||||||||||||
| Total |
$ | 2,050.6 | $ | 206.6 | $ | 1,844.0 | $ | 1,998.0 | $ | 206.6 | $ | 1,791.4 | ||||||||||||
|
|
|
|
|
|
|
|
|
|
|
|
|
|||||||||||||
The following table presents the components of other intangible assets:
| December 31, 2016 | December 31, 2015 | |||||||||||||||||||||||
| (in millions) | Gross carrying amount |
Accumulated amortization |
Net carrying amount |
Gross carrying amount |
Accumulated amortization |
Net carrying amount |
||||||||||||||||||
| Customer relationships |
$ | 1,413.0 | $ | 651.3 | $ | 761.7 | $ | 1,402.2 | $ | 581.4 | $ | 820.8 | ||||||||||||
| Other |
49.7 | 20.1 | 29.6 | 30.3 | 15.2 | 15.1 | ||||||||||||||||||
|
|
|
|
|
|
|
|
|
|
|
|
|
|||||||||||||
| Amortizable intangible assets |
1,462.7 | 671.4 | 791.3 | 1,432.5 | 596.6 | 835.9 | ||||||||||||||||||
| Indefinite-lived trademarks and tradenames |
616.5 | — | 616.5 | 619.7 | — | 619.7 | ||||||||||||||||||
|
|
|
|
|
|
|
|
|
|
|
|
|
|||||||||||||
| Other intangible assets |
$ | 2,079.2 | $ | 671.4 | $ | 1,407.8 | $ | 2,052.2 | $ | 596.6 | $ | 1,455.6 | ||||||||||||
|
|
|
|
|
|
|
|
|
|
|
|
|
|||||||||||||
Amortization expense was $85.4 million, $83.4 million and $88.9 million for the years ended December 31, 2016, 2015 and 2014, respectively.
The following table presents estimated future amortization expense at December 31, 2016:
| (in millions) | ||||
| 2017 |
$ | 85.3 | ||
| 2018 |
83.2 | |||
| 2019 |
81.6 | |||
| 2020 |
80.3 | |||
| 2021 |
76.3 | |||
| Thereafter |
384.6 | |||
|
|
|
|||
| Total |
$ | 791.3 | ||
|
|
|
|||
16
| 8. | Debt |
The following table presents information about debt:
| December 31, 2016 |
December 31, 2015 |
|||||||||||||
| (dollars in millions) | Interest terms |
Rate | Amount | |||||||||||
| Accounts receivable securitization facility |
LIBOR plus 1.15% | 1.89 | % | $ | 163.9 | $ | 38.0 | |||||||
| Senior credit facility: |
||||||||||||||
| Multi-currency revolving loan facility |
EURIBOR plus 2.00% | 2.00 | % | 31.6 | — | |||||||||
| Term A loan, net of discount of $4.8 and $6.1 |
LIBOR plus 2.00% | 2.61 | % | 859.7 | 903.9 | |||||||||
| Term B loan, net of discount of $4.4 and $4.7 |
EURIBOR plus 3.00% | 3.00 | % | 423.8 | 494.8 | |||||||||
| 4.625% senior notes, net of discount of $7.0 and $8.4 |
Fixed rate | 4.63 | % | 524.9 | 538.6 | |||||||||
| Other debt |
|
13.1 | 13.7 | |||||||||||
|
|
|
|
|
|||||||||||
| Total debt |
|
$ | 2,017.0 | $ | 1,989.0 | |||||||||
|
|
|
|
|
|||||||||||
| Classification on consolidated balance sheets: |
| |||||||||||||
| Current portion of debt |
|
$ | 250.1 | $ | 92.8 | |||||||||
| Debt, net of current portion |
|
1,766.9 | 1,896.2 | |||||||||||
|
|
|
|
|
|||||||||||
| Total debt |
|
$ | 2,017.0 | $ | 1,989.0 | |||||||||
|
|
|
|
|
|||||||||||
Other debt includes capital lease obligations and subsidiary loans from local banks. Borrowings under the accounts receivable securitization facility and the multi-currency revolving loan facility are included in the current portion of debt because we frequently borrow from and repay them to satisfy short term cash requirements; we are not required to repay those borrowings until maturity of the instruments.
In 2016, we entered into two interest rate swaps that exchange LIBOR for fixed rates on a portion of our term A loan. See Note 9.
The following table presents availability under credit facilities at December 31, 2016:
| (in millions) | Accounts receivable securitization facility |
Multi- currency revolving loan facility |
Total | |||||||||
| Maximum availability |
$ | 175.0 | $ | 250.0 | $ | 425.0 | ||||||
| Current availability |
$ | 175.0 | $ | 250.0 | $ | 425.0 | ||||||
| Undrawn letters of credit outstanding |
(11.0 | ) | (1.7 | ) | (12.7 | ) | ||||||
| Outstanding borrowings |
(163.9 | ) | (31.6 | ) | (195.5 | ) | ||||||
|
|
|
|
|
|
|
|||||||
| Unused availability |
$ | 0.1 | $ | 216.7 | $ | 216.8 | ||||||
|
|
|
|
|
|
|
|||||||
Current availability under the accounts receivable securitization facility depends upon maintaining a sufficient borrowing base of eligible trade accounts receivable. At December 31, 2016, $243.2 million of trade accounts receivable were pledged as collateral under the facility.
17
The following table presents the maturities of debt principal at December 31, 2016:
| (in millions) | 2017 | 2018 | 2019 | 2020 | 2021 | Thereafter | Total | |||||||||||||||||||||
| Accounts receivable securitization facility |
$ | — | $ | 163.9 | $ | — | $ | — | $ | — | $ | — | $ | 163.9 | ||||||||||||||
| Senior credit facility: |
||||||||||||||||||||||||||||
| Multi-currency revolving loan facility |
— | — | — | 31.6 | — | — | 31.6 | |||||||||||||||||||||
| Term A loan |
45.5 | 68.3 | 91.0 | 659.7 | — | — | 864.5 | |||||||||||||||||||||
| Term B loan |
4.3 | 4.3 | 4.3 | 4.3 | 4.3 | 406.7 | 428.2 | |||||||||||||||||||||
| 4.625% senior notes |
— | — | — | — | — | 531.9 | 531.9 | |||||||||||||||||||||
| Other debt |
4.7 | 4.3 | 2.6 | 1.5 | — | — | 13.1 | |||||||||||||||||||||
|
|
|
|
|
|
|
|
|
|
|
|
|
|
|
|||||||||||||||
| Total debt, excluding discounts |
$ | 54.5 | $ | 240.8 | $ | 97.9 | $ | 697.1 | $ | 4.3 | $ | 938.6 | $ | 2,033.2 | ||||||||||||||
|
|
|
|
|
|
|
|
|
|
|
|
|
|
|
|||||||||||||||
Accounts receivable securitization facility
The accounts receivable securitization facility is for $175.0 million with a commercial bank and matures on May 18, 2018. Borrowings are secured by the trade accounts receivable of certain domestic subsidiaries, which are not available to satisfy the claims of other creditors. We bear the risk of collection on our trade accounts receivable and account for the facility as a secured borrowing.
The accounts receivable securitization facility includes representations and covenants that we consider usual and customary, including that, if our available liquidity falls below a specified amount, the ratio of our adjusted earnings to interest expense cannot exceed a specified amount, each as defined. At December 31, 2016, we were in compliance with those covenants.
Senior credit facility
The senior credit facility is with a syndicate of lenders and includes a $250.0 million multi-currency revolving loan facility due September 28, 2020, a $910.0 million term A loan due September 28, 2020 and a €406.6 million term B loan due January 15, 2022. The term loans require us to make scheduled quarterly principal repayments as shown in the table above. Borrowings under the senior credit facility are secured by substantially all of our assets except for the trade accounts receivable that secure the accounts receivable securitization facility and bear interest at variable rates plus a margin that declines if certain net leverage ratios are achieved. Fees payable under the senior credit facility are not material to interest expense. The senior credit facility includes representations and covenants that we consider usual and customary, including that our first lien net leverage ratio, as defined, cannot exceed a specified amount. At December 31, 2016, we were in compliance with those covenants.
We entered into the senior credit facility in 2015, issuing the term B loan at an original discount of €1.2 million and paying debt issuance costs of $15.4 million, most of which were deferred and are being recognized as interest expense through the maturity date. We used a portion of the proceeds from the senior credit facility and proceeds from the issuance of 4.625% senior notes to repay our prior credit facility and incurred a loss on extinguishment of debt of $7.9 million during 2015.
In 2016, we amended our term B loan for more favorable interest terms. The amendment required us to repay €50.0 million of principal and pay financing costs of $0.9 million, most of which were deferred and are being recognized as interest expense through the maturity date. We also incurred a loss on extinguishment of debt of $0.5 million representing the portion of unamortized deferred costs and original discount related to the principal repaid. In 2014, we amended our prior credit facility to extend maturity dates and obtain more favorable interest terms and paid debt issuance costs of $1.1 million.
Senior notes
We have issued €503.8 million of 4.625% senior notes that mature on April 15, 2022. Interest is payable in arrears on April 15 and October 15 of each year. The notes are redeemable at premiums that begin at 102.3125%
18
plus the present value of interest through April 15, 2018, then decline through April 15, 2020 at which time the notes become redeemable at face value. The notes are also redeemable in part using proceeds from certain equity offerings and in full upon certain changes in control. The indentures covering the notes include representations and covenants that we consider usual and customary. At December 31, 2016, we were in compliance with those covenants.
In 2015, we issued the notes at an original issue discount of €3.8 million and paid debt issuance costs of $5.4 million, which were deferred and are being recognized as interest expense through the maturity date. We also used a portion of the proceeds from the senior credit facility to redeem all of our 7.25% senior notes for a premium of $20.4 million and incurred a loss on extinguishment of debt of $24.8 million. In 2014, we used net proceeds from the IPO to redeem 10.75% subordinated notes at face value and incurred a loss on extinguishment of debt of $5.1 million.
| 9. | Financial instruments and fair value measurements |
Our financial instruments include cash and cash equivalents, trade accounts receivable, accounts payable, debt and an amount due to Varietal under the ITRA. Except for the amount due to Varietal, these financial instruments are held or issued by a number of institutions, which reduces the risk of material non-performance.
Assets and liabilities for which fair value is only disclosed
The carrying amount of cash and cash equivalents is the same as its fair value and is a Level 1 measurement. The carrying amounts for trade accounts receivable and accounts payable approximate fair value due to their short-term nature and are Level 2 measurements.
The following table presents the carrying amounts and fair values of debt instruments:
| December 31, 2016 | December 31, 2015 | |||||||||||||||
| (in millions) | Carrying amount |
Fair value | Carrying amount |
Fair value | ||||||||||||
| Accounts receivable securitization facility |
$ | 163.9 | $ | 163.9 | $ | 38.0 | $ | 38.0 | ||||||||
| Senior credit facility: |
||||||||||||||||
| Multi-currency revolving loan facility |
31.6 | 31.6 | — | — | ||||||||||||
| Term A loan |
859.7 | 856.4 | 903.9 | 901.5 | ||||||||||||
| Term B loan |
423.8 | 431.9 | 494.8 | 500.5 | ||||||||||||
| 4.625% senior notes |
524.9 | 553.9 | 538.6 | 536.5 | ||||||||||||
| Other debt |
13.1 | 13.1 | 13.7 | 13.7 | ||||||||||||
The fair values of debt instruments are based on standard pricing models that take into account the present value of future cash flows, which are Level 2 measurements.
At December 31, 2016 and 2015, the amount due to Varietal under the ITRA (see Note 20) had carrying amounts of $85.0 million and $163.1 million, respectively, and fair values of $82.9 million and $147.6 million, respectively. The fair values were estimated using a combination of observable and unobservable inputs following an income-based approach, a Level 3 measurement.
Recurring fair value measurements with significant unobservable inputs
Certain of the business acquisitions we completed entitle the sellers to contingent consideration if earnings targets are met during a period of time following the acquisition.
19
The following table presents changes to contingent consideration liabilities:
| Year ended December 31, | ||||||||
| (in millions) | 2016 | 2015 | ||||||
| Beginning balance |
$ | 21.0 | $ | 11.6 | ||||
| Acquisitions (Note 5) |
13.8 | 13.6 | ||||||
| Loss (income) from changes to estimated fair value |
4.9 | (1.1 | ) | |||||
| Cash payments |
(4.2 | ) | (2.4 | ) | ||||
| Currency translation |
(0.8 | ) | (0.7 | ) | ||||
|
|
|
|
|
|||||
| Ending balance |
$ | 34.7 | $ | 21.0 | ||||
|
|
|
|
|
|||||
We estimate the fair value of contingent consideration using the average of probability-weighted potential earn-out payments specified in the purchase agreements, a Level 3 measurement, ranging in the aggregate from approximately $19 million to $38 million for all open earn-outs at December 31, 2016. The significant assumptions used in these calculations include forecasted results and the estimated likelihood for each performance scenario.
Derivative instruments and hedging activities
We engage in hedging activities to reduce our exposure to changes in variable interest rates and foreign currency exchange rates. Our hedging activities are designed to manage specific risks according to our strategies, as summarized below, which may change from time to time. Our hedging activities consist of the following:
| • | Cash flow hedging — We hedge the variable base interest rate of a portion of our term A loan using interest rate swaps; |
| • | Net investment hedging — We hedge a portion of our net investment in euro-denominated foreign operations using our 4.625% senior notes and a portion of our term B loan; |
| • | Economic hedge — We experience opposite foreign currency exchange rate effects related to a euro-denominated intercompany loan and the unhedged portion of our term B loan. The currency effects for these non-derivative instruments are recorded through earnings in the period of change and substantially offset one another; and |
| • | Other hedging activities — Some of our subsidiaries hedge short-term foreign-denominated business transactions and intercompany financing transactions using foreign currency forward contracts. No additional disclosures are provided for these activities because they were not material to our consolidated financial statements. |
Cash flow and net investment hedging
We have entered into two interest rate swaps designated as cash flow hedges of the variable LIBOR rate on $500.0 million of our term A loan. Those swaps exchange the variable LIBOR rate for an approximately 1% fixed rate and mature on September 28, 2020. These hedges have been and are expected to continue to be fully effective. As a result, changes to the fair value of the interest rate swaps, which otherwise would be recognized in earnings, are deferred to AOCI.
We have designated €356.0 million of our term B loan and all €503.8 million of our 4.625% senior notes as hedges to protect a portion of our net investment in foreign operations from the impact of changes in the euro to U.S. dollar exchange rate. As a result of these hedge designations, the foreign currency changes on the debt instruments, which otherwise would be recognized in earnings, are deferred to AOCI and equally offset the foreign currency changes on the hedged portion of our net investment. These hedges have no other impact to our financial position, financial performance or cash flows.
20
The following table presents the balance sheet classification and fair values of these instruments, all of which are Level 2 measurements:
| December 31, | ||||||||||
| (in millions) | Balance sheet classification |
2016 | 2015 | |||||||
| Cash flow hedging: |
||||||||||
| Interest rate swaps |
Other assets | $ | 11.2 | $ | — | |||||
| Net investment hedging: |
||||||||||
| Portion of term B loan |
Debt, net of current portion | 379.2 | 402.6 | |||||||
| 4.625% senior notes |
Debt, net of current portion | 553.9 | 536.5 | |||||||
The following table presents the net unrealized gain (loss) deferred to AOCI for these instruments:
| Year ended December 31, | ||||||||
| (in millions) | 2016 | 2015 | ||||||
| Cash flow hedging: |
||||||||
| Interest rate swaps |
$ | 9.8 | $ | — | ||||
| Net investment hedging: |
||||||||
| Portion of net investment in foreign operations |
(28.6 | ) | (3.7 | ) | ||||
| Portion of term B loan |
13.5 | 12.4 | ||||||
| 4.625% senior notes |
15.1 | (8.7 | ) | |||||
All of these hedges were fully effective for the periods presented. The following table presents the net loss reclassified from AOCI into earnings for these instruments:
| (in millions) |
Income statement classification |
Year ended December 31, | ||||||||
| 2016 | 2015 | |||||||||
| Interest rate swaps |
Interest expense | $ | (1.4 | ) | $ | — | ||||
| 10. | Commitments and contingencies |
Our business involves risk of product liability, patent infringement and other claims in the ordinary course of business arising from the products that we source from various manufacturers or produce ourselves, as well as from the services we provide. Our exposure to such claims may increase as we seek to increase the geographic scope of our sourcing activities and sales of private label products and to the extent that we expand our manufacturing operations or service offerings. We maintain insurance policies, including product liability insurance, and in many cases the manufacturers of the products we distribute have indemnified us against such claims. We cannot assure you that our insurance coverage or indemnification agreements with manufacturers will be available in all pending or any future cases brought against us. Furthermore, our ability to recover under any insurance or indemnification arrangements is subject to the financial viability of our insurers, our manufacturers and our manufacturers’ insurers, as well as legal enforcement under the local laws governing the arrangements. In particular, as we seek to expand our sourcing from manufacturers in the Asia-Pacific region and other developing locations, we expect that we will increase our exposure to potential defaults under the related indemnification arrangements. Insurance coverage in general or coverage for certain types of liabilities, such as product liability or patent infringement in these developing markets may not be readily available for purchase or cost-effective for us to purchase. Furthermore, insurance for liability relating to asbestos, lead and silica exposure is not available, and we do not maintain insurance for product recalls. Accordingly, we could be subject to uninsured and unindemnified future liabilities, and an unfavorable result in a case for which adequate insurance or indemnification is not available could result in a material adverse effect on our business, financial condition and results of operations.
We are also involved in various disputes, litigation and regulatory matters incidental to our business, including employment matters, commercial disputes, government contract compliance matters, disputes regarding
21
environmental clean-up costs, and other matters arising out of the normal conduct of our business. We intend to vigorously defend ourselves in such matters. From time to time, we are named as a defendant in cases as a result of our distribution of laboratory supplies, including litigation resulting from the alleged prior distribution of products containing asbestos by certain of our predecessors or acquired companies. While the impact of these disputes or litigation has historically been immaterial, and we believe the range of reasonably possible loss from current matters continues to be immaterial, there can be no assurance that the impact of the pending and any future claims will not be material to our business, financial condition or results of operations in the future.
Employment agreements
The employment agreements with our executive officers include provisions for the payment of severance and continuing health benefits following termination without cause or resignation for good reason, as those terms are defined in the employment agreements. The aggregate of potential payments for all executive officers under these provisions was $11.1 million at December 31, 2016.
Registration rights agreement
We are party to a registration rights agreement with Varietal that could require us to pay securities registration costs in future periods. Under the registration rights agreement, Varietal is entitled to request that we register (i) any shares of our common stock that it held at October 7, 2014 and (ii) any shares held by Madison Dearborn Partners. Should we register such common stock, we would be required to pay costs related to the registration as well as Varietal’s expenses in connection with its exercise of these rights.
During the years ended December 31, 2016 and 2015, we incurred expenses pursuant to the registration rights agreement. See Note 20.
| 11. | Redeemable equity |
Redeemable equity consists of redeemable equity units of our parent and, prior to July 31, 2014, redeemable convertible preferred stock.
Redeemable equity units of parent
In 2007, Varietal established a plan whereby certain employees were able to purchase a “strip” of preferred and common units. The following describes the accounting for these units:
| • | Issuances — Prior to the recapitalization, Varietal issued these units in exchange for cash. Subsequently, Varietal contributed an equal amount of capital to us in exchange for shares of redeemable convertible preferred stock. None of these units have been issued following the recapitalization. |
| • | Repurchases — Upon termination of the employee unitholders, two redemption options may be triggered, one of which is outside of our control. Prior to the recapitalization, Varietal redeemed the units by providing an equally-valued number of shares of our redeemable convertible preferred stock to the unitholder, which we subsequently redeemed for cash. Following the recapitalization, Varietal redeems units directly with cash. |
| • | Valuation — These units are presented on our consolidated balance sheets at their redemption value. The redemption value is contractually defined, with preferred units valued as the sum of unreturned capital plus a cumulative dividend and common units valued at the enterprise value of Varietal less the redemption value of preferred units. Changes to the redemption value are reclassified to or from additional paid-in capital. |
22
Certain employees also received a special type of common unit that vested based upon continuing service, subject to accelerated vesting upon the occurrence of certain events. Because these units were provided as an incentive to provide services to us, we accounted for them as stock-based compensation. See Note 13.
Redeemable convertible preferred stock
In 2014, in anticipation of our IPO, we completed an internal recapitalization (see Note 12) pursuant to which all shares of our redeemable convertible preferred stock were exchanged for newly-issued shares of common stock. Prior to the recapitalization, the preferred stock was redeemable by Varietal for the sum of unreturned capital plus a cumulative dividend.
| 12. | Stockholders’ equity |
Stockholders’ equity consists of common stock. We are also authorized to issue preferred stock.
Our debt agreements impose restrictions on VWR Funding’s ability to make payments to VWR Corporation, including for the purpose of paying dividends on capital stock. See Note 24.
Recapitalization
In anticipation of our IPO, we completed an internal recapitalization in 2014 pursuant to which all then outstanding equity was exchanged for 102.0 million shares of newly-issued common stock. We also amended and restated our certificate of incorporation and bylaws which resulted in the capitalization shown on our consolidated balance sheet and included a 102-for-1 stock split.
Initial public offering
In 2014, we completed our IPO, which included an additional sale to our underwriters, by issuing 29.4 million common shares at a price of $21.00 per share. After deducting underwriting discounts, the IPO resulted in net proceeds of $582.6 million.
In connection with the IPO, we also: i) paid a $25.0 million dividend to Varietal; ii) terminated a management services agreement with Madison Dearborn Partners and Avista Capital Partners and entered into an ITRA with Varietal (see Note 20); iii) awarded stock options to certain employees and directors under a new stock-based compensation plan (see Note 13); and iv) used the net proceeds from the IPO to repay debt.
| 13. | Stock-based compensation |
The following table presents the components of stock-based compensation expense, a component of SG&A expenses:
| Year ended December 31, | ||||||||||||
| (in millions) | 2016 | 2015 | 2014 | |||||||||
| 2014 Plan |
$ | 8.3 | $ | 4.4 | $ | 1.1 | ||||||
| Other immaterial plans |
0.3 | 0.5 | 0.9 | |||||||||
|
|
|
|
|
|
|
|||||||
| Total |
$ | 8.6 | $ | 4.9 | $ | 2.0 | ||||||
|
|
|
|
|
|
|
|||||||
At December 31, 2016, remaining stock-based compensation expense of $25.9 million related to unvested awards will be recognized over a weighted average period of 3.0 years.
23
2014 Plan
The 2014 Plan authorized up to 11.5 million shares of common stock to be issued in the form of stock options, stock appreciation rights, restricted stock or other stock-based awards. At December 31, 2016, 5.6 million shares were available for future issuance. No award shall be granted pursuant to the 2014 Plan on or after September 9, 2024.
The following table presents information about stock options under the 2014 Plan:
| Year ended December 31, 2016 | ||||||||||||||||
| (in millions, except per option amounts and years) | Number of stock options |
Weighted average exercise price per option |
Aggregate intrinsic value |
Weighted average remaining term |
||||||||||||
| Outstanding at beginning of period |
3.2 | $ | 21.03 | |||||||||||||
| Granted |
2.8 | 24.68 | ||||||||||||||
| Exercised |
(0.1 | ) | 21.00 | |||||||||||||
| Forfeited |
(0.1 | ) | 21.39 | |||||||||||||
|
|
|
|||||||||||||||
| Outstanding at end of period |
5.8 | 22.80 | $ | 13.3 | 5.4 years | |||||||||||
|
|
|
|||||||||||||||
| Expected to vest |
4.5 | 23.26 | 8.3 | 5.6 years | ||||||||||||
| Exercisable |
1.2 | 21.02 | 4.8 | 4.8 years | ||||||||||||
Granted
In 2016, we granted stock options to management that vest 25% on the first anniversary of the date of grant and 6.25% quarterly thereafter through the fourth anniversary of the date of grant and have a seven-year term.
In 2014, we granted stock options to management that vest 40% on the second anniversary of the date of grant and 5.00% quarterly thereafter through the fifth anniversary of the date of grant and have a seven-year term.
The following table presents information about their fair value:
| Year ended December 31, | ||||||||
| 2016 | 2014 | |||||||
| Weighted average grant date fair value |
$ | 6.69 | $ | 6.67 | ||||
| Expected stock price volatility |
30 | % | 33 | % | ||||
| Risk free interest rate |
1.16 | % | 1.76 | % | ||||
| Expected dividend rate |
nil | nil | ||||||
| Expected life of options |
4.6 years | 4.9 years | ||||||
Vested and exercised
Beginning in 2016, options vested and were exercised. The total fair value of options vested during the year was $8.2 million. Options exercised had intrinsic value of $0.6 million, caused us to realize a tax benefit of $0.2 million and resulted in cash contributions of $2.0 million.
| 14. | Restructuring |
In the fourth quarter of 2016, we initiated a restructuring program designed to achieve additional efficiencies in our operating model and reduce operating expenses. The program involves selectively realigning personnel, closures of several smaller operations accompanied by consolidation of their operating activities in other business units, and closure or divestiture of certain non-strategic businesses units. The program is expected to be completed by early 2018 when operating activity relocations are scheduled to be completed.
24
The following table presents information about restructuring charges under the 2016 program, which are included in SG&A expenses:
| (in millions) | Year ended December 31, 2016 |
December 31, 2016 | ||||||||||||||
| Cumulative charges incurred |
Expected remaining charges |
Total expected charges |
||||||||||||||
| Employee severance |
$ | 12.9 | $ | 12.9 | $ | 5.4 | $ | 18.3 | ||||||||
| Facility closure |
0.4 | 0.4 | 3.9 | 4.3 | ||||||||||||
| Other |
7.0 | 7.0 | 5.4 | 12.4 | ||||||||||||
|
|
|
|
|
|
|
|
|
|||||||||
| Total |
$ | 20.3 | $ | 20.3 | $ | 14.7 | $ | 35.0 | ||||||||
|
|
|
|
|
|
|
|
|
|||||||||
| Americas |
$ | 1.8 | $ | 1.8 | $ | 1.7 | $ | 3.5 | ||||||||
| EMEA-APAC |
18.5 | 18.5 | 13.0 | 31.5 | ||||||||||||
|
|
|
|
|
|
|
|
|
|||||||||
| Total |
$ | 20.3 | $ | 20.3 | $ | 14.7 | $ | 35.0 | ||||||||
|
|
|
|
|
|
|
|
|
|||||||||
Other charges are to write-down the carrying value of net assets of businesses that we plan to close or sell under the program.
The following table presents changes to accrued restructuring charges:
| (in millions) | Employee severance |
Facility closure |
Total | |||||||||
| Balance at December 31, 2015 |
$ | — | $ | — | $ | — | ||||||
| Restructuring charges |
12.9 | 0.4 | 13.3 | |||||||||
| Cash payments |
(2.2 | ) | — | (2.2 | ) | |||||||
|
|
|
|
|
|
|
|||||||
| Balance at December 31, 2016 |
$ | 10.7 | $ | 0.4 | $ | 11.1 | ||||||
|
|
|
|
|
|
|
|||||||
| 15. | Benefit plans |
We sponsor a number of defined benefit plans for our employees worldwide. We present these plans as follows due to their differing geographies, characteristics and actuarial assumptions:
| • | The U.S. Retirement Plan is a funded and tax-qualified defined benefit retirement plan providing two types of benefits based on: (i) service for substantially all full-time U.S. employees who completed a year of service by May 31, 2005, with benefits frozen on that date; and (ii) beginning in 2016, an annual contribution we make for substantially all full-time U.S. employees that grows at a defined rate. We generally fund the minimum amount required by applicable laws and regulations. We use a December 31 measurement date for the U.S. Retirement Plan. |
| • | The German, French and UK Plans are presented in the aggregate. Our German subsidiaries have unfunded defined benefit pension plans for certain employees and retirees that are closed to new participants. Our French subsidiary has a funded defined benefit pension plan for a certain group of employees that is closed to new participants. Our UK subsidiary has funded defined benefit plans that are closed to new participants and frozen with respect to future accrual of benefits. We use a December 31 measurement date for the German, French and UK Plans. |
| • | We sponsor certain other defined benefit plans that are not material individually or in the aggregate. |
We also sponsor a defined contribution plan for our employees in the United States, Canada and Puerto Rico that features an employer match. Prior to 2016, we also provided an annual contribution to those plans based on company performance that was replaced by a similar benefit under the U.S. Retirement Plan beginning in 2016. The aggregate expense for our defined contribution plans was $9.9 million, $10.6 million and $10.7 million for the years ended December 31, 2016, 2015 and 2014, respectively.
25
The following table presents information about our defined benefit plans:
| U.S. Retirement Plan Year ended December 31, |
German, French and UK Plans Year ended December 31, |
|||||||||||||||
| (in millions) | 2016 | 2015 | 2016 | 2015 | ||||||||||||
| Change in projected benefit obligation: |
||||||||||||||||
| Beginning balance |
$ | 180.1 | $ | 189.1 | $ | 164.0 | $ | 180.3 | ||||||||
| Service cost |
3.9 | 0.7 | 1.4 | 1.7 | ||||||||||||
| Interest cost |
6.8 | 7.7 | 4.4 | 5.1 | ||||||||||||
| Actuarial loss (gain) |
4.3 | (9.7 | ) | 34.8 | (6.4 | ) | ||||||||||
| Benefits paid |
(7.7 | ) | (7.7 | ) | (5.1 | ) | (3.2 | ) | ||||||||
| Currency translation |
— | — | (20.2 | ) | (13.5 | ) | ||||||||||
| Other |
— | — | 0.7 | — | ||||||||||||
|
|
|
|
|
|
|
|
|
|||||||||
| Ending balance |
187.4 | 180.1 | 180.0 | 164.0 | ||||||||||||
|
|
|
|
|
|
|
|
|
|||||||||
| Change in fair value of plan assets: |
||||||||||||||||
| Beginning balance |
222.8 | 241.2 | 84.7 | 83.0 | ||||||||||||
| Actual gain (loss) on plan assets |
23.1 | (10.7 | ) | 21.7 | 2.3 | |||||||||||
| Company contributions |
— | — | 10.1 | 7.3 | ||||||||||||
| Benefits paid |
(7.7 | ) | (7.7 | ) | (5.1 | ) | (3.2 | ) | ||||||||
| Currency translation |
— | — | (16.2 | ) | (4.7 | ) | ||||||||||
|
|
|
|
|
|
|
|
|
|||||||||
| Ending balance |
238.2 | 222.8 | 95.2 | 84.7 | ||||||||||||
|
|
|
|
|
|
|
|
|
|||||||||
| Funded status at end of year |
$ | 50.8 | $ | 42.7 | $ | (84.8 | ) | $ | (79.3 | ) | ||||||
|
|
|
|
|
|
|
|
|
|||||||||
| Accumulated benefit obligation at end of year |
$ | 187.4 | $ | 180.1 | $ | 172.2 | $ | 156.5 | ||||||||
| Amounts recognized in consolidated balance sheets at end of year: |
||||||||||||||||
| Other assets |
50.8 | 42.7 | 0.6 | 0.8 | ||||||||||||
| Other liabilities |
— | — | 85.4 | 80.1 | ||||||||||||
| Accumulated other comprehensive income (loss) |
13.6 | 7.9 | (66.1 | ) | (53.1 | ) | ||||||||||
At December 31, 2016, the amounts in AOCI that have not been recognized as net periodic pension income or cost relate to actuarial gains or losses, none of which will be recognized for the U.S. Retirement Plan and $3.8 million of which will be recognized for the German, French and UK Plans in 2017.
The following table presents the components of net periodic pension (income) cost:
| U.S. Retirement Plan Year ended December 31, |
German, French and UK Plans Year ended December 31, |
|||||||||||||||||||||||
| (in millions) | 2016 | 2015 | 2014 | 2016 | 2015 | 2014 | ||||||||||||||||||
| Service cost |
$ | 3.9 | $ | 0.7 | $ | 0.7 | $ | 1.4 | $ | 1.7 | $ | 1.5 | ||||||||||||
| Interest cost |
6.8 | 7.7 | 8.4 | 4.4 | 5.1 | 6.6 | ||||||||||||||||||
| Expected return on plan assets |
(13.1 | ) | (14.2 | ) | (14.4 | ) | (4.6 | ) | (4.8 | ) | (5.7 | ) | ||||||||||||
| Recognized net actuarial (gain) loss |
— | — | (0.4 | ) | 3.3 | 3.7 | 2.1 | |||||||||||||||||
| Gain on partial plan settlement |
— | — | (6.9 | ) | — | — | — | |||||||||||||||||
| Other |
— | — | — | 0.7 | — | — | ||||||||||||||||||
|
|
|
|
|
|
|
|
|
|
|
|
|
|||||||||||||
| Total |
$ | (2.4 | ) | $ | (5.8 | ) | $ | (12.6 | ) | $ | 5.2 | $ | 5.7 | $ | 4.5 | |||||||||
|
|
|
|
|
|
|
|
|
|
|
|
|
|||||||||||||
For the years ended December 31, 2016, 2015 and 2014, the net unrealized gain (loss) recorded in other comprehensive income or loss was: (i) for the U.S. Retirement Plan, $5.8 million, $(15.3) million and $(5.0) million, respectively; and (ii) for the German, French and UK Plans, $(16.4) million, $3.9 million and $(26.3) million, respectively. The amounts reclassified from AOCI into earnings are shown in the table above as recognized net actuarial gain or loss.
26
The following table presents the assumptions used to determine the projected benefit obligation and net periodic pension income:
| U.S. Retirement Plan Year ended December 31, |
German, French and UK Plans Year ended December 31, |
|||||||||||||||||||||||
| 2016 | 2015 | 2014 | 2016 | 2015 | 2014 | |||||||||||||||||||
| Projected benefit obligation at end of year: |
||||||||||||||||||||||||
| Discount rate |
4.23 | % | 4.58 | % | 4.13 | % | 2.36 | % | 3.22 | % | 2.99 | % | ||||||||||||
| Annual rate of compensation increase |
3.00 | % | * | * | 3.00 | % | 3.00 | % | 3.00 | % | ||||||||||||||
| Net periodic pension cost or income: |
||||||||||||||||||||||||
| Discount rate |
4.58 | % | 4.13 | % | * | * | 3.22 | % | 2.99 | % | 4.19 | % | ||||||||||||
| Expected rate of return on plan assets |
6.00 | % | 6.00 | % | 6.00 | % | 6.01 | % | 5.93 | % | 6.92 | % | ||||||||||||
| Annual rate of compensation increase |
3.00 | % | * | * | 3.00 | % | 3.00 | % | 3.00 | % | ||||||||||||||
| * | Not applicable |
| ** | We used discount rates of 4.90% and 4.34% to measure the net periodic pension income of the U.S. Retirement Plan before and after a partial plan settlement that occurred on June 1, 2014, respectively. |
We select our discount rates by reference to published bond yield curves.
The following table presents future benefits expected to be paid at December 31, 2016:
| (in millions) | U.S. Retirement Plan |
German, French and UK Plans |
||||||
| 2017 |
$ | 13.9 | $ | 3.1 | ||||
| 2018 |
13.7 | 3.0 | ||||||
| 2019 |
12.8 | 3.8 | ||||||
| 2020 |
13.0 | 3.7 | ||||||
| 2021 |
13.1 | 4.5 | ||||||
| 2022 – 2026 |
63.3 | 28.2 | ||||||
During the year ended December 31, 2016, we made no contributions to the U.S. Retirement Plan and $10.1 million of aggregate contributions to the German, French and UK Plans. In 2017, we expect to make no contributions to the U.S. Retirement Plan and aggregate contributions of $4.2 million to the German, French and UK Plans.
The following table presents information about plan assets by type of fair value measurement:
| December 31, 2016 | December 31, 2015 | |||||||||||||||||||||||||||
| (in millions) | Total | Level 1 | Level 2 | Level 3 | Total | Level 1 | Level 2 | |||||||||||||||||||||
| U.S. Retirement Plan: |
||||||||||||||||||||||||||||
| Cash and cash equivalents |
$ | 2.0 | $ | 2.0 | $ | — | $ | — | $ | 1.4 | $ | 1.4 | $ | — | ||||||||||||||
| Fixed income funds |
181.0 | — | 181.0 | — | 171.4 | — | 171.4 | |||||||||||||||||||||
| Equity funds |
55.2 | 14.8 | 36.4 | 4.0 | 50.0 | 18.2 | 31.8 | |||||||||||||||||||||
|
|
|
|
|
|
|
|
|
|
|
|
|
|
|
|||||||||||||||
| Total |
$ | 238.2 | $ | 16.8 | $ | 217.4 | $ | 4.0 | $ | 222.8 | $ | 19.6 | $ | 203.2 | ||||||||||||||
|
|
|
|
|
|
|
|
|
|
|
|
|
|
|
|||||||||||||||
| German, French and UK Plans: |
||||||||||||||||||||||||||||
| Cash and cash equivalents |
$ | 1.1 | $ | 1.1 | $ | — | $ | — | $ | 1.0 | $ | 1.0 | $ | — | ||||||||||||||
| Fixed income funds |
32.4 | — | 32.4 | — | 68.2 | — | 68.2 | |||||||||||||||||||||
| Equity funds |
61.7 | — | 61.7 | — | 15.5 | — | 15.5 | |||||||||||||||||||||
|
|
|
|
|
|
|
|
|
|
|
|
|
|
|
|||||||||||||||
| Total |
$ | 95.2 | $ | 1.1 | $ | 94.1 | $ | — | $ | 84.7 | $ | 1.0 | $ | 83.7 | ||||||||||||||
|
|
|
|
|
|
|
|
|
|
|
|
|
|
|
|||||||||||||||
27
At December 31, 2016, the investment strategy of the U.S. Retirement Plan is to match the investment asset duration with the pension liability duration. This strategy, utilizing diversified fixed income funds, attempts to hedge the discount rate used to present value future pension obligations. The fixed income funds invest in long duration investment grade corporate bonds primarily across industrial, financial and utilities sectors and is managed by a single institution. Surplus assets, the fair market value of assets in excess of benefit obligations, are invested in equity funds. We estimate the future return on plan assets after considering prior performance, but primarily based upon the mix of assets and expectations for the long-term returns on those asset classes. Based on the target asset allocation for each asset class, the overall expected rate of return is adjusted for the historical experience and future expectations of returns as a result of active portfolio management as compared to the benchmark returns. Assets measured using Level 3 inputs were not material to the portfolio.
At December 31, 2016, the investment strategy for the assets of the German, French and UK Plans is to match the expected return of its portfolio with the required return to reach its long-term funding objectives. To generate this return, the plan invests in return-seeking assets, primarily global equity funds. In addition to targeting this return, the strategy also includes mitigating the risk that the present value of the liabilities increases as a result of changes to inflation and interest rates. These liability risks are hedged by investing in fixed income funds, primarily consisting of government bonds and inflation-linked government bonds. The expected long-term rate of return on plan assets used in determining pension expense is determined in a similar manner to the U.S. Retirement Plan.
| 16. | Leases |
We lease office and warehouse space, vehicles and computer and office equipment under operating leases. Operating lease expense was $39.2 million, $32.8 million and $35.5 million for the years ended December 31, 2016, 2015 and 2014, respectively.
The following table presents future minimum lease payments under operating leases at December 31, 2016:
| (in millions) | ||||
| 2017 |
$ | 33.4 | ||
| 2018 |
28.4 | |||
| 2019 |
21.7 | |||
| 2020 |
15.1 | |||
| 2021 |
12.9 | |||
| Thereafter |
32.8 | |||
|
|
|
|||
| Total minimum payments |
$ | 144.3 | ||
|
|
|
|||
| 17. | Other income (expense), net |
Other income (expense), net, consists primarily of foreign currency remeasurement gains and losses. Significant foreign-denominated debt instruments are held by a subsidiary in the United States, causing us to record remeasurement gains or losses in earnings to the extent not hedged. In 2015, we designated some of that debt as a hedge of our net investment in foreign operations, which has reduced the impact to earnings. See Note 9.
28
| 18. | Income taxes |
The following table presents information related to the consolidated income statements:
| Year ended December 31, | ||||||||||||
| (in millions) | 2016 | 2015 | 2014 | |||||||||
| Income before income taxes: |
||||||||||||
| United States |
$ | 146.3 | $ | 123.3 | $ | 121.4 | ||||||
| Foreign |
88.0 | 106.8 | 116.0 | |||||||||
|
|
|
|
|
|
|
|||||||
| Total |
$ | 234.3 | $ | 230.1 | $ | 237.4 | ||||||
|
|
|
|
|
|
|
|||||||
| Income tax provision: |
||||||||||||
| Current income tax provision: |
||||||||||||
| Federal |
$ | 37.9 | $ | 5.1 | $ | 3.8 | ||||||
| State |
9.1 | 0.8 | 0.6 | |||||||||
| Foreign |
35.7 | 42.6 | 46.5 | |||||||||
|
|
|
|
|
|
|
|||||||
| Total |
82.7 | 48.5 | 50.9 | |||||||||
|
|
|
|
|
|
|
|||||||
| Deferred income tax provision (benefit): |
||||||||||||
| Federal |
11.2 | 38.3 | 40.1 | |||||||||
| State |
(1.1 | ) | 0.9 | 4.3 | ||||||||
| Foreign |
(6.7 | ) | (11.9 | ) | (10.5 | ) | ||||||
|
|
|
|
|
|
|
|||||||
| Total |
3.4 | 27.3 | 33.9 | |||||||||
|
|
|
|
|
|
|
|||||||
| Total income tax provision |
$ | 86.1 | $ | 75.8 | $ | 84.8 | ||||||
|
|
|
|
|
|
|
|||||||
The following table presents the reconciliation of the income tax provision calculated at the United States statutory federal income tax rate of 35% to the amounts presented in the consolidated income statements:
| Year ended December 31, | ||||||||||||
| (in millions) | 2016 | 2015 | 2014 | |||||||||
| Income tax provision at United States federal statutory rate |
$ | 82.0 | $ | 80.5 | $ | 83.1 | ||||||
| State income taxes, net of federal benefit |
5.2 | 1.4 | 3.3 | |||||||||
| Change in foreign tax rates |
— | (4.5 | ) | — | ||||||||
| Foreign rate differential |
(7.4 | ) | (11.0 | ) | (10.4 | ) | ||||||
| Changes to valuation allowance not included above |
5.4 | 5.1 | 5.6 | |||||||||
| Other, net |
0.9 | 4.3 | 3.2 | |||||||||
|
|
|
|
|
|
|
|||||||
| Income tax provision |
$ | 86.1 | $ | 75.8 | $ | 84.8 | ||||||
|
|
|
|
|
|
|
|||||||
29
The following table presents information about deferred tax assets and liabilities:
| December 31, | ||||||||
| (in millions) | 2016 | 2015 | ||||||
| Deferred tax assets: |
||||||||
| Net operating loss carryforwards |
$ | 104.1 | $ | 136.2 | ||||
| Other |
40.7 | 40.3 | ||||||
|
|
|
|
|
|||||
| Deferred tax assets, gross |
144.8 | 176.5 | ||||||
| Valuation allowances |
(105.1 | ) | (102.5 | ) | ||||
|
|
|
|
|
|||||
| Deferred tax assets, net |
39.7 | 74.0 | ||||||
|
|
|
|
|
|||||
| Deferred tax liabilities: |
||||||||
| Intangible assets |
(442.0 | ) | (467.2 | ) | ||||
| Goodwill |
(39.7 | ) | (38.2 | ) | ||||
| Other |
(21.4 | ) | (16.2 | ) | ||||
|
|
|
|
|
|||||
| Total deferred tax liabilities |
(503.1 | ) | (521.6 | ) | ||||
|
|
|
|
|
|||||
| Net deferred tax liability |
$ | (463.4 | ) | $ | (447.6 | ) | ||
|
|
|
|
|
|||||
| Classification on consolidated balance sheets: |
||||||||
| Other assets |
$ | 13.8 | $ | 11.9 | ||||
| Deferred income tax liabilities |
(477.2 | ) | (459.5 | ) | ||||
|
|
|
|
|
|||||
| Net deferred tax liability |
$ | (463.4 | ) | $ | (447.6 | ) | ||
|
|
|
|
|
|||||
The increase (decrease) to the valuation allowance for the years ended December 31, 2016, 2015 and 2014 was $2.6 million, $(7.5) million and $(9.3) million, respectively.
At December 31, 2016, most of the valuation allowances presented above relate to foreign net operating loss carryforwards that are not expected to be realized. We evaluate the realization of deferred tax assets by considering such factors as the reversal of existing taxable temporary differences, expected profitability by tax jurisdiction and available carryforward periods. The extent and timing of any such reversals will influence the extent of tax benefits recognized in a particular year. Should applicable losses, credits and deductions ultimately be realized, the resulting reduction in the valuation allowance would generally be recognized as a component of our income tax provision or benefit.
Uncertain tax positions
We conduct business globally, causing us to file income tax returns in the United States federal jurisdiction and various state and foreign jurisdictions. In the normal course of business, we are subject to examination by taxing authorities, including jurisdictions in which we have significant operations such as Germany, France, the UK, Belgium, Sweden, Canada, Switzerland and the United States. We have concluded substantially all income tax matters (i) in the United States through 2005 and (ii) in the foreign jurisdictions noted above through 2010.
The development of reserves for uncertain tax positions requires judgments about tax issues, potential outcomes and timing of settlement discussions with tax authorities. If we were to prevail on all uncertain tax positions, we would recognize a benefit to our income tax provision.
30
The following table reflects changes to the reserve for uncertain tax positions:
| Year ended December 31, | ||||||||||||
| (in millions) | 2016 | 2015 | 2014 | |||||||||
| Beginning balance |
$ | 62.2 | $ | 61.7 | $ | 57.9 | ||||||
| Additions: |
||||||||||||
| Tax positions related to the current year |
1.7 | 1.7 | 5.1 | |||||||||
| Tax positions related to prior years |
0.1 | 0.3 | 0.3 | |||||||||
| Reductions: |
||||||||||||
| Tax positions related to prior years |
— | (0.2 | ) | (0.1 | ) | |||||||
| Settlements with taxing authorities |
(1.2 | ) | (0.1 | ) | (0.3 | ) | ||||||
| Lapse of statutes of limitations |
(0.6 | ) | (0.6 | ) | (0.4 | ) | ||||||
| Currency translation |
(0.4 | ) | (0.6 | ) | (0.8 | ) | ||||||
|
|
|
|
|
|
|
|||||||
| Ending balance |
$ | 61.8 | $ | 62.2 | $ | 61.7 | ||||||
|
|
|
|
|
|
|
|||||||
The amounts above exclude accrued interest and penalties of $1.2 million and $1.0 million at December 31, 2016 and 2015, respectively. We expect a reduction in the liability for uncertain tax positions of up to $0.9 million over the next twelve months as a result of settlements with taxing authorities and the lapse of statutes of limitations.
Other matters
Neither income taxes nor foreign withholding taxes have been provided on $842.8 million of cumulative undistributed earnings of foreign subsidiaries as of December 31, 2016. These earnings are considered permanently invested in the business. We make an evaluation at the end of each reporting period as to whether or not some or all of the undistributed earnings are permanently reinvested. Future changes in facts and circumstances could require us to recognize income tax liabilities on the assumption that our foreign undistributed earnings will be distributed to the United States in a manner that attracts a net tax cost. At this time, a determination of the amount of unrecognized deferred tax liabilities is not practicable because of the complexities associated with its hypothetical calculation.
At December 31, 2016, we had federal net operating loss carryforwards of $133.5 million that begin to expire in 2027 and state net operating loss carryforwards of $332.8 million, with a corresponding state tax benefit of $12.7 million, that expire at various times through 2034. In addition, we had foreign net operating loss carryforwards of $308.2 million, which predominantly have indefinite expirations.
We have entered into an agreement that provides for the payment to Varietal of the majority of cash savings in U.S. federal, state and local income tax as a result of the utilization of net operating losses generated in periods prior to the IPO. See Note 20.
We file a consolidated federal and certain state combined income tax returns with our domestic subsidiaries.
31
| 19. | Comprehensive income or loss |
The following table presents changes in the components of AOCI, net of tax:
| (in millions) | Foreign currency translation |
Derivative instruments |
Defined benefit plans |
Total | ||||||||||||
| Balance at December 31, 2013 |
$ | 13.3 | $ | (2.1 | ) | $ | (8.7 | ) | $ | 2.5 | ||||||
| Net unrealized (loss) gain arising during the period |
(204.2 | ) | 0.7 | (27.0 | ) | (230.5 | ) | |||||||||
| Reclassification of net loss (gain) into earnings |
— | 1.1 | (3.0 | ) | (1.9 | ) | ||||||||||
|
|
|
|
|
|
|
|
|
|||||||||
| Balance at December 31, 2014 |
(190.9 | ) | (0.3 | ) | (38.7 | ) | (229.9 | ) | ||||||||
| Net unrealized (loss) gain arising during the period |
(174.4 | ) | 3.0 | (7.0 | ) | (178.4 | ) | |||||||||
| Reclassification of net (gain) loss into earnings |
— | (0.7 | ) | 2.7 | 2.0 | |||||||||||
|
|
|
|
|
|
|
|
|
|||||||||
| Balance at December 31, 2015 |
(365.3 | ) | 2.0 | (43.0 | ) | (406.3 | ) | |||||||||
| Net unrealized (loss) gain arising during the period |
(22.4 | ) | 9.1 | (9.4 | ) | (22.7 | ) | |||||||||
| Reclassification of net loss (gain) into earnings |
1.2 | (2.3 | ) | 2.7 | 1.6 | |||||||||||
|
|
|
|
|
|
|
|
|
|||||||||
| Balance at December 31, 2016 |
$ | (386.5 | ) | $ | 8.8 | $ | (49.7 | ) | $ | (427.4 | ) | |||||
|
|
|
|
|
|
|
|
|
|||||||||
The following table presents the reclassifications of net (gain) loss from AOCI into earnings:
| Year ended December 31, | ||||||||||||
| (in millions) | 2016 | 2015 | 2014 | |||||||||
| Foreign currency translation: |
||||||||||||
| Selling, general and administrative expenses |
$ | 1.7 | $ | — | $ | — | ||||||
| Income tax provision |
(0.5 | ) | — | — | ||||||||
|
|
|
|
|
|
|
|||||||
| Net income |
$ | 1.2 | $ | — | $ | — | ||||||
|
|
|
|
|
|
|
|||||||
| Derivative instruments: |
||||||||||||
| Cost of goods sold |
$ | (4.2 | ) | $ | (2.3 | ) | $ | 0.6 | ||||
| Interest expense |
1.4 | 0.3 | 0.6 | |||||||||
| Loss on extinguishment of debt |
— | 0.7 | 0.5 | |||||||||
| Income tax provision |
0.5 | 0.6 | (0.6 | ) | ||||||||
|
|
|
|
|
|
|
|||||||
| Net income |
$ | (2.3 | ) | $ | (0.7 | ) | $ | 1.1 | ||||
|
|
|
|
|
|
|
|||||||
| Defined benefit plans: |
||||||||||||
| Selling, general and administrative expenses |
$ | 3.9 | $ | 3.9 | $ | (5.3 | ) | |||||
| Income tax provision |
(1.2 | ) | (1.2 | ) | 2.3 | |||||||
|
|
|
|
|
|
|
|||||||
| Net income |
$ | 2.7 | $ | 2.7 | $ | (3.0 | ) | |||||
|
|
|
|
|
|
|
|||||||
The following table presents the income tax effects of comprehensive income or loss components:
| Year ended December 31, | ||||||||||||
| (in millions) | 2016 | 2015 | 2014 | |||||||||
| Foreign currency translation: |
||||||||||||
| Net unrealized income tax provision arising during the period |
$ | (11.1 | ) | $ | (1.5 | ) | $ | — | ||||
| Reclassification of net income tax benefit into earnings |
(0.5 | ) | — | — | ||||||||
| Derivative instruments: |
||||||||||||
| Net unrealized income tax provision arising during the period |
(4.8 | ) | (1.8 | ) | (0.2 | ) | ||||||
| Reclassification of net income tax provision (benefit) into earnings |
0.5 | 0.6 | (0.6 | ) | ||||||||
| Defined benefit plans: |
||||||||||||
| Net unrealized income tax benefit arising during the period |
2.2 | 4.8 | 10.1 | |||||||||
| Reclassification of net income tax (benefit) provision into earnings |
(1.2 | ) | (1.2 | ) | 2.3 | |||||||
32
| 20. | Related party transactions |
Due to Varietal — ITRA
We are party to an ITRA with Varietal. The ITRA provides for the payment of most of the cash savings in U.S. federal, state and local income tax realized as a result of utilizing net operating losses that were generated in periods prior to the IPO. Varietal will not reimburse us for any payments previously made under the ITRA if such benefits are subsequently disallowed. As noted previously, Madison Dearborn Partners owns a controlling interest in Varietal.
We make payments under the ITRA the year after the tax year for which we claim the net operating loss carryforwards. We made a payment under the ITRA of $78.1 million during the year ended December 31, 2016. At December 31, 2016, the remaining amount due to Varietal under the ITRA was $85.0 million, $27.7 million of which is classified as current and represents our estimate of the payment that will become due in March 2017.
Registration rights agreement
During the years ended December 31, 2016 and 2015, Varietal completed registered sales of 25.2 million and 31.1 million shares of our common stock, respectively. We received no proceeds from these sales and issued no additional shares of our common stock. Pursuant to our registration rights agreement with Varietal (see Note 10), we incurred expenses of $1.2 million and $1.5 million in 2016 and 2015, respectively, for the registrations and sales of common stock.
| 21. | Risks and uncertainties |
Evaluating goodwill and the VWR tradename for impairment
On October 1 of each year, we perform annual impairment testing of our goodwill and the VWR tradename. The impairment testing requires us to estimate the fair value of these assets, which requires significant judgment.
We experienced more modest growth across our business in 2016 compared to 2015, which caused us to decrease the projected cash flows of our reporting units resulting in a decline in the estimated fair value using the income approach. Increases in the market approach driven by increased stock performance and valuation multiples more than offset that decrease for the Americas and partially offset that decrease for EMEA-APAC. This resulted in an increase to the estimated fair value of our Americas reporting unit, a decrease to the estimated fair value of our EMEA-APAC reporting unit and an increase to the estimated fair value our indefinite-lived intangible assets, each compared to prior periods. However, future changes in our estimates or judgments could reduce our fair value measurements, which could in turn result in an impairment charge. For example, our expected net sales, cash flow performance or market conditions could be adversely affected by negative macroeconomic or industry-specific factors. In 2011 and 2010, we recognized impairment charges of $3.3 million and $48.1 million, respectively, related to changes in the science education industry, while in 2008 we recognized impairment charges of $392.1 million related to macroeconomic factors. We could also experience adverse changes in market factors such as discount rates, valuation multiples derived from comparable publicly-traded companies, a decline in the trading price of our common stock or control premiums derived from market transactions.
At October 1, 2016, the estimated fair value of the VWR tradename, which comprises substantially all of our indefinite-lived intangible assets, exceeded its carrying value by over $300 million, and the estimated fair values of our Americas and EMEA-APAC reporting units exceeded their carrying values by over $1.1 billion and over $900 million, respectively.
Evaluating long-lived assets for impairment
We have acquired 46 businesses since June 2007. Following their recognition in business combinations, we are required to monitor their long-lived assets for indicators of impairment. If identified, we are required to perform impairment testing, which may require us to estimate the fair value of those assets. Estimating fair value requires us to exercise significant judgment.
33
Based on a review of financial performance in 2015, we decreased our forecast of the profitability of a non-strategic business in our EMEA-APAC segment and recorded impairment charges of $3.2 million in 2015. In 2016, we committed to a plan to sell that business as part of the restructuring program disclosed in Note 14. As a result, we incurred additional charges of $6.6 million to write-down the carrying value of its net assets.
Should we identify other indicators of impairment in future periods, we may be required to recognize additional charges.
Changes to foreign currency exchange rates
Our operations span the globe. A significant portion of our earnings and net assets are denominated in foreign currencies, principally the euro but also the British pound sterling and many others. We also carry a significant amount of euro-denominated debt in the United States. Because we translate or remeasure these items into U.S. dollars, changes in foreign currency exchange rates can have a significant impact on our reported results.
We are not able to predict the impact that future changes in foreign currency exchange rates may have on our operating results, but their impact could be significant. Over the past few years, we have experienced significant changes in foreign currency exchange rates. Following a 2016 referendum to leave the European Union, the value of the British pound sterling in U.S. dollars dropped significantly. The value of the euro in U.S. dollars also reached a historic low in late 2016. These trends followed a significant strengthening of the U.S. dollar against most foreign currencies during the second half of 2014.
In 2015, we designated hedges that reduced our exposure to foreign currency remeasurement recorded in earnings. For more information, see Note 9.
Significant concentrations
Our two largest suppliers accounted for 8% and 6% of our cost of goods sold in 2016.
| 22. | Segment financial information |
We report financial results on the basis of two reportable segments organized by geographic region: the Americas and EMEA-APAC. Both the Americas and EMEA-APAC segments provide laboratory products, services and solutions to customers in the life science, general research and applied markets, including the pharmaceutical, biotechnology, agricultural, chemical, environmental, food and beverage, health care, microelectronic and petrochemical industries, as well as governmental agencies, universities and research institutes and environmental organizations. Corporate costs are managed centrally and attributed to the Americas segment.
34
The following tables present segment financial information:
| Year ended December 31, | ||||||||||||
| (in millions) | 2016 | 2015 | 2014 | |||||||||
| Net sales: |
||||||||||||
| Americas |
$ | 2,737.7 | $ | 2,577.3 | $ | 2,430.1 | ||||||
| EMEA-APAC |
1,776.5 | 1,741.5 | 1,945.2 | |||||||||
|
|
|
|
|
|
|
|||||||
| Total |
$ | 4,514.2 | $ | 4,318.8 | $ | 4,375.3 | ||||||
|
|
|
|
|
|
|
|||||||
| Operating income: |
||||||||||||
| Americas |
$ | 174.9 | $ | 162.5 | $ | 141.0 | ||||||
| EMEA-APAC |
140.7 | 157.7 | 176.9 | |||||||||
|
|
|
|
|
|
|
|||||||
| Total |
$ | 315.6 | $ | 320.2 | $ | 317.9 | ||||||
|
|
|
|
|
|
|
|||||||
| Capital expenditures: |
||||||||||||
| Americas |
$ | 47.8 | $ | 30.5 | $ | 22.2 | ||||||
| EMEA-APAC |
12.1 | 10.4 | 11.4 | |||||||||
|
|
|
|
|
|
|
|||||||
| Total |
$ | 59.9 | $ | 40.9 | $ | 33.6 | ||||||
|
|
|
|
|
|
|
|||||||
| Depreciation and amortization: |
||||||||||||
| Americas |
$ | 87.3 | $ | 82.1 | $ | 77.8 | ||||||
| EMEA-APAC |
42.8 | 42.4 | 51.5 | |||||||||
|
|
|
|
|
|
|
|||||||
| Total |
$ | 130.1 | $ | 124.5 | $ | 129.3 | ||||||
|
|
|
|
|
|
|
|||||||
| December 31, | ||||||||
| (in millions) | 2016 | 2015 | ||||||
| Total assets: |
||||||||
| Americas |
$ | 3,067.1 | $ | 2,867.6 | ||||
| EMEA-APAC |
1,895.4 | 1,926.2 | ||||||
|
|
|
|
|
|||||
| Total |
$ | 4,962.5 | $ | 4,793.8 | ||||
|
|
|
|
|
|||||
The amounts above exclude inter-segment activity. All of the net sales for each segment are from external customers. We determined that disclosing net sales for each group of similar customers, products and services would be impracticable.
The following tables present net sales and property and equipment by geographic area:
| Year ended December 31, | ||||||||||||
| (in millions) | 2016 | 2015 | 2014 | |||||||||
| Net sales: |
||||||||||||
| United States |
$ | 2,517.7 | $ | 2,355.9 | $ | 2,188.2 | ||||||
| Canada |
185.2 | 188.9 | 205.6 | |||||||||
| Central and South America |
34.8 | 32.5 | 36.3 | |||||||||
| Europe |
1,704.8 | 1,676.6 | 1,870.3 | |||||||||
| Asia-Pacific |
71.7 | 64.9 | 74.9 | |||||||||
|
|
|
|
|
|
|
|||||||
| Total |
$ | 4,514.2 | $ | 4,318.8 | $ | 4,375.3 | ||||||
|
|
|
|
|
|
|
|||||||
35
| December 31, | ||||||||
| (in millions) | 2016 | 2015 | ||||||
| Property and equipment: |
||||||||
| United States |
$ | 166.1 | $ | 139.9 | ||||
| Canada |
5.9 | 4.2 | ||||||
| Central and South America |
4.4 | 2.6 | ||||||
| Europe |
72.0 | 74.9 | ||||||
| Asia-Pacific |
5.4 | 6.6 | ||||||
|
|
|
|
|
|||||
| Total |
$ | 253.8 | $ | 228.2 | ||||
|
|
|
|
|
|||||
We disclose property and equipment by geographic area because many of these assets cannot be readily moved and are illiquid, subjecting them to geographic risk. None of our other long-lived assets are subject to geographic risk.
| 23. | Unaudited quarterly financial information |
| Year ended December 31, 2016 | ||||||||||||||||
| (in millions, except per share data) | First | Second | Third | Fourth | ||||||||||||
| Net sales |
$ | 1,098.3 | $ | 1,149.5 | $ | 1,136.1 | $ | 1,130.3 | ||||||||
| Gross profit |
310.6 | 323.4 | 313.5 | 314.3 | ||||||||||||
| Net income |
38.8 | 41.8 | 40.6 | 27.0 | ||||||||||||
| Earnings per share: |
||||||||||||||||
| Basic |
0.30 | 0.32 | 0.31 | 0.21 | ||||||||||||
| Diluted |
0.29 | 0.32 | 0.31 | 0.20 | ||||||||||||
| Year ended December 31, 2015 | ||||||||||||||||
| (in millions, except per share data) | First | Second | Third | Fourth | ||||||||||||
| Net sales |
$ | 1,029.6 | $ | 1,081.2 | $ | 1,095.5 | $ | 1,112.5 | ||||||||
| Gross profit |
291.2 | 298.5 | 299.5 | 307.9 | ||||||||||||
| Net income |
71.5 | 18.3 | 11.0 | 53.5 | ||||||||||||
| Earnings per share: |
||||||||||||||||
| Basic |
0.54 | 0.14 | 0.08 | 0.41 | ||||||||||||
| Diluted |
0.54 | 0.14 | 0.08 | 0.41 | ||||||||||||
| 24. | Condensed parent company only financial statements |
Our subsidiaries are party to certain debt agreements that restrict their ability to pay dividends or make other distributions to us. At December 31, 2016, $1,308.4 million of the net assets of our subsidiaries were subject to those restrictions. Those net assets are restricted from being transferred to us in the form of loans, advances or cash dividends except as permitted by the debt agreements. For example, those agreements allow our subsidiaries to fund amounts payable under the ITRA without the restriction.
Pursuant to SEC regulations, the following presents condensed financial information as to the financial position, results of operations and cash flows of VWR Corporation on an unconsolidated basis. The related disclosures required by those regulations are provided elsewhere in the consolidated financial statements.
36
Condensed parent company only balance sheets
| December 31, | ||||||||
| (in millions, except per share data) | 2016 | 2015 | ||||||
| Assets |
||||||||
| Cash and cash equivalents |
$ | 4.7 | $ | — | ||||
| Investment in unconsolidated subsidiaries |
1,595.9 | 1,538.3 | ||||||
|
|
|
|
|
|||||
| Total assets |
$ | 1,600.6 | $ | 1,538.3 | ||||
|
|
|
|
|
|||||
| Liabilities, redeemable equity and stockholders’ equity |
||||||||
| Current liabilities: |
||||||||
| Current amount due to Varietal — ITRA |
$ | 27.7 | 78.1 | |||||
|
|
|
|
|
|||||
| Total current liabilities |
27.7 | 78.1 | ||||||
| Amount due to Varietal — ITRA, net of current portion |
57.3 | 85.0 | ||||||
|
|
|
|
|
|||||
| Total liabilities |
85.0 | 163.1 | ||||||
| Redeemable equity, at redemption value |
21.2 | 38.8 | ||||||
| Stockholders’ equity: |
||||||||
| Preferred stock, $0.01 par value; 50.0 shares authorized, no shares issued or outstanding |
— | — | ||||||
| Common stock, $0.01 par value; 750.0 shares authorized, 131.6 and 131.4 shares issued and outstanding |
1.3 | 1.3 | ||||||
| Additional paid-in capital |
1,766.0 | 1,735.1 | ||||||
| Retained earnings |
154.5 | 6.3 | ||||||
| Accumulated other comprehensive loss |
(427.4 | ) | (406.3 | ) | ||||
|
|
|
|
|
|||||
| Total stockholders’ equity |
1,494.4 | 1,336.4 | ||||||
|
|
|
|
|
|||||
| Total liabilities, redeemable equity and stockholders’ equity |
$ | 1,600.6 | $ | 1,538.3 | ||||
|
|
|
|
|
|||||
Condensed parent company only income statements
| Year ended December 31, | ||||||||||||
| (in millions) | 2016 | 2015 | 2014 | |||||||||
| Equity in earnings of unconsolidated subsidiaries, net of tax |
$ | 148.2 | $ | 154.3 | $ | 152.6 | ||||||
|
|
|
|
|
|
|
|||||||
| Net income |
148.2 | 154.3 | 152.6 | |||||||||
| Accretion of dividends on redeemable equity |
— | — | (29.4 | ) | ||||||||
|
|
|
|
|
|
|
|||||||
| Net income applicable to common stockholders |
$ | 148.2 | $ | 154.3 | $ | 123.2 | ||||||
|
|
|
|
|
|
|
|||||||
37
Condensed parent company only statements of cash flows
| Year ended December 31, | ||||||||||||
| (in millions) | 2016 | 2015 | 2014 | |||||||||
| Cash flows from financing activities: |
||||||||||||
| Proceeds from issuance of common stock |
$ | 4.7 | $ | 1.3 | $ | 582.6 | ||||||
| Payment of stock issuance costs |
— | — | (4.8 | ) | ||||||||
| Capital contributed to unconsolidated subsidiaries |
— | (1.3 | ) | (577.8 | ) | |||||||
| Receipt of dividends from unconsolidated subsidiaries |
78.1 | 9.8 | 33.9 | |||||||||
| Payment of dividend |
— | — | (25.0 | ) | ||||||||
| Redemption of redeemable equity |
— | — | (8.9 | ) | ||||||||
| Payment to Varietal under ITRA |
(78.1 | ) | (9.8 | ) | — | |||||||
|
|
|
|
|
|
|
|||||||
| Net cash from financing activities |
4.7 | — | — | |||||||||
| Cash and cash equivalents at beginning of period |
— | — | — | |||||||||
|
|
|
|
|
|
|
|||||||
| Cash and cash equivalents at end of period |
$ | 4.7 | $ | — | $ | — | ||||||
|
|
|
|
|
|
|
|||||||
| 25. | Valuation and qualifying accounts |
The following table presents changes to our valuation and qualifying accounts:
| (in millions) | Beginning balance |
Charged to costs and expenses |
Deductions(1) | Currency translation |
Ending balance |
|||||||||||||||
| Year ended December 31, 2016: |
||||||||||||||||||||
| Reserves on trade accounts receivable |
$ | 12.0 | $ | 3.0 | $ | (4.1 | ) | $ | (0.4 | ) | $ | 10.5 | ||||||||
| Valuation allowances on deferred taxes |
102.5 | 5.0 | — | (2.4 | ) | 105.1 | ||||||||||||||
| Year ended December 31, 2015: |
||||||||||||||||||||
| Reserves on trade accounts receivable |
12.2 | 3.3 | (2.6 | ) | (0.9 | ) | 12.0 | |||||||||||||
| Valuation allowances on deferred taxes |
110.0 | 3.3 | — | (10.8 | ) | 102.5 | ||||||||||||||
| Year ended December 31, 2014: |
||||||||||||||||||||
| Reserves on trade accounts receivable |
14.8 | 2.4 | (4.2 | ) | (0.8 | ) | 12.2 | |||||||||||||
| Valuation allowances on deferred taxes |
119.3 | 2.5 | — | (11.8 | ) | 110.0 | ||||||||||||||
| (1) | Deductions represent bad debts charged off, net of recoveries. |
38