Attached files
| file | filename |
|---|---|
| 8-K - 8-K - Atlantic Capital Bancshares, Inc. | acbi-20200518x8k.htm |
Exhibit 99.1
| Investor Presentation | Q1 2020 atlanticcapitalbank.com NASDAQ TICKER: ACBI |

| atlanticcapitalbank.com Forward-Looking Statements Disclaimer and Non-GAAP Financial Information 2 This presentation contains forward-looking statements within the meaning of section 27A of the Securities Act of 1933, as amended, and 21E of the Securities Exchange Act of 1934, as amended (the “Exchange Act”). These forward-looking statements reflect our current views with respect to, among other things, future events and our financial performance. These statements are often, but not always, made through the use of words or phrases such as “may,” “should,” “could,” “predict,” “potential,” “believe,” “will likely result,” “expect,” “continue,” “will,” “anticipate,” “seek,” “estimate,” “intend,” “plan,” “strive,” “projection,” “would,” and “outlook,” or the negative version of those words or other comparable words or phrases of a future or forward-looking nature. These forward-looking statements are not historical facts, and are based on current expectations, estimates, and projections about our industry, management’s beliefs, and certain assumptions made by management, many of which, by their nature, are inherently uncertain and beyond our control. Accordingly, we caution you that any such forward-looking statements are not guarantees of future performance and are subject to risks, assumptions, and uncertainties that are difficult to predict. Although we believe that the expectations reflected in these forward-looking statements are reasonable as of the date made, actual results may prove to be materially different from the results expressed or implied by the forward-looking statements. The following risks, among others, could cause actual results to differ materially from the anticipated results or other expectations expressed in the forward-looking statements: The impact of the COVID-19 pandemic and the responses of governmental authorities on our operations, including declines in credit quality, strains on capital and liquidity, fluctuations in our payment processing business, and declines in deposits; our strategic decision to focus on the greater Atlanta market may not positively impact our financial condition in the expected timeframe, or at all; costs associated with our growth and hiring initiatives in the Atlanta market area; risks associated with increased geographic concentration, borrower concentration and concentration in commercial real estate and commercial and industrial loans resulting from our exit of the Tennessee and northwest Georgia markets and our strategic realignment; our strategic decision to increase our focus on SBA and franchise lending may expose us to additional risks associated with these types of lending, including industry concentration risks, our ability to sell the guaranteed portion of SBA loans, the impact of negative economic conditions on small businesses’ ability to repay the non-guaranteed portions of SBA loans, and changes to applicable federal regulations; risks associated with our ability to manage the planned growth of our payment processing business, including evolving regulations, security risks, and unforeseen increases in transaction volume resulting from changes in our customers’ businesses and changes in the competitive landscape for payment processing; changes in asset quality and credit risk; the cost and availability of capital; customer acceptance of our products and services; customer borrowing, repayment, investment and deposit practices; the introduction, withdrawal, success and timing of business initiatives; the impact, extent, and timing of technological changes; severe catastrophic events in our geographic area; a weakening of the economies in which we conduct operations may adversely affect our operating results; the U.S. legal and regulatory framework could adversely affect the operating results of the Company; the interest rate environment may compress margins and adversely affect net interest income; our ability to anticipate or respond to interest rate changes correctly and manage interest rate risk presented through unanticipated changes in our interest rate risk position and/or short- and long-term interest rates; changes in trade, monetary and fiscal policies of various governmental bodies and central banks could affect the economic environment in which we operate; our ability to determine accurate values of certain assets and liabilities; adverse developments in securities, public debt, and capital markets, including changes in market liquidity and volatility; unanticipated changes in our liquidity position, including but not limited to our ability to enter the financial markets to manage and respond to any changes to our liquidity position; the impact of the transition from LIBOR and our ability to adequately manage such transition; adequacy of our risk management program; increased competitive pressure due to consolidation in the financial services industry; risks related to security breaches, cybersecurity attacks, and other significant disruptions in our information technology systems; and other risks and factors identified in our most recent annual report on Form 10-K and our other reports filed with or furnished to the Securities and Exchange Commission (“SEC”) from time to time. Statements included in this presentation include non-GAAP financial measures and should be read along with the accompanying tables, which provide a reconciliation of non-GAAP financial measures to GAAP financial measures. Atlantic Capital management uses non-GAAP financial measures, including: (i) taxable equivalent net interest income, (ii) taxable equivalent net interest margin, (iii) tangible book value per share, (iv) tangible common equity to tangible assets, and (v) pre-provision net revenue. Management believes that non-GAAP financial measures provide a greater understanding of ongoing performance and operations, and enhance comparability with prior periods. Non-GAAP financial measures should not be considered as an alternative to any measure of performance or financial condition as determined in accordance with GAAP, and investors should consider Atlantic Capital’s performance and financial condition as reported under GAAP and all other relevant information when assessing the performance or financial condition of the Company. Non-GAAP financial measures have limitations as analytical tools, and investors should not consider them in isolation or as a substitute for analysis of the results or financial condition as reported under GAAP. Non-GAAP financial measures may not be comparable to non-GAAP financial measures presented by other companies. |
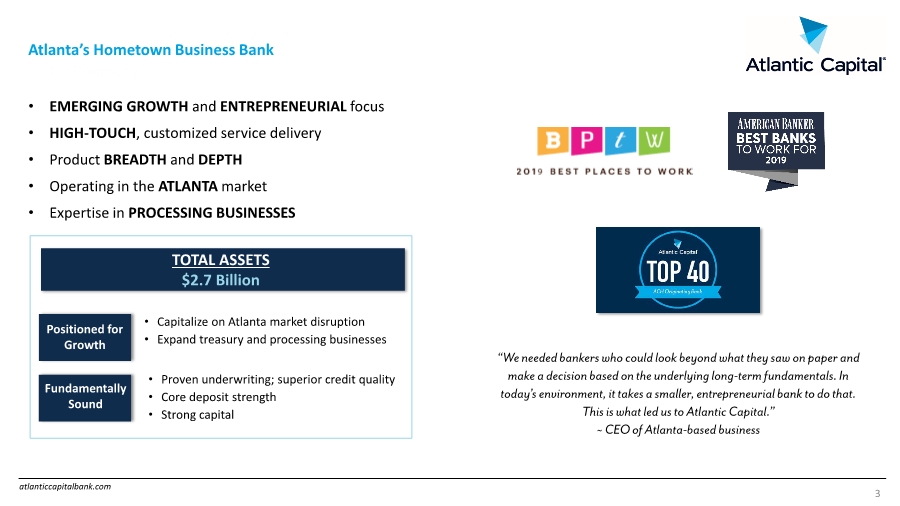
| atlanticcapitalbank.com Atlantic Capital Our Company Atlanta’s Hometown Business Bank • EMERGING GROWTH and ENTREPRENEURIAL focus • HIGH-TOUCH, customized service delivery • Product BREADTH and DEPTH • Operating in the ATLANTA market • Expertise in PROCESSING BUSINESSES 3 • Proven underwriting; superior credit quality • Core deposit strength • Strong capital • Capitalize on Atlanta market disruption • Expand treasury and processing businesses Fundamentally Sound Positioned for Growth TOTAL ASSETS $2.7 Billion “We needed bankers who could look beyond what they saw on paper and make a decision based on the underlying long-term fundamentals. In today’s environment, it takes a smaller, entrepreneurial bank to do that. This is what led us to Atlantic Capital.” ~ CEO of Atlanta-based business |
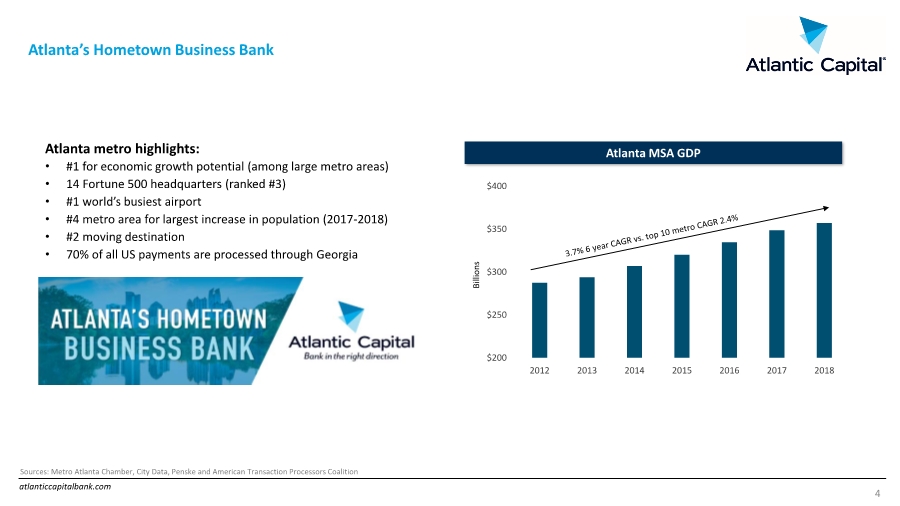
| atlanticcapitalbank.com Atlanta’s Hometown Business Bank 4 Atlanta metro highlights: • #1 for economic growth potential (among large metro areas) • 14 Fortune 500 headquarters (ranked #3) • #1 world’s busiest airport • #4 metro area for largest increase in population (2017-2018) • #2 moving destination • 70% of all US payments are processed through Georgia Sources: Metro Atlanta Chamber, City Data, Penske and American Transaction Processors Coalition $200 $250 $300 $350 $400 2012 2013 2014 2015 2016 2017 2018 Atlanta MSA GDP Billions |
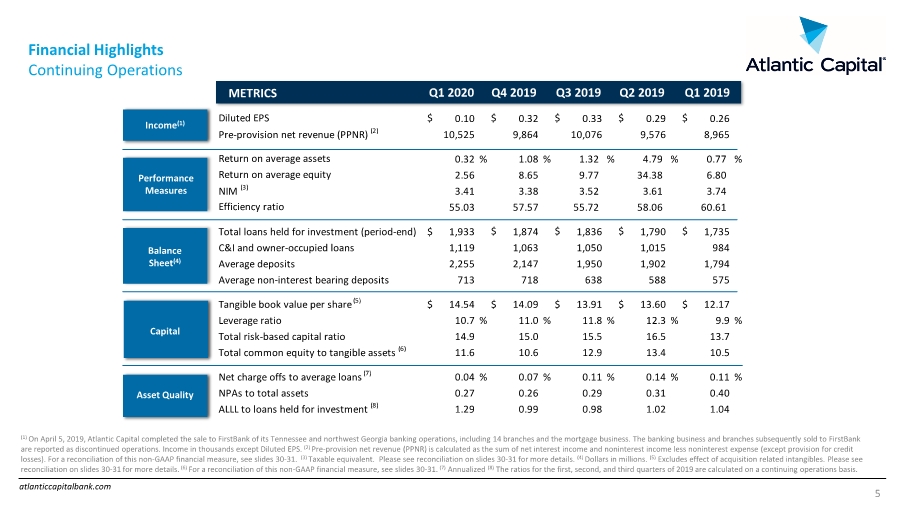
| atlanticcapitalbank.com Financial Highlights Continuing Operations 5 (1) On April 5, 2019, Atlantic Capital completed the sale to FirstBank of its Tennessee and northwest Georgia banking operations, including 14 branches and the mortgage business. The banking business and branches subsequently sold to FirstBank are reported as discontinued operations. Income in thousands except Diluted EPS. (2) Pre-provision net revenue (PPNR) is calculated as the sum of net interest income and noninterest income less noninterest expense (except provision for credit losses). For a reconciliation of this non-GAAP financial measure, see slides 30-31. (3) Taxable equivalent. Please see reconciliation on slides 30-31 for more details. (4) Dollars in millions. (5) Excludes effect of acquisition related intangibles. Please see reconciliation on slides 30-31 for more details. (6) For a reconciliation of this non-GAAP financial measure, see slides 30-31. (7) Annualized (8) The ratios for the first, second, and third quarters of 2019 are calculated on a continuing operations basis. Income(1) Balance Sheet(4) Capital Asset Quality METRICS Q4 2019 Q1 2020 Q3 2019 Performance Measures Q2 2019 Q1 2019 Diluted EPS $ 0.10 $ 0.32 $ 0.33 $ 0.29 $ 0.26 Pre-provision net revenue (PPNR) (2) 10,525 9,864 10,076 9,576 8,965 Return on average assets 0.32 % 1.08 % 1.32 % 4.79 % 0.77 % Return on average equity 2.56 8.65 9.77 34.38 6.80 NIM (3) 3.41 3.38 3.52 3.61 3.74 Efficiency ratio 55.03 57.57 55.72 58.06 60.61 Total loans held for investment (period-end) $ 1,933 $ 1,874 $ 1,836 $ 1,790 $ 1,735 C&I and owner-occupied loans 1,119 1,063 1,050 1,015 984 Average deposits 2,255 2,147 1,950 1,902 1,794 Average non-interest bearing deposits 713 718 638 588 575 Tangible book value per share (5) $ 14.54 $ 14.09 $ 13.91 $ 13.60 $ 12.17 Leverage ratio 10.7 % 11.0 % 11.8 % 12.3 % 9.9 % Total risk-based capital ratio 14.9 15.0 15.5 16.5 13.7 Total common equity to tangible assets (6) 11.6 10.6 12.9 13.4 10.5 0.04 % 0.07 % 0.11 % 0.14 % 0.11 % NPAs to total assets 0.27 0.26 0.29 0.31 0.40 ALLL to loans held for investment (8) 1.29 0.99 0.98 1.02 1.04 Net charge offs to average loans (7) |
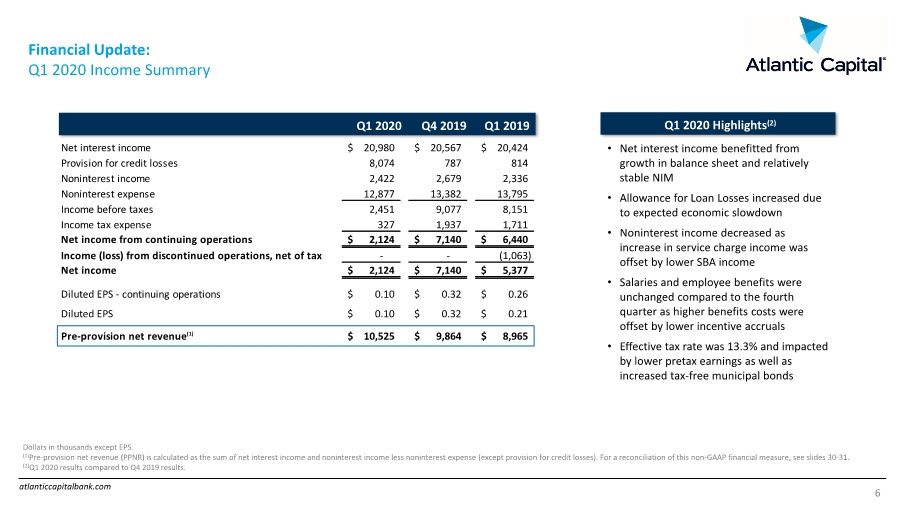
| atlanticcapitalbank.com Financial Update: Q1 2020 Income Summary 6 Net interest income 20,980 $ 20,567 $ 20,424 $ Provision for credit losses 8,074 787 814 Noninterest income 2,422 2,679 2,336 Noninterest expense 12,877 13,382 13,795 Income before taxes 2,451 9,077 8,151 Income tax expense 327 1,937 1,711 Net income from continuing operations 2,124 $ 7,140 $ 6,440 $ Income (loss) from discontinued operations, net of tax - - (1,063) Net income 2,124 $ 7,140 $ 5,377 $ Diluted EPS - continuing operations 0.10 $ 0.32 $ 0.26 $ Diluted EPS 0.10 $ 0.32 $ 0.21 $ Pre-provision net revenue(1) 10,525 $ 9,864 $ 8,965 $ Q1 2019 Q4 2019 Q1 2020 Q1 2020 Highlights(2) • Net interest income benefitted from growth in balance sheet and relatively stable NIM • Allowance for Loan Losses increased due to expected economic slowdown • Noninterest income decreased as increase in service charge income was offset by lower SBA income • Salaries and employee benefits were unchanged compared to the fourth quarter as higher benefits costs were offset by lower incentive accruals • Effective tax rate was 13.3% and impacted by lower pretax earnings as well as increased tax-free municipal bonds Dollars in thousands except EPS. (1)Pre-provision net revenue (PPNR) is calculated as the sum of net interest income and noninterest income less noninterest expense (except provision for credit losses). For a reconciliation of this non-GAAP financial measure, see slides 30-31. (2)Q1 2020 results compared to Q4 2019 results. $ in thousands, except EPS |
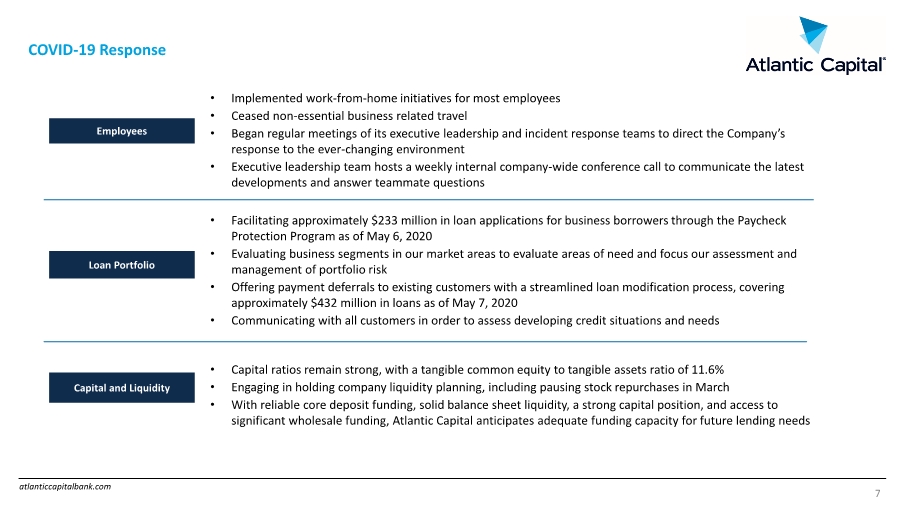
| atlanticcapitalbank.com COVID-19 Response 7 Employees Loan Portfolio Capital and Liquidity • Implemented work-from-home initiatives for most employees • Ceased non-essential business related travel • Began regular meetings of its executive leadership and incident response teams to direct the Company’s response to the ever-changing environment • Executive leadership team hosts a weekly internal company-wide conference call to communicate the latest developments and answer teammate questions • Facilitating approximately $233 million in loan applications for business borrowers through the Paycheck Protection Program as of May 6, 2020 • Evaluating business segments in our market areas to evaluate areas of need and focus our assessment and management of portfolio risk • Offering payment deferrals to existing customers with a streamlined loan modification process, covering approximately $432 million in loans as of May 7, 2020 • Communicating with all customers in order to assess developing credit situations and needs • Capital ratios remain strong, with a tangible common equity to tangible assets ratio of 11.6% • Engaging in holding company liquidity planning, including pausing stock repurchases in March • With reliable core deposit funding, solid balance sheet liquidity, a strong capital position, and access to significant wholesale funding, Atlantic Capital anticipates adequate funding capacity for future lending needs |
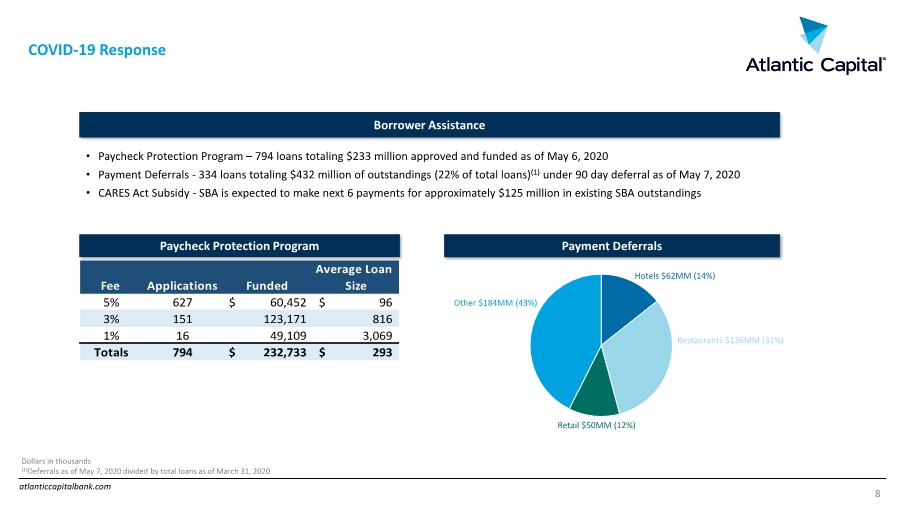
| atlanticcapitalbank.com COVID-19 Response 8 Payment Deferrals Paycheck Protection Program • Paycheck Protection Program – 794 loans totaling $233 million approved and funded as of May 6, 2020 • Payment Deferrals - 334 loans totaling $432 million of outstandings (22% of total loans)(1) under 90 day deferral as of May 7, 2020 • CARES Act Subsidy - SBA is expected to make next 6 payments for approximately $125 million in existing SBA outstandings Borrower Assistance Dollars in thousands (1)Deferrals as of May 7, 2020 divided by total loans as of March 31, 2020 Hotels $62MM (14%) Restaurants $136MM (31%) Retail $50MM (12%) Other $184MM (43%) Fee Applications Funded Average Loan Size 5% 627 60,452 $ 96 $ 3% 151 123,171 816 1% 16 49,109 3,069 Totals 794 232,733 $ 293 $ |
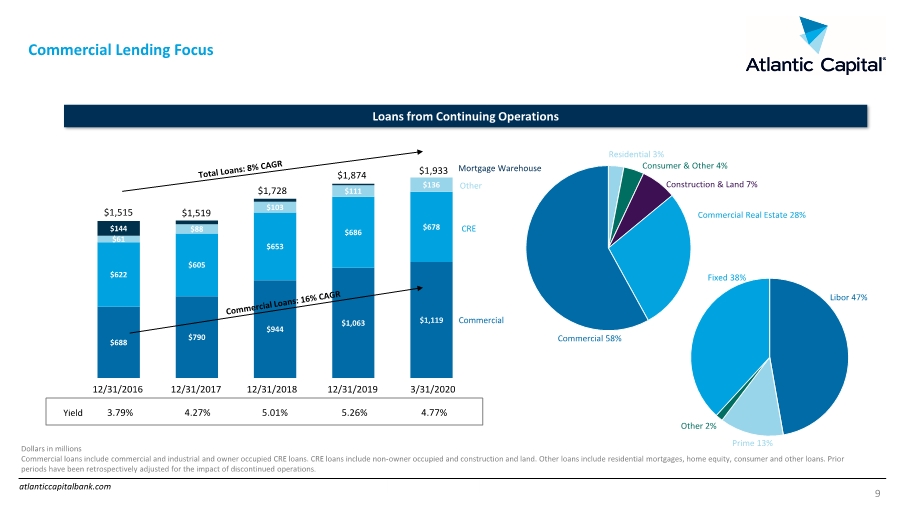
| atlanticcapitalbank.com Commercial Lending Focus 9 Loans from Continuing Operations Yield $688 $790 $944 $1,063 $1,119 $622 $605 $653 $686 $678 $61 $88 $103 $111 $136 $144 $1,933 $1,519 Residential 3% Construction & Land 7% Commercial Real Estate 28% Consumer & Other 4% Commercial CRE Other Mortgage Warehouse 3.79% 4.27% 5.01% 5.26% 4.77% $1,515 $1,728 Dollars in millions Commercial loans include commercial and industrial and owner occupied CRE loans. CRE loans include non-owner occupied and construction and land. Other loans include residential mortgages, home equity, consumer and other loans. Prior periods have been retrospectively adjusted for the impact of discontinued operations. $1,874 12/31/2016 12/31/2017 12/31/2018 12/31/2019 3/31/2020 Libor 47% Prime 13% Other 2% Fixed 38% Commercial 58% |
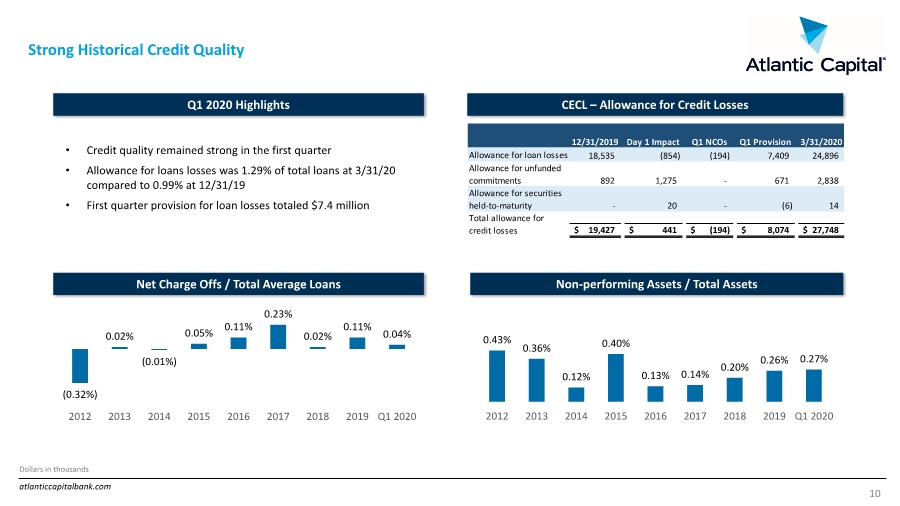
| atlanticcapitalbank.com Strong Historical Credit Quality Non-performing Assets / Total Assets Net Charge Offs / Total Average Loans (0.32%) 0.02% (0.01%) 0.05% 0.11% 0.23% 0.02% 0.11% 0.04% 2012 2013 2014 2015 2016 2017 2018 2019 Q1 2020 0.43% 0.36% 0.12% 0.40% 0.13% 0.14% 0.20% 0.26% 0.27% 2012 2013 2014 2015 2016 2017 2018 2019 Q1 2020 10 CECL – Allowance for Credit Losses • Credit quality remained strong in the first quarter • Allowance for loans losses was 1.29% of total loans at 3/31/20 compared to 0.99% at 12/31/19 • First quarter provision for loan losses totaled $7.4 million ALLL 1.29% ALLL 0.99% Dollars in thousands Q1 2020 Highlights 12/31/2019 Day 1 Impact Q1 NCOs Q1 Provision 3/31/2020 Allowance for loan losses 18,535 (854) (194) 7,409 24,896 Allowance for unfunded commitments 892 1,275 - 671 2,838 Allowance for securities held-to-maturity - 20 - (6) 14 Total allowance for credit losses $ 19,427 $ 441 $ (194) $ 8,074 $ 27,748 |
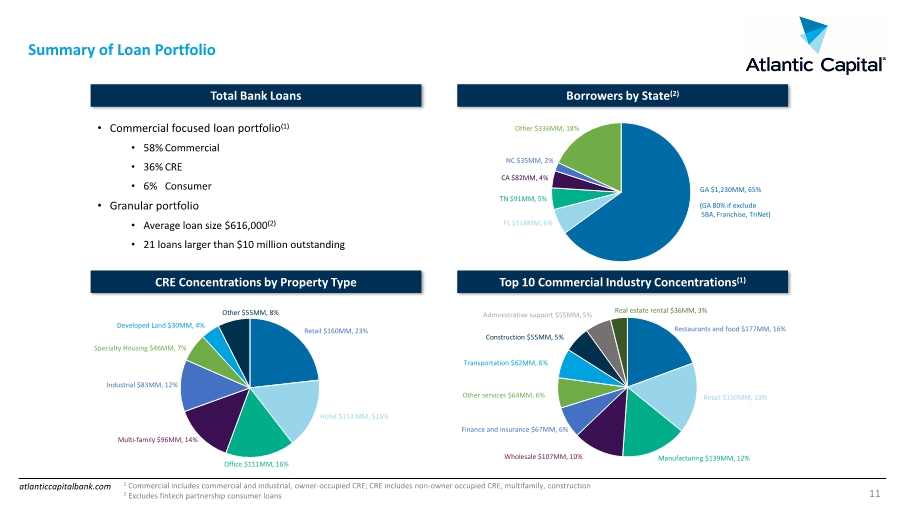
| atlanticcapitalbank.com Summary of Loan Portfolio Borrowers by State(2) Total Bank Loans Top 10 Commercial Industry Concentrations(1) CRE Concentrations by Property Type GA $1,230MM, 65% FL $118MM, 6% TN $91MM, 5% CA $82MM, 4% NC $35MM, 2% Other $336MM, 18% (GA 80% if exclude SBA, Franchise, TriNet) Retail $160MM, 23% Hotel $113 MM, $16% Office $111MM, 16% Multi-family $96MM, 14% Industrial $83MM, 12% Specialty Housing $46MM, 7% Developed Land $30MM, 4% Other $55MM, 8% Restaurants and food $177MM, 16% Retail $150MM, 13% Manufacturing $139MM, 12% Wholesale $107MM, 10% Finance and insurance $67MM, 6% Other services $64MM, 6% Transportation $62MM, 6% Construction $55MM, 5% Administrative support $55MM, 5% Real estate rental $36MM, 3% • Commercial focused loan portfolio(1) • 58% Commercial • 36% CRE • 6% Consumer • Granular portfolio • Average loan size $616,000(2) • 21 loans larger than $10 million outstanding 1 Commercial includes commercial and industrial, owner-occupied CRE; CRE includes non-owner occupied CRE, multifamily, construction 2 Excludes fintech partnership consumer loans 11 |
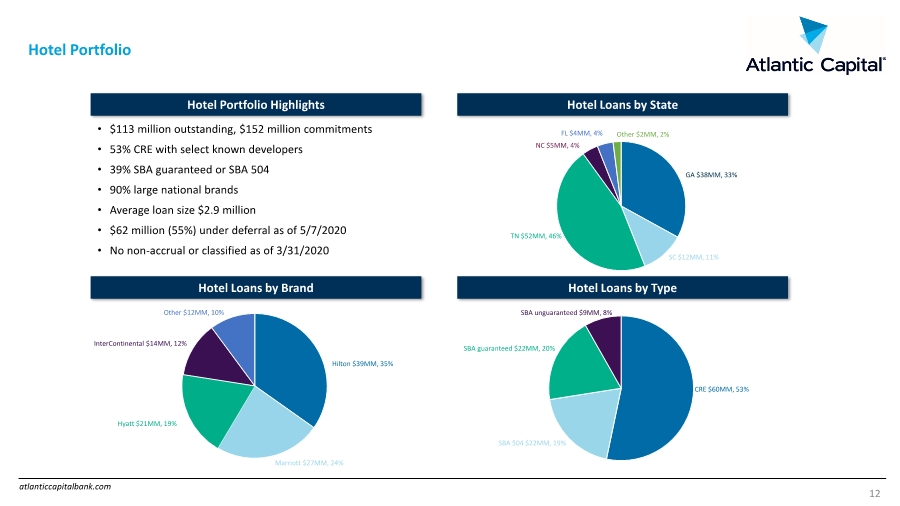
| atlanticcapitalbank.com Hotel Portfolio • $113 million outstanding, $152 million commitments • 53% CRE with select known developers • 39% SBA guaranteed or SBA 504 • 90% large national brands • Average loan size $2.9 million • $62 million (55%) under deferral as of 5/7/2020 • No non-accrual or classified as of 3/31/2020 Hotel Loans by State Hotel Portfolio Highlights Hotel Loans by Type Hotel Loans by Brand CRE $60MM, 53% SBA 504 $22MM, 19% SBA guaranteed $22MM, 20% SBA unguaranteed $9MM, 8% Hilton $39MM, 35% Marriott $27MM, 24% Hyatt $21MM, 19% InterContinental $14MM, 12% Other $12MM, 10% GA $38MM, 33% SC $12MM, 11% TN $52MM, 46% NC $5MM, 4% FL $4MM, 4% Other $2MM, 2% 12 |
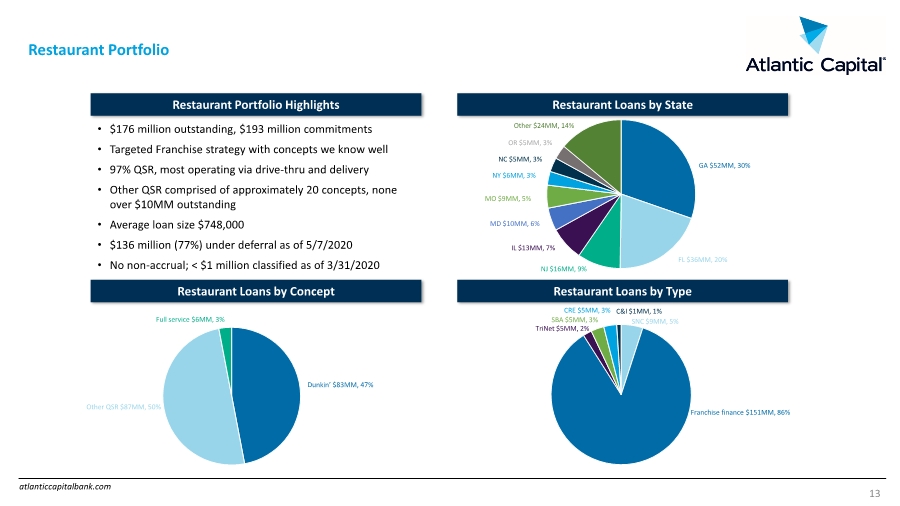
| atlanticcapitalbank.com Restaurant Portfolio Restaurant Loans by State Restaurant Portfolio Highlights Restaurant Loans by Concept Restaurant Loans by Type • $176 million outstanding, $193 million commitments • Targeted Franchise strategy with concepts we know well • 97% QSR, most operating via drive-thru and delivery • Other QSR comprised of approximately 20 concepts, none over $10MM outstanding • Average loan size $748,000 • $136 million (77%) under deferral as of 5/7/2020 • No non-accrual; < $1 million classified as of 3/31/2020 GA $52MM, 30% FL $36MM, 20% NJ $16MM, 9% IL $13MM, 7% MD $10MM, 6% MO $9MM, 5% NY $6MM, 3% NC $5MM, 3% OR $5MM, 3% Other $24MM, 14% Dunkin’ $83MM, 47% Other QSR $87MM, 50% Full service $6MM, 3% SNC $9MM, 5% Franchise finance $151MM, 86% C&I $1MM, 1% CRE $5MM, 3% SBA $5MM, 3% TriNet $5MM, 2% 13 |
| atlanticcapitalbank.com Retail Portfolio Retail Loans by State Retail Portfolio Highlights Retail Loans by Industry ($ in millions) GA $95MM, 33% *CA $68MM, 24% NC $17MM, 6% VA $15MM, 5% NY $12MM, 4% TN $11MM, 4% FL $11MM, 4% Other $60MM, 20% *All of the CA exposure is related to TriNet. • $289 million outstanding, $315 million commitments • 63% in industries deemed essential businesses by most states • 85% of TriNet is drug stores and dollar stores • Average loan size $1.2 million • $50 million (17%) under deferral as of 5/7/2020 • $200,000 non-accrual; $2.4 million classified as of 3/31/2020 Industry TriNet CRE SNC Franchise SBA C&I Total % of Retail Loans Pharmacies and Drug Stores $ 68 $ - $ - $ - $ - $ - $ 68 24% Gasoline Stations with C Stores - 34 10 - - - 44 15% Automotive Parts and Accessories Stores 4 - - 34 - - 38 13% All Other General Merchandise Stores 33 - - - - - 33 11% Lessors of Nonresidential Buildings (Retail CRE) - 30 - - - - 30 10% New Car Dealers - 16 - - - - 16 6% Optical Goods Stores - - 12 - - - 12 4% Sporting Goods Stores - - 9 - - - 9 3% Family Clothing Stores - - 8 - - - 8 3% Other 14 3 6 - 6 2 31 11% Total $ 119 $ 83 $ 45 $ 34 $ 6 $ 2 $ 289 % of Retail Loans 41% 29% 15% 12% 2% 1% 100% 14 |
| atlanticcapitalbank.com Shared National Credit Portfolio SNC Portfolio Highlights SNC Portfolio by Industry • $190 million outstanding, $264 million commitments • Average commitment $12 million • 17% highly leveraged transactions (outstandings) • No nonaccrual or classified as of 3/31/2020 Aluminum extruded product mfg. $17MM, 9% Air, rail and water transportation $18MM 10% Financial transaction processing $14MM, 7% Employee leasing services $12MM, 6% Optical goods stores $11MM, 6% Commercial printing $10MM, 5% Gas stations with C stores $10MM, 5% Ready-mix concrete manufacturing $10MM, 5% Electronic computer manufacturing $9MM, 5% Limited service restaurants $9MM, 5% Sporting goods stores $9MM, 5% Family clothing stores $7MM, 4% Paint/varnish supplies merchant wholesalers $7MM, 4% Continuing care retirement $12MM, 6% SNC Loans by State GA $65MM, 34% FL $35MM, 18% TN $21MM, 11% MO $18MM, 9% NC $14MM, 7% DE $14MM, 7% AZ $12MM, 6% TX $9MM, 5% AL $2MM, 1% Electronic shopping $6MM, 3% Wine and distilled alcoholic beverage wholesale $6MM, 3% Crushed and broken limestone mining and quarrying $6MM, 3% Other $17MM, 9% 15 |
| atlanticcapitalbank.com 28% 32% 33% 33% 32% 57% 57% 62% 62% 64% 15% 11% 5% 5% 4% 2016 2017 2018 2019 Q1 2020 Strong Core Deposit Franchise 16 Average Deposits from Continuing Operations Dollars in millions Deposit figures represent average balances. Prior periods have been retrospectively adjusted for the impact of discontinued operations. DDA Interest Bearing Brokered $1,540 $1,633 Deposit cost $1,419 $1,805 0.28% 0.38% 0.52% 0.77% 0.75% $2,255 |
| atlanticcapitalbank.com Balance Sheet Liquidity Average Loan / Deposit Ratio 86% 91% 91% 85% 83% Q1 2019 Q2 2019 Q3 2019 Q4 2019 Q1 2020 Non-Core Funding / Total Assets(1) 2% 11% 8% 3% 6% Q1 2019 Q2 2019 Q3 2019 Q4 2019 Q1 2020 • The bank is primarily funded by relationship driven core deposits • Liquidity position has improved since April 2019 branch sale • The bank has more than $1.1 billion in unused contingency funding excluding brokered CDs • 93% of marketable securities are unpledged 17 Prior periods have been retrospectively adjusted for the impact of discontinued operations. (1)For a reconciliation of this non-GAAP financial measure, see slides 30-31. |
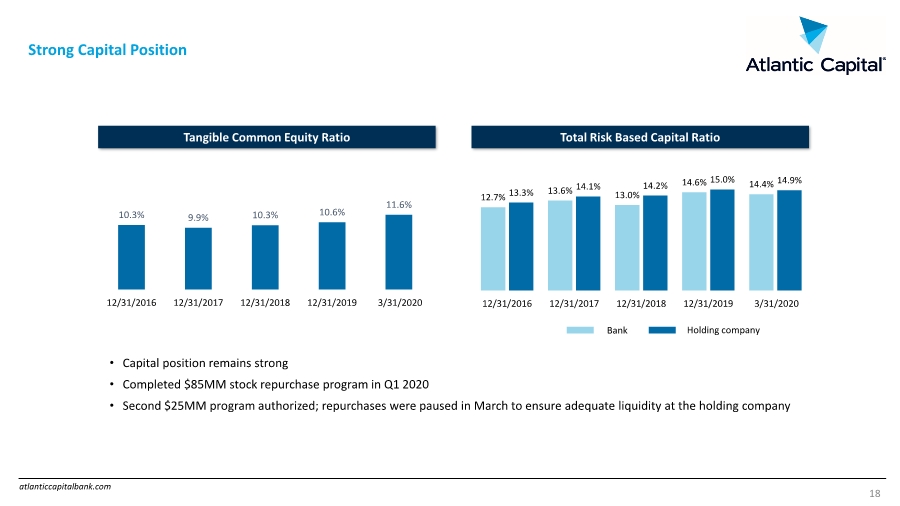
| atlanticcapitalbank.com Strong Capital Position 18 • Capital position remains strong • Completed $85MM stock repurchase program in Q1 2020 • Second $25MM program authorized; repurchases were paused in March to ensure adequate liquidity at the holding company 12.7% 13.6% 13.0% 14.6% 14.4% 13.3% 14.1% 14.2% 15.0% 14.9% 12/31/2016 12/31/2017 12/31/2018 12/31/2019 3/31/2020 10.3% 9.9% 10.3% 10.6% 11.6% 12/31/2016 12/31/2017 12/31/2018 12/31/2019 3/31/2020 Total Risk Based Capital Ratio Tangible Common Equity Ratio Bank Holding company |
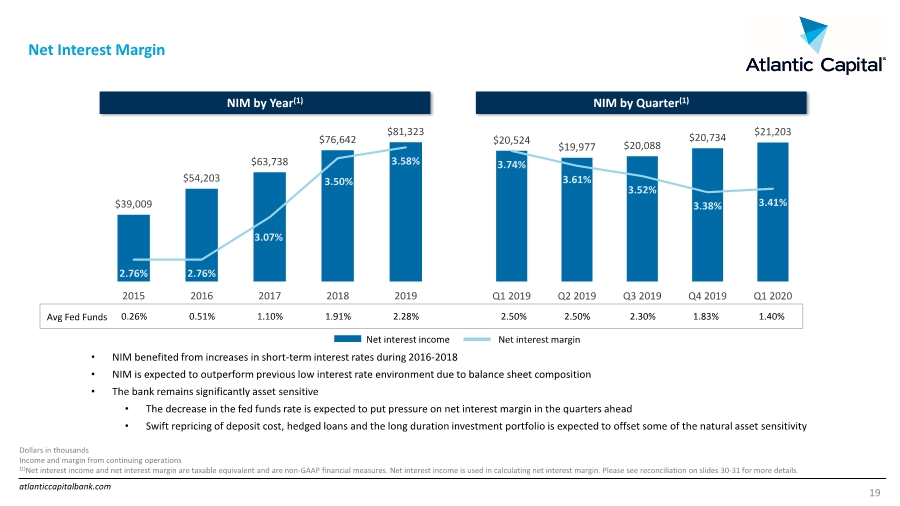
| atlanticcapitalbank.com $39,009 $54,203 $63,738 $76,642 $81,323 2.76% 2.76% 3.07% 3.50% 3.58% 2015 2016 2017 2018 2019 Net Interest Margin 19 $20,524 $19,977 $20,088 $20,734 $21,203 3.74% 3.61% 3.52% 3.38% 3.41% Q1 2019 Q2 2019 Q3 2019 Q4 2019 Q1 2020 Net interest income NIM by Year(1) NIM by Quarter(1) Net interest margin Dollars in thousands Income and margin from continuing operations (1)Net interest income and net interest margin are taxable equivalent and are non-GAAP financial measures. Net interest income is used in calculating net interest margin. Please see reconciliation on slides 30-31 for more details. 0.26% 0.51% 1.10% 1.91% 2.28% 2.50% 2.50% 2.30% 1.83% 1.40% Avg Fed Funds • NIM benefited from increases in short-term interest rates during 2016-2018 • NIM is expected to outperform previous low interest rate environment due to balance sheet composition • The bank remains significantly asset sensitive • The decrease in the fed funds rate is expected to put pressure on net interest margin in the quarters ahead • Swift repricing of deposit cost, hedged loans and the long duration investment portfolio is expected to offset some of the natural asset sensitivity |
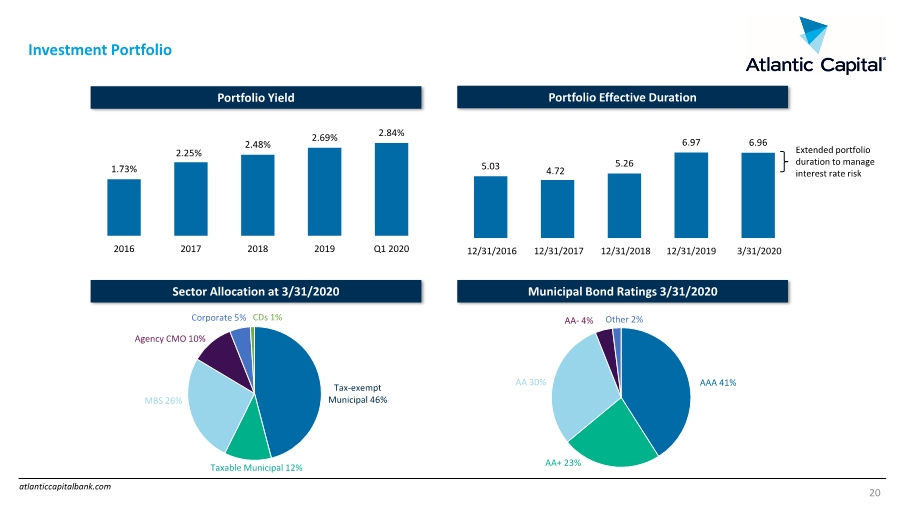
| atlanticcapitalbank.com Investment Portfolio Portfolio Yield Tax-exempt Municipal 46% Taxable Municipal 12% MBS 26% Agency CMO 10% Corporate 5% CDs 1% Sector Allocation at 3/31/2020 1.73% 2.25% 2.48% 2.69% 2.84% 2016 2017 2018 2019 Q1 2020 Municipal Bond Ratings 3/31/2020 AAA 41% AA+ 23% AA 30% AA- 4% Other 2% Portfolio Effective Duration 5.03 4.72 5.26 6.97 6.96 12/31/2016 12/31/2017 12/31/2018 12/31/2019 3/31/2020 Extended portfolio duration to manage interest rate risk 20 |
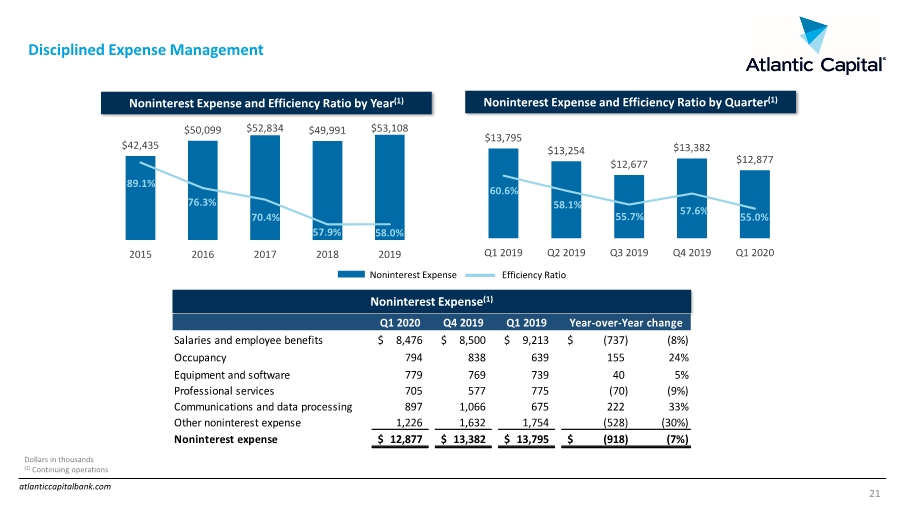
| atlanticcapitalbank.com Disciplined Expense Management 21 Dollars in thousands (1) Continuing operations Noninterest Expense and Efficiency Ratio by Year(1) Noninterest Expense(1) Q1 2020 Q4 2019 Q1 2019 Salaries and employee benefits 8,476 $ 8,500 $ 9,213 $ (737) $ (8%) Occupancy 794 838 639 155 24% Equipment and software 779 769 739 40 5% Professional services 705 577 775 (70) (9%) Communications and data processing 897 1,066 675 222 33% Other noninterest expense 1,226 1,632 1,754 (528) (30%) Noninterest expense 12,877 $ 13,382 $ 13,795 $ (918) $ (7%) Year-over-Year change $42,435 $50,099 $52,834 $49,991 $53,108 89.1% 76.3% 70.4% 57.9% 58.0% 2015 2016 2017 2018 2019 Noninterest Expense and Efficiency Ratio by Quarter(1) $13,795 $13,254 $12,677 $13,382 $12,877 60.6% 58.1% 55.7% 57.6% 55.0% Q1 2019 Q2 2019 Q3 2019 Q4 2019 Q1 2020 Noninterest Expense Efficiency Ratio |
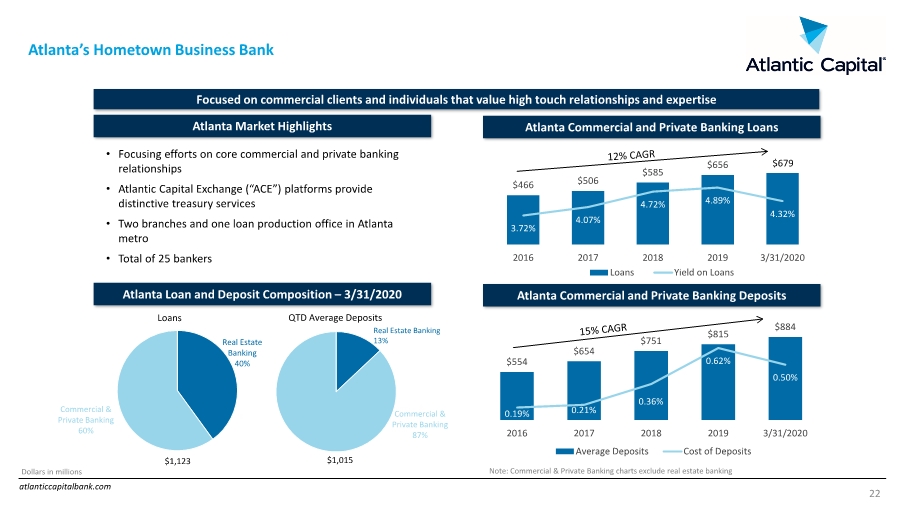
| atlanticcapitalbank.com Atlanta’s Hometown Business Bank 22 • Focusing efforts on core commercial and private banking relationships • Atlantic Capital Exchange (“ACE”) platforms provide distinctive treasury services • Two branches and one loan production office in Atlanta metro • Total of 25 bankers Atlanta Commercial and Private Banking Loans Atlanta Commercial and Private Banking Deposits Atlanta Market Highlights Atlanta Loan and Deposit Composition – 3/31/2020 Loans QTD Average Deposits Commercial & Private Banking 87% Commercial & Private Banking 58% Note: Commercial & Private Banking charts exclude real estate banking $466 $506 $585 $656 3.72% 4.07% 4.72% 4.89% 4.32% 2016 2017 2018 2019 3/31/2020 Loans Yield on Loans $554 $654 $751 $815 $884 0.19% 0.21% 0.36% 0.62% 0.50% 2016 2017 2018 2019 3/31/2020 Average Deposits Cost of Deposits Real Estate Banking 40% $1,123 $1,015 Commercial & Private Banking 87% Real Estate Banking 13% Commercial & Private Banking 60% Dollars in millions Focused on commercial clients and individuals that value high touch relationships and expertise $679 |
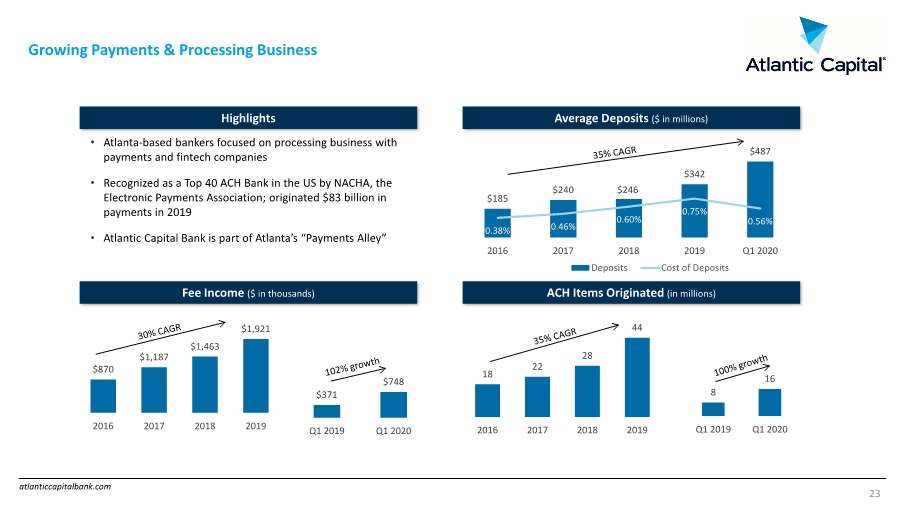
| atlanticcapitalbank.com 8 16 Q1 2019 Q1 2020 $371 $748 Q1 2019 Q1 2020 Growing Payments & Processing Business 23 $870 $1,187 $1,463 $1,921 2016 2017 2018 2019 • Atlanta-based bankers focused on processing business with payments and fintech companies • Recognized as a Top 40 ACH Bank in the US by NACHA, the Electronic Payments Association; originated $83 billion in payments in 2019 • Atlantic Capital Bank is part of Atlanta’s “Payments Alley” $185 $240 $246 $342 $487 0.38% 0.46% 0.60% 0.75% 0.56% 2016 2017 2018 2019 Q1 2020 Deposits Cost of Deposits Average Deposits ($ in millions) ACH Items Originated (in millions) Highlights Fee Income ($ in thousands) 18 22 28 44 2016 2017 2018 2019 |
| Appendix |

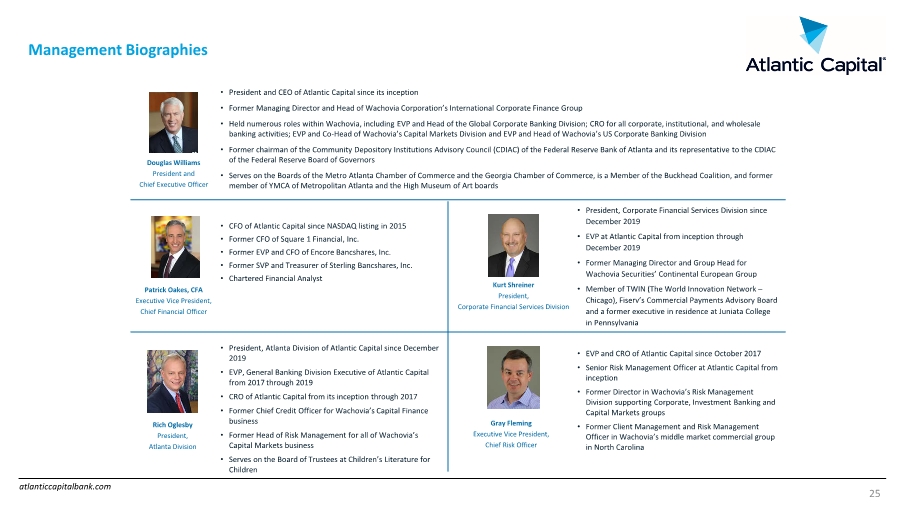
| atlanticcapitalbank.com Management Biographies 25 Douglas Williams President and Chief Executive Officer • President and CEO of Atlantic Capital since its inception • Former Managing Director and Head of Wachovia Corporation’s International Corporate Finance Group • Held numerous roles within Wachovia, including EVP and Head of the Global Corporate Banking Division; CRO for all corporate, institutional, and wholesale banking activities; EVP and Co-Head of Wachovia’s Capital Markets Division and EVP and Head of Wachovia’s US Corporate Banking Division • Former chairman of the Community Depository Institutions Advisory Council (CDIAC) of the Federal Reserve Bank of Atlanta and its representative to the CDIAC of the Federal Reserve Board of Governors • Serves on the Boards of the Metro Atlanta Chamber of Commerce and the Georgia Chamber of Commerce, is a Member of the Buckhead Coalition, and former member of YMCA of Metropolitan Atlanta and the High Museum of Art boards • President, Atlanta Division of Atlantic Capital since December 2019 • EVP, General Banking Division Executive of Atlantic Capital from 2017 through 2019 • CRO of Atlantic Capital from its inception through 2017 • Former Chief Credit Officer for Wachovia’s Capital Finance business • Former Head of Risk Management for all of Wachovia’s Capital Markets business • Serves on the Board of Trustees at Children’s Literature for Children • CFO of Atlantic Capital since NASDAQ listing in 2015 • Former CFO of Square 1 Financial, Inc. • Former EVP and CFO of Encore Bancshares, Inc. • Former SVP and Treasurer of Sterling Bancshares, Inc. • Chartered Financial Analyst • EVP and CRO of Atlantic Capital since October 2017 • Senior Risk Management Officer at Atlantic Capital from inception • Former Director in Wachovia’s Risk Management Division supporting Corporate, Investment Banking and Capital Markets groups • Former Client Management and Risk Management Officer in Wachovia’s middle market commercial group in North Carolina Gray Fleming Executive Vice President, Chief Risk Officer • President, Corporate Financial Services Division since December 2019 • EVP at Atlantic Capital from inception through December 2019 • Former Managing Director and Group Head for Wachovia Securities’ Continental European Group • Member of TWIN (The World Innovation Network – Chicago), Fiserv’s Commercial Payments Advisory Board and a former executive in residence at Juniata College in Pennsylvania Kurt Shreiner President, Corporate Financial Services Division Patrick Oakes, CFA Executive Vice President, Chief Financial Officer Rich Oglesby President, Atlanta Division |
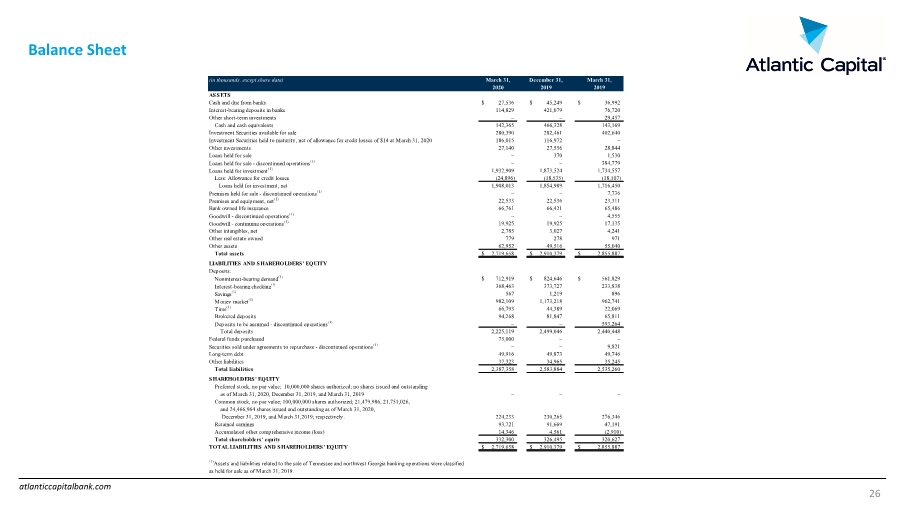
| atlanticcapitalbank.com Balance Sheet 26 (in thousands, except share data) March 31, December 31, March 31, 2020 2019 2019 ASSETS Cash and due from banks $ 27,536 $ 45,249 $ 36,992 Interest-bearing deposits in banks 114,829 421,079 76,720 Other short-term investments – – 29,457 Cash and cash equivalents 142,365 466,328 143,169 Investment Securities available for sale 280,390 282,461 402,640 Investment Securities held to maturity, net of allowance for credit losses of $14 at March 31, 2020 186,015 116,972 – Other investments 27,140 27,556 28,844 Loans held for sale – 370 1,530 Loans held for sale - discontinued operations(1) – – 384,779 Loans held for investment(1) 1,932,909 1,873,524 1,734,557 Less: Allowance for credit losses (24,896) (18,535) (18,107) Loans held for investment, net 1,908,013 1,854,989 1,716,450 Premises held for sale - discontinued operations(1) – – 7,736 Premises and equipment, net(1) 22,533 22,536 23,311 Bank owned life insurance 66,761 66,421 65,486 Goodwill - discontinued operations(1) – – 4,555 Goodwill - continuing operations(1) 19,925 19,925 17,135 Other intangibles, net 2,785 3,027 4,241 Other real estate owned 779 278 971 Other assets 62,952 49,516 55,040 Total assets $ 2,719,658 $ 2,910,379 $ 2,855,887 LIABILITIES AND S HAREHO LDERS ' EQ UITY Deposits: Noninterest-bearing demand(1) $ 712,919 $ 824,646 $ 561,829 Interest-bearing checking(1) 368,463 373,727 233,838 Savings(1) 567 1,219 896 Money market(1) 982,109 1,173,218 962,741 Time(1) 66,793 44,389 22,069 Brokered deposits 94,268 81,847 65,811 Deposits to be assumed - discontinued operations(1) – – 593,264 Total deposits 2,225,119 2,499,046 2,440,448 Federal funds purchased 75,000 – – Securities sold under agreements to repurchase - discontinued operations(1) – – 9,821 Long-term debt 49,916 49,873 49,746 Other liabilities 37,323 34,965 35,245 Total liabilities 2,387,358 2,583,884 2,535,260 S HAREHO LDERS ' EQ UITY Preferred stock, no par value; 10,000,000 shares authorized; no shares issued and outstanding as of March 31, 2020, December 31, 2019, and March 31, 2019 – – – Common stock, no par value; 100,000,000 shares authorized; 21,479,986, 21,751,026, and 24,466,964 shares issued and outstanding as of March 31, 2020, December 31, 2019, and March 31,2019; respectively. 224,233 230,265 276,346 Retained earnings 93,721 91,669 47,191 Accumulated other comprehensive income (loss) 14,346 4,561 (2,910) Total shareholders’ equity 332,300 326,495 320,627 TO TAL LIABILITIES AND S HAREHO LDERS ' EQ UITY $ 2,719,658 $ 2,910,379 $ 2,855,887 (1)Assets and liabilities related to the sale of Tennessee and northwest Georgia banking operations were classified as held for sale as of March 31, 2019. |
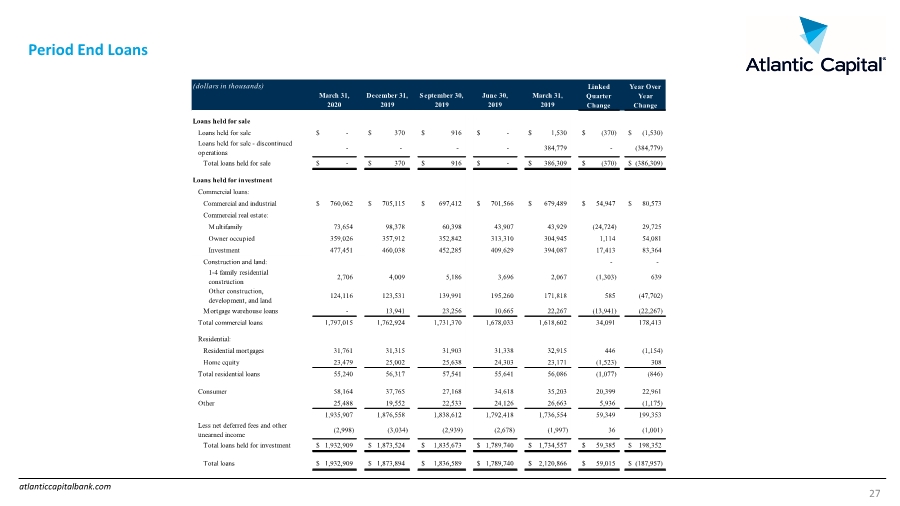
| atlanticcapitalbank.com Period End Loans 27 (dollars in thousands) March 31, 2020 December 31, 2019 September 30, 2019 June 30, 2019 March 31, 2019 Loans held for sale Loans held for sale $ - $ 370 $ 916 $ - $ 1,530 $ (370) $ (1,530) Loans held for sale - discontinued operations - - - - 384,779 - (384,779) Total loans held for sale $ - $ 370 $ 916 $ - $ 386,309 $ (370) $ (386,309) Loans held for investment Commercial loans: Commercial and industrial $ 760,062 $ 705,115 $ 697,412 $ 701,566 $ 679,489 $ 54,947 $ 80,573 Commercial real estate: M ultifamily 73,654 98,378 60,398 43,907 43,929 (24,724) 29,725 Owner occupied 359,026 357,912 352,842 313,310 304,945 1,114 54,081 Investment 477,451 460,038 452,285 409,629 394,087 17,413 83,364 Construction and land: - - 1-4 family residential construction 2,706 4,009 5,186 3,696 2,067 (1,303) 639 Other construction, development, and land 124,116 123,531 139,991 195,260 171,818 585 (47,702) Mortgage warehouse loans - 13,941 23,256 10,665 22,267 (13,941) (22,267) Total commercial loans 1,797,015 1,762,924 1,731,370 1,678,033 1,618,602 34,091 178,413 Residential: Residential mortgages 31,761 31,315 31,903 31,338 32,915 446 (1,154) Home equity 23,479 25,002 25,638 24,303 23,171 (1,523) 308 Total residential loans 55,240 56,317 57,541 55,641 56,086 (1,077) (846) Consumer 58,164 37,765 27,168 34,618 35,203 20,399 22,961 Other 25,488 19,552 22,533 24,126 26,663 5,936 (1,175) 1,935,907 1,876,558 1,838,612 1,792,418 1,736,554 59,349 199,353 Less net deferred fees and other unearned income (2,998) (3,034) (2,939) (2,678) (1,997) 36 (1,001) Total loans held for investment $ 1,932,909 $ 1,873,524 $ 1,835,673 $ 1,789,740 $ 1,734,557 $ 59,385 $ 198,352 Total loans $ 1,932,909 $ 1,873,894 $ 1,836,589 $ 1,789,740 $ 2,120,866 $ 59,015 $ (187,957) Linked Quarter Change Year Over Year Change |
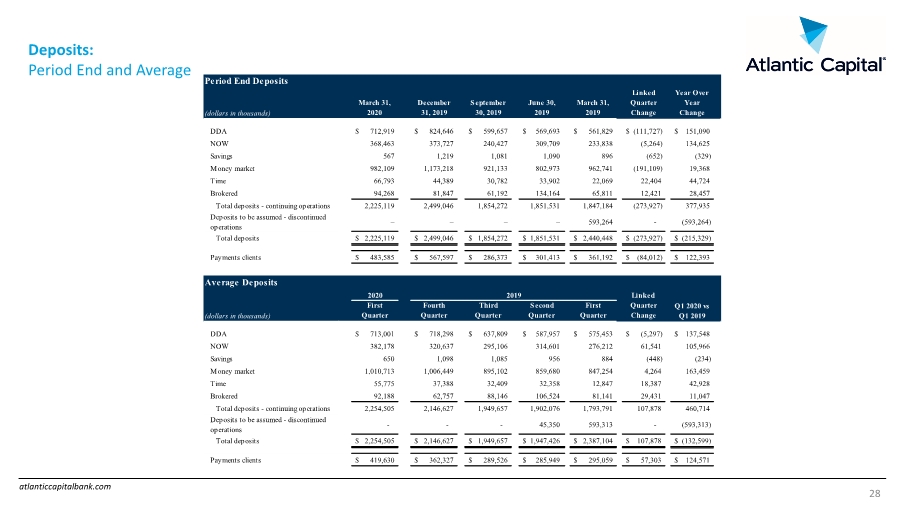
| atlanticcapitalbank.com Deposits: Period End and Average 28 Period End Deposits (dollars in thousands) March 31, 2020 December 31, 2019 September 30, 2019 June 30, 2019 March 31, 2019 Linked Quarter Change Year Over Year Change DDA $ 712,919 $ 824,646 $ 599,657 $ 569,693 $ 561,829 $ (111,727) $ 151,090 NOW 368,463 373,727 240,427 309,709 233,838 (5,264) 134,625 Savings 567 1,219 1,081 1,090 896 (652) (329) Money market 982,109 1,173,218 921,133 802,973 962,741 (191,109) 19,368 Time 66,793 44,389 30,782 33,902 22,069 22,404 44,724 Brokered 94,268 81,847 61,192 134,164 65,811 12,421 28,457 Total deposits - continuing operations 2,225,119 2,499,046 1,854,272 1,851,531 1,847,184 (273,927) 377,935 Deposits to be assumed - discontinued operations – – – – 593,264 - (593,264) Total deposits $ 2,225,119 $ 2,499,046 $ 1,854,272 $ 1,851,531 $ 2,440,448 $ (273,927) $ (215,329) Payments clients $ 483,585 $ 567,597 $ 286,373 $ 301,413 $ 361,192 $ (84,012) $ 122,393 Average Deposits 2020 Linked (dollars in thousands) First Quarter Fourth Quarter Third Quarter S econd Quarter First Quarter Quarter Change DDA $ 713,001 $ 718,298 $ 637,809 $ 587,957 $ 575,453 $ (5,297) $ 137,548 NOW 382,178 320,637 295,106 314,601 276,212 61,541 105,966 Savings 650 1,098 1,085 956 884 (448) (234) Money market 1,010,713 1,006,449 895,102 859,680 847,254 4,264 163,459 Time 55,775 37,388 32,409 32,358 12,847 18,387 42,928 Brokered 92,188 62,757 88,146 106,524 81,141 29,431 11,047 Total deposits - continuing operations 2,254,505 2,146,627 1,949,657 1,902,076 1,793,791 107,878 460,714 Deposits to be assumed - discontinued operations - - - 45,350 593,313 - (593,313) Total deposits $ 2,254,505 $ 2,146,627 $ 1,949,657 $ 1,947,426 $ 2,387,104 $ 107,878 $ (132,599) Payments clients $ 419,630 $ 362,327 $ 289,526 $ 285,949 $ 295,059 $ 57,303 $ 124,571 2019 Q1 2020 vs Q1 2019 |
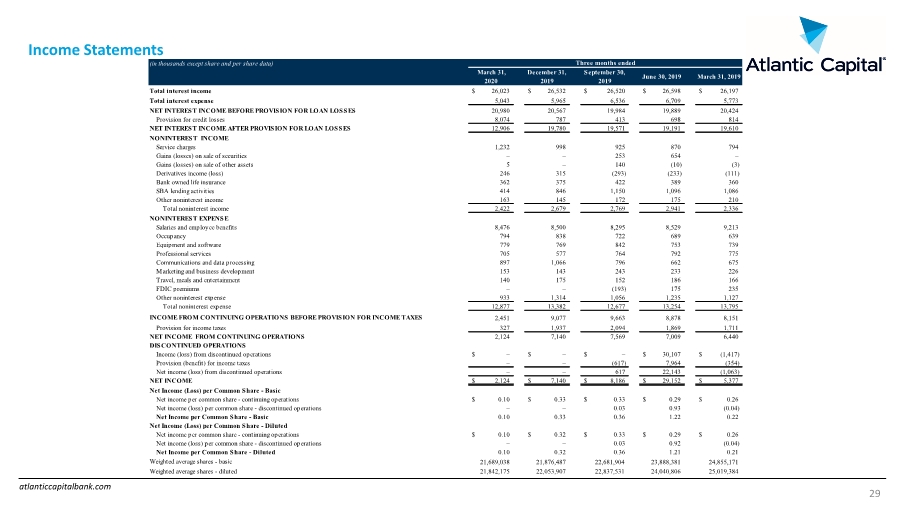
| atlanticcapitalbank.com Income Statements 29 (in thousands except share and per share data) March 31, 2020 December 31, 2019 September 30, 2019 June 30, 2019 March 31, 2019 Total interest income $ 26,023 $ 26,532 $ 26,520 $ 26,598 $ 26,197 Total interest expense 5,043 5,965 6,536 6,709 5,773 NET INTERES T INCO ME BEFO RE PRO VIS IO N FO R LO AN LO S S ES 20,980 20,567 19,984 19,889 20,424 Provision for credit losses 8,074 787 413 698 814 NET INTERES T INCO ME AFTER PRO VIS IO N FO R LO AN LO S S ES 12,906 19,780 19,571 19,191 19,610 NONINTEREST INCOME Service charges 1,232 998 925 870 794 Gains (losses) on sale of securities – – 253 654 – Gains (losses) on sale of other assets 5 – 140 (10) (3) Derivatives income (loss) 246 315 (293) (233) (111) Bank owned life insurance 362 375 422 389 360 SBA lending activities 414 846 1,150 1,096 1,086 Other noninterest income 163 145 172 175 210 Total noninterest income 2,422 2,679 2,769 2,941 2,336 NO NINTERES T EXPENS E Salaries and employee benefits 8,476 8,500 8,295 8,529 9,213 Occupancy 794 838 722 689 639 Equipment and software 779 769 842 753 739 Professional services 705 577 764 792 775 Communications and data processing 897 1,066 796 662 675 Marketing and business development 153 143 243 233 226 Travel, meals and entertainment 140 175 152 186 166 FDIC premiums – – (193) 175 235 Other noninterest expense 933 1,314 1,056 1,235 1,127 Total noninterest expense 12,877 13,382 12,677 13,254 13,795 INCOME FROM CONTINUING OPERATIONS BEFORE PROVIS ION FOR INCOME TAXES 2,451 9,077 9,663 8,878 8,151 Provision for income taxes 327 1,937 2,094 1,869 1,711 NET INCOME FROM CONTINUING OPERATIONS 2,124 7,140 7,569 7,009 6,440 DISCONTINUED OPERATIONS Income (loss) from discontinued operations $ – $ – $ – $ 30,107 $ (1,417) Provision (benefit) for income taxes – – (617) 7,964 (354) Net income (loss) from discontinued operations – – 617 22,143 (1,063) NET INCOME $ 2,124 $ 7,140 $ 8,186 $ 29,152 $ 5,377 Net Income (Loss) per Common Share ‑ Basic Net income per common share - continuing operations $ 0.10 $ 0.33 $ 0.33 $ 0.29 $ 0.26 Net income (loss) per common share - discontinued operations – – 0.03 0.93 (0.04) Net Income per Common Share ‑ Basic 0.10 0.33 0.36 1.22 0.22 Net Income (Loss) per Common Share ‑ Diluted Net income per common share - continuing operations $ 0.10 $ 0.32 $ 0.33 $ 0.29 $ 0.26 Net income (loss) per common share - discontinued operations – – 0.03 0.92 (0.04) Net Income per Common Share ‑ Diluted 0.10 0.32 0.36 1.21 0.21 Weighted average shares - basic 21,689,038 21,876,487 22,681,904 23,888,381 24,855,171 Weighted average shares - diluted 21,842,175 22,053,907 22,837,531 24,040,806 25,019,384 Three months ended |
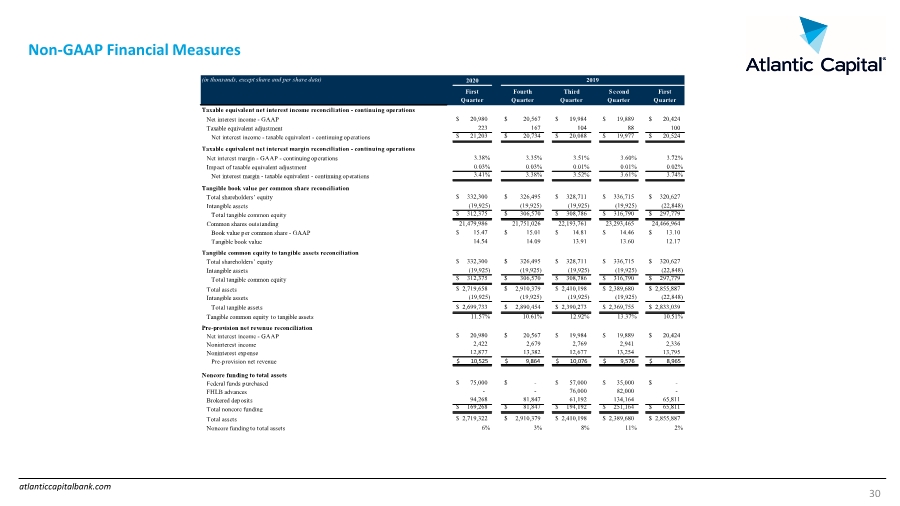
| atlanticcapitalbank.com Non-GAAP Financial Measures 30 (in thousands, except share and per share data) 2020 First Quarter Fourth Quarter Third Quarter S econd Quarter First Quarter Taxable equivalent net interest income reconciliation - continuing operations Net interest income - GAAP $ 20,980 $ 20,567 $ 19,984 $ 19,889 $ 20,424 Taxable equivalent adjustment 223 167 104 88 100 Net interest income - taxable equivalent - continuing operations $ 21,203 $ 20,734 $ 20,088 $ 19,977 $ 20,524 Taxable equivalent net interest margin reconciliation - continuing operations Net interest margin - GAAP - continuing operations 3.38% 3.35% 3.51% 3.60% 3.72% Impact of taxable equivalent adjustment 0.03% 0.03% 0.01% 0.01% 0.02% Net interest margin - taxable equivalent - continuing operations 3.41% 3.38% 3.52% 3.61% 3.74% Tangible book value per common share reconciliation Total shareholders’ equity $ 332,300 $ 326,495 $ 328,711 $ 336,715 $ 320,627 Intangible assets (19,925) (19,925) (19,925) (19,925) (22,848) Total tangible common equity $ 312,375 $ 306,570 $ 308,786 $ 316,790 $ 297,779 Common shares outstanding 21,479,986 21,751,026 22,193,761 23,293,465 24,466,964 Book value per common share - GAAP $ 15.47 $ 15.01 $ 14.81 $ 14.46 $ 13.10 Tangible book value 14.54 14.09 13.91 13.60 12.17 Tangible common equity to tangible assets reconciliation Total shareholders’ equity $ 332,300 $ 326,495 $ 328,711 $ 336,715 $ 320,627 Intangible assets (19,925) (19,925) (19,925) (19,925) (22,848) Total tangible common equity $ 312,375 $ 306,570 $ 308,786 $ 316,790 $ 297,779 Total assets $ 2,719,658 $ 2,910,379 $ 2,410,198 $ 2,389,680 $ 2,855,887 Intangible assets (19,925) (19,925) (19,925) (19,925) (22,848) Total tangible assets $ 2,699,733 $ 2,890,454 $ 2,390,273 $ 2,369,755 $ 2,833,039 Tangible common equity to tangible assets 11.57% 10.61% 12.92% 13.37% 10.51% Pre-provision net revenue reconciliation Net interest income - GAAP $ 20,980 $ 20,567 $ 19,984 $ 19,889 $ 20,424 Noninterest income 2,422 2,679 2,769 2,941 2,336 Noninterest expense 12,877 13,382 12,677 13,254 13,795 Pre-provision net revenue 10,525 $ 9,864 $ 10,076 $ 9,576 $ 8,965 $ Noncore funding to total assets Federal funds purchased $ 75,000 $ - $ 57,000 $ 35,000 $ - FHLB advances - - 76,000 82,000 - Brokered deposits 94,268 81,847 61,192 134,164 65,811 Total noncore funding $ 169,268 $ 81,847 $ 194,192 $ 251,164 $ 65,811 Total assets $ 2,719,322 $ 2,910,379 $ 2,410,198 $ 2,389,680 $ 2,855,887 Noncore funding to total assets 6% 3% 8% 11% 2% 2019 |
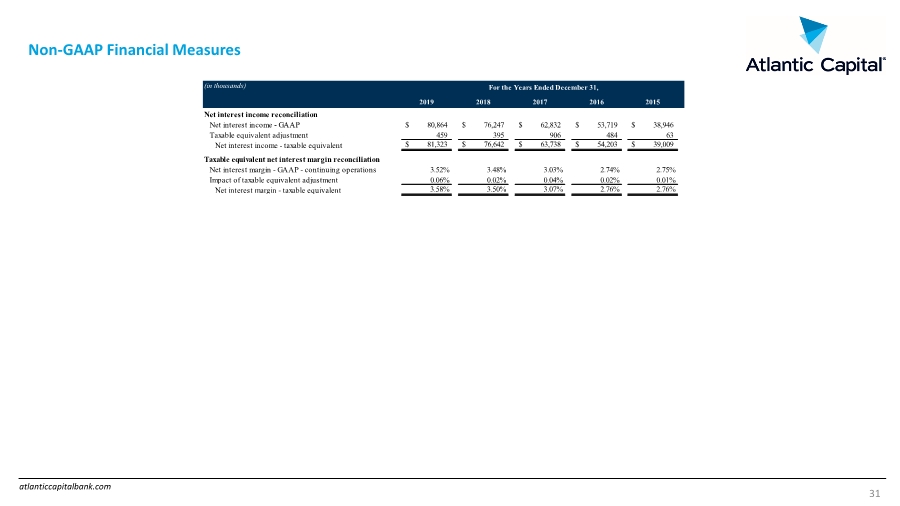
| atlanticcapitalbank.com Non-GAAP Financial Measures 31 (in thousands) 2019 2018 2017 2016 2015 Net interest income reconciliation Net interest income - GAAP $ 80,864 $ 76,247 $ 62,832 $ 53,719 $ 38,946 Taxable equivalent adjustment 459 395 906 484 63 Net interest income - taxable equivalent $ 81,323 $ 76,642 $ 63,738 $ 54,203 $ 39,009 Taxable equivalent net interest margin reconciliation Net interest margin - GAAP - continuing operations 3.52% 3.48% 3.03% 2.74% 2.75% Impact of taxable equivalent adjustment 0.06% 0.02% 0.04% 0.02% 0.01% Net interest margin - taxable equivalent 3.58% 3.50% 3.07% 2.76% 2.76% For the Years Ended December 31, |
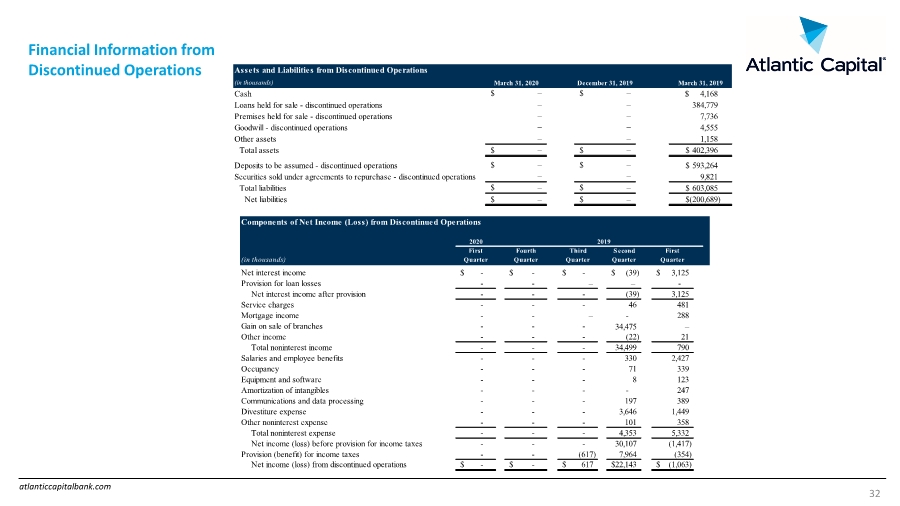
| atlanticcapitalbank.com Financial Information from Discontinued Operations 32 Assets and Liabilities from Discontinued Operations (in thousands) Cash 4,168 $ Loans held for sale - discontinued operations 384,779 Premises held for sale - discontinued operations 7,736 Goodwill - discontinued operations 4,555 Other assets 1,158 Total assets 402,396 $ Deposits to be assumed - discontinued operations 593,264 $ Securities sold under agreements to repurchase - discontinued operations 9,821 Total liabilities 603,085 $ Net liabilities (200,689) $ – – $ – $ – – $ – – $ – $ March 31, 2020 – $ – March 31, 2019 – $ – $ – – December 31, 2019 – – – – $ – $ – Components of Net Income (Loss) from Discontinued Operations 2020 (in thousands) First Quarter Fourth Quarter Third Quarter S econd Quarter First Quarter Net interest income - $ - $ - $ (39) $ 3,125 $ Provision for loan losses - - – – - Net interest income after provision - - - (39) 3,125 Service charges - - - 46 481 Mortgage income - - – - 288 Gain on sale of branches - - - 34,475 – Other income - - - (22) 21 Total noninterest income - - - 34,499 790 Salaries and employee benefits - - - 330 2,427 Occupancy - - - 71 339 Equipment and software - - - 8 123 Amortization of intangibles - - - - 247 Communications and data processing - - - 197 389 Divestiture expense - - - 3,646 1,449 Other noninterest expense - - - 101 358 Total noninterest expense - - - 4,353 5,332 Net income (loss) before provision for income taxes - - - 30,107 (1,417) Provision (benefit) for income taxes - - (617) 7,964 (354) Net income (loss) from discontinued operations - $ - $ 617 $ 22,143 $ (1,063) $ 2019 |
| Thank You |