Attached files
| file | filename |
|---|---|
| EX-23.1 - EX-23.1 - SelectQuote, Inc. | d838810dex231.htm |
| EX-5.1 - EX-5.1 - SelectQuote, Inc. | d838810dex51.htm |
| EX-4.5 - EX-4.5 - SelectQuote, Inc. | d838810dex45.htm |
| EX-4.4 - EX-4.4 - SelectQuote, Inc. | d838810dex44.htm |
| EX-4.1 - EX-4.1 - SelectQuote, Inc. | d838810dex41.htm |
Table of Contents
As filed with the Securities and Exchange Commission on May 15, 2020.
Registration No. 333-236555
UNITED STATES
SECURITIES AND EXCHANGE COMMISSION
Washington, D.C. 20549
Amendment No. 3
to
FORM S-1
REGISTRATION STATEMENT
UNDER
THE SECURITIES ACT OF 1933
SelectQuote, Inc.
(Exact name of registrant as specified in its charter)
| Delaware | 6411 | 94-3339273 | ||
| (State or other jurisdiction of incorporation or organization) |
(Primary Standard Industrial Classification Code Number) |
(I.R.S. Employer Identification No.) |
6800 West 115th Street, Suite 2511
Overland Park, Kansas 66211
(913)-599-9225
(Address, including zip code, and telephone number, including area code, of registrant’s principal executive offices)
Tim Danker
Chief Executive Officer
SelectQuote, Inc.
6800 West 115th Street, Suite 2511
Overland Park, Kansas 66211
(913)-599-9225
(Name, address, including zip code, and telephone number, including area code, of agent for service)
Copies to:
| Mark F. Veblen, Esq. Wachtell, Lipton, Rosen & Katz 51 West 52nd Street New York, New York 10019 Telephone: (212) 403-1000 Telecopy: (212) 403-2000 |
Daniel A. Boulware, Esq. SelectQuote, Inc. 6800 West 115th Street, Suite 2511 Overland Park, Kansas 66211 Telephone: (913)-599-9225 Telecopy: (913)-495-5493 |
Jonathan L. Freedman, Esq. Samir A. Gandhi, Esq. Sidley Austin LLP 787 Seventh Avenue New York, New York 10019 Telephone: (212) 839-5300 Telecopy: (212) 839-5599 |
Approximate date of commencement of proposed sale to the public: As soon as practicable after this Registration Statement is declared effective.
If any of the securities being registered on this form are to be offered on a delayed or continuous basis pursuant to Rule 415 under the Securities Act of 1933, check the following box. ☐
If this form is filed to register additional securities for an offering pursuant to Rule 462(b) under the Securities Act, check the following box and list the Securities Act registration statement number of the earlier effective registration statement for the same offering. ☐
If this form is a post-effective amendment filed pursuant to Rule 462(c) under the Securities Act, check the following box and list the Securities Act registration statement number of the earlier effective registration statement for the same offering. ☐
If this form is a post-effective amendment filed pursuant to Rule 462(d) under the Securities Act, check the following box and list the Securities Act registration statement number of the earlier effective registration statement for the same offering. ☐
Indicate by check mark whether the registrant is a large accelerated filer, an accelerated filer, a non-accelerated filer, smaller reporting company, or an emerging growth company. See the definitions of “large accelerated filer,” “accelerated filer,” “smaller reporting company” and “emerging growth company” in Rule 12b-2 of the Exchange Act.
| Large accelerated filer | ☐ | Accelerated filer | ☐ | |||
| Non-accelerated filer | ☒ | Smaller reporting company | ☐ | |||
| Emerging growth company | ☒ | |||||
If an emerging growth company, indicate by check mark if the registrant has elected not to use the extended transition period for complying with any new or revised financial accounting standards provided pursuant to Section 7(a)(2)(B) of the Securities Act. ☐
CALCULATION OF REGISTRATION FEE
|
| ||||||||
| Title of Each Class of Securities to be Registered |
Amount to be Registered(1) |
Proposed Per Share(2) |
Proposed Maximum Aggregate Offering Price(1)(2) |
Amount of Registration Fee(3) | ||||
| Common Stock, par value $0.01 per share |
28,750,000 | $ 19.00 | $ 546,250,000 | $ 70,903.25 | ||||
|
| ||||||||
|
| ||||||||
| (1) | Includes the aggregate amount of additional shares the underwriters have the option to purchase. |
| (2) | Estimated solely for the purpose of calculating the registration fee pursuant to Rule 457(a) of the Securities Act of 1933, as amended. |
| (3) | The registrant previously paid $12,980 in connection with the filling of the Registration Statement. |
The registrant hereby amends this Registration Statement on such date or dates as may be necessary to delay its effective date until the registrant shall file a further amendment which specifically states that this Registration Statement shall thereafter become effective in accordance with Section 8(a) of the Securities Act of 1933 or until the Registration Statement shall become effective on such date as the Securities and Exchange Commission, acting pursuant to said Section 8(a), may determine.
Table of Contents
The information in this preliminary prospectus is not complete and may be changed. We may not sell these securities until the registration statement filed with the Securities and Exchange Commission is effective. This preliminary prospectus is not an offer to sell nor does it seek an offer to buy these securities in any state where the offer or sale is not permitted.
Subject to Completion, dated May 15, 2020
Preliminary Prospectus
25,000,000 shares

Common Stock
This is an initial public offering of common stock by SelectQuote, Inc. We are offering 18,000,000 shares of our common stock to be sold in the offering. The selling stockholders identified in this prospectus are offering an additional 7,000,000 shares of our common stock. SelectQuote will not receive any of the proceeds from the sale of the shares being sold by the selling stockholders.
Prior to this offering, there has been no public market for our common stock. We currently anticipate that the initial public offering price per share of our common stock will be between $17 and $19 per share.
We intend to apply to list our common stock on the New York Stock Exchange (the “NYSE”) under the symbol “SLQT.”
We are an “emerging growth company,” as that term is used in the Jumpstart Our Business Startups Act of 2012 (the “JOBS Act”) and, under applicable Securities and Exchange Commission (“SEC”) rules, we have elected to take advantage of certain reduced public company reporting requirements for this prospectus and future filings.
| Per Share | Total | |||||||
| Initial public offering price |
$ | $ | ||||||
| Underwriting discounts and commissions(1) |
$ | $ | ||||||
| Proceeds to SelectQuote, before expenses |
$ | $ | ||||||
| Proceeds to selling stockholders, before expenses |
$ | $ | ||||||
| (1) | See “Underwriting (Conflicts of Interest)” for additional information regarding the underwriting discount and certain expenses payable to the underwriters by us. |
The selling stockholders have granted the underwriters an option for a period of 30 days to purchase up to an additional 3,750,000 shares of our common stock.
At our request, the underwriters have reserved up to 1,250,000 shares of common stock, or up to 5% of the shares of common stock offered by this prospectus for sale by the Company, at the initial public offering price, to certain individuals associated with us. See “Underwriting (Conflicts of Interest)—Directed Share Program.”
Investing in our common stock involves risks. See “Risk Factors” beginning on page 22.
Neither the Securities and Exchange Commission nor any state securities commission or other regulatory body has approved or disapproved of these securities or determined if this prospectus is truthful or complete. Any representation to the contrary is a criminal offense.
The underwriters expect to deliver the shares on or about , 2020.
Joint Bookrunners
| Credit Suisse | Morgan Stanley | |
| Evercore ISI | RBC Capital Markets |
| Barclays | Citigroup | Jefferies | ||
Co-Managers
| Cantor | Keefe Bruyette & Woods A Stifel Company |
Piper Sandler | Drexel Hamilton |
, 2020
Table of Contents

-i-
Table of Contents

-ii-
Table of Contents

-iii-
Table of Contents
| 1 | ||||
| 17 | ||||
| Summary Historical Consolidated Financial and Operating Data |
20 | |||
| 22 | ||||
| 49 | ||||
| 51 | ||||
| 52 | ||||
| 53 | ||||
| 55 | ||||
| Selected Historical Consolidated Financial and Operating Data |
57 | |||
| Management’s Discussion and Analysis of Financial Condition and Results of Operations |
62 | |||
| 95 | ||||
| 110 | ||||
| 116 | ||||
| 128 | ||||
| 132 | ||||
| 137 | ||||
| 139 | ||||
| 145 | ||||
| Material U.S. Federal Income Tax Considerations for Non-U.S. Holders of Common Stock |
148 | |||
| 151 | ||||
| 160 | ||||
| 160 | ||||
| 160 | ||||
| F-1 |
-i-
Table of Contents
About this Prospectus
As used in this prospectus, unless the context otherwise indicates, any reference to “SelectQuote,” “our Company,” the “Company,” “we,” “us” and “our” refers to SelectQuote, Inc., the issuer of the shares offered hereby, together with its consolidated subsidiaries.
You should rely only on the information contained in this prospectus and any free writing prospectus prepared by or on behalf of us or to which we have referred you. No dealer, salesperson or other person is authorized to give any information or to represent anything not contained in this prospectus or in any free writing prospectus that we file with the Securities and Exchange Commission. We have not, and the underwriters have not, authorized anyone to provide you with different or additional information. We and the underwriters take no responsibility for, and can provide no assurance as to the reliability of, any other information that others may give you. You must not rely on any unauthorized information or representations. This prospectus is an offer to sell only the shares offered hereby, but only under circumstances and in jurisdictions where it is lawful to do so. The information contained in this prospectus is current only as of its date regardless of the time of delivery of this prospectus or of any sale of our common stock. Our business, financial condition, results of operations and prospects may have changed since that date.
For investors outside of the United States: Neither we, the selling stockholders nor the underwriters have done anything that would permit our initial public offering or possession or distribution of this prospectus in any jurisdiction where action for that purpose is required, other than in the United States. Persons outside of the United States who come into possession of this prospectus must inform themselves about, and observe any restrictions relating to, the offering of the shares of our common stock and the distribution of this prospectus outside of the United States.
Neither this prospectus nor any related free writing prospectus is a prospectus for the purposes of Regulation (EU) 2017/1129 (the “Prospectus Regulation”). This prospectus and any related free writing prospectus and any offer if made subsequently is directed only at persons in Member States of the European Economic Area (the “EEA”) who are “qualified investors” within the meaning of Article 2(e) of the Prospectus Regulation. This prospectus and any related free writing prospectus has been prepared on the basis that any offer of shares of our common stock in any Member State of the EEA will be made pursuant to an exemption under the Prospectus Regulation from the requirement to publish a prospectus for offers of the shares of our common stock. Accordingly any person making or intending to make an offer in that Member State of shares of our common stock which are the subject of the offering contemplated by this prospectus and any related free writing prospectus may only do so in circumstances in which no obligation arises for us or any of the underwriters to publish a prospectus pursuant to Article 3 of the Prospectus Regulation in relation to such offer. Neither we nor the underwriters have authorized, nor do we or they authorize, the making of any offer of shares of our common stock in circumstances in which an obligation arises for us or the underwriters to publish a prospectus for such offer.
This prospectus and any related free writing prospectus may not be distributed or circulated to any person in the United Kingdom other than to (i) persons who have professional experience in matters relating to investments falling within Article 19(5) of the Financial Services and Markets Act 2000 (Financial Promotion) Order 2005, as amended (the “Order”); and (ii) high net worth entities falling within Article 49(2)(a) to (d) of the Order (all such persons together being referred to as “relevant persons”). This prospectus and any related free writing prospectus is directed only at relevant persons. Other persons should not act on this prospectus and any related free writing prospectus or any of their contents. This prospectus and any related free writing prospectus is confidential and is being supplied to you solely for your information and may not be reproduced, redistributed or passed on to any other person or published, in whole or in part, for any other purpose.
-ii-
Table of Contents
Upon the closing of this offering, each outstanding share of our Series A, B, C and D preferred stock will automatically convert into eight shares of common stock and each outstanding share of our Series E preferred stock will automatically convert into shares of common stock at a fixed discount to the initial offering price. References in this prospectus to the number of shares of our common stock outstanding after this offering are based on 144,650,597 shares of our common stock issued and outstanding as of the date of this prospectus (assuming the automatic conversion of all outstanding shares of our Series A, B, C, D and E preferred stock into an aggregate of 52,404,685 shares of common stock upon completion of this offering, and assuming, for purposes of the conversion of the Series E preferred stock, an initial offering price of $18 per share of common stock, which is the midpoint of the estimated price range set forth on the cover of this prospectus). Unless otherwise noted, these references assume:
| • | the initial offering price of $18 per share of common stock, which is the midpoint of the estimated price range set forth on the cover of this prospectus; |
| • | no exercise of the outstanding options to purchase an aggregate of shares of common stock; |
| • | an eight-for-one forward stock split of our common stock effected on February 28, 2020; and |
| • | the filing and effectiveness of our sixth amended and restated certificate of incorporation and the adoption of our amended and restated bylaws upon the closing of this offering. |
-iii-
Table of Contents
FINANCIAL STATEMENTS AND BASIS OF PRESENTATION
SelectQuote operates on a fiscal year that begins on July 1st of each given calendar year and ends on June 30th of the following calendar year. This prospectus includes audited consolidated balance sheets as of June 30, 2019 and June 30, 2018 and consolidated statements of operations, statements of changes in shareholders’ equity, and statements of cash flows for the years ended June 30, 2019 and June 30, 2018 and an unaudited condensed consolidated balance sheet as of March 31, 2020 and condensed consolidated statements of operations, statements of changes in shareholders’ equity, and statements of cash flows for the nine month periods ended March 31, 2020 and March 31, 2019.
Stock Split
On February 28, 2020, we effected an eight-for-one forward stock split of our issued and outstanding shares of common stock and a proportional adjustment to the existing conversion ratios for our Series A, B, C and D preferred stock, which we refer to as the “stock split.” The par value of our common stock was not adjusted as a result of the stock split. All references to common stock, options to purchase common stock, share data, per share data and related information presented in this prospectus and contained in the financial statements and footnotes have been retrospectively adjusted, where applicable, to reflect the effect of the stock split and the adjustment of the Series A, B, C and D preferred stock conversion ratios. In connection with the stock split, the number of authorized shares of our common stock was increased to 700,000,000. Our shares of treasury stock were not affected by the stock split and were retired on March 30, 2020.
INDUSTRY AND OTHER DATA
Certain industry data and market data included in this prospectus were obtained from independent third-party surveys, market research, publicly available information, reports of governmental agencies and industry publications and surveys. All of management’s estimates presented herein are based upon management’s review of independent third-party surveys and industry publications prepared by a number of sources and other publicly available information. All of the market data used in this prospectus involve a number of assumptions and limitations, and you are cautioned not to give undue weight to such estimates. We believe that the information from these industry publications and surveys included in this prospectus is reliable. The industry in which we operate is subject to a high degree of uncertainty and risk due to a variety of factors, including those described in the section titled “Risk Factors.” These and other factors could cause results to differ materially from those expressed in the estimates made by the independent parties and by us.
TRADEMARKS AND TRADE NAMES
“SelectQuote,” our logo, and other trademarks or trade names of SelectQuote, Inc. appearing in this prospectus are our property. This prospectus also contains trademarks and trade names of other companies, which are the property of their respective owners. Solely for convenience, trademarks and trade names referred to in this prospectus may appear without the ® or ™ symbols, but such references are not intended to indicate, in any way, that we will not assert, to the fullest extent under applicable law, our rights or the right of the applicable licensor to these trademarks and trade names.
-iv-
Table of Contents
This summary highlights information appearing elsewhere in this prospectus. This summary does not contain all of the information you should consider before investing in our common stock. You should read this entire prospectus carefully, including the sections titled “Risk Factors” and “Management’s Discussion and Analysis of Financial Condition and Results of Operations” and our financial statements and related notes appearing at the end of this prospectus, before making any investment decision. In this prospectus, we make certain forward-looking statements, including expectations relating to our future performance. These expectations reflect our management’s view of our prospects and are subject to the risks described under “Risk Factors” and “Cautionary Note Regarding Forward-Looking Statements.” Our expectations for our future performance may change after the date of this prospectus and there is no guarantee that such expectations will prove to be accurate. Unless the context otherwise requires, we use the terms “SelectQuote,” the “Company,” “we,” “us” and “our” in this prospectus to refer to SelectQuote, Inc.
Our Company
We are united by our mission to provide solutions that help consumers with their overall financial well-being and protect their most valued assets: their families, their health and their property. Our highly skilled agents strive to deliver a best-in-class consumer experience through a comparison shopping process of leading insurance carriers to provide consumers with greater choice, transparency and value.
We are a leading technology-enabled, direct-to-consumer (“DTC”) distribution platform that provides consumers with a transparent and convenient venue to shop for complex senior health, life and auto & home insurance policies from a curated panel of the nation’s leading insurance carriers. As an insurance distributor, we do not insure the consumer, but rather identify consumers looking to acquire insurance products and place these consumers with insurance carrier partners that provide these products and, in return, earn commissions from our insurance carrier partners for the policies we sell on their behalf. Our proprietary technology allows us to take a broad funnel approach to marketing by analyzing and identifying high quality consumer leads sourced from a wide variety of online and offline marketing channels. Our primary sources of leads include search engine marketing, radio, television, and third-party marketing partners. We monitor our acquisition costs to dynamically allocate our marketing spend to the most attractive channel, benefitting from over thirty years of data accumulated through our proprietary, purpose-built technologies. Our advanced workflow processing system scores each acquired lead in real-time, matching it with an agent whom we determine is best suited to meet the consumer’s need. Our platform then captures and utilizes our experience to further build upon the millions of data points that feed our marketing algorithms, which further enhances our ability to deploy subsequent marketing dollars efficiently and target more high-quality consumer leads.
Our proprietary routing and workflow system is a key competitive advantage and driver of our business performance. Our systems analyze and intelligently route consumer leads to agents and allow us to monitor, segment and enhance our agents’ performance. This technological advantage also allows us to rapidly conduct a needs-based, bespoke analysis for each consumer that maximizes sales, enhances customer retention and ultimately maximizes policyholder lifetime revenues. Although we have the ability to conduct end-to-end enrollments online, our expertise and value add stems from the coupling of our technology with our skilled agents, which provides greater transparency in pricing terms and choice, and an overall better consumer experience. When customers are satisfied, their propensity to switch policies decreases, thereby improving retention rates, increasing policyholder lifetime values and ultimately, optimizing and increasing the visibility of our financial performance.
We generate commission revenue from selling policies on behalf of our insurance carrier partners, the majority of which compensate us through first year and renewal commissions. We have built our business model to maximize commissions collected over the life of an approved policy less the cost of acquiring the business, a metric we refer to as policyholder lifetime value and which is a key component to our overall profitability.
-1-
Table of Contents
For our fiscal year ended June 30, 2019 (“fiscal 2019”), we earned $337.5 million of revenue representing 44% growth over the $233.7 million of revenue that we earned during our fiscal year ended June 30, 2018 (“fiscal 2018”). In fiscal 2019, we generated $72.6 million in net income, an increase of 108% over fiscal 2018 when we generated $34.9 million in net income. In fiscal 2019, we generated $105.3 million in Adjusted EBITDA, an increase of 111% over fiscal 2018 when we generated $49.9 million in Adjusted EBITDA. Our Adjusted EBITDA Margin increased to 31.2% in fiscal 2019 from 21.4% in fiscal 2018.
For the nine month period ended March 31, 2020, we earned $390.1 million of revenue representing 48.3% growth over the $263.1 million of revenue that we earned for the nine month period ended March 31, 2019. Net income increased 2.4% from $59.7 million for the nine month period ended March 31, 2019 to $61.1 million for the nine month period ended March 31, 2020. During the nine month period ended March 31, 2020, we generated $113.9 million in Adjusted EBITDA, an increase of 32.8% over the nine month period ended March 31, 2019, when we generated $85.8 million in Adjusted EBITDA. Our Adjusted EBITDA Margin decreased to 29.2% for the nine month period ended March 31, 2020, from 32.6% for the nine month period ended March 31, 2019.
Adjusted EBITDA and Adjusted EBITDA Margin are Non-GAAP financial measures that we use to measure our operating performance. For a reconciliation of these Non-GAAP financial measures to our GAAP financial measures, please see “Selected Historical Consolidated Financial and Operating Data—Non-GAAP Financial Measures” and “Management’s Discussion and Analysis of Financial Condition and Results of Operations—Non-GAAP Financial Measures (Adjusted EBITDA)” in this prospectus.
Our Business Model
We operate in an attractive segment of the insurance value chain, distributing insurance products on behalf of our insurance carrier partners who, in return, pay us commissions. Accordingly, we do not currently generate revenues directly from the consumers with whom we interact. In addition, because we are not the issuer of the insurance policy to the consumer, we bear no underwriting risks.
Founded over 30 years ago as what we believe was the first DTC term life insurance exchange platform in the U.S., our technology-driven, differentiated model allows consumers to easily compare pricing and policy options from over 50 of the nation’s leading insurance carriers. Working in tandem, our agents and technology systems are the foundational pillars of our franchise. Our highly trained and licensed agents are subject matter experts in the products they sell, and this, in combination with our purpose-built software and business process, differentiates the service we provide to consumers relative to other insurance distributors or “online only” offerings. We believe providing personalized advice and guidance from policy research to enrollment is a key differentiator in the senior health market as consumers tend to prefer or require more personalized attention to navigate increasingly complex and ever-changing coverage options. Our agents on the SelectQuote platform are trained to offer unbiased advice in order to be more aligned to the specific needs of each customer.
As one of the few technology-enabled distributors of scale in our end markets, we believe that we are well-positioned to capitalize on the accelerating trend of digital transformation across the insurance distribution landscape. Under the traditional insurance distribution model, consumers are often unaware of their full range of coverage options and are at risk of receiving opaque, “one size fits all” recommendations primarily intended to maximize agent commissions over their needs. In contrast, the insurance distribution landscape today is one in which consumers of insurance demand greater choice, seek more transparency in pricing and use the internet to self-research their insurance options. Recent technological innovations, including the proliferation of smart mobile devices as a means of consumer purchasing, consumer demand for price transparency and comparison shopping, and the development of machine learning for business applications, continue to transform the insurance distribution landscape. As the composition of the U.S. population gradually shifts to the mobile-first
-2-
Table of Contents
generation, consumers are becoming more tech-savvy and increasingly comfortable shopping online. We believe our ability to offer multiple carriers’ policies, proprietary technology platform, vast datasets and use of machine learning in key aspects of our business puts us in an excellent position to take advantage of these consumer trends.
Direct distribution is becoming an increasingly important part of the overall distribution strategies of insurance carriers as they drive to lower customer acquisition costs. Internet and mobile devices enable distributors to target and reach consumers directly in a highly controlled and efficient manner. Our software allows our agents to have more effective interactions with customers, driving agent productivity and sales volumes and providing an attractive distribution alternative for our insurance carrier partners. While traditional insurance distributors use a time-intensive, in-person purchasing process, consumers are increasingly researching insurance policies for their needs online and ultimately, purchasing through direct channels. Platforms like ours are well-positioned to serve these customers as we allow consumers to compare insurance in a transparent manner, without having to solicit individual quotes from carriers in the market or rely on the options presented by a traditional insurance distributor and to do so from the comfort of their homes.
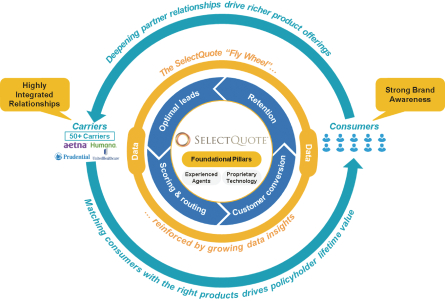
Our systems allow us to gain valuable insights from the rich sources of consumer information we have gathered over three decades, and we use data analytics and proprietary algorithms to enhance our sales and marketing strategies in an effort to maximize our return on our marketing spend and enhance our agents’ close rates. As we have grown, we have continued to gather valuable data that has allowed us to further enhance our algorithms. Accordingly, we have been able to improve our lead acquisition efficiency and scoring and workflow processing capabilities, which has enabled us to serve customers more efficiently and has improved the value proposition we offer to our insurance carrier partners. As our value proposition has grown, our insurance carrier partners have come to rely more on our distribution capabilities and have collaborated with us more deeply in product design, helping fuel our growth. We expect this virtuous cycle, which we refer to as the SelectQuote “Fly Wheel,” to continue as we execute on our mission.
Our Agents
Our agent force is one of two foundational pillars that support our business. The insurance products we sell are often complicated and each consumer has different needs. We believe the most effective method for matching
-3-
Table of Contents
products with each consumer’s needs requires the attention of highly-trained and skilled agents, and we believe this training and expertise differentiates us from the traditional distribution model. Each of our lines of business has dedicated licensed agents that are subject matter experts in that line which allows them to provide deep expertise and helpful advice that are specific to a client’s needs. We have developed what we believe is a best-in-class talent management system that allows us to recruit from across the U.S. and build and retain top agents. We provide each new agent with up to 10 weeks of proprietary in-house training, which is later supplemented by ongoing training during the agents’ full-time employment. Our training is designed to ensure that every agent is well-equipped with a deep understanding of the products he or she sells and the customer service and sales skills necessary to best service the customer. A goal of ours is that every agent in whom we invest will build a long and rewarding career with us.
Our need for agent capacity is seasonal, peaking during the Annual Election Period (“AEP”) and remaining elevated during the Open Enrollment Period (“OEP”). We hire additional “flex” agents during these periods to address this expected increase in transaction volume and temporarily reassign agents from our Senior business to our Life and Auto & Home businesses during non-AEP/OEP periods. Our flex agents undergo up to 10 weeks of proprietary in-house training, further supplemented by additional training. We continuously assess flex agent performance throughout AEP and OEP. The majority of our flex agents that we regard as high performers during this period move on to become “core” agents or accept other roles with us. This opportunity to assess flex agent performance before offering a permanent role within the Company is an important factor in placing employees in the right roles over the long term, which allows us to maintain our strong agent productivity and helps create a positive career path leading to strong employee engagement as evidenced by multiple awards of “Best Places to Work.” In fact, based on our past experience, average agent productivity increases by approximately 40% in an agent’s second AEP.
Our agents are segmented into multiple levels based on their productivity, with the most productive agents given first access to the highest quality leads. In our Senior segment, level one agents demonstrate higher productivity and higher close rates than similarly situated Senior agents in levels below them. In addition, we experience much lower agent attrition with our top-level agents. Essentially, this process allows us to match a lead with the appropriate agent and to optimize our agent’s most valuable asset: time. Each agent guides the potential customer through tailored policy options and provides education on complex senior health, life and auto & home products, thereby helping consumers select the option that best suits their needs and circumstances. This personalized approach enhances the customer experience and when customers are satisfied, their propensity to switch policies decreases, which extends the renewal revenue stream paid to us by our insurance carrier partners, and enhances the lifetime value of policyholder relationships. Our processes and technologies come together to drive strong economic results, allowing us to reward top agents with market leading pay, which coupled with our corporate culture, drives what we believe to be an industry-leading agent retention rate of over 93% among our level 1, or top performing, agents, and a 70% overall agent retention rate.
As of March 31, 2020, we employed a total of 922 core agents and 73 flex agents across our Senior, Life and Auto & Home segments.
Our Technology
Technology is the second foundational pillar that supports our business. Our proprietary technology permeates our business process, from lead generation to scoring and routing, product selection and eventually to customer conversion, post-sale management, and cross-selling opportunities. Applying information gathered
-4-
Table of Contents
since our founding more than 30 years ago to drive sophisticated attribution modeling, we have continued to optimize our decision-making and advance our goal of maximizing policyholder lifetime value and profitability.
Lead Acquisition: We utilize a broad policyholder acquisition funnel strategy, generating new business leads through a wide variety of online and offline marketing channels, such as search engine, television, radio advertising and third-party marketing partners. Our software continuously monitors the cost of acquiring customers and uses our algorithm to dynamically adjust our bids for specific leads based on our expectation of the lead’s lifetime value. As we continue to operate, these algorithms feed a vast and ever growing pool of millions of data points, which, with the assistance of our team of highly skilled data scientists, enhances our ability to more accurately estimate a new lead’s lifetime value and enables us to make more informed decisions when generating leads. Our data science team creates algorithms that support lead buying, scoring and routing and consumer lifecycle management of closed leads. We believe what sets us apart from our competitors is our more than 30 years of proprietary data that our data scientists use as part of our bidding strategy for purchased leads, grouping phone and web leads by likelihood to purchase specific products, scoring phone and web leads using historical performance of similar leads based on demographics, tiering leads for routing to the corresponding agent levels, and performing predictive analysis of current customers’ retention rates or “persistency”.
Lead Management & Routing: Regardless of how a lead is generated, our proprietary software will score the lead in real-time on a scale of 1 to 10 based on multiple factors, then route the lead to the most appropriate level of agent to maximize expected lifetime policyholder value. This works in tandem with our bespoke, purpose-built lead routing and workflow management technology, Get A Lead (“GAL”). Based on lead score, agent level, and agent availability, GAL uses a “rapid fire approach” to quickly assign these leads to a licensed agent. We believe that our use of proprietary technology to monitor, segment and enhance agent performance, such as through real-time lead routing to the most effective agents, is a key competitive advantage and driver of our business performance.
Sales: Once assigned a lead, our highly skilled, licensed agents utilize their training, experience and our proprietary software and systems to rapidly conduct a bespoke needs-based analysis for each consumer. This coupling of our technology with our skilled agents provides the consumer with greater transparency in pricing terms and choice, and an overall better consumer experience that maximizes sales, enhances customer retention and, ultimately, maximizes our policyholder lifetime revenues.
-5-
Table of Contents
Customer Engagement & Lifecycle Management: We use advanced algorithms informed by over 1 billion consumer and third-party data points to enrich our consumer engagement strategy. Our dedicated retention-focused customer care (“CCA”) team leverages this technology to help consumers successfully onboard and to identify customers we determine to be likely to purchase additional products, thereby improving the likelihood that a consumer retains his or her policy and identifying cross-sell opportunities.
Our Products
The core products we distribute on behalf of our insurance carrier partners are needs-based and critical to the overall financial well-being of consumers and the protection of their most valued assets: their families, their health and their property. Increasing household financial obligations, rising healthcare costs, importance of health and wellbeing, and government and lender mandates for certain insurance coverage drive the need for the insurance products we distribute. These products are underwritten by leading insurance carrier partners that we carefully select across our three business lines: SelectQuote Senior, SelectQuote Life and SelectQuote Auto & Home.
SelectQuote Senior (“Senior”), our fastest growing and largest segment, was launched in 2010 and provides unbiased comparison shopping for Medicare Advantage (“MA”) and Medicare Supplement (“MS”) insurance plans as well as prescription drug plan, dental, vision and hearing and critical illness products. We represent approximately 15 leading, nationally-recognized insurance carrier partners, including Humana, UnitedHealthcare and Aetna. Medicare Advantage and Medicare Supplement plans accounted for 74% of our approved Senior policies during fiscal 2019 and 78% of our approved Senior policies during the nine month period ended March 31, 2020, with ancillary policies including prescription drug, dental, vision and hearing plans, accounting for most of the remainder.
SelectQuote Life (“Life”) is one of the country’s largest and most established DTC insurance distributors for term life insurance, having sold over 1.75 million policies nationwide since our founding in 1985. Our platform provides unbiased comparison shopping for life insurance and ancillary products including term life, guaranteed issue, final expense, accidental death and juvenile insurance. We represent approximately 15 leading, nationally-recognized insurance carrier partners, with many of these relationships exceeding 15 years. Term and permanent life products accounted for 84% of new premium within the Life segment during fiscal 2019 and 76% of new premium within the Life segment during the nine month period ended March 31, 2020, with ancillary products, primarily final expense, accident and juvenile life policies, accounting for the majority of the remainder.
SelectQuote Auto & Home (“Auto & Home”) was founded in 2011 as an unbiased comparison shopping platform for auto, home and specialty insurance lines. We offer insurance products, including homeowners, auto, dwelling fire and other ancillary insurance products, underwritten by 29 leading, nationally-recognized insurance carrier partners. Homeowners and 12-month auto products accounted for 75% of new premium within the Auto & Home segment during fiscal 2019 and 78% of new premium within the Auto & Home segment during the nine month period ended March 31, 2020, with six-month auto, dwelling and other products accounting for the remainder.
As illustrated below, we have a diverse revenue base from a variety of products and carriers across each business line. We experienced strong revenue, net income and Adjusted EBITDA growth across each of our segments in fiscal 2019 that has continued into fiscal 2020. Revenues from Senior, Life and Auto & Home grew by 88%, 12% and 5%, respectively, in fiscal 2019 compared to fiscal 2018, and have grown by 73%, 10% and 15%, respectively, for the nine month period ended March 31, 2020, compared to the nine month period ended March 31, 2019. Adjusted EBITDA and Adjusted EBITDA Margin are Non-GAAP financial measures that we use to measure our operating performance. For a reconciliation of these Non-GAAP financial measures to our GAAP financial measures, please see “Selected Historical Consolidated Financial and Operating Data—Non-GAAP Financial Measures” and “Management’s Discussion and Analysis of Financial Condition and Results of Operations—Non-GAAP Financial Measures (Adjusted EBITDA)” in this prospectus.
-6-
Table of Contents
| Revenue for Fiscal 20191
|
Adjusted EBITDA for Fiscal 20192
|
Our Insurance Carrier Partners
We maintain longstanding, deeply integrated relationships with over 50 of the nation’s leading insurance carriers, who have some of the industry’s most widely recognizable brands. Our insurance carrier partners consider us a key strategic partner, as evidenced by our standing as one of the top DTC insurance distributors for a number of our key partners, including carriers owned by Humana, UnitedHealthcare, Aetna and Prudential. These high-quality relationships have resulted in strong insurance carrier retention rates and the fact that we have never been dropped by an insurance carrier partner. We believe carriers see our method of acquiring customers as scalable and efficient and, ultimately, as cost advantageous compared to their own models, and provide us, in some cases, with marketing development funds as additional compensation to deliver policies. Marketing development funds are similar to production bonuses in that they are based on attaining various predetermined target sales levels or other agreed upon objectives for individual insurance carrier partners. Our insurance carrier partners are responsible for paying our commissions and, for these purposes, act as our customers. We do not currently generate revenues directly from the consumers to whom we sell insurance policies on behalf of our insurance carrier partners.
Separate from SelectQuote’s comparison shopping platform, we have established several carrier-specific sales platform arrangements with several of our insurance carrier partners, which we call “pods”. These arrangements give us access to various marketing assets from our insurance carrier partners, such as use of the insurance carrier’s brand, which allows us to target customers for specific insurance carrier partners to give us access to incremental sales volume. Consumers directed to a pod agent come from either leads that are not branded as SelectQuote or come directly from an insurance carrier-affiliated channel. Our software assigns a propensity score to unbranded leads, potentially assigning those with a high propensity to purchase from a specific carrier to that carrier’s pod. The number of insurance carrier partners with which we have pod relationships can vary quarter to quarter depending on the insurance carrier partner and the business line.
Our Market Opportunity
We estimate that the total addressable market for the insurance products we distribute is greater than $180 billion. Further, while these markets are already substantial, they are also growing, in part due to a number of highly attractive demographic trends. We base our market opportunity estimates on third-party demographic
| 1 | Excludes Corporate & Eliminations. |
| 2 | Excludes Corporate & Eliminations. |
-7-
Table of Contents
data, our historical policy revenue experience and customer retention expectations. According to the Kaiser Family Foundation, there are approximately 67.7 million Medicare beneficiaries in 2020. We believe this addressable market, which is the core focus of the products we distribute, presents an annual commission revenue opportunity of approximately $30 billion for our Senior segment. The products marketed by our Life and Auto & Home segments also address large markets that present annual commission revenue opportunities of approximately $105 billion and $47 billion, respectively, which present us with additional opportunities for growth. In each of our three segments, we estimate our market share to be less than 1% and we believe we can benefit from greater market penetration in addition to underlying market growth.
Senior Market
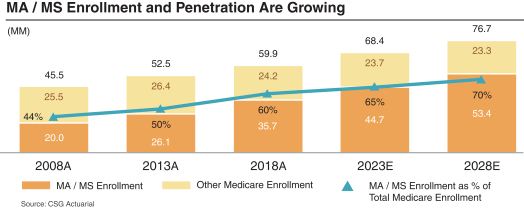
Demand for senior insurance products in the U.S. is underpinned by powerful demographic trends. The number of people reaching retirement each year took a step-change in 2011 as the first wave of the post-war “Baby Boomer” generation turned 65. The proportion of the population that is age 65 or higher increased from 12.9% in 2010 to 15.2% in 2016 and is expected to reach 16.9% by 2020, according to the United States Census Bureau. On average, 10,000 “Baby Boomers” are expected to turn 65 every day, or nearly 4 million per year, for the next 10 years. As a result, Medicare enrollment is growing steadily, with the number of Medicare enrollees expected to grow from 59.9 million in 2018 (up from 45.5 million in 2008 and 52.5 million in 2013), to approximately 68.4 million in 2023 then rising to 76.7 million by 2028, according to CSG Actuarial.
Not only is the population of people age 65 and higher growing, but according to Pew Research Center, internet usage within this group has also risen, with 73% using the internet in 2019 compared to 40% in 2009. This group is also transacting more online, with 55% of people age 65 and higher making online purchases monthly according to SheerID, and accessing online health resources, with 68% doing so according to the Journal of Medical Internet Research.
Within the growing Medicare market, Medicare Advantage plans are gaining prominence, as these private market solutions displace the traditional, government Medicare program. CSG Actuarial estimated that, at the end of 2019, there were approximately 23 million Medicare Advantage enrollees, representing approximately 38% penetration of the Medicare market. According to LEK Consulting, by 2025, the number of Medicare Advantage enrollees is expected to swell to approximately 38 million, representing a 50% penetration rate of the Medicare market. LEK Consulting projects that Medicare Advantage products will reach 60% to 70% penetration between 2030 and 2040, highlighting the pace with which this already large segment of the Medicare market is growing. The chart below illustrates the historical and projected increase in Medicare Advantage and Medicare Supplement enrollment compared to total Medicare enrollment, according to CSG Actuarial.
-8-
Table of Contents
The degree to which we will realize a corresponding increase in revenue will be determined by our ability to continue to successfully place new Medicare policies for this enlarged potential consumer base. Despite our scale, we account for only a fraction of the total market for Medicare Advantage and Medicare Supplement plans, with only 0.3 million of the 35.7 million total enrollment for such plans in 2018, providing ample opportunity for growth. From 2017 to 2018, our Medicare Supplement and Medicare Advantage active policy count grew 37.5%, or 15.6 times the 2.4% growth in total Medicare enrollment over the same time frame, according to CSG Actuarial. Accordingly, we can benefit not only from broad growth in Medicare and the increasing penetration of Medicare Advantage plans, but we can also achieve growth through market share gains in the distribution of Medicare Advantage and Medicare Supplement products. We can also grow through our offering of ancillary and non-insurance products targeting the senior market.
Life Market
DTC sales of life insurance are becoming more prevalent as an increasing proportion of consumers are conducting self-directed online research prior to buying policies. Due to the typically more complex and longer-term nature of life insurance products, we expect agent expertise and consultation to continue as a prominent aspect of the sales process prior to ultimate purchase. Our dedicated, high-touch agents coupled with our user-friendly online platform caters to these evolving consumer preferences, which we believe favorably positions us to capture an increasing share of the overall market. Our approach to consumer engagement provides transparency and, we believe, an overall better experience that generates higher conversion rates than achievable by other forms of distribution, creating a cost advantage for our distribution platform relative to others.
Auto & Home Market
Property & Casualty insurance is a large addressable market in which policyholders often have a government or lender-mandated need for coverage. The DTC channel for sales of these products is well established and growing, driven by continued adoption of online sources for research and quotes. We believe the combination of our technology and agents is an important differentiator that better enables us to help potential policyholders compare and choose between multiple products, and also to give valuable advice on bundled options that provide more holistic coverage across multiple risks. We differentiate ourselves from carrier captive agents and traditional insurance distributors on the basis of choice, convenience and consumer experience.
Our Competitive Strengths
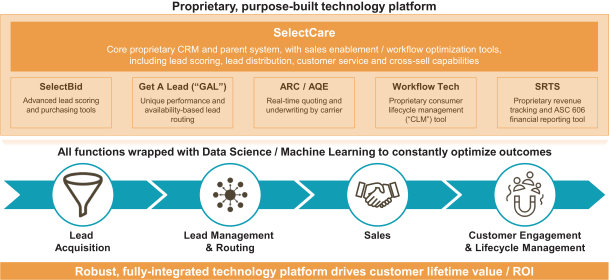
Leading technology-based sales platform. Our primary focus is to provide best-in-class service to bring policyholders value through greater choice and transparency. Since 1985, we have helped over 2 million policyholders save time and money on critical insurance purchases. Since our founding in 1985, we have been pioneers of insurance distribution and, through our technology-driven sales model, we believe we are well placed to support policyholders and insurance carrier partners as consumers continue shifting towards online channels to make purchasing decisions for their insurance needs. We believe that our data and our technology are key competitive advantages and drivers of our business performance. We continue to upgrade and optimize our technology as new opportunities are identified by our Information Technology and Analytics teams. SelectCare is our core overarching proprietary customer relationship management (“CRM”) and parent system with phone bank, sales enablement / workflow optimization and reporting tools. SelectCare is a bespoke system that uses various algorithms to score leads, route them to agents and organize each agent’s work day, with the objective of maximizing return on investment. Operating within SelectCare are the following purpose-built systems:
| • | SelectBid: Advanced, data-enriched lead scoring and purchasing tool that provides real-time feedback to help us determine which consumers and campaigns are generating the most valuable opportunities, allowing us to optimize marketing spend. |
-9-
Table of Contents
| • | Get A Lead (“GAL”): Bespoke, purpose-built lead routing and workflow management technology based on lead quality, agent performance and agent availability. GAL uses a targeted approach to rapidly assign consumers to a licensed agent. |
| • | Automated Rate Calculator (“ARC”) / Automated Quote Engine (“AQE”): Real-time quoting and underwriting applications integrated directly into carrier systems. ARC and AQE allow us to build quotes for potential customers in real time based on specific carrier underwriting requirements and risk tolerances. |
| • | SelectQuote Revenue Tracking System (“SRTS”): Fully integrated, proprietary revenue tracking and financial reporting tool that also supports financial and customer falloff / retention prediction algorithms, allowing for real-time workflow and actions with our customer service teams. |
We currently utilize data science across all of our key business functions and systems, and our sophisticated algorithms benefit from years of data accumulation and analysis, which are continuously enriched with new data and refined by our in-house data science team. Our algorithms are informed by data accumulated through our operating history, which includes approximately 32 million leads and over 1 billion data points in our database. Our focus on data quality ensures our data scientists can draw deep insights as accurately and efficiently as possible. Our complex regression and machine learning models drive marketing spend and lead purchasing, scoring and routing, sales execution and post-sale customer engagement, all to further our goal of maximizing policyholder lifetime value. As we continue to grow, we will naturally acquire more data that will continue to better inform our decision making.
Highly scalable platform with growing network effects. Our structured recruiting, training and agent onboarding program provides flexibility to ramp up agent hiring activity to drive sales volumes. Through significant recent investments we have made to our technological, infrastructure and reporting capabilities, our platform is designed to provide us with ample support for future years of growth with minimal ongoing working capital requirements. We have built our systems to be highly adaptable, providing us with flexibility to seamlessly provide product extensions and enter into other product verticals. We continually evaluate our insurance carrier partnerships, and we have the ability to accommodate new insurance carrier relationships and new products that may further drive growth. As we expand, we expect our appeal to consumers as a one-stop shop and our appeal to carriers as a leading platform with large consumer audiences to continue to grow. These network effects will allow us to accumulate more data and insights, which serve to strengthen our algorithms and the value of our connections, thus accelerating our “Fly Wheel.”
Strong brand awareness. We were founded over 30 years ago as what we believe was the first DTC term life insurance exchange platform in the U.S. Over this time, we have built a highly successful and recognizable household brand. We continue to enhance our visibility with advertisements on nationwide TV networks (including CNN, Fox News and ESPN) and radio outlets, while also maintaining a strong online presence through our market-leading comparison websites, complemented by search engine advertising and a social media presence (Facebook, YouTube, etc.). There is also meaningful potential for us to leverage our strong brand awareness for intragroup cross sales and expansion into adjacent products and markets that further enhance revenue.
Ability to attract and retain productive, career-based agent force. We believe that a technology-enabled agent-based distribution model generates superior return on investment and policyholder lifetime value relative to solely web-based or traditional distribution models. As a result, we have built processes that allow us to attract, train and retain top talent, and to grow our agent force. Our sophisticated recruitment engine is employed across our six major city center locations and nationally with our remote agent capability and involves personality tests, multiple interviews and final approval by a senior manager. Seasonally, we utilize flex agents in our Senior segment for AEP and OEP to capitalize on the heightened activity during these windows. The use of
-10-
Table of Contents
flex agents allows us to identify top performing agents who will ultimately be transitioned to core agents or other roles at the Company following OEP. The fact that we offer our flex agents multiple career paths gives us a strategic advantage in recruiting highly talented individuals. Many of our top producing core agents previously served as flex agents. These recruiting and development processes lead to agent productivity rates that we believe are materially above the industry norm, allowing us to offer competitive compensation packages and attractive career paths, which in turn drives tenured core agent retention levels of over 93% among our most productive agents. This results in a virtuous cycle, that we believe gives SelectQuote a sustainable competitive advantage in the recruitment of new agents.
Diverse product offering. At our inception, we specialized in the distribution of term life insurance products. Since then, in addition to introducing a range of other life insurance products, SelectQuote expanded into the fast growing senior health insurance market (in 2010) and auto & home insurance market (in 2011). Our three product segments are a natural fit with consumer insurance and healthcare needs across different life stages. We believe we are unique among insurance distributors for our diverse product range, which provides us with greater stability as demand for certain products fluctuates over the calendar year, and over longer periods of time. Today we provide consumers with access to over 20 products, sourced from over 50 carriers.
Deep and broad insurance carrier partnerships. We are a key distribution partner for over 50 of the largest and most respected blue-chip insurance carriers. Our strong and long-standing relationships with many of our insurance carrier partners, some of which have been on our platform since our inception, represent a mutual commitment which we believe is difficult to replicate. While we are focused on providing consumers with greater choice, we also strive to be a meaningful component of our insurance carrier partners’ distribution strategy, and are therefore selective when it comes to which carriers we accept on to our platform. Our national presence, scale, broad consumer reach and our sales capability make us a partner of choice and a critical distribution channel for these carriers. We are a leading DTC insurance distributor for a number of insurance carrier partners, which helps us negotiate for attractive economics from our insurance carrier partners. In fiscal 2019, we sold more than 160,000 Senior policies for our Senior insurance carrier partners and produced more than $145.0 million in new premium for our Life and Auto & Home insurance carrier partners. In the nine month period ended March 31, 2020, we sold approximately 235,000 Senior policies for our Senior insurance carrier partners and produced more than $123.0 million in new premium for our Life and Auto & Home insurance carrier partners. Furthermore, our proprietary technology and tech-enabled agent model is focused on maximizing policyholder lifetime value, meaning that our insurance carrier partners enjoy higher quality business from each transaction sourced through us. Our insurance carrier partners also rely on our strong internal compliance function, which records all of our calls and audits a subset of them with our Quality Assurance team to ensure that we are complying with Centers for Medicare & Medicaid Services (“CMS”) rules and regulation, telemarketing regulations, carrier internal requirements and that the agents are meeting certain quality metrics that we deem important. Our compliance record and efficiency have led insurance carriers to partner with us on another key value proposition—our insurance carrier dedicated agent pods. These pods deepen our relationship with these insurance carrier partners and enable us to sell more policies. Pod marketing is specific to each individual pod and is separate from SelectQuote’s comparison shopping platform. This ensures a SelectQuote lead always gets presented with the comparison shopping platform.
Data driven approach to maximization of policyholder lifetime value. We use advanced algorithms informed by over 1 billion consumer data points to enrich our consumer engagement strategy. Our algorithms help agents identify opportunities for cross-sell, such as offering complementary plans at the point of sale. After a sale is made, our algorithms effectively identify customers likely to purchase additional products, thereby improving the likelihood that a policyholder retains his or her policy and generating highly predictable future income. As of March 31, 2020, our dedicated CCA team, which we launched four years ago, was comprised of 127 professionals who aim to improve the consumer experience during the post-sale carrier onboarding process, drive improved retention in the out years and improve cross selling opportunities. A number of the CCA team
-11-
Table of Contents
members are former licensed agents already familiar with the business and the consumer journey. This function allows our core agent force to allocate time towards new business generation. The CCA team leverages our systems to identify opportunities for consumers to purchase additional products and for us to implement tailored retention strategies. Part of the team’s function also involves a data-driven targeted outreach program to Medicare Advantage clients ahead of AEP to gauge potential interest in insurance shopping plans during the upcoming season. In order to make sure that we are making decisions with the best data possible, we partner with leading external industry consultants to review and validate our historical retention experience and projected performance. Our consistent track record of delivering strong customer retention rates creates additional value for our insurance carrier partners, solidifying SelectQuote’s position as a key partner with insurance carriers, which produces a positive reinforcement loop across our business. Our database is the result of more than 30 years of dedicated focus and investment, providing us with unparalleled insights that are difficult for competitors to replicate.
Attractive financial profile. As a distributor of insurance products, we benefit from favorable industry trends. We earn commission revenue on the successful sale and renewal of polices we distribute and, accordingly, our financial model does not reflect the inherent uncertainties associated with underwriting insurance risk. We have a high degree of visibility into the commission we earn at the time of sale, as well as the renewal commissions we would earn should a policyholder renew his or her policy. Our CCA team’s efforts enhance the policyholder experience and thereby improve policyholder retention and our opportunity to generate renewal commissions. Because our agents do not receive a share of renewal commissions, each dollar of renewal revenue directly adds to our income from operations, thereby improving our margins. Our platform is highly scalable, which enables margin expansion as we grow.
Strong company culture developed by an experienced management team. We maintain a unique sales and consumer service-oriented culture. We are a diverse group of women and men who are united in our mission to provide solutions that help consumers with their overall financial well-being and protect their most valued assets. Through our recruiting processes, we are able to identify people who enjoy being a part of, and are motivated by, a performance-based, meritocratic organization. This allows us to assemble a world-class team of people who envision building their careers at SelectQuote. Our company culture is promoted by a highly experienced management team with deep industry experience and a track record of industry innovation. The key members of our management team have over 60 total years of industry experience and several members of our management team have worked together to build our business over the last eight years.
Our Growth Strategy
Maximize policyholder lifetime value. Policyholder lifetime value represents commissions estimated to be collected over the life of an approved policy less the cost of acquiring the business and is a key component of our overall profitability. Our goal is to maximize policyholder lifetime value, and we do so through strategies designed to maximize the revenue opportunity and minimize our customer acquisition cost. Maximizing policyholder lifetime value involves continued investment in:
| • | Our agent experience and customer care team, which together enhance our close rates, commissionable premium, and our ability to earn renewal and cross-sell revenue; |
| • | Carrier relationships, and in particular, negotiation of more favorable terms; |
| • | Pre-AEP outreach to our Senior segment policyholders to better understand emerging trends in consumer decision making; |
| • | Technology, data and analytics to optimize our marketing and lead acquisition spend; and |
| • | Our pod offerings, which offer an opportunity to earn economics on a more favorable basis than our broader comparison shopping platform. |
-12-
Table of Contents
Increase the size and enhance the productivity of our agent force. Agents and their productivity are a key element of our ability to distribute policies and earn commission revenue. We intend to continue to invest in our agent force, widening our recruiting funnel through our new remote agent program as well as selectively expanding our physical offices and growing our agent ranks. We intend to continue to invest in training, technology and widening our product offering, all of which enable our agents to be more productive. In doing so, we believe we will be able to offer more rewarding career opportunities for our agents, which should further enhance our ability to grow our agent force.
Deepen consumer penetration and drive cross-selling opportunities. We are highly focused on the consumer experience and believe that customer satisfaction is a key driver to maximizing cross-sell opportunities and repeat business. We believe there are natural synergies across our portfolio of products, and we are focused on increasing cross-sell across our existing customer base. Our success cross-selling ancillary products (e.g., dental, vision and hearing, prescription drug plans and fixed indemnity) to our clients is improving and we continue to look at ways to broaden our cross-selling opportunities. Within our Auto & Home business, we have been successful in bundling products (selling multiple products to the same customer). For fiscal 2019 and the nine month period ended March 31, 2020, our agents sold policies to over 30,000 and 26,000 customers, respectively, with bundle rates of 47% and 50%, respectively, which we believe are significantly higher than industry averages. A large and relatively untapped opportunity is to deepen cross-sell of products to customers across our three segments, and we are currently employing technology and data designed to enable us to better track the customer life journey to allow us to identify and better execute on this opportunity.
Deepen and broaden our insurance carrier partnerships. We are selective with the carriers that we choose to do business with and seek to maintain a balance between offering consumers choice, while sustaining a meaningful relationship with carriers to ensure we are able to get the best terms for consumers. We continuously evaluate our insurance carrier partner panel and have the ability to quickly accommodate new insurance carrier relationships and new products from existing carriers. Our focus on offering high-quality products has resulted in strong retention rates, increasing the value of our distribution model to insurance carrier partners.
Introduce new products. We have an attractive and scalable platform with strong policyholder acquisition capabilities, backed by flexible systems that can be leveraged to introduce new product offerings to consumers. We also have established relationships with major carriers that are familiar with our business model, providing a natural advantage for sourcing new product opportunities. We currently offer over 20 products on behalf of our insurance carrier partners to consumers and continuously evaluate new product opportunities, including simplified annuities, retirement solutions and other financial services products.
Senior Secured Credit Facilities
On November 5, 2019, the Company entered into a credit agreement (the “Credit Agreement”) with Morgan Stanley Capital Administrators, Inc., as lender and administrative agent, UMB Bank N.A., as lender and revolver agent, and the other lenders party thereto, providing for (i) a $75.0 million senior secured revolving credit facility (the “Revolving Credit Facility”) and (ii) a $425.0 million senior secured term loan (the “Term Loan” and, together with the Revolving Credit Facility, the “Senior Secured Credit Facilities”). Morgan Stanley Capital Administrators, Inc. is an affiliate of Morgan Stanley & Co. LLC, one of the underwriters of this offering.
Proceeds from the Term Loan may be used to pay dividends, purchase shares or otherwise return capital to stockholders in an amount not to exceed $325.0 million and for general corporate purposes. The Revolving Credit Facility is available for general corporate purposes and includes a letter of credit sub-facility of up to $5.0 million. The Senior Secured Credit Facilities also include an uncommitted incremental facility, which, subject to certain conditions, provides for additional term loans or an increase of existing term loans and/or an
-13-
Table of Contents
increase in commitments under the Revolving Credit Facility, in each case, in an aggregate amount of up to $100.0 million. Notwithstanding the foregoing, the aggregate amount of increases in commitments under the Revolving Credit Facility may not exceed $15.0 million.
On November 15, 2019, the Company declared a distribution of $188.7 million on all outstanding common stock and stock options (regardless of vesting status) ($1.96 per share) and $86.3 million on all outstanding Series A, B, C and D preferred stock ($15.66 per share) from a portion of the proceeds of the Term Loan (the “Distribution”). $265.8 million of the Distribution was paid to existing stockholders and $9.2 million was paid to stock option holders.
As of the date of this prospectus, the aggregate principal amount of the Term Loan is $425.0 million and our borrowing capacity under the Revolving Credit Facility is $75.0 million.
Stock Split
On February 28, 2020, we effected an eight-for-one forward stock split of our issued and outstanding shares of common stock and a proportional adjustment to the existing conversion ratios for our Series A, B, C and D preferred stock. The par value of our common stock was not adjusted as a result of the stock split. All references to common stock, options to purchase common stock, share data, per share data and related information presented in this prospectus and contained in the financial statements and footnotes have been retrospectively adjusted, where applicable, to reflect the effect of the stock split and the adjustment of the Series A, B, C and D preferred stock conversion ratios. In connection with the stock split, the number of authorized shares of our common stock was increased to 700,000,000. Our shares of treasury stock were not affected by the stock split and were retired on March 30, 2020.
Private Placement of Series E Preferred Stock
On April 17, 2020 and May 6, 2020, we issued and sold an aggregate of 100,000 shares and 35,000 shares, respectively, of our Series E preferred stock to certain “accredited investors” (as defined in Regulation D promulgated under the Securities Act of 1933, as amended (the “Securities Act”)), at a purchase price of $1,000 per share, for aggregate proceeds of approximately $135.0 million and net proceeds to the Company of approximately $129.0 million, after deducting commissions and expenses. We applied a portion of the net proceeds from the private placement of Series E preferred stock to complete our acquisition of InsideResponse, LLC (“InsideResponse”), an online marketing consulting firm from which we have historically purchased leads, and intend to use the remaining proceeds for general corporate purposes. Upon the closing of this offering, all outstanding shares of Series E preferred stock will automatically convert into shares of common stock at a fixed discount to the initial offering price.
In connection with the sale of shares of our Series E preferred stock, we entered into Investor Rights Letters with the purchasers of our Series E preferred stock (the “Series E Holders”), which grant the Series E Holders certain rights, including but not limited to certain preemptive rights and information rights. Upon the closing of this offering, these rights will terminate. See “Description of Capital Stock—Series E Preferred Stock Rights” and “Recent Sales of Unregistered Securities” for additional information.
Summary of Risk Factors
You should consider carefully the risks described under the “Risk Factors” section beginning on page 22 and elsewhere in this prospectus. These risks could materially and adversely affect our business, financial condition, operating results, cash flow and prospects, which could cause the trading price of our common stock to decline and could result in a partial or total loss of your investment. These risks include, among others, those related to:
| • | Our reliance on a limited number of insurance carrier partners and any potential termination of those relationships; |
-14-
Table of Contents
| • | Existing and future laws and regulations affecting the healthcare and health insurance market; |
| • | Competition with brokers, exclusively online brokers and carriers who opt to sell policies directly to consumers; |
| • | Changes and developments in the regulation of the healthcare industry; |
| • | Systemic changes in our insurance carrier partners’ sales strategies; |
| • | Disruptions or failures of our technological infrastructure and platform; |
| • | Potential changes in applicable technology and consumer outreach techniques; |
| • | Our ability to attract, integrate and retain qualified personnel; |
| • | Failure to convert sales leads to actual sales of insurance policies; |
| • | The impact on our operations from the effects of public health crises, including the current COVID-19 outbreak; |
| • | Our existing and future indebtedness; |
| • | Our intellectual property and technology; |
| • | Our being a public company; and |
| • | Our common stock and this offering. |
Corporate Information
We were incorporated in Delaware on August 18, 1999 under the name SelectQuote, Inc. to serve as a holding company for our business subsidiaries, including SelectQuote Insurance Services, our original operating company, which was incorporated in California on August 14, 1984. Our principal executive offices are located at 6800 West 115th Street, Suite 2511, Overland Park, Kansas 66211, and our telephone number at that address is (913) 599-9225. Our website address is www.selectquote.com. Information contained on our website is not incorporated by reference into this prospectus, and you should not consider information contained on our website to be part of this prospectus or in deciding whether to purchase shares of our common stock.
Implications of Being an Emerging Growth Company
We qualify as an “emerging growth company” as defined in the Jumpstart Our Business Startups Act of 2012, or the JOBS Act. As an emerging growth company, we may take advantage of specified reduced disclosure and other requirements that are otherwise applicable generally to public companies, including:
| • | Presenting only two years of audited financial statements in addition to any required unaudited interim financial statements with correspondingly reduced “Management’s Discussion and Analysis of Financial Condition and Results of Operations” disclosure in this prospectus; |
| • | Reduced disclosure about our executive compensation arrangements; |
| • | Exemption from the requirements to hold non-binding advisory votes on executive compensation and golden parachute payments; and |
| • | Exemption from the auditor attestation requirement in the assessment of our internal control over financial reporting. |
-15-
Table of Contents
We may take advantage of these exemptions up until the last day of the fiscal year following the fifth anniversary of this offering or such earlier time that we are no longer an emerging growth company. We would cease to be an emerging growth company earlier if we have more than $1.07 billion in annual revenue, we have more than $700.0 million in market value of our stock held by non-affiliates (and we have been a public company for at least 12 months and have filed one annual report on Form 10-K) or we issue more than $1 billion of non-convertible debt securities over a three-year period. We may choose to take advantage of some, but not all, of the available exemptions. We have taken advantage of certain reduced reporting obligations in this prospectus. Accordingly, the information contained herein may be different than the information you receive from other public companies in which you hold stock.
In addition, the JOBS Act provides that an emerging growth company can take advantage of an extended transition period for complying with new or revised accounting standards. This allows an emerging growth company to delay the adoption of certain accounting standards until those standards would otherwise apply to private companies. We have elected to avail ourselves of this exemption and, therefore, while we are an emerging growth company we will not be subject to new or revised accounting standards at the same time that they become applicable to other public companies that are not emerging growth companies.
-16-
Table of Contents
| Common stock offered by us |
18,000,000 shares. |
| Common stock offered by the selling stockholders |
7,000,000 shares (or 10,750,000 shares if the underwriters exercise in full their option to purchase an additional 3,750,000 shares from the selling stockholders). |
| Underwriters’ option to purchase additional shares of common stock from the selling stockholders |
3,750,000 shares. |
| Common stock to be outstanding after this offering |
162,650,597 shares. |
| Use of proceeds |
We estimate that our net proceeds from the sale of our common stock in this offering will be approximately $300.0 million, assuming an initial public offering price of $18 per share, which is the midpoint of the estimated price range set forth on the cover page of this prospectus, and after deducting estimated underwriting discounts and commissions and estimated offering expenses payable by us. We will not receive any proceeds from the sale of shares by the selling stockholders. |
| The Senior Secured Credit Facilities require that at least 25% of the net proceeds to the Company from this offering (up to $150.0 million) be applied to the prepayment of the Term Loan, which otherwise matures in November 2024. We intend to use up to $100 million of the net proceeds to the Company from the sale of shares in this offering to repay outstanding borrowings under the Term Loan. Any remaining proceeds not used to repay the outstanding borrowings will be used for working capital, capital expenditures and general corporate purposes, including, in our discretion, prepayment of obligations under the Receivables Financing Agreement. See “Use of Proceeds.” |
| Conflicts of interest |
Affiliates of Morgan Stanley & Co. LLC, one of the underwriters of this offering, are lenders under the Credit Agreement with Morgan Stanley Capital Administrators, Inc., as lender and administrative agent, UMB Bank N.A., as lender and revolver agent, and the other lenders party thereto. As a result of the repayment of a portion of the borrowed funds under the Term Loan using proceeds from this offering, Morgan Stanley & Co. LLC will indirectly receive more than 5% of the proceeds from this offering and will have a “conflict of interest” pursuant to FINRA Rule 5121(f)(5)(C)(i). Accordingly, this offering will be made in compliance with the applicable provisions of FINRA Rule 5121. As such, Morgan Stanley & Co. LLC will not confirm any sales to any account over which it exercises discretionary authority without the specific written approval of the transaction from the account holder. Pursuant to FINRA Rule 5121, a |
-17-
Table of Contents
| “qualified independent underwriter” (as defined in FINRA Rule 5121) must participate in the preparation of the prospectus and perform its usual standard of due diligence with respect to the prospectus. Credit Suisse Securities (USA) LLC has agreed to act as qualified independent underwriter for the offering and to perform a due diligence investigation and review and participate in the preparation of the prospectus. See “Underwriting (Conflicts of Interest).” |
| Dividend policy |
We do not anticipate declaring or paying any cash dividends on our capital stock in the foreseeable future. Instead, we anticipate that all of our future earnings will be retained to support our operations and finance the growth and development of our business. Any future determination to pay dividends on our common stock will be made by our Board of Directors and will depend upon our results of operations, financial condition, capital requirements, regulatory and contractual restrictions, our business strategy and other factors that our Board of Directors deems relevant. See “Dividend Policy.” |
| Risk factors |
You should read the “Risk Factors” section beginning on page 22 and the other information included in this prospectus for a discussion of factors to consider before deciding to invest in shares of our common stock. |
| Listing |
We intend to apply to list our common stock on the NYSE under the trading symbol “SLQT.” |
| Directed Share Program |
At our request, the underwriters have reserved up to 1,250,000 shares of common stock, or up to 5% of the shares of common stock offered by this prospectus for sale by the Company, at the initial public offering price, to directors, director nominees, officers, employees, business associates and related persons of SelectQuote, Inc. The sales will be made at our direction by Morgan Stanley & Co. LLC and its affiliates through a directed share program. If purchased by these persons, these shares will be subject to a 180-day lock-up restriction described in the “Shares Eligible for Future Sale” and “Underwriting (Conflicts of Interest)” sections of this prospectus. The number of shares of our common stock available for sale to the general public will be reduced to the extent these persons purchase such reserved shares. Any reserved shares of our common stock that are not so purchased will be offered by the underwriters to the general public on the same basis as the other shares of our common stock offered by this prospectus. |
The number of shares of our common stock to be outstanding after this offering is based on 144,650,597 shares of common stock issued and outstanding as of the date of this prospectus (assuming the automatic conversion of all outstanding shares of our Series A, B, C, D and E preferred stock into an aggregate of 52,404,685 shares of common stock upon the closing of this offering) and excludes:
| • | 4,095,968 shares of common stock issuable upon the exercise of options outstanding under our 2003 Stock Incentive Plan (the “2003 Stock Plan”) as of the date of this prospectus, with a weighted average exercise price of $1.03 per share; |
-18-
Table of Contents
| • | 9,600,000 shares of common stock that will become available for issuance pursuant to future awards in connection with this offering under the Company’s 2020 Omnibus Incentive Plan (the “2020 Plan”); and |
| • | 1,400,000 shares of common stock that will become available for issuance in connection with this offering under the Company’s ESPP. |
Except as otherwise noted, all information in this prospectus assumes:
| • | no exercise or forfeiture of the outstanding options described above; |
| • | an eight-for-one forward stock split of our common stock effected on February 28, 2020; and |
| • | the filing and effectiveness of our sixth amended and restated certificate of incorporation and amended and restated bylaws upon the closing of this offering. |
-19-
Table of Contents
SUMMARY HISTORICAL CONSOLIDATED FINANCIAL AND OPERATING DATA
The following tables present summary historical consolidated financial and operating data for our business as of the dates and for the periods indicated. The summary consolidated statements of operations data presented below for the fiscal years ended June 30, 2019 and June 30, 2018 and the summary consolidated balance sheet data as of June 30, 2019 and June 30, 2018 have been derived from our audited consolidated financial statements included elsewhere in this prospectus. The summary consolidated statements of operations data presented below for the nine month periods ended March 31, 2020 and March 31, 2019 and the summary consolidated balance sheet information as of March 31, 2020 have been derived from our unaudited condensed consolidated financial statements included elsewhere in this prospectus. Where applicable, all share and per share data for the periods shown have been adjusted, on a retroactive basis, to reflect an eight-for-one stock split, which became effective on February 28, 2020.
The summary consolidated historical financial and operating data is not necessarily indicative of the results to be expected in any future period. You should read the following summary historical financial and operating data in conjunction with the sections of this prospectus entitled “Selected Historical Consolidated Financial and Operating Data” and “Management’s Discussion and Analysis of Financial Condition and Results of Operations” and our audited and unaudited consolidated financial statements and related notes appearing at the end of this prospectus.
| Fiscal Year Ended June 30, |
Nine Months Ended March 31, |
|||||||||||||||
| (in thousands, except per share data) | 2019 | 2018 | 2020 | 2019 | ||||||||||||
| Statements of Operations Data: |
||||||||||||||||
| Revenue: |
||||||||||||||||
| Commission |
$ | 296,000 | $ | 206,611 | $ | 353,926 | $ | 231,003 | ||||||||
| Production bonus and other |
41,469 | 27,077 | 36,142 | 32,067 | ||||||||||||
|
|
|
|
|
|
|
|
|
|||||||||
| Total revenue |
337,469 | 233,688 | 390,068 | 263,070 | ||||||||||||
| Operating Costs and Expenses: |
||||||||||||||||
| Cost of revenue |
104,421 | 83,340 | 126,488 | 80,294 | ||||||||||||
| Marketing and advertising |
110,265 | 82,122 | 132,246 | 84,427 | ||||||||||||
| Technical development |
8,326 | 9,913 | 9,088 | 6,232 | ||||||||||||
| General and administrative |
15,864 | 12,349 | 25,779 | 13,095 | ||||||||||||
| Restructuring |
2,305 | 2,808 | — | — | ||||||||||||
|
|
|
|
|
|
|
|
|
|||||||||
| Total operating costs and expenses |
241,181 | 190,532 | 293,601 | 184,048 | ||||||||||||
|
|
|
|
|
|
|
|
|
|||||||||
| Income from operations |
96,288 | 43,156 | 96,467 | 79,022 | ||||||||||||
| Interest expense |
(1,660 | ) | (929 | ) | (16,239 | ) | (1,122 | ) | ||||||||
| Other expenses |
(15 | ) | (709 | ) | (20 | ) | (8 | ) | ||||||||
|
|
|
|
|
|
|
|
|
|||||||||
| Income before income tax expense |
94,613 | 41,518 | 80,208 | 77,892 | ||||||||||||
| Income tax expense |
22,034 | 6,619 | 19,110 | 18,200 | ||||||||||||
|
|
|
|
|
|
|
|
|
|||||||||
| Net income |
$ | 72,579 | $ | 34,899 | $ | 61,098 | $ | 59,692 | ||||||||
|
|
|
|
|
|
|
|
|
|||||||||
| Net income (loss) per share (1): |
||||||||||||||||
| Basic |
$ | 0.70 | $ | 0.27 | $ | (0.38 | ) | $ | 0.59 | |||||||
| Diluted |
$ | 0.55 | $ | 0.23 | $ | (0.38 | ) | $ | 0.45 | |||||||
| Weighted-average common stock outstanding (1): |
||||||||||||||||
| Basic |
85,378 | 81,314 | 89,989 | 84,976 | ||||||||||||
| Diluted |
132,491 | 96,421 | 89,989 | 132,976 | ||||||||||||
| Pro forma net income per share (1): |
||||||||||||||||
| Pro forma net income per share attributable to common shareholders (unaudited): |
||||||||||||||||
| Basic |
$ | 0.56 | $ | 0.46 | ||||||||||||
| Diluted |
$ | 0.55 | $ | 0.44 | ||||||||||||
| Pro forma weighted-average common stock outstanding (unaudited): |
||||||||||||||||
| Basic |
129,449 | 134,060 | ||||||||||||||
| Diluted |
132,491 | 138,206 | ||||||||||||||
| (1) | See Note 10 to our audited financial statements and Note 8 to our unaudited consolidated financial statements appearing at the end of this prospectus for an explanation of the method used to calculate historical and pro forma net income (loss) per share, basic and diluted, and the weighted-average number of shares used in the computation of the per share amounts. |
-20-
Table of Contents
| As of March 31, 2020 | As of June 30, 2019 |
As of June 30, 2018 |
||||||||||||||||||
| (in thousands) | Actual | Pro Forma (1) | Pro Forma As Adjusted (2) |
Actual | Actual | |||||||||||||||
| Balance Sheet Data: |
||||||||||||||||||||
| Cash, cash equivalents and restricted cash |
$ | 83,627 | $ | 212,627 | $ | 512,644 | $ | 570 | $ | 958 | ||||||||||
| Accounts receivable |
76,886 | 76,886 | 76,886 | 59,829 | 51,153 | |||||||||||||||
| Commissions receivable—current |
46,699 | 46,699 | 46,699 | 36,108 | 27,863 | |||||||||||||||
| Commissions receivable—net |
411,352 | 411,352 | 411,352 | 279,489 | 196,095 | |||||||||||||||
| Total assets |
661,661 | 790,661 | 1,090,678 | 406,940 | 297,557 | |||||||||||||||
| Total current liabilities |
57,045 | 57,045 | 57,045 | 33,222 | 24,283 | |||||||||||||||
| Debt |
411,054 | 411,054 | 411,054 | 11,032 | 19,752 | |||||||||||||||
| Non-recourse debt—net |
18,689 | 18,689 | 18,689 | 10,615 | — | |||||||||||||||
| Deferred income taxes |
100,369 | 100,369 | 100,369 | 81,252 | 59,614 | |||||||||||||||
| Total liabilities |
597,664 | 597,664 | 597,664 | 143,688 | 109,631 | |||||||||||||||
| Total temporary equity |
602 | — | — | 797 | 797 | |||||||||||||||
| Total shareholders’ equity |
$ | 63,395 | $ | 192,997 | $ | 493,014 | $ | 262,455 | $ | 187,129 | ||||||||||
| (1) | The pro forma balance sheet data give effect to the issuance and sale of 135,000 shares of our Series E preferred stock and related receipt of net proceeds of approximately $129.0 million subsequent to March 31, 2020 and the automatic conversion of all outstanding shares of our Series A, B, C, D and E preferred stock into an aggregate of 52,404,685 shares of common stock upon the closing of this offering. |
| (2) | The pro forma as adjusted balance sheet data give further effect to our issuance and sale of 18,000,000 shares of common stock in this offering at an assumed initial public offering price of $18 per share, which is the midpoint of the estimated price range set forth on the cover page of this prospectus, after deducting estimated underwriting discounts and commissions and estimated offering expenses payable by us. |
The pro forma as adjusted information discussed above is illustrative only and will change based on the actual initial public offering price, the number of common shares sold in this offering, and other terms of this offering determined at pricing.
| Fiscal Year Ended June 30, |
Nine Months Ended March 31, |
|||||||||||||||
| (in thousands, except for percentages and Senior Approved Policies) | 2019 | 2018 | 2020 | 2019 | ||||||||||||
| Other Unaudited Financial and Operating Data: |
||||||||||||||||
| Adjusted EBITDA (1) |
$ | 105,278 | $ | 49,926 | $ | 113,886 | $ | 85,759 | ||||||||
| Adjusted EBITDA Margin (1) |
31.2 | % | 21.4 | % | 29.2 | % | 32.6 | % | ||||||||
| Senior Approved Policies |
168,742 | 106,882 | 234,955 | 136,636 | ||||||||||||
| Life Premium |
$ | 89,966 | $ | 78,354 | $ | 74,240 | $ | 64,663 | ||||||||
| Auto & Home Premium |
$ | 56,719 | $ | 50,460 | $ | 48,925 | $ | 40,117 | ||||||||
| (1) | These financial measures are not calculated in accordance with GAAP. See “Selected Historical Consolidated Financial and Operating Data—Non-GAAP Financial Measures” and “Management’s Discussion and Analysis of Financial Condition and Results of Operations—Non-GAAP Financial Measures (Adjusted EBITDA)” in this prospectus for information regarding our use of these non-GAAP financial measures and a reconciliation of such measures to their nearest comparable financial measures calculated and presented in accordance with GAAP. |
-21-
Table of Contents
Investing in our common stock involves risks. You should carefully consider the risks and uncertainties described below, together with all of the other information included in this prospectus, including our financial statements and the related notes appearing at the end of this prospectus, before deciding to invest in our common stock. Our business, financial condition, operating results, cash flow and prospects could be materially and adversely affected by any of these risks or uncertainties. In that case, the trading price of our common stock could decline, and you could lose all or part of your investment. The risks and uncertainties described below are not the only ones we face. Additional risks and uncertainties that we are unaware of or that we currently see as immaterial may also adversely affect our business. Some statements in this prospectus, including statements in the following risk factors, constitute forward-looking statements. Please refer to “Cautionary Note Regarding Forward-Looking Statements.”
Risks Related to Our Business and Industry
Our business may be harmed if we lose our relationships with our insurance carrier partners or fail to develop new insurance carrier relationships.
Our contractual relationships with our insurance carrier partners, including those with whom we have carrier-branded sales arrangements, are typically non-exclusive and terminable on short notice by either party for any reason. Insurance carriers may be unwilling to allow us to sell their insurance products for a variety of reasons, including competitive or regulatory reasons, dissatisfaction with the insureds that we place with them or because they do not want to be associated with our brand. Additionally, in the future, an increasing number of insurance carriers may decide to rely on their own internal distribution channels, including traditional in-house agents and carrier websites, to sell their own products and, in turn, could limit or prohibit us from distributing their products.
If an insurance carrier partner is not satisfied with our services, it could cause us to incur additional costs and impair profitability. Moreover, if we fail to meet our contractual obligations to our insurance carrier partners, we could be subject to legal liability or loss of carrier relationships. In addition, these claims against us may produce publicity that could hurt our reputation and business and adversely affect our ability to retain business or secure new business with other insurance carriers.
We may decide to terminate our relationship with an insurance carrier partner for a number of reasons and the termination of our relationship with an insurance carrier could reduce the variety of insurance products we distribute. In connection with such a termination, we would lose a source of commissions for future sales, and, in a limited number of cases, future commissions for past sales. Our business could also be harmed if in the future we fail to develop new insurance carrier relationships or offer consumers a wide variety of insurance products.
We also may lose the ability to market and sell Medicare plans for our Medicare plan insurance carrier partners. The regulations for selling senior health insurance are complex and can change. If we or our agents violate any of the requirements imposed by the CMS, state laws or regulations, an insurance carrier may terminate our relationship or CMS may penalize an insurance carrier by suspending or terminating that carrier’s ability to market and sell Medicare plans. Because the Medicare products we sell are sourced from a small number of insurance carriers, if we lose the ability to market one of those insurance carriers’ Medicare plans, even temporarily, or if one of those insurance carriers loses its Medicare product membership, our business, operating results, financial condition and prospects could be harmed.
We currently depend on a small group of insurance carrier partners for a substantial portion of our business. If we are dependent on a limited number of insurance carrier partners, our business and financial condition may be adversely affected.
We derive a large portion of our revenues from a limited number of insurance carrier partners. For example, carriers owned by Humana, UnitedHealthcare and Aetna accounted for 23%, 14% and 12%, respectively, of our
-22-
Table of Contents
total revenue for fiscal 2019 and carriers owned by Humana, Prudential and UnitedHealthcare accounted for 14%, 13% and 13%, respectively, of our total revenue for fiscal 2018. Carriers owned by UnitedHealthcare, Humana and Aetna accounted for 27%, 19% and 13%, respectively, of our total revenue for the nine month period ended March 31, 2020, and carriers owned by Humana, UnitedHealthcare and Aetna accounted for 24%, 14% and 13%, respectively, of our total revenue for the nine month period ended March 31, 2019. Our agreements with our insurance carrier partners to sell policies are typically terminable by our insurance carrier partners without cause upon 30 days’ advance notice. Should we become dependent on fewer insurance carrier relationships (whether as a result of the termination of insurance carrier relationships, insurance carrier consolidation or otherwise), we may become more vulnerable to adverse changes in our relationships with insurance carriers, particularly in states where we distribute insurance from a relatively smaller number of insurance carrier partners or where a small number of insurance carriers dominates the market, and our business, operating results, financial condition and prospects could be harmed.
Changes in the health insurance market or in the variety, quality and affordability of the insurance products offered by our insurance carrier partners could harm our business, operating results, financial condition and prospects.
The demand for our agency services is impacted by the variety, quality and price of the insurance products we distribute. If insurance carriers do not continue to provide us with a variety of high-quality, affordable insurance products, or if as a result of consolidation in the insurance industry or otherwise their offerings are limited, our sales may decrease and our business, operating results, financial condition and prospects could be harmed.
Our insurance carrier partners could determine to reduce the commissions paid to us and change their underwriting practices in ways that reduce the number of, or impact the renewal or approval rates of, insurance policies sold through our distribution platform, which could harm our business, operating results, financial condition and prospects.
Our commission rates from our insurance carrier partners are either set by each carrier or negotiated between us and each carrier. Our insurance carrier partners have the right to alter these commission rates with relatively short notice and have altered, and may in the future alter, the contractual relationships we have with them, including in certain instances by unilateral amendment of our contracts relating to commissions or otherwise. Changes of this nature could result in reduced commissions or impact our relationship with such carriers. In addition, insurance carriers periodically change the criteria they use for determining whether they are willing to insure individuals. Future changes in insurance carrier underwriting criteria could negatively impact sales of, or the renewal or approval rates of, insurance policies on our distribution platform and could harm our business, operating results, financial condition and prospects.
Insurance carriers can offer products and services directly to consumers or through our competitors.
Because we do not have exclusive relationships with our insurance carrier partners, consumers may obtain quotes for, and purchase, the same insurance policies that we distribute directly from the issuers of those policies, or from our competitors. Insurance carriers can attract consumers directly through their own marketing campaigns or other methods of distribution, such as referral arrangements, internet sites, physical storefront operations or broker agreements. Furthermore, our insurance carrier partners could discontinue distributing their products through our agency services, which would reduce the breadth of the products we distribute and could put us at a competitive disadvantage. If consumers seek insurance policies directly from insurance carriers or through our competitors, the number of consumers shopping for insurance through our platform may decline, and our business, operating results, financial condition and prospects could be materially and adversely affected.
-23-
Table of Contents
Pressure from existing and new competitors may adversely affect our business and operating results, financial condition and prospects.
Our competitors provide services designed to help consumers shop for insurance. Some of these competitors include:
| • | companies that operate insurance search websites or websites that provide quote information or the opportunity to purchase insurance products online; |
| • | individual insurance carriers, including through the operation of their own websites, physical storefront operations and broker arrangements; |
| • | traditional insurance agents or brokers; and |
| • | field marketing organizations. |
New competitors may enter the market for the distribution of insurance products with competing insurance distribution platforms, which could have an adverse effect on our business, operating results, financial condition and prospects. Our competitors could significantly impede our ability to maintain or increase the number of policies sold through our distribution platform and may develop and market new technologies that render our platform less competitive or obsolete. In addition, if our competitors develop distribution platforms with similar or superior functionality to ours and we are not able to produce certain volumes for our insurance carrier partners, we may see a reduction in our production bonuses or marketing payments and our revenue would likely be reduced and our financial results would be adversely affected.
Our business may be harmed by competition from government-run health insurance exchanges.
Our Senior segment competes with government-run health insurance exchanges with respect to our sale of Medicare-related health insurance. Potential and existing customers can shop for and purchase Medicare Advantage and Medicare Part D Prescription Drug plans through a website operated by the federal government and can also obtain plan selection assistance from the federal government in connection with their purchase of a Medicare Advantage and Medicare Part D Prescription Drug plan. Competition from government-run health insurance exchanges could increase our marketing costs, reduce our revenue and could otherwise harm our business, operating results, financial condition and prospects.
Our business is substantially dependent on revenue from our Senior health insurance carrier partners and subject to risks related to Senior health insurance and the larger health insurance industry. Our business may also be adversely affected by downturns in the life, automotive and home insurance industries.
A majority of the insurance purchased through our platform and agency services is Senior health insurance and our financial prospects depend significantly on growing demand in an aging population for the Senior health products we provide. Our overall operating results are substantially dependent upon our success in our Senior segment. For fiscal 2019 and fiscal 2018, 57% and 44%, respectively, of our total revenue was derived from our Senior segment. For the nine month periods ended March 31, 2020 and 2019, 70% and 60%, respectively, of our total revenue was derived from our Senior segment. For fiscal 2019, our top three insurance carrier partners by total revenue were from the Senior segment. For fiscal 2018, two of our top three insurance carrier partners were from the Senior segment and one was from the Life segment. For each of the nine month periods ended March 31, 2020 and 2019, our top three insurance carrier partners by total revenue were from the Senior segment. Our success in the Senior health insurance market will depend upon a number of additional factors, including:
| • | our ability to continue to adapt our distribution platform to market Medicare plans, including the effective modification of our agent-facing tools that facilitate the consumer experience; |
| • | our success in marketing directly to Medicare-eligible individuals and in entering into marketing partner relationships to secure cost-effective leads and referrals for Medicare plan sales; |
-24-
Table of Contents
| • | our ability to retain partnerships with enough insurance carriers offering Medicare products to maintain our value proposition with consumers; |
| • | our ability to leverage technology in order to sell, and otherwise become more efficient at selling, Medicare-related plans over the telephone; |
| • | reliance on third-party technology vendors like our voice-over IP telephone service providers and our data center and cloud computing partners; |
| • | our ability to comply with numerous, complex and changing laws and regulations and CMS guidelines relating to the marketing and sale of Medicare plans; and |
| • | the effectiveness of our competitors’ marketing of Medicare plans. |
These factors could prevent our Senior segment from successfully marketing and selling Medicare plans, which would harm our business, operating results, financial condition and prospects. We are also dependent upon the economic success of the life, automotive and home insurance industries. Declines in demand for life, automotive and home insurance could cause fewer consumers to shop for such policies using our distribution platform. Downturns in any of these markets, which could be caused by a downturn in the economy at large, could materially and adversely affect our business, operating results, financial condition and prospects.
Systemic changes in our insurance carrier partners’ sales strategies could adversely affect our business.
Our business model relies on our ability to sell policies on behalf of our insurance carrier partners. We believe our insurance carrier partners view our method of acquiring customers as scalable and efficient and, ultimately, as cost advantageous compared to their own direct distribution or proprietary agent models. However, in the event that our insurance carrier partners choose to make systemic changes in the manner in which their policies are distributed, including by focusing on direct distribution themselves or on distribution channels other than ours, such changes could materially and adversely affect our business, operating results, financial condition and prospects.
Changes and developments in the regulation of the healthcare industry could adversely affect our business.
The U.S. healthcare industry is subject to an evolving regulatory regime at both the federal and state levels. In recent years, there have been multiple reform efforts made within the healthcare industry in an effort to curtail healthcare costs. For example, the Patient Protection and Affordable Care Act of 2010 (the “PPACA”) and related regulatory reforms have materially changed the regulation of health insurance. Changes to healthcare and insurance regulation arising from the effects of the COVID-19 pandemic may be possible. While it is difficult to determine the impact of potential reforms on our future business, it is possible that such changes in healthcare industry regulation could result in reduced demand for our insurance distribution services. Our insurance carrier partners may react to existing or future reforms, or general regulatory uncertainty, by reducing their reliance on our agents. Developments of this type could materially and adversely affect our business, operating results, financial condition and prospects.
Changes and developments in the health insurance system and laws and regulations governing the health insurance markets in the United States could materially and adversely affect our business, operating results, financial condition and prospects.
Our Senior segment depends upon the private sector of the U.S. insurance system, which is subject to rapidly evolving regulation. Accordingly, the future financial performance of our Senior segment will depend in part on our ability to adapt to regulatory developments. For example, healthcare reform could lead to increased competition in our industry and the number of consumers shopping for insurance through our agents may decline. Various aspects of healthcare reform could also cause insurance carriers to discontinue certain health insurance products or prohibit us from distributing certain health insurance products in particular jurisdictions. Our Senior segment, operating results, financial condition and prospects may be materially and adversely affected if we are unable to adapt to developments in healthcare reform in the United States.
-25-
Table of Contents
Healthcare laws and regulations are rapidly evolving and may change significantly in the future, impacting the coverage and plan designs that are or will be provided by certain insurance carriers. Health reform efforts and measures may expand the role of government-sponsored coverage, including single payer or so called “Medicare-for-All” proposals, which could have far-reaching implications for the insurance industry if enacted. Government regulation may change in response to the COVID-19 pandemic, which may have an adverse effect on our business. We are unable to predict the full impact of healthcare reform initiatives on our operations in light of the uncertainty regarding the terms and timing of any provisions enacted and the impact of any of those provisions on various healthcare and insurance industry participants. In particular, because our DTC platform provides consumers with a venue to shop for insurance policies from a curated panel of the nation’s leading insurance carriers, the expansion of government-sponsored coverage through “Medicare-for-All” or the implantation of a single payer system may adversely impact our business.
If we are unable to develop new offerings, achieve increased consumer adoption of those offerings or penetrate new vertical markets, our business, operating results, financial condition and prospects could be materially and adversely affected.
Our continued improvement of our product and service offerings is critical to our success. Accordingly, we must continually invest resources in product, technology and development in order to improve the comprehensiveness and effectiveness of our distribution platform.
In addition, while we have historically concentrated our efforts on the senior health, life and personal property and casualty insurance markets, our growth strategy includes penetrating additional vertical markets, such as final expense insurance and other insurance or financial service products. In order to penetrate new vertical markets successfully, it will be necessary to develop an understanding of those new markets and the associated risks, which may require substantial investments of time and resources, and even then we may not be successful and, as a result, our revenue may grow at a slower rate than we anticipate and our operating results, financial condition and prospects could be materially and adversely affected.
Risks from third-party products could adversely affect our businesses.
We offer third-party products, including senior health, life, automotive and home insurance products. Insurance involves a transfer of risk and our reputation may be harmed and we may become a target for litigation if risk is not transferred in the way expected by customers and carriers. In addition, if these insurance products do not generate competitive risk-adjusted returns that satisfy our insurance carrier partners, it may be difficult to maintain existing business with, and attract new business from, them. Significant declines in the performance of these third-party products could subject us to reputational damage and litigation risk.
If our ability to enroll individuals during AEP and OEP is impeded, our business will be harmed.
In general, approximately 50% of our Medicare Advantage and Medicare Supplement policies are submitted during AEP. Our agents, systems and processes must handle an increased volume of transactions that occur during AEP and OEP. We hire additional flex agents during these periods to address this expected increase in transaction volume and temporarily reassign agents from our Senior business to our Life and Auto & Home businesses during non-AEP/OEP periods. We must ensure that our year-round and flex agents are trained and have received all licenses, appointments and certifications required by state authorities and our insurance carrier partners before the beginning of AEP and OEP. If the relevant state authorities or our insurance carrier partners experience shutdowns or continued business disruptions due to the COVID-19 pandemic, we may be unable to secure these required licenses, appointments and certifications for our agents in a timely manner, or at all. If technology failures, any inability to timely employ, license, train, certify and retain our employees to sell senior health insurance, interruptions in the operation of our systems, issues with government-run health insurance exchanges, weather-related events that prevent our employees from coming to our offices, or any other circumstances prevent our senior health business from operating as expected during an enrollment period, we could sell fewer policies and suffer a reduction in our business and our operating results, financial condition, prospects and profitability could be materially and adversely affected.
-26-
Table of Contents
We recently implemented a work-from-home policy in response to the “shelter in place” and similar orders issued by the states, counties and cities in which we maintain facilities as a result of the COVID-19 pandemic. It may be more difficult for us to manage and monitor our agents in a remote environment and we may need to expend more management time and devote more resources and costs to do so. Working at home, while at times seamless with our technology, may prevent agents from selling policies as efficiently as they could in an office environment. If our agents are not able to effectively work from home, we may not be able to sell as many policies which could have an adverse effect on our business, financial condition and results of operations.
If we are unable to attract, integrate and retain qualified personnel, our ability to develop and successfully grow our business could be harmed.
Our business depends on our ability to retain our key executives and management and to hire, develop and retain qualified agents and enrollment and consumer service specialists. Our ability to expand our business depends on our being able to hire, train and retain sufficient numbers of employees to staff our in-house sales centers, as well as other personnel. Our success in recruiting highly skilled and qualified personnel can depend on factors outside of our control, including the strength of the general economy and local employment markets and the availability of alternative forms of employment. Furthermore, the spread of COVID-19 may materially and adversely affect our ability to recruit and retain personnel. During periods when we are unable to recruit high-performing agents and enrollment and consumer service specialists, we tend to experience higher turnover rates. The productivity of our agents and enrollment and consumer service specialists is influenced by their average tenure. Without qualified individuals to serve in consumer facing roles, we may produce less commission revenue, which could have a material and adverse effect on our business, operating results, financial condition and prospects. If the services of any of our key personnel should become unavailable for any reason, we may not be able to identify and hire qualified persons on terms acceptable to us, which could have a material and adverse effect on our business, operating results, financial condition and prospects.
Our business is dependent on our obtaining a large quantity of quality insurance sales leads in a cost-effective manner.
Our business requires access to a large quantity of quality insurance sales leads to keep our agents productive. We are dependent upon a number of lead suppliers from whom we obtain leads to support our sales of insurance policies. The loss of one or more of these lead suppliers, or our failure to otherwise compete to secure quality insurance sales leads, could significantly limit our ability to access our target market for selling policies.
We may not be able to compete successfully for high quality leads against our current or future competitors, some of whom have significantly greater financial, technical, marketing and other resources than we do. If we fail to compete successfully with our competitors to source sales leads from lead suppliers, we may experience increased marketing costs and loss of market share and our business and profitability could be materially and adversely affected.
Our business depends on our ability to convert sales leads to actual sales of insurance policies. If our conversion rate does not meet expectations, our business may be adversely affected.
Obtaining quality insurance sales leads is important to our business, but our ability to convert our leads to policy sales is also a key to our success. Many factors impact our conversion rate, including the quality of our leads, agents and our proprietary workflow technology. If lead quality diminishes, our conversion rates will be adversely affected. Competition in the marketplace and lead quality affect conversion rates. If competition for customers increases, our conversion rates may decline, even absent a degradation in lead quality. Our conversion rates are also affected by agent tenure. If agent turnover increases, leading to a decline in the average tenure of our agents, conversion rates may be adversely affected. If we are unable to recruit, train and retain talented agents, our ability to successfully convert sales leads may be adversely impacted. Our conversion rates may also
-27-
Table of Contents
be affected by issues with our workflow technology or problems with our algorithms that drive lead scoring and routing. Any adverse impact on our conversion rates could cause a material and adverse effect on our business, operating results, financial condition and prospects.
We rely on data provided to us by consumers and our insurance carrier partners to improve our technology and service offerings, and if we are unable to maintain or grow such data, we may be unable to provide consumers with an insurance shopping experience that is relevant, efficient and effective, which could adversely affect our business.
Our business relies on the data provided to us by consumers and our insurance carrier partners in addition to third-party lead suppliers. The large amount of information we use in operating our platform is critical to the insurance shopping experience we provide for consumers. If we are unable to maintain or effectively utilize the data provided to us, the value that we provide to consumers and our insurance carrier partners may be limited. In addition, the quality, accuracy and timeliness of this information may suffer, which may lead to a negative insurance shopping experience for consumers using our platform and could materially and adversely affect our business, operating results, financial condition and prospects.
We have made substantial investments into our technology systems that support our business with the goal of enabling us to provide efficient, needs-based services to consumers using data analytics. We cannot assure you that we will be able to continually collect and retain sufficient data, or improve our data technologies to satisfy our operating needs. Failure to do so could materially and adversely affect our business, operating results, financial condition and prospects.
Our ability to match consumers to insurance products that suit their needs is dependent upon their provision of accurate information during the insurance shopping process.
Our business depends on consumers’ provision of accurate information during the insurance shopping process. To the extent consumers provide us with inaccurate information, the quality of their insurance shopping experience may suffer and we may be unable to match them with insurance products that suit their needs. Our inability to suggest suitable insurance products to consumers could lead to an increase in the number of policies we submit to carriers that are ultimately rejected and could materially and adversely affect our business, operating results, financial condition and prospects.
We depend upon internet search engines to attract a significant portion of the consumers who visit our website, and if we are unable to effectively advertise on search engines on a cost-effective basis our business, operating results, financial condition and prospects could be harmed.
We derive a significant portion of our website traffic from consumers who search for health insurance through internet search engines, such as Google, Yahoo! and Bing. A critical factor in attracting consumers to our website is whether we are prominently displayed in response to certain internet searches. Search engines typically provide two types of search results, algorithmic listings and paid advertisements. We rely on both to attract consumers to our websites.
Algorithmic search result listings are determined and displayed in accordance with a set of formulas or algorithms developed by the particular internet search engine. Once a search is initiated by a consumer, the algorithms determine the hierarchy of results. Search engines may revise these algorithms from time to time, which could cause our website to be listed less prominently in algorithmic search results and lead to decreased traffic to our website. We may also be listed less prominently as a result of other factors, such as new websites, changes we make to our website or technical issues with the search engine itself. Government health insurance exchange websites have historically appeared prominently in algorithmic search results. In addition, search engines have deemed the practices of some companies to be inconsistent with search engine guidelines and decided not to list their website in search result listings at all. If we are listed less prominently in, or removed
-28-
Table of Contents
altogether from, search result listings for any reason, the traffic to our websites would decline and we may not be able to replace this traffic. An attempt to replace this traffic may require us to increase our marketing expenditures, which would also increase our cost of customer acquisition and harm our business, operating results, financial condition and prospects.
In addition to relying on algorithmic search results, we also purchase paid advertisements on search engines in order to attract consumers to our website. We typically pay a search engine for prominent placement of our website when particular terms are searched for on the search engine, without regard to the algorithmic search result listings. The prominence of the placement of our advertisement is determined by multiple factors, including the amount paid for the advertisement and the search engine’s algorithms that determine the relevance of paid advertisements to a particular search term. If the search engine revises its algorithms relevant to paid advertisements then websites other than our platform may become better suited for the algorithms, which may result in our having to pay increased costs to maintain our paid advertisement placement in response to a particular search term. We could also have to pay increased amounts should major search engines continue to become more concentrated. Additionally, we bid against our competitors, insurance carriers, government health insurance exchanges and others for the display of these paid search engine advertisements, which competition increases substantially during the enrollment periods for Medicare products as it relates to our Senior segment. The competition has increased the cost of paid advertising and has increased our marketing and advertising expenses. If paid search advertising costs increase or become cost prohibitive, whether as a result of competition, algorithm changes or otherwise, our advertising expenses could materially increase or we could reduce or discontinue our paid search advertisements, either of which would harm our business, operating results, financial condition and prospects.
Our business could be harmed if we are unable to contact consumers or market the availability of our products by telephone.
Telephone calls from our sales centers may be blocked by or subject to consumer warnings from telephone carriers. Furthermore, our telephone messages to existing or potential customers may not be reliably received due to those consumers’ call screening practices. If we are unable to communicate effectively by telephone with our existing and potential customers as a result of legislation, blockage, screening technologies or otherwise, our business, operating results, financial condition and prospects could be harmed. We are also subject to compliance with significant regulations that may affect how we are able to communicate with consumers. See “—Our communications with potential and existing customers are subject to laws regulating telephone and email marketing practices” in this section.
Global economic conditions could materially and adversely affect our revenue and results of operations.
Our business has been and may continue to be affected by a number of factors that are beyond our control, such as general geopolitical, economic and business conditions, conditions in the financial markets and the effects of the COVID-19 pandemic. A severe or prolonged economic downturn could adversely affect consumers’ financial condition and the demand for insurance products.
We are also exposed to risks associated with the potential financial instability of our insurance carrier partners and consumers, many of whom may be adversely affected by volatile conditions in the financial markets or an economic slowdown. As a result of uncertainties with respect to financial institutions and the global credit markets and other macroeconomic challenges currently or potentially affecting the economy of the U.S. and other parts of the world, consumers may experience serious cash flow problems and other financial difficulties, decreasing demand for the products of our insurance carrier partners. In addition, events in the U.S. or foreign markets, such as the U.K.’s exit from the European Union, and political and social unrest in various countries around the world, can impact the global economy and capital markets. Our insurance carrier partners may modify, delay, or cancel plans to offer new products or may make changes in the mix of products purchased that are unfavorable to us. Additionally, if our insurance carrier partners are not successful in generating sufficient revenue or are precluded from securing financing, their businesses will suffer, which may materially and adversely affect our business, operating results, financial condition and prospects.
-29-
Table of Contents
In addition, we are susceptible to risks associated with the potential financial instability of the vendors on which we rely to provide services or to whom we delegate certain functions. The same conditions that may affect consumers also could adversely affect our vendors, causing them to significantly and quickly increase their prices or reduce their output. Our business depends on our ability to perform, in an efficient and uninterrupted fashion, our necessary business functions, and any interruption in the services provided by third parties could also adversely affect our business, operating results and financial condition.
The COVID-19 pandemic could adversely affect our business, operating results and financial condition.
In December 2019, a novel strain of coronavirus, COVID-19, was reported in Wuhan, China. COVID-19 has since spread rapidly to other countries, including the United States, and the World Health Organization formally declared the COVID-19 outbreak a pandemic in March 2020. We are still assessing the effect that COVID-19 may have on our ability to effectively conduct our business operations as planned and there can be no assurance that we will be able to avoid a material effect on our business from the spread of COVID-19 or its consequences. For example, as a result of “shelter in place” and similar orders in the states, counties and cities in which we maintain facilities, all of our employees are currently working remotely, which could cause operational difficulties and impair our ability to manage our business. In addition, our insurance carrier partners and our vendors are similarly adjusting their operations in light of the COVID-19 pandemic. If our insurance carrier partners or our vendors experience shutdowns or continued business disruptions, our ability to conduct our business operations as planned could be materially and negatively affected. For example, our insurance carrier partners may experience delays in the underwriting process, and those delays could affect our ability to timely bind and sell policies. Furthermore, our business, operating results and financial condition could be adversely affected if, as a result of the macro-economic effects of the COVID-19 pandemic, demand for the insurance products we sell on behalf of our insurance carrier partners declines, our insurance carrier partners seek to renegotiate their commission arrangements with us or the policyholders to whom we have sold policies stop making their premium payments.
The extent to which the COVID-19 outbreak affects our business will depend on future developments in the United States and around the world, which are highly uncertain and cannot be predicted, including new information which may emerge concerning the severity of the coronavirus and the actions required to contain and treat it, among others. Although the extent of the effect of the COVID-19 pandemic on our business and financial results is uncertain, the effects of a continued and prolonged public health crisis such as the COVID-19 pandemic could have a material negative impact on our business, operating results and financial condition.
We may acquire other companies or technologies, which could divert our management’s attention, result in additional dilution to our stockholders and otherwise disrupt our operations and harm our operating results, financial condition and prospects.
We may determine to grow our business through the acquisition of complementary businesses and technologies rather than through internal development. The identification of suitable acquisition candidates can be difficult, time-consuming and costly, and we may not be able to successfully complete identified acquisitions or the acquisitions may cause diversion of management time and focus away from operating our business. Following any acquisition, we may face difficulty integrating technology, finance and accounting, research and development, human resources, consumer information, and sales and marketing functions; challenges retaining acquired employees; future write-offs of intangibles or other assets; and potential litigation, claims or other known and unknown liabilities.
Depending on the condition of any company or technology we may acquire, that acquisition may, at least in the near term, adversely affect our financial condition and operating results and, if not successfully integrated with our organization, may continue to have such effects over a longer period. We may not realize the anticipated benefits of any acquisitions and we may not be successful in overcoming these risks or any other problems encountered in connection with potential acquisitions. Our inability to overcome these risks could have an
-30-
Table of Contents
adverse effect on our profitability, return on equity and return on assets, our ability to implement our business strategy and enhance stockholder value, which, in turn, could have a material and adverse effect on our business, operating results, financial condition and prospects.
Future acquisitions also could result in dilutive issuances of our equity securities and the incurrence of debt, which could harm our financial condition.
We are required to make significant estimates and assumptions in the preparation of our financial statements. These estimates and assumptions may not be accurate and are subject to change.
The preparation of our consolidated financial statements in conformity with GAAP requires our management to make significant estimates and assumptions that affect the reported amounts of assets and liabilities and disclosures of contingent assets and liabilities at the date of the consolidated financial statements, and the reported amounts of income and expense during the reporting periods. If our underlying estimates and assumptions prove to be incorrect or if events occur that require us to revise our previous estimates or assumptions, our business, operating results, financial condition and prospects may be materially and adversely affected.
If the goodwill that we record in connection with a business acquisition becomes impaired, it could require charges to earnings, which would have a negative impact on our business, operating results, financial condition and prospects.
Goodwill represents the amount by which the purchase price exceeds the fair value of net assets we acquire in a business combination. We review goodwill for impairment at least annually, or more frequently if events or changes in circumstances indicate the carrying value of the asset might be impaired. At March 31, 2020, our goodwill totaled $5.4 million. Although we have not recorded any impairment charges since we initially recorded the goodwill, our future evaluations of goodwill may result in findings of impairment and related impairment losses, which could have a material and adverse effect on our business, operating results, financial condition and prospects.
We may from time to time be subject to litigation, which may be extremely costly to defend, could result in substantial judgment or settlement costs or subject us to other remedies.
We are currently not a party to any material legal proceedings. From time to time, however, we may be involved in various legal proceedings, including, but not limited to, actions relating to breach of contract and intellectual property infringement or misappropriation. Claims may be expensive to defend and may divert management’s time away from our operations, regardless of whether they are meritorious or ultimately lead to a judgment against us. We cannot assure you that we will be able to successfully defend or resolve any current or future litigation matters, in which case those litigation matters could have a material and adverse effect on our business, operating results, financial condition and prospects.
Our existing and any future indebtedness could adversely affect our ability to operate our business.
As of June 30, 2019, we had $11.0 million of outstanding borrowings under a two-year Loan and Security Agreement (the “Loan and Security Agreement”) with UMB Bank N.A. Subsequently, on November 5, 2019, we terminated the Loan and Security Agreement and entered into the Senior Secured Credit Facilities, consisting of (i) a senior secured term loan facility in an aggregate principal amount of $425.0 million and (ii) a $75.0 million senior secured revolving credit facility. See “Description of Certain Indebtedness.” We used the proceeds of the Term Loan to make the Distribution and for general corporate purposes. The Revolving Credit Facility is available for general corporate purposes. A portion of the proceeds from this offering are required to be used to repay outstanding borrowings under the Term Loan. We could in the future incur additional indebtedness.
-31-
Table of Contents
Affiliates of Morgan Stanley & Co. LLC, one of the underwriters of this offering, are lenders under our Credit Agreement. As a result of the repayment of a portion of the borrowed funds under the Term Loan using proceeds from this offering, Morgan Stanley & Co. LLC will indirectly receive more than 5% of the proceeds from this offering and will have a “conflict of interest” pursuant to FINRA Rule 5121(f)(5)(C)(i). See “Underwriting (Conflicts of Interest)” for more information.
Our indebtedness could have important consequences, including:
| • | requiring us to dedicate a substantial portion of our cash flow to payments on our indebtedness, which would reduce the amount of cash flow available to fund working capital, capital expenditures or other corporate purposes; |
| • | increasing our vulnerability to general adverse economic, industry and market conditions; |
| • | subjecting us to restrictive covenants, including restrictions on our ability to pay dividends and requiring the pledge of substantially all of our assets as collateral under our Senior Secured Credit Facilities, that may reduce our ability to take certain corporate actions or obtain further debt or equity financing; |
| • | limiting our ability to plan for and respond to business opportunities or changes in our business or industry; and |
| • | placing us at a competitive disadvantage compared to our competitors that have less debt or better debt servicing options. |
In addition, our indebtedness under the Senior Secured Credit Facilities bears interest at a variable rate, making us vulnerable to increases in the market rate of interest. If the market rate of interest increases substantially, we will have to pay additional interest on this indebtedness, which would reduce cash available for our other business needs. From time to time, we may enter into interest rate swaps that involve the exchange of floating for fixed rate interest payments in order to reduce interest rate volatility. However, we may not maintain interest rate swaps with respect to all or any of our variable rate indebtedness, and any swaps we enter into may not fully mitigate our interest rate risk.
Failure to make payments or comply with other covenants under our existing debt instruments could result in an event of default. If an event of default occurs and the lender accelerates the amounts due, we may need to seek additional financing, which may not be available on acceptable terms, in a timely manner or at all. In such event, we may not be able to make accelerated payments, and the lender could seek to enforce security interests in the collateral securing such indebtedness, which includes substantially all of our assets.
Developments with respect to LIBOR may affect our borrowings under our credit facilities.
Regulators and law enforcement agencies in the U.K. and elsewhere are conducting civil and criminal investigations into whether the banks that contribute to the British Bankers’ Association (“BBA”) in connection with the calculation of daily LIBOR may have been under-reporting or otherwise manipulating or attempting to manipulate LIBOR. A number of BBA member banks have entered into settlements with their regulators and law enforcement agencies with respect to this alleged manipulation of LIBOR. Actions by the BBA, regulators or law enforcement agencies may result in changes to the manner in which LIBOR is determined or the establishment of alternative reference rates. For example, on July 27, 2017, the U.K. Financial Conduct Authority announced that it intends to stop persuading or compelling banks to submit LIBOR quotes after 2021.
The Credit Agreement governing our Senior Secured Credit Facilities provides that interest may be based on LIBOR and for the use of an alternate rate to LIBOR in the event LIBOR is phased-out; however, uncertainty remains as to any such replacement rate and any such replacement rate may be higher or lower than LIBOR may have been. The establishment of alternative reference rates or implementation of any other potential changes could have a material adverse effect on our existing facilities, our interest rate swap agreements or our future debt linked to such a reference rate and may materially and adversely affect our business, operating results, financial condition and prospects.
-32-
Table of Contents
Operating and growing our business may require additional capital, and if capital is not available to us, our business, operating results, financial condition and prospects may suffer.
Operating and growing our business is expected to require further investments in our technology and operations. We may be presented with opportunities that we want to pursue, and unforeseen challenges may present themselves, any of which could cause us to require additional capital. Our business model does not require us to hold a significant amount of cash and cash equivalents at any given time and if our cash needs exceed our expectations or we experience rapid growth, we could experience strain in our cash flow, which could adversely affect our operations in the event we were unable to obtain other sources of liquidity. If we seek to raise funds through equity or debt financing, those funds may prove to be unavailable, may only be available on terms that are not acceptable to us or may result in significant dilution to you or higher levels of leverage. If we are unable to obtain adequate financing or financing on terms satisfactory to us, when we require it, our ability to continue to pursue our business objectives and to respond to business opportunities, challenges or unforeseen circumstances could be significantly limited, and our business, operating results, financial condition and prospects could be materially and adversely affected.
If we fail to protect our brand, our ability to expand the use of our agency services by consumers may be adversely affected.
Maintaining strong brand recognition and a reputation for delivering value to consumers is important to our business. A failure by us to protect our brand and deliver on these expectations could harm our reputation and damage our ability to attract and retain customers, which could adversely affect our business. In addition, many of our competitors have more resources than we do and can spend more advertising their brands and services. Accordingly, we could be forced to incur greater expense marketing our brand in the future to preserve our position in the market and, even with such greater expense, may not be successful in doing so. Furthermore, complaints or negative publicity about our business practices, legal compliance, marketing and advertising campaigns, data privacy and security issues and other aspects of our business, whether valid or not, could damage our reputation and brand. If we are unable to maintain or enhance consumer awareness of our brand cost-effectively, our business, operating results, financial condition and prospects could be materially and adversely affected.
Seasonality may cause fluctuations in our financial results.
As a result of AEP occurring from October 15th to December 7th and OEP occurring from January 1st to March 31st, we experience an increase in the number of submitted Medicare-related applications during the first and fourth quarters of the calendar year and an increase in Medicare plan related expense during the third and fourth quarters of the calendar year. Accordingly, our financial results are not comparable from quarter to quarter. In addition, changes to the timing of the Medicare annual or open enrollment periods could result in changes in the cyclical nature of consumer demand for Medicare products, to which our Senior segment may not be able to adapt. If our Senior segment cannot successfully respond to changes in the seasonality of the Medicare business, our business, operating results, financial condition and prospects could be harmed.
We rely on our insurance carrier partners to prepare accurate commission reports and send them to us in a timely manner.
Our insurance carrier partners typically pay us a specified percentage of the premium amount collected by the carrier or a flat rate per policy during the period that a customer maintains coverage under a policy. We rely on carriers to report the amount of commissions we earn accurately and on time. We use carriers’ commission reports to calculate our revenue, prepare our financial reports, projections and budgets and direct our marketing and other operating efforts. It is often difficult for us to independently determine whether or not carriers are reporting all commissions due to us, primarily because the majority of the purchasers of our insurance products who terminate their policies do so by discontinuing their premium payments to the carrier instead of by
-33-
Table of Contents
informing us of the cancellation. To the extent that carriers inaccurately or belatedly report the amount of commissions due to us, we may not be able to collect and recognize revenue to which we are entitled, which would harm our business, operating results, financial condition and prospects. In addition, the technological connections of our systems with the carriers’ systems that provide us up-to-date information about coverage and commissions could fail or carriers could cease providing us with access to this information, which could impede our ability to compile our operating results in a timely manner.
Our operating results fluctuate depending upon insurance carrier payment and policy approval practices and the timing of our receipt of commission reports from our insurance carrier partners.
The timing of our revenue depends upon the timing of our insurance carrier partners’ approval of the policies sold on our platform and submitted for their review, as well as the timing of our receipt of commission reports and associated payments from our insurance carrier partners. Although carriers typically report and pay commissions to us on a monthly basis, there have been instances where their report of commissions and payment has been delayed for several months or are incorrect. Incorrect or late commission reports or payments could result in a large amount of commission revenue from a carrier being recorded in a given quarter that is not indicative of the amount of revenue we may receive from that carrier in subsequent quarters, causing fluctuations in our operating results. We could report revenue below the expectations of our investors or securities analysts in any particular period if a material report or payment from an insurance carrier partner were delayed for any reason. Furthermore, we could incur substantial credit losses if one or more of the insurance carrier partners that we depend upon for payment of commissions were to fail.
Our operating results will be impacted by factors that impact our estimate of the constrained lifetime value of commissions per policyholder.
Effective July 1, 2018, we elected to early adopt Accounting Standards Update 2014-09, Revenue from Contracts with Customers (“ASC 606”), using the full retrospective method, which required us to revise our historical financial information for fiscal 2018 to be consistent with the new standard. The adoption had a material impact on our historical financial statements, including the method by which we recognize commission revenue. We now recognize revenue based on the expected value approach. This approach utilizes a number of assumptions, which include, but are not limited to, legal and enforceable rights to renewal commissions upon contract termination when determining variable consideration, renewal commission rates, historical lapse data and premium increase data. These assumptions are based on historical trends and any changes in those historical trends will affect our estimated lifetime value estimates in future periods and therefore could adversely affect our revenue and financial results in those future periods. As a result, adverse changes in the assumptions we make in computing expected values, such as increased lapse rates, would harm our business, operating results, financial condition and prospects.
In particular, if customer lapse rates exceed our expectations, we may not receive the revenues we have projected to receive over time, despite our having incurred and recorded any related customer acquisition costs up front. Any adverse impact on customer lapse rates could lead to our receipt of commission payments that are less than the amount we estimated when we recognized commission revenue. Under such circumstances, we would need to write-off the remaining commission receivable balance, which would result in a change to earnings in the period of the write-off.
Changes in lease accounting standards may materially and adversely affect us.
Beginning in July 1, 2021, the Financial Accounting Standards Board (“FASB”) rules will require that we account for our office space leases as assets and liabilities on our balance sheet. We previously accounted for such leases on an “off balance sheet” basis. As a result of these changes to the FASB rules, we will be required to record lease-related assets and liabilities on our balance sheet, and the way in which we record and classify our lease-related expenses may change as well. Though these changes will not have any direct effect on our overall financial condition, they will cause the total amount of assets and liabilities we report to increase.
-34-
Table of Contents
Changes in tax laws or exposure to additional income tax liabilities could affect our future profitability.
We are subject to income taxes in the United States and various state jurisdictions. Our effective tax rate and profitability could be subject to volatility or adversely affected by a number of factors, including:
| • | changes in applicable tax laws and regulations, or their interpretation and application, including the possibility of retroactive effect; |
| • | changes in accounting and tax standards or practice; |
| • | changes in the valuation of deferred tax assets and liabilities; and |
| • | our operating results before taxes. |
In addition, we may be subject to audits of our income, sales and other taxes by U.S. federal, state and local taxing authorities. Outcomes from these audits could have a material and adverse effect on our operating results, financial condition and prospects.
Our ability to use our net operating loss carryforwards and certain other tax attributes may be limited.
As of June 30, 2019, the Company has net operating loss carryforwards for federal and state income tax purposes of $25.7 million and $19.4 million, respectively, available to offset future taxable income. Other than the federal net operating loss generated for the tax year ended June 30, 2019, which has an indefinite carryforward period, the federal carryforwards will expire in 2034 through 2038 if not utilized. The state carryforwards will expire in 2024 through 2039. Realization of these net operating loss carryforwards depends on our future taxable income, and there is a risk that our existing carryforwards could expire unused and be unavailable to offset future income tax liabilities, which could materially and adversely affect our operating results. In addition, under Sections 382 and 383 of the Internal Revenue Code of 1986, as amended (the “Code”), if a corporation undergoes an “ownership change,” generally defined as a greater than 50% change (by value) in its equity ownership over a three-year period, the corporation’s ability to use its pre-change net operating loss carryforwards and other pre-change tax attributes, such as Section 163(j) disallowed business interest expense carryforwards, to offset its post-change income may be limited. We may experience ownership changes in the future because of subsequent shifts in our stock ownership. As a result, if we earn net taxable income, our ability to use our pre-change net operating loss carry-forwards and other tax attributes to offset U.S. federal taxable income may be subject to limitations, which could potentially result in increased future tax liability to us.
Risks Related to Our Intellectual Property and Our Technology
If we are unable to adequately protect our intellectual property, our ability to compete could be harmed.
We do not currently have any patents or patent applications pending to protect our intellectual property rights, but we do hold trademarks on our name, “SelectQuote,” and on the phrase “We Shop. You Save.” We rely on a combination of copyright, trademark, and trade secret laws and contractual agreements, as well as our internal system access security protocols, to establish, maintain and protect our intellectual property rights and technology. Despite efforts to protect our intellectual property, these laws, agreements and systems may not be sufficient to effectively prevent unauthorized disclosure or unauthorized use of our trade secrets or other confidential information or to prevent third parties from misappropriating our technology and offering similar or superior functionality. For example, monitoring and protecting our intellectual property rights can be challenging and costly, and we may not be effective in policing or prosecuting such unauthorized use or disclosure.
We also may fail to maintain or obtain adequate protections for certain of our intellectual property or technology in the U.S. or certain foreign countries, and our intellectual property rights may not receive the same degree of protection in foreign countries as they would in the U.S. because of the differences in foreign trademark, copyright, and other laws concerning proprietary rights. Furthermore, legal standards relating to the validity, enforceability, and scope of protection of intellectual property rights are uncertain. In addition, our
-35-
Table of Contents
competitors may attempt to copy unprotected aspects of our product design or independently develop similar technology or design around our intellectual property rights. Third parties also may take actions that diminish the value of our proprietary rights or our reputation or cause consumer confusion through the use of similar service names or domain names. Litigation regarding any intellectual property disputes may be costly and disruptive to us. Any of these results would harm our business, operating results, financial condition and prospects.
Additionally, we enter into confidentiality and invention assignment agreements with our employees and enter into confidentiality agreements with third parties, including suppliers and other partners. However, we cannot guarantee that we have entered into such agreements with each party that has or may have had access to our proprietary information, know-how and trade secrets. Moreover, no assurance can be given that these agreements will be effective in controlling access to, distribution, use, misuse, misappropriation, reverse engineering or disclosure of our proprietary information, know-how and trade secrets. Further, these agreements may not prevent our competitors from independently developing technologies that are substantially equivalent or superior to our products and platform capabilities. These agreements may be breached, and we may not have adequate remedies for any such breach.
We may become subject to intellectual property disputes, which are costly and may subject us to significant liability and increased costs of doing business.
Third parties may be able to successfully challenge, oppose, invalidate, render unenforceable, dilute, misappropriate or circumvent our trademarks, copyrights and other intellectual property rights. Our success depends, in part, on our ability to develop and commercialize our products and services without infringing, misappropriating or otherwise violating the intellectual property rights of third parties. However, we may not be aware that our products or services are infringing, misappropriating or otherwise violating third-party intellectual property rights and such third parties may bring claims alleging such infringement, misappropriation or violation.
Actions we may take to enforce our intellectual property rights may be expensive and divert management’s attention away from the ordinary operation of our business, and our inability to secure and protect our intellectual property rights could materially and adversely affect our brand and business, operating results, financial condition and prospects. Furthermore, such enforcement actions, even if successful, may not result in an adequate remedy. In addition, many companies have the capability to dedicate greater resources to enforce their intellectual property rights and to defend claims that may be brought against them. If a third party is able to obtain an injunction preventing us from accessing such third-party intellectual property rights, or if we cannot license or develop alternative technology for any infringing aspect of our business, we would be forced to limit or stop sales of our products and platform capabilities or cease business activities related to such intellectual property.
Although we carry general liability insurance, our insurance may not cover potential claims of this type or may not be adequate to indemnify us for all liability that may be imposed. We cannot predict the outcome of lawsuits and cannot ensure that the results of any such actions will not have an adverse effect on our business, financial condition or results of operations. Such claims could subject us to significant liability for damages and could result in our having to stop using technology found to be in violation of a third party’s rights. Further, we might be required to seek a license for third-party intellectual property, which may not be available on reasonable royalty or other terms. Alternatively, we could be required to develop alternative non-infringing technology, which could require significant effort and expense. If we cannot license or develop technology for any infringing aspect of our business, we would be forced to limit our services, which could affect our ability to compete effectively. Any of these results would harm our business, operating results, financial condition and prospects.
Our business depends on our ability to maintain and improve the technological infrastructure that supports our distribution platform, and any significant disruption in service on our platform could result in a loss of consumers, which could harm our business, brand, operating results, financial condition and prospects.
Our ability to service consumers depends on the reliable performance of our technological infrastructure. Interruptions, delays or failures in these systems, whether due to adverse weather conditions, natural disasters,
-36-
Table of Contents
power loss, computer viruses, cybersecurity attacks, physical break-ins, terrorism, errors in our software or otherwise, could be prolonged and could affect the security or availability of our platform, and the ability of our agents to sell policies and our consumer care team to service those policies. The reliability and security of our systems, and those of our insurance carrier partners, is important not only to facilitating our sale of insurance products, but also to maintaining our reputation and ensuring the proper protection of our confidential and proprietary information. If we experience operational failures or prolonged disruptions or delays in the availability of our systems, we could lose current and potential customers, which could harm our operating results, financial condition and prospects.
Potential changes in applicable technology and consumer outreach techniques could have a material and adverse effect on our operating results, financial condition and prospects.
Changes in technology and consumer outreach techniques continue to shape the insurance distribution landscape. In recent years, consumers’ behavior patterns, in particular their propensity to use online sources for research, product comparison and guidance, has changed and continues to change. Similarly, available technologies for reaching targeted groups of consumers also continues to evolve. We expect that we will incur costs in the future to adjust our systems to adapt to changing behaviors and technologies. In the future, technological innovations and changes in the way consumers engage with technology may materially and adversely affect our operating results, financial condition and prospects, if our business model and technological infrastructure do not evolve accordingly.
We rely on third-party service providers for many aspects of our business, and any failure to maintain these relationships could harm our business.
Information technology systems form a key part of our business and accordingly we are dependent on our relationships with third parties that provide the infrastructure for our technological systems. If these third parties experience difficulty providing the services we require or meeting our standards for those services, or experience disruptions or financial distress or cease operations temporarily or permanently, it could make it difficult for us to operate some aspects of our business. In addition, such events could cause us to experience increased costs and delay our ability to provide services to consumers until we have found alternative sources of the services provided by these third parties. If we are unsuccessful in identifying or finding high-quality partners, if we fail to negotiate cost-effective relationships with them or if we ineffectively manage these relationships, it could materially and adversely affect our business, operating results, financial condition and prospects.
Our business could be materially and adversely affected by a cybersecurity breach or other attack involving our computer systems or those of our insurance carrier partners or third-party service providers.
Our systems and those of our insurance carrier partners and third-party service providers could be vulnerable to hardware and cybersecurity issues. Our operations are dependent upon our ability to protect our computer equipment against damage from fire, power loss, telecommunications failure or a similar catastrophic event. We could also experience a breach by intentional or negligent conduct on the part of employees or other internal sources. Any damage or failure that causes an interruption in our operations could have an adverse effect on our business, operating results, financial condition and prospects. In addition, our operations are dependent upon our ability to protect the computer systems and network infrastructure utilized by us against damage from cybersecurity attacks by sophisticated third parties with substantial computing resources and capabilities and other disruptive problems caused by the internet or other users. Such disruptions would jeopardize the security of information stored in and transmitted through our computer systems and network infrastructure, which may result in significant liability and damage our reputation.
-37-
Table of Contents
We take substantial efforts to protect our systems and data, including establishing internal processes and implementing technological measures to provide multiple layers of security, and contract with third-party service providers to take similar steps. We regularly add additional security measures to our computer systems and network infrastructure to mitigate the possibility of cybersecurity breaches, including firewalls and penetration testing. However, it is difficult or impossible to defend against every risk being posed by changing technologies as well as criminals’ intent on committing cyber-crime and these measures may not be successful in preventing, detecting, or stopping attacks. The increasing sophistication and resources of cyber criminals and other non-state threat actors and increased actions by nation-state actors make keeping up with new threats difficult and could result in a breach of security. Controls employed by our information technology department and our insurance carrier partners and third-party service providers, including cloud vendors, could prove inadequate. A breach of our security that results in unauthorized access to our data could expose us to a disruption or challenges relating to our daily operations, as well as to data loss, litigation, damages, fines and penalties, significant increases in compliance costs and reputational damage, any of which could have a material and adverse effect on our business, operating results, financial condition and prospects.
A number of the states, counties and cities in which we maintain facilities have issued “shelter in place” and similar orders in response to the recent global outbreak of COVID-19. As a result, all of our employees are currently working remotely. This transition to a remote work environment may exacerbate certain risks to our business, including increasing the stress on, and our vulnerability to disruptions of, our technology infrastructure and computer systems, increased risk of phishing and other cybersecurity attacks, and increased risk of unauthorized dissemination of personal or confidential information. See “—We collect, process, store, share, disclose and use consumer information and other data, and an actual or perceived failure to protect such information and data or respect users’ privacy could damage our reputation and brand and harm our business, operating results, financial condition and prospects” in this section.
To the extent we or our systems rely on our insurance carrier partners or third-party service providers, through either a connection to, or an integration with, those third-parties’ systems, the risk of cybersecurity attacks and loss, corruption, or unauthorized publication of our information or the confidential information of consumers and employees may increase. Third-party risks may include lax security measures, data location uncertainty, and the possibility of data storage in inappropriate jurisdictions where laws or security measures may be inadequate.
Any or all of the issues above could adversely affect our ability to attract new customers and continue our relationship with existing customers, cause our insurance carrier partners to cancel their contracts with us or subject us to governmental or third-party lawsuits, investigations, regulatory fines or other actions or liability, thereby harming our business, operating results, financial condition and prospects. Although we are not aware of any material information security breaches to date, we have detected common types of attempts to attack our information systems and data.
We collect, process, store, share, disclose and use consumer information and other data, and an actual or perceived failure to protect such information and data or respect users’ privacy could damage our reputation and brand and harm our business, operating results, financial condition and prospects.
The operation of our distribution platform involves the collection and storage of consumers’ information, including personal information, and security breaches could expose us to a risk of loss or exposure of this information, which could result in potential liability, investigations, regulatory fines, litigation and remediation costs, as well as reputational harm, all of which could materially and adversely affect our business, operating results, financial condition and prospects. For example, unauthorized parties could steal our potential customers’ names, email addresses, physical addresses, phone numbers and other information, including sensitive personal information and credit card payment information, which we collect when providing agency services. These risks may be exacerbated when our agents are working from home on personal internet network systems, including wi-fi.
-38-
Table of Contents
We receive credit and debit card payment information and related data, which we input directly into our insurance carrier portal and in some cases, submit through a third party. With respect to the Life segment, for a few of our insurance carrier partners, we retain limited card payment information and related data, which is encrypted in compliance with Payment Card Industry standards, for a period of 90 days prior to being erased from our systems.
Any failure or perceived failure by us to comply with our privacy policies, our privacy-related obligations to consumers or other third parties, or our privacy-related legal obligations, or any compromise of security that results in the unauthorized release or transfer of sensitive information, which could include personally identifiable information or other user data, may result in governmental investigations, enforcement actions, regulatory fines, litigation and public statements against us by consumer advocacy groups or others, and could cause consumers and insurance carriers to lose trust in us, all of which could be costly and have an adverse effect on our business. Regulatory agencies or business partners may institute more stringent data protection requirements or certifications than those which we are currently subject to and, if we cannot comply with those standards in a timely manner, we may lose the ability to sell a carrier’s products or process transactions containing payment information. Moreover, if third parties that we work with violate applicable laws or our policies, such violations also may put consumer or insurance carrier partner information at risk and could in turn harm our reputation, business, operating results, financial condition and prospects.
Risks Related to Laws and Regulation
Laws and regulations regulating insurance activities are complex and could have a material and adverse effect on our business, may reduce our profitability and potentially limit our growth.
The insurance industry in the United States is heavily regulated. The insurance regulatory framework addresses, among other things: granting licenses to companies and agents to transact particular business activities; and regulating trade, marketing, compensation and claims practices. For example, we are required by state regulators to maintain a valid license in each state in which we transact insurance business and comply with business practice requirements that vary from state to state. In addition, our agents who transact insurance business must also maintain valid licenses. Complying with the regulatory framework requires a meaningful dedication of management and financial resources. Due to the complexity, periodic modification and differing interpretations of insurance laws and regulations, we may not have always been, and we may not always be, in full compliance with them. There can be no assurance that we, our employees, consultants, contractors and other agents are in full compliance with current and/or future laws and regulations or interpretations. Any such non-compliance could impose material costs on us, result in limitations on the business we conduct or damage our relationship with regulatory bodies, our insurance carrier partners and consumers, any of which could have a material and adverse effect on our business, operating results, financial condition and prospects.
Regulatory authorities often have the discretion to grant, renew and revoke the various licenses and approvals we need to conduct our activities. Such authorities may require us to incur substantial costs in order to comply with such laws and regulations. Furthermore, laws and regulations are also subject to interpretation by regulatory authorities, and changes in any such interpretations may adversely impact our business and our ability to carry on our existing activities.
Furthermore, the laws and regulations governing the sale of insurance may change in ways that adversely impact our business. These changes could impact the manner in which we are permitted to conduct our business, could force us to reduce the compensation we receive or otherwise adversely impact our business, operating results, financial condition and prospects.
In addition, we are subject to laws and regulations with respect to matters regarding privacy and cybersecurity. See “—We collect, process, store, share, disclose and use consumer information and other data, and an actual or perceived failure to protect such information and data or respect users’ privacy could damage
-39-
Table of Contents
our reputation and brand and harm our business, operating results, financial condition and prospects” and “—We may not be able to maintain compliance with all current and potentially applicable U.S. federal and state or foreign laws and regulations, and actions by regulatory authorities or changes in legislation and regulation in the jurisdictions in which we operate could have a material adverse effect on our business” in this section.
Our Senior segment is subject to a complex legal and regulatory framework, and non-compliance with or changes in laws and regulations governing the marketing and sale of Medicare plans could harm our business, operating results, financial condition and prospects.
Our Senior segment is subject to a complex legal and regulatory framework and the laws and regulations governing the marketing and sale of Medicare plans, particularly with respect to regulations and guidance issued by CMS for Medicare Advantage and Medicare Part D prescription drug plans, change frequently. Changes to the laws, regulations and guidelines relating to Medicare plans, their interpretation or the manner in which they are enforced could harm our business, operating results, financial condition and prospects.
Changes to laws, regulations, CMS guidance or the enforcement or interpretation of CMS guidance applicable to our Senior segment could cause insurance carriers or state departments of insurance to object to or not to approve aspects of our marketing materials and processes. As a result, those authorities may determine that certain aspects of our Senior segment are not in compliance with the current legal and regulatory framework. Any such determinations could delay or halt the operation of our Senior segment, which would harm our business, operating results, financial condition and prospects, particularly if such delay or halt occurred during the Medicare annual or open enrollment periods.
Our business may be harmed if we do not market Medicare plans effectively or if our website and marketing materials are not timely approved or do not comply with legal requirements.
Our insurance carrier partners whose Medicare plans we sell approve our website, much of our marketing material and our call scripts for our Senior segment. In the event that CMS or an insurance carrier partner requires changes to, disapproves, or delays approval of these materials, we could lose a significant source of Medicare plan demand and the operations of our Senior segment could be adversely affected. If we are not successful in timely receiving insurance carrier partner or CMS approval of our marketing materials, we could be prevented from implementing our Medicare marketing initiatives, which could harm our business, operating results, financial condition and prospects, particularly if such delay or non-compliance occurs during AEP or OEP. The CMS rules and regulations also apply to our marketing partners’ marketing materials. If our marketing partners’ marketing materials do not comply with the CMS marketing guidelines or other Medicare program related laws, rules and regulations, such non-compliance could result in our losing the ability to receive referrals of individuals interested in purchasing Medicare plans from that marketing partner or being delayed in doing so.
If our Senior segment substantively changes its marketing materials or call scripts, our insurance carrier partners may be required to re-file those materials with CMS. Due to our inability to make CMS filings ourselves and the need for further CMS review, it is very difficult and time consuming for us to make changes to our marketing materials, and our inability to timely make changes to these materials, whether to comply with new rules and regulations or otherwise, could adversely affect the results of operations for our Senior segment. In addition, we may be prevented from using any marketing material until any changes required by CMS or our insurance carrier partners are made and approved, which would harm our business, operating results, financial condition and prospects, particularly if such delay occurred during AEP or OEP.
-40-
Table of Contents
We may not be able to maintain compliance with all current and potentially applicable U.S. federal and state or foreign laws and regulations, and actions by regulatory authorities or changes in legislation and regulation in the jurisdictions in which we operate could have a material adverse effect on our business.
We are also subject to a variety of laws and regulations that involve matters central to our business, including with respect to user privacy and the collection, processing, storing, sharing, disclosing, using, transfer and protecting of personal information and other data. These laws and regulations constantly evolve and remain subject to significant change. In addition, the application and interpretation of these laws and regulations are often uncertain. Because we store, process and use data, some of which contain personal information, we are subject to complex and evolving federal, state and local laws and regulations regarding privacy, data protection and other matters. Many of these laws and regulations are subject to change and uncertain interpretation.
New York’s cybersecurity regulation for financial services companies, including insurance entities under its jurisdiction, requires entities to establish and maintain a cybersecurity program designed to protect private consumer data. The regulation specifically provides for: (i) controls relating to the governance framework for a cybersecurity program; (ii) risk-based minimum standards for technology systems for data protection; (iii) minimum standards for cyber breach responses, including notice to the New York Department of Financial Services (“NYDFS”) of material events; and (iv) identification and documentation of material deficiencies, remediation plans and annual certification of regulatory compliance with the NYDFS.
In addition, in October 2017, the National Association of Insurance Commissioners (“NAIC”) adopted the Insurance Data Security Model Law (the “Cybersecurity Model Law”), which is intended to establish the standards for data security and for the investigation and notification of data breaches applicable to insurance licensees in states adopting such law. To date, the Cybersecurity Model Law has been adopted by Alabama, Connecticut, Delaware, Michigan, Mississippi, New Hampshire, Ohio and South Carolina, with several other states expected to adopt in the near future. The Cybersecurity Model Law could impose significant new regulatory burdens intended to protect the confidentiality, integrity and availability of information systems. The NAIC model law is functionally similar to the NYDFS rule.
Compliance with existing and emerging privacy and cybersecurity regulations could result in increased compliance costs and/or lead to changes in business practices and policies, and any failure to protect the confidentiality of client information could adversely affect our reputation, lend to private litigation against us, any of which could materially and adversely affect our business, operating results, financial condition and prospects.
Our communications with potential and existing customers are subject to laws regulating telephone and email marketing practices.
We make telephone calls and send emails and text messages to potential and existing customers. The United States regulates marketing by telephone and email and the laws and regulations governing the use of emails and telephone calls for marketing purposes continue to evolve, and changes in technology, the marketplace or consumer preferences may lead to the adoption of additional laws or regulations or changes in interpretation of existing laws or regulations. New laws or regulations, or changes to the manner in which existing laws and regulations or interpreted or enforced, may further restrict our ability to contact potential and existing customers by phone and email and could render us unable to communicate with consumers in a cost-effective fashion. The Telephone Consumer Protection Act (the “TCPA”) prohibits companies from making telemarketing calls to numbers listed in the Federal Do-Not-Call Registry and imposes other obligations and limitations on making phone calls and sending text messages to consumers. The CAN-SPAM Act regulates commercial email messages and specifies penalties for the transmission of commercial email messages that do not comply with certain requirements, such as providing an opt-out mechanism for stopping future emails from senders. We may be required to comply with these and similar laws, rules and regulations. Failure to comply with obligations and restrictions related to telephone, text message and email marketing could subject us to lawsuits, fines, statutory damages, consent decrees, injunctions, adverse publicity and other losses that could harm our business. We have
-41-
Table of Contents
policies in place to comply with the TCPA and other telemarketing laws. However, despite our legal compliance, we have in the past and may in the future become subject to claims that we have violated the TCPA.
Any legal liability for the information we communicate to consumers could harm our business and operating results.
Consumers rely upon information we communicate through our agency services regarding the insurance plans we distribute, including information relating to insurance premiums, coverage, benefits, exclusions, limitations, availability, and plan comparisons. If we provide inaccurate information or information that could be construed as misleading, or if we do not properly assist individuals in purchasing insurance, we could be found liable for related damages and our relationships with our insurance carrier partners and our standing with regulators could suffer.
Risks Related to Being a Public Company
We may incur significant additional costs and expenses and may generate losses in the future.
We incur significant expenses in developing our technology, marketing the products and services we offer and acquiring consumers, and our costs may increase due to our continued new product development and general administrative expenses, such as legal and accounting expenses related to becoming and being a public company. If we fail to manage these additional costs or increase our revenue, we may continue to incur losses in the future.
Our quarterly operating results or other operating metrics may fluctuate significantly and may not meet expectations of research analysts, which could cause the trading price of our common stock to decline.
Our quarterly operating results and other operating metrics have fluctuated in the past and may in the future fluctuate as a result of a number of factors, many of which are outside of our control and may be difficult to predict. Period to period variability or unpredictability of our results could result in our failure to meet our expectations or those of any analysts that cover us or investors with respect to revenue or other operating results for a particular period. If we fail to meet or exceed such expectations for these or any other reasons, the market price of our common stock could fall substantially, and we could face litigation, including securities class actions.
The accuracy of our financial statements and related disclosures could be affected if the judgments, assumptions or estimates used in our critical accounting policies are inaccurate.
The preparation of financial statements and related disclosure in conformity with GAAP requires us to make judgments, assumptions and estimates that affect the amounts reported in our consolidated financial statements and accompanying notes. Our critical accounting policies, which are included in the section captioned “Management’s Discussion and Analysis of Financial Condition and Results of Operations” in this prospectus, describe those significant accounting policies and methods used in the preparation of our consolidated financial statements that we consider “critical” because they require judgments, assumptions and estimates that materially affect our consolidated financial statements and related disclosures. As a result, if future events differ significantly from the judgments, assumptions and estimates in our critical accounting policies, those events or assumptions could have a material impact on our consolidated financial statements and related disclosures.
The obligations associated with being a public company will require significant resources and management attention, which will increase our costs of operations and may divert focus from our business operations.
We have not been required in the past to comply with the requirements of the SEC, to file periodic reports with the SEC or to have our consolidated financial statements completed, reviewed or audited and filed within a specified time. As a public company following completion of this offering, we will be required to file periodic
-42-
Table of Contents
reports containing our consolidated financial statements with the SEC within a specified time following the completion of quarterly and annual periods. As a public company, we will also incur significant legal, accounting, insurance and other expenses. Compliance with these reporting requirements and other rules of the SEC and the rules of the NYSE will increase our legal and financial compliance costs and make some activities more time consuming and costly. Furthermore, the need to establish the corporate infrastructure demanded of a public company may divert management’s attention from implementing our growth strategy, which could prevent us from successfully implementing our strategic initiatives and improving our business, operating results, financial condition and prospects.
If we fail to correct any material weakness that we identify in our internal control over financial reporting or otherwise fail to maintain effective internal control over financial reporting, we may not be able to report our financial results accurately and timely, in which case our business may be harmed, investors may lose confidence in the accuracy and completeness of our financial reports and the price of our common stock may decline.
Our management is responsible for establishing and maintaining adequate internal control over financial reporting and for evaluating and reporting on our system of internal control. Our internal control over financial reporting is a process designed to provide reasonable assurance regarding the reliability of financial reporting and the preparation of financial statements for external purposes in accordance with GAAP. As a public company, we will be required to comply with the Sarbanes-Oxley Act and other rules that govern public companies. In particular, we will be required to certify our compliance with Section 404 of the Sarbanes-Oxley Act beginning with our second annual report on Form 10-K, which will require us to furnish annually a report by management on the effectiveness of our internal control over financial reporting. In addition, unless we remain an emerging growth company and elect transitional relief available to emerging growth companies, our independent registered public accounting firm will be required to report on the effectiveness of our internal control over financial reporting, beginning as of that second annual report.
If we identify material weaknesses in our internal control over financial reporting in the future, if we cannot comply with the requirements of the Sarbanes-Oxley Act in a timely manner or attest that our internal control over financial reporting is effective, or if our independent registered public accounting firm cannot express an opinion as to the effectiveness of our internal control over financial reporting when required, we may not be able to report our financial results accurately and timely. As a result, investors, counterparties and consumers may lose confidence in the accuracy and completeness of our financial reports; our liquidity, access to capital markets and perceptions of our creditworthiness could be adversely affected; and the market price of our common stock could decline. In addition, we could become subject to investigations by the stock exchange on which our securities are listed, the SEC or other regulatory authorities, which could require additional financial and management resources. These events could have a material and adverse effect on our business, operating results, financial condition and prospects.
We are an “emerging growth company,” and the reduced disclosure requirements applicable to emerging growth companies may make our common stock less attractive to investors.
We are an “emerging growth company,” as defined in the JOBS Act. We could continue to be considered an emerging growth company for up to five years, although we would lose that status sooner if our gross revenues exceed $1.07 billion, if we issue more than $1.0 billion in nonconvertible debt in a three-year period or if the fair value of our common stock held by non-affiliates exceeds $700.0 million (and we have been a public company for at least 12 months and have filed one annual report on Form 10-K). For as long as we continue to be an emerging growth company, we may take advantage of exemptions from various reporting requirements that are applicable to other public companies that are not emerging growth companies, including reduced disclosure obligations regarding executive compensation in our periodic reports and proxy statements and exemptions from the requirements of holding a nonbinding advisory vote on executive compensation and stockholder approval of any golden parachute payments not previously approved. It is unclear whether investors will find our common
-43-
Table of Contents
stock less attractive because we may rely on these exemptions. If some investors find our common stock less attractive as a result, there may be a less active trading market for our common stock and our stock price may be more volatile.
In addition, the JOBS Act provides that an emerging growth company can take advantage of an extended transition period for complying with new or revised accounting standards. This allows an emerging growth company to delay the adoption of certain accounting standards until those standards would otherwise apply to private companies. We have elected to avail ourselves of this exemption from new or revised accounting standards and, therefore, while we are an emerging growth company we will not be subject to new or revised accounting standards at the same time that they become applicable to other public companies that are not emerging growth companies. As a result, our financial statements may not be comparable to companies that comply with new or revised accounting pronouncements as of public company effective dates, and we will incur additional costs in connection with complying with the accounting standards applicable to public companies at such time or times as they become applicable to us.
Risks Related to Our Common Stock and this Offering
An active trading market for our common stock may not develop, and you may not be able to resell your shares of our common stock at or above the initial offering price.
Prior to this offering, there has been no public market for shares of our common stock. We cannot predict the extent to which investor interest in us will lead to the development of a trading market on the NYSE or otherwise, or how liquid that market might become. If an active market does not develop, you may have difficulty selling any shares of our common stock that you purchase in this offering. The initial public offering price for the shares of our common stock has been determined by negotiations between us and the representatives of the underwriters, and may not be indicative of prices that will prevail in the open market following this offering. An inactive market may also impair our ability to raise capital by selling shares of our common stock and may impair our ability to acquire or make investments in companies, products or technologies for which we may issue equity securities to pay for such acquisition or investment.
Further, our directors, director nominees, officers, employees, business associates and related persons of SelectQuote, Inc., have the opportunity to purchase up to 1,250,000 shares of our common stock, or up to 5% of the shares offered by this prospectus for sale by the Company, at the initial public offering price, through a directed share program. To the extent these persons purchase shares in this offering, fewer shares may be actively traded in the public market because these stockholders will be restricted from selling the shares by a 180-day lock-up restriction, which would reduce the liquidity of the market for our common stock.
Our market price for our common stock may be subject to substantial fluctuations, which may make it difficult for you to sell your shares at the volume, price and times desired.
The market price of our common stock may be highly volatile, which may make it difficult for you to sell your shares at the volume, prices and times desired. Some specific factors that may have a significant effect on the market price of our common stock include:
| • | actual or anticipated fluctuations in our operating results or those of our competitors’; |
| • | actual or anticipated changes in the growth rate of the insurance market or the growth rate of our businesses or those of companies that investors deem comparable to us; |
| • | changes in economic or business conditions; |
| • | changes in governmental regulation; and |
| • | publication of research reports about us, our competitors, or our industry, or changes in, or failure to meet, estimates made by securities analysts or ratings agencies of our financial and operating performance, or lack of research reports by industry analysts or ceasing of analyst coverage. |
-44-
Table of Contents
We have broad discretion in the use of the net proceeds from this offering and our use of those proceeds may not yield a favorable return on your investment.
Our management has broad discretion over how the net proceeds from this offering are used and could spend the proceeds in ways with which you may not agree. In addition, we may not use the proceeds of this offering effectively or in a manner that increases our fair value or enhances our profitability. We have not established a timetable for the effective deployment of the proceeds and we cannot predict how long it will take to deploy the proceeds. We expect to use a portion of our net proceeds from this offering to repay outstanding borrowings under the Term Loan and any remaining proceeds not used to repay the outstanding borrowings, for working capital, capital expenditures and general corporate purposes, including, in our discretion, prepayment of obligations under the Receivables Financing Agreement. See “Use of Proceeds.” We may not be able to deploy the proceeds effectively, potentially adversely affecting stockholder returns.
You will experience immediate and substantial dilution in the book value of the shares you purchase in this offering.
If you purchase shares of our common stock in this offering, you will experience immediate and substantial dilution of $15.25 per share, representing the difference between the initial public offering price of $18 per share, which is the midpoint of the range listed on the cover page of this prospectus, and our pro forma as adjusted net tangible book value per share after giving effect to sales of shares by us in this offering and the automatic conversion of all outstanding shares of our Series A, B, C, D and E preferred stock into common stock upon the closing of this offering. Moreover, to the extent outstanding options are exercised and outstanding restricted stock units vest, you will incur further dilution. See the “Dilution” section of this prospectus.
Our issuance of additional capital stock in connection with financings, acquisitions, investments, our equity incentive plans or otherwise would dilute all other stockholders.
We may issue additional capital stock in the future. Any such issuance would result in dilution to all other stockholders. In the future, we may issue additional stock, including as a grant of equity awards to employees, directors and consultants under our equity incentive plans, to raise capital through equity financings or to acquire or make investments in companies, products or technologies for which we may issue equity securities to pay for such acquisition or investment. Any such issuances of additional capital stock may cause stockholders to experience significant dilution of their ownership interests and the per share value of our common stock to decline.
We do not intend to pay dividends in the foreseeable future.
The declaration and amount of any future dividends to holders of our common stock will be at the discretion of our Board of Directors in accordance with applicable law and after taking into account various factors, including our financial condition, operating results, current and anticipated cash needs, cash flows, impact on our effective tax rate, indebtedness, contractual obligations, legal requirements and other factors that our Board of Directors deems relevant. Our Board of Directors intends to retain future earnings to finance the operation and expansion of our business. In addition, our Credit Agreement contains restrictions on our ability to pay dividends, subject to certain exceptions. Accordingly, we do not expect to pay dividends in the foreseeable future. As a result, capital appreciation, if any, of our common stock will be your sole source of gain for the foreseeable future.
Sales of a substantial number of shares of our common stock by our existing stockholders in the public market could cause our stock price to fall.
Sales of a substantial number of shares of our common stock in the public market, or the perception that these sales might occur, could significantly reduce the market price of our common stock. If our existing stockholders sell, or indicate an intention to sell, substantial amounts of our common stock in the public market
-45-
Table of Contents
after the lock-up and legal restrictions on resale discussed in this prospectus lapse, the trading price of our common stock could substantially decline. Furthermore, approximately 7.88% of our outstanding common stock is beneficially owned by our executive officers. If one or more of them were to sell a substantial portion of the shares they hold, it could cause our stock price to decline.
Based on shares outstanding as of the date of this prospectus, on the closing of this offering, we will have outstanding a total of 162,650,597 shares of common stock after giving effect to the automatic conversion of all of our outstanding shares of Series A, B, C, D and E preferred stock into shares of common stock. This includes the 25,000,000 shares of common stock that are being sold in this offering, which may be resold in the public market immediately. The remaining 137,650,597 shares of our common stock, which together represent 84.63% of our outstanding shares of common stock after this offering, are currently, and will be following the closing of this offering, restricted as a result of securities laws or lock-up agreements but will be able to be sold, subject to any applicable volume limitations, under federal securities laws with respect to affiliate sales. Each of our directors, executive officers and other holders of 90.97% of our outstanding shares have entered into lock-up agreements with the underwriters under which the holders of such securities have agreed that, subject to certain exceptions, without the prior written consent of Credit Suisse Securities (USA) LLC and Morgan Stanley & Co. LLC, they will not (1) offer, pledge, sell, contract to sell, sell any option or contract to purchase, purchase any option or contract to sell, grant any option, right or warrant to purchase, lend, or otherwise transfer or dispose of, directly or indirectly, any shares of our common stock beneficially owned by them or any other securities so owned that are convertible into or exercisable or exchangeable for shares of our common stock or (2) enter into any swap or other arrangement that transfers to another, in whole or in part, any of the economic consequences of ownership of shares of our common stock. The foregoing restrictions will remain in effect for 90 days following the date of this prospectus with respect to 4,166,667 shares of our common stock issued pursuant to the conversion of our Series E preferred stock into shares of our common stock upon the completion of this offering (the “Series E Restricted Shares”), which together represent 2.56% of our outstanding shares of common stock after this offering, and for 180 days following the date of this prospectus with respect to all other shares of our common stock subject to the lock-up agreement described above. Upon each release of the foregoing restrictions, our securityholders subject to a lock-up agreement will be able to sell our shares in the public market. In addition, the underwriters may, in their sole discretion, release all or some portion of the shares subject to lock-up agreements prior to a release of the foregoing restrictions. Subject to certain exceptions, in the event that the underwriters grant such a release with respect to all or a portion of another holder’s shares, the same percentage of the Series E Restricted Shares will be automatically released from the lock-up restrictions. For a description of the lock-up agreements, see the “Shares Eligible for Future Sale” and “Underwriting (Conflicts of Interest)” sections of this prospectus.
In addition, as of the date of this prospectus, there were 4,095,968 shares of common stock subject to outstanding options, 9,600,000 shares of common stock available for issuance pursuant to future awards under our equity incentive plans and 1,400,000 shares of common stock available for issuance under our ESPP that will become eligible for sale in the public market to the extent permitted by the provisions of various vesting schedules, the lock-up agreements discussed above and Rules 144 and 701 under the Securities Act. Moreover, we intend to register all shares of common stock that we may issue under our employee benefit plans. Once we register these shares, they can be freely sold in the public market upon issuance, subject to the lock-up agreements and the restrictions imposed on our affiliates under Rule 144.
-46-
Table of Contents
Certain provisions in our sixth amended and restated certificate of incorporation and amended and restated bylaws and of Delaware law may prevent or delay an acquisition of SelectQuote, which could decrease the trading price of our common stock.
Our sixth amended and restated certificate of incorporation and amended and restated bylaws will contain, and Delaware law contains, provisions that are intended to deter coercive takeover practices and inadequate takeover bids by making such practices or bids unacceptably expensive to the bidder and to encourage prospective acquirers to negotiate with our Board of Directors rather than to attempt a hostile takeover. These provisions include, among others:
| • | the inability of our stockholders to call a special meeting; |
| • | the inability of our stockholders to act without a meeting of stockholders; |
| • | rules regarding how stockholders may present proposals or nominate directors for election at stockholder meetings; |
| • | the right of our Board of Directors to issue preferred stock without stockholder approval; |
| • | the division of our Board of Directors into three classes of directors, with each class serving a staggered three-year term, and this classified board provision could have the effect of making the replacement of incumbent directors more time consuming and difficult; |
| • | stockholders may only remove directors with cause; and |
| • | the ability of our directors, and not stockholders, to fill vacancies on our Board of Directors. |
In addition, because we will not elect to be exempt from Section 203 of the Delaware General Corporation Law (the “DGCL”), this provision could also delay or prevent a change of control that you may favor. Section 203 provides that, subject to limited exceptions, persons that acquire, or are affiliated with a person that acquires, more than 15% of the outstanding voting stock of a Delaware corporation (an “interested stockholder”) shall not engage in any business combination with that corporation, including by merger, consolidation or acquisitions of additional shares, for a three-year period following the date on which the person became an interested stockholder, unless (i) prior to such time, the board of directors of such corporation approved either the business combination or the transaction that resulted in the stockholder becoming an interested stockholder; (ii) upon consummation of the transaction that resulted in the stockholder becoming an interested stockholder, the interested stockholder owned at least 85% of the voting stock of such corporation at the time the transaction commenced (excluding for purposes of determining the voting stock outstanding (but not the outstanding voting stock owned by the interested stockholder) the voting stock owned by directors who are also officers or held in employee benefit plans in which the employees do not have a confidential right to tender or vote stock held by the plan); or (iii) on or subsequent to such time the business combination is approved by the board of directors of such corporation and authorized at a meeting of stockholders by the affirmative vote of at least two-thirds of the outstanding voting stock of such corporation not owned by the interested stockholder.
We believe these provisions will protect our stockholders from coercive or otherwise unfair takeover tactics by requiring potential acquirers to negotiate with our Board of Directors and by providing our Board of Directors with more time to assess any acquisition proposal. These provisions are not intended to make SelectQuote immune from takeovers. However, these provisions will apply even if the offer may be considered beneficial by some stockholders and could delay or prevent an acquisition that our Board of Directors determines is not in the best interests of SelectQuote and its stockholders. These provisions may also prevent or discourage attempts to remove and replace incumbent directors.
Our sixth amended and restated certificate of incorporation will contain exclusive forum provisions that may discourage lawsuits against us and our directors and officers.
Our sixth amended and restated certificate of incorporation will provide that unless the Board of Directors otherwise determines, the state courts in the State of Delaware or, if no state court located within the State of
-47-
Table of Contents
Delaware has jurisdiction, the federal court for the District of Delaware, will be the sole and exclusive forum for any derivative action or proceeding brought on behalf of SelectQuote, any action asserting a claim of breach of a fiduciary duty owed by any director or officer of SelectQuote to SelectQuote or SelectQuote’s stockholders, any action asserting a claim against SelectQuote or any director or officer of SelectQuote arising pursuant to any provision of the DGCL or SelectQuote’s sixth amended and restated certificate of incorporation or amended and restated bylaws, or any action asserting a claim against SelectQuote or any director or officer of SelectQuote governed by the internal affairs doctrine under Delaware law (collectively, the “covered actions”). These exclusive forum provisions will apply to all covered actions, including any covered action in which the plaintiff chooses to assert a claim or claims under federal law in addition to a claim or claims under Delaware law. These exclusive forum provisions, however, will not apply to actions asserting only federal law claims under the Securities Act or the Securities Exchange Act of 1934, as amended (the “Exchange Act”), regardless of whether the state courts in the State of Delaware have jurisdiction over those claims. These exclusive forum provisions may limit the ability of SelectQuote’s stockholders to bring a claim in a judicial forum that such stockholders find favorable for disputes with SelectQuote or SelectQuote’s directors or officers, which may discourage such lawsuits against SelectQuote and SelectQuote’s directors and officers. Alternatively, if a court were to find one or more of these exclusive forum provisions inapplicable to, or unenforceable in respect of, one or more of the specified types of actions or proceedings described above, SelectQuote may incur additional costs associated with resolving such matters in other jurisdictions or forums, which could materially and adversely affect SelectQuote’s business, financial condition or results of operations.
Our Board of Directors will have the ability to issue blank check preferred stock, which may discourage or impede acquisition attempts or other transactions.
Our Board of Directors will have the power, subject to applicable law, to issue series of preferred stock that could, depending on the terms of the series, impede the completion of a merger, tender offer or other takeover attempt. For instance, subject to applicable law, a series of preferred stock may impede a business combination by including class voting rights, which would enable the holder or holders of such series to block a proposed transaction. Our Board of Directors will make any determination to issue shares of preferred stock based on its judgment as to our and our stockholders’ best interests. Our Board of Directors, in so acting, could issue shares of preferred stock having terms which could discourage an acquisition attempt or other transaction that some, or a majority, of the stockholders may believe to be in their best interests or in which stockholders would have received a premium for their stock over the then prevailing market price of the stock.
-48-
Table of Contents
CAUTIONARY NOTE REGARDING FORWARD-LOOKING STATEMENTS
This prospectus contains forward-looking statements. These forward-looking statements reflect our current views with respect to, among other things, future events and our financial performance. These statements are often, but not always, made through the use of words or phrases such as “may,” “should,” “could,” “predict,” “potential,” “believe,” “will likely result,” “expect,” “continue,” “will,” “anticipate,” “seek,” “estimate,” “intend,” “plan,” “projection,” “would” and “outlook,” or the negative version of those words or other comparable words or phrases of a future or forward-looking nature. These forward-looking statements are not historical facts, and are based on current expectations, estimates and projections about our industry, management’s beliefs and certain assumptions made by management, many of which, by their nature, are inherently uncertain and beyond our control. Accordingly, we caution you that any such forward-looking statements are not guarantees of future performance and are subject to risks, assumptions and uncertainties that are difficult to predict. Although we believe that the expectations reflected in these forward-looking statements are reasonable as of the date made, actual results may prove to be materially different from the results expressed or implied by the forward-looking statements.
There are or will be important factors that could cause our actual results to differ materially from those indicated in these forward-looking statements, including, but are not limited to, the following:
| • | Our reliance on a limited number of insurance carrier partners and any potential termination of those relationships or failure to develop new relationships; |
| • | Existing and future laws and regulations affecting the health insurance market; |
| • | Changes in health insurance products offered by our insurance carrier partners and the health insurance market generally; |
| • | Insurance carriers offering products and services directly to consumers; |
| • | Changes to commissions paid by insurance carriers and underwriting practices; |
| • | Competition with brokers, exclusively online brokers and carriers who opt to sell policies directly to consumers; |
| • | Competition from government-run health insurance exchanges; |
| • | Developments in the U.S. health insurance system; |
| • | Our dependence on revenue from carriers in our Senior segment and downturns in the senior health as well as life, automotive and home insurance industries; |
| • | Our ability to develop new offerings and penetrate new vertical markets; |
| • | Risks from third-party products; |
| • | Failure to enroll individuals during AEP or OEP; |
| • | Our ability to attract, integrate and retain qualified personnel; |
| • | Our dependence on lead providers and ability to compete for leads; |
| • | Failure to obtain and/or convert sales leads to actual sales of insurance policies; |
| • | Access to data from consumers and insurance carriers; |
| • | Accuracy of information provided from and to consumers during the insurance shopping process; |
| • | Cost-effective advertisement through internet search engines; |
| • | Ability to contact consumers and market products by telephone; |
-49-
Table of Contents
| • | Global economic conditions; |
| • | The impact on our operations from the effects of public health crises, including the current COVID-19 outbreak; |
| • | Disruption to operations as a result of future acquisitions; |
| • | Significant estimates and assumptions in the preparation of our financial statements; |
| • | Impairment of goodwill; |
| • | Potential litigation and claims, including IP litigation; |
| • | Our existing and future indebtedness; |
| • | Developments with respect to LIBOR; |
| • | Access to additional capital; |
| • | Failure to protect our intellectual property and our brand; |
| • | Fluctuations in our financial results caused by seasonality; |
| • | Accuracy and timeliness of commissions reports from insurance carriers; |
| • | Timing of insurance carriers’ approval and payment practices; |
| • | Factors that impact our estimate of the constrained lifetime value of commissions per policyholder; |
| • | Changes in accounting rules, tax legislation and other legislation; |
| • | Disruptions or failures of our technological infrastructure and platform; |
| • | Failure to maintain relationships with third-party service providers; |
| • | Cybersecurity breaches or other attacks involving our systems or those of our insurance carrier partners or third-party service providers; |
| • | Our ability to protect consumer information and other data; |
| • | Failure to market and sell Medicare plans effectively or in compliance with laws; |
| • | Risks related to our being a public company; |
| • | Risks related to our common stock and this offering; and |
| • | The other risk factors described under “Risk Factors.” |
The foregoing factors should not be construed as exhaustive and should be read together with the other cautionary statements included in this prospectus. If one or more events related to these or other risks or uncertainties materialize, or if our underlying assumptions prove to be incorrect, actual results may differ materially from what we anticipate. Many of the important factors that will determine these results are beyond our ability to control or predict. Accordingly, you should not place undue reliance on any such forward-looking statements. Any forward-looking statement speaks only as of the date on which it is made, and, except as otherwise required by law, we do not undertake any obligation to publicly update or review any forward-looking statement, whether as a result of new information, future developments or otherwise. New factors emerge from time to time, and it is not possible for us to predict which will arise. In addition, we cannot assess the impact of each factor on our business or the extent to which any factor, or combination of factors, may cause actual results to differ materially from those contained in any forward-looking statements.
-50-
Table of Contents
We estimate that our net proceeds from the sale of our common stock by us in this offering will be approximately $300.0 million, assuming an initial public offering price of $18 per share, which is the midpoint of the range listed on the cover page of this prospectus, and after deducting the estimated underwriting discounts and commissions and estimated offering expenses payable by us. We will not receive any proceeds from the sale of shares of common stock by the selling stockholders.
A $1.00 increase (decrease) in the assumed initial public offering price of $18 per share would increase (decrease) the net proceeds to us from this offering by approximately $17.0 million, assuming that the number of shares offered, as set forth on the cover page of this prospectus, remains the same and after deducting the estimated underwriting discounts and commissions and offering expenses payable by us. An increase (decrease) of 1,000,000 shares in the number of shares of common stock offered by us in this offering, as set forth on the cover page of this prospectus, would increase (decrease) the net proceeds to us from this offering by approximately $17.0 million, assuming no change in the assumed initial public offering price per share and after deducting estimated underwriting discounts and commissions, estimated placement agent fees and estimated offering expenses payable by us.
The Senior Secured Credit Facilities require that at least 25% of the net proceeds to the Company from this offering (up to $150.0 million) be applied to the prepayment of the Term Loan, which otherwise matures in November 2024. We intend to use up to $100 million of the net proceeds we receive from this offering to repay outstanding borrowings under the Term Loan. Any remaining proceeds not used to repay the outstanding borrowings will be used for working capital, capital expenditures and general corporate purposes, including, in our discretion, prepayment of obligations under the Receivables Financing Agreement. See “Description of Certain Indebtedness” for further details about the Term Loan and “Management’s Discussion and Analysis of Financial Condition and Results of Operations—Delayed Draw Credit Facilities” for further details about the Receivables Financing Agreement, including the interest rate and maturity thereunder.
Affiliates of Morgan Stanley & Co. LLC, one of the underwriters of this offering, are lenders under our Credit Agreement. As a result of the repayment of a portion of the borrowed funds under the Term Loan using proceeds from this offering, Morgan Stanley & Co. LLC will therefore indirectly receive more than 5% of the proceeds from this offering. Because of the foregoing, a “conflict of interest” is deemed to exist within the meaning of FINRA Rule 5121. Accordingly, this offering will be conducted in accordance with FINRA Rule 5121, which requires, among other things, that a “qualified independent underwriter” participate in the preparation of, and exercise the usual standards of “due diligence” with respect to, the registration statement and this prospectus. Credit Suisse Securities (USA) LLC has agreed to act as a qualified independent underwriter for this offering and to undertake the legal responsibilities and liabilities of an underwriter under the Securities Act, specifically including those inherent in Section 11 of the Securities Act. Credit Suisse Securities (USA) LLC will not receive any additional fees for serving as a qualified independent underwriter in connection with this offering. The Company and the selling stockholders have agreed to indemnify Credit Suisse Securities (USA) LLC against certain liabilities incurred in connection with acting as a qualified independent underwriter, including liabilities under the Securities Act. Morgan Stanley & Co. LLC will not confirm any sales to any account over which it exercises discretionary authority without the specific written approval of the transaction from the account holder. See “Underwriting (Conflicts of Interest)” for more information.
Our management will have broad discretion in the application of the net proceeds we receive from this offering, and investors will be relying on the judgment of our management regarding the application of our net proceeds. While we expect to use the net proceeds to assist in gradually achieving cash flow neutrality while continuing to invest in growth, and for the purposes described above, the timing and amount of our actual expenditures will be based on many factors, including cash flows from operations, the anticipated growth of our business, and the availability and terms of alternative financing sources to fund our growth.
-51-
Table of Contents
We do not anticipate declaring or paying any cash dividends on our common stock in the foreseeable future. Any future determination to declare and pay cash dividends, if any, will be made at the discretion of our Board of Directors and will depend on a variety of factors, including applicable laws, our financial condition, results of operations, contractual restrictions, capital requirements, business prospects, general business or financial market conditions, and other factors our Board of Directors may deem relevant. In addition, our Credit Agreement contains covenants that restrict our ability to pay cash dividends, subject to certain exceptions. Investors should not purchase our common stock with the expectation of receiving cash dividends.
-52-
Table of Contents
The following table sets forth our cash and our capitalization as of March 31, 2020:
| • | on an actual basis; |
| • | on a pro forma basis to give effect to: |
| • | the issuance and sale of 135,000 shares of our Series E preferred stock and related receipt of net proceeds of approximately $129.0 million subsequent to March 31, 2020; |
| • | the automatic conversion of all outstanding shares of our Series A, B, C, D and E preferred stock into 52,404,685 shares of common stock upon the closing of this offering; and |
| • | the filing and effectiveness of our sixth amended and restated certificate of incorporation, which provides for, among other things, the elimination of our Series A, B, C, D and E preferred stock; and |
| • | on a pro forma as adjusted basis to give further effect to our issuance and sale of 18,000,000 shares of common stock in this offering at an assumed initial public offering price of $18 per share, which is the midpoint of the estimated price range set forth on the cover page of this prospectus, after deducting the estimated underwriting discounts and commissions, estimated offering expenses payable by us and giving effect to the repayment of certain indebtedness and the use of proceeds specified in “Use of Proceeds.” |
The pro forma as adjusted information set forth in the table below is illustrative only and our capitalization following the closing of this offering will be adjusted based on the actual initial public offering price, the number of common shares sold in this offering and other terms of this offering determined at pricing. You should read the following table in conjunction with our financial statements and related notes appearing at the end of this prospectus and the sections of the prospectus titled “Selected Historical Consolidated Financial and Operating Data,” “Management’s Discussion and Analysis of Financial Condition and Results of Operations” and “Description of Capital Stock.”
| As of March 31, 2020 (Unaudited) |
||||||||||||
| (in thousands, except share and per share amounts) | Actual | Pro Forma | Pro Forma As Adjusted (1) |
|||||||||
| Cash, Cash Equivalents and Restricted Cash |
$83,627 | $ | 212,627 | $ |
512,644 |
| ||||||
| Current and Long-Term Debt |
435,361 | 435,361 | 435,361 | |||||||||
| Temporary equity: |
||||||||||||
| Series A redeemable convertible preferred stock, |
127 | — | — | |||||||||
| Series B convertible preferred stock, |
372 | — | — | |||||||||
| Series C convertible preferred stock, |
63 | — | — | |||||||||
-53-
Table of Contents
| As of March 31, 2020 (Unaudited) |
||||||||||||
| (in thousands, except share and per share amounts) | Actual | Pro Forma | Pro Forma As Adjusted (1) |
|||||||||
| Series D convertible preferred stock, |
$ | 40 | — | — | ||||||||
| Series E convertible preferred stock, |
— | — | — | |||||||||
|
|
|
|
|
|
|
|||||||
| Total temporary equity |
602 | — | — | |||||||||
|
|
|
|
|
|
|
|||||||
| Shareholders’ equity: |
||||||||||||
| Common stock, $0.01 par value—700,000,000 shares authorized, 92,245,912 shares issued and outstanding, actual; 700,000,000 shares authorized, 144,650,597 shares issued and outstanding, pro forma; 700,000,000 shares authorized, 162,650,597 shares issued and outstanding, pro forma as adjusted |
922 | 1,446 | 1,626 | |||||||||
| Additional paid-in capital |
85,314 | 214,392 | 514,229 | |||||||||
|
|
|
|||||||||||
| Treasury stock |
— | — | — | |||||||||
| Retained earnings |
(22,841 | ) | (22,841 | ) | (22,841 | ) | ||||||
|
|
|
|
|
|
|
|||||||
| Total shareholders’ equity |
$ | 63,395 | $ | 192,997 | $ | 493,014 | ||||||
|
|
|
|
|
|
|
|||||||
| (1) | The pro forma as adjusted balance sheet data give further effect to our issuance and sale of 18,000,000 shares of common stock in this offering at an assumed initial public offering price of $18 per share, which is the midpoint of the estimated price range set forth on the cover page of this prospectus, after deducting estimated underwriting discounts and commissions and estimated offering expenses payable by us. |
The pro forma as adjusted information discussed above is illustrative only and will change based on the actual initial public offering price, the number of common shares sold in this offering and other terms of this offering determined at pricing. Each $1.00 increase (decrease) in the assumed initial public offering price of $18 per share of common stock, which is the midpoint of the estimated price range set forth on the cover page of this prospectus, would increase (decrease) our pro forma as adjusted amount of each of cash, working capital, total assets, and total shareholders’ equity by $17.0 million, assuming that the number of shares offered by us, as set forth on the cover page of this prospectus, remains the same and after deducting estimated underwriting discounts and commissions and estimated offering expenses payable by us. Each increase (decrease) of 1,000,000 shares in the number of shares offered by us, as set forth on the cover page of this prospectus, would increase (decrease) our pro forma as adjusted amount of each of cash, working capital, total assets, and total shareholders’ equity by $17.0 million, assuming no change in the assumed initial public offering price per share and after deducting estimated underwriting discounts and commissions and estimated offering expenses payable by us.
The number of shares of our common stock to be outstanding after this offering is based on 144,650,597 shares of common stock issued and outstanding as of the date of this prospectus (assuming the automatic conversion of all outstanding shares of our Series A, B, C, D and E preferred stock into an aggregate of 52,404,685 shares of common stock upon the closing of this offering) and excludes:
| • | 4,095,968 shares of common stock issuable upon the exercise of options outstanding under the 2003 Stock Plan as of the date of this prospectus, with a weighted average exercise price of $1.03 per share; |
| • | 9,600,000 shares of common stock that will become available for issuance pursuant to future awards in connection with this offering under the 2020 Plan; and |
| • | 1,400,000 shares of common stock that will become available for issuance in connection with this offering under the Company’s ESPP. |
-54-
Table of Contents
If you invest in our common stock in this offering, your ownership interest will be immediately diluted to the extent of the difference between the initial public offering price per share and the pro forma as adjusted net tangible book value per share immediately after this offering.
Our historical net tangible book value as of March 31, 2020 was $42.0 million, or $0.46 per share of common stock. Our historical net tangible book value represents our total tangible assets less our total liabilities and Series A, B, C and D preferred stock, which is not included within our shareholders’ equity. Historical net tangible book value per share represents historical net tangible book value divided by the 92,245,912 shares of common stock outstanding as of March 31, 2020.
Our pro forma net tangible book value as of March 31, 2020 was $171.8 million, or $1.19 per share of common stock. Pro forma net tangible book value represents the amount of our total tangible assets less our total liabilities, after giving effect to the automatic conversion of all outstanding shares of our Series A, B, C, D and E preferred stock into an aggregate of 52,404,685 shares of common stock upon the closing of this offering. Pro forma net tangible book value per share represents our pro forma net tangible book value divided by 144,650,597, the total number of shares of common stock outstanding as of March 31, 2020, after giving effect to the issuance and sale of 135,000 shares of our Series E preferred stock and related receipt of net proceeds of approximately $129.0 million subsequent to March 31, 2020 and the automatic conversion of all outstanding shares of our Series A, B, C, D and E preferred stock into common stock upon the closing of this offering.
After giving further effect to our issuance and sale of 18,000,000 shares of common stock in this offering at an assumed initial public offering price of $18 per share, which is the midpoint of the estimated price range set forth on the cover page of this prospectus, and after deducting the estimated underwriting discounts and commissions and estimated offering expenses payable by us, our pro forma as adjusted net tangible book value as of March 31, 2020 would have been $447.8 million, or $2.75 per share. This amount represents an immediate increase in pro forma as adjusted net tangible book value of $1.57 per share to our existing stockholders and immediate dilution of $15.25 per share to new investors purchasing our shares of common stock in this offering. Dilution per share to new investors is determined by subtracting the pro forma as adjusted net tangible book value per share after this offering from the initial public offering price per share of our common stock paid by new investors. The following table illustrates this dilution on a per share basis:
| Assumed initial public offering price per share |
$ | 18 | ||||||
| Historical net tangible book value per share as of March 31, 2020 |
$ | 0.46 | ||||||
| Increase per share attributable to the pro forma adjustment described above |
0.73 | |||||||
|
|
|
|||||||
| Pro forma net tangible book value per share as of March 31, 2020 |
$ | 1.19 | ||||||
| Increase in pro forma as adjusted net tangible book value per share attributable to new investors purchasing our common stock in this offering |
$ | 1.57 | ||||||
|
|
|
|||||||
| Pro forma as adjusted net tangible book value per share after this offering |
2.75 | |||||||
|
|
|
|||||||
| Dilution per share to new investors purchasing shares of our common stock in this offering |
$ | 15.25 | ||||||
|
|
|
The dilution information discussed above is illustrative only and will change based on the actual initial public offering price, the number of common shares sold in this offering, and other terms of this offering determined at pricing. Each $1.00 increase (decrease) in the assumed initial public offering price of $18 per share of common stock offered by us, which is the midpoint of the estimated price range set forth on the cover page of this prospectus, would increase (decrease) the pro forma as adjusted net tangible book value per share after this offering by $0.10 and the dilution per share to new investors by $0.90, assuming that the number of shares of
-55-
Table of Contents
common stock offered by us, as set forth on the cover page of this prospectus, remains the same and after deducting the estimated underwriting discounts and commissions. Each increase of 1,000,000 shares in the number of shares of common stock offered by us would increase our pro forma as adjusted net tangible book value per share after this offering by $0.08 and decrease the dilution per share to new investors by $0.08, assuming no change in the assumed initial public offering price per share and after deducting estimated underwriting discounts and commissions. Each decrease of 1,000,000 shares in the number of shares of common stock offered by us would decrease our pro forma as adjusted net tangible book value per share after this offering by $0.08 and increase the dilution per share to new investors by $0.08, assuming no change in the assumed initial public offering price per share and after deducting estimated underwriting discounts and commissions.
The following table summarizes, as of March 31, 2020, on the pro forma as adjusted basis as described above, the total number of shares of common stock purchased from us, the total consideration paid and the average price per share paid or to be paid by existing stockholders and new investors acquiring shares of common stock in this offering at an assumed initial public offering price of $18 per share, which is the midpoint of the estimated price range set forth on the cover page of this prospectus, before deducting estimated underwriting discounts and commissions and estimated offering expenses payable by us.
| Shares Purchased | Total Consideration | Average Price Per Share |
||||||||||||||||||
| Number | Percent | Amount | Percent | |||||||||||||||||
| Existing shareholders |
144,650,597 | 88.93 | % | $ | 237,949,370 | 42.34 | % | $ | 1.64 | |||||||||||
| New investors |
18,000,000 | 11.07 | 324,000,000 | 57.66 | $ | 18.00 | ||||||||||||||
|
|
|
|
|
|
|
|
|
|||||||||||||
| Total |
162,650,597 | 100 | % | 561,949,370 | 100 | % | ||||||||||||||
|
|
|
|
|
|
|
|
|
|||||||||||||
The table above excludes 4,095,968 shares of common stock issuable as of the date of this prospectus upon exercise of outstanding stock options at a weighted average exercise price of $1.03 per share. To the extent that any of the foregoing options are exercised, investors participating in the offering will experience further dilution.
-56-
Table of Contents
SELECTED HISTORICAL CONSOLIDATED FINANCIAL AND OPERATING DATA
The following tables present selected historical consolidated financial and operating data for our business as of the dates and for the periods indicated. The selected consolidated statements of operations data presented below for the fiscal years ended June 30, 2019 and June 30, 2018 and the selected consolidated balance sheet data as of June 30, 2019 and June 30, 2018 have been derived from our audited consolidated financial statements included elsewhere in this prospectus. The selected consolidated statements of operations data presented below for the nine month periods ended March 31, 2020 and March 31, 2019 and the selected consolidated balance sheet information as of March 31, 2020 have been derived from our unaudited condensed consolidated financial statements included elsewhere in this prospectus. Where applicable, all share and per share data for the periods shown have been adjusted, on a retroactive basis, to reflect an eight-for-one stock split, which became effective on February 28, 2020.
The selected consolidated historical financial and operating data is not necessarily indicative of the results to be expected in any future period. You should read the following selected historical financial and operating data in conjunction with the section of this prospectus entitled “Management’s Discussion and Analysis of Financial Condition and Results of Operations” and our audited and unaudited consolidated financial statements and related notes appearing at the end of this prospectus.
| Fiscal Year Ended June 30, |
Nine Months Ended March 31, |
|||||||||||||||
| (in thousands, except per share data) | 2019 | 2018 | 2020 | 2019 | ||||||||||||
| Statements of Operations Data: |
||||||||||||||||
| Revenue: |
||||||||||||||||
| Commission |
$ | 296,000 | $ | 206,611 | $ | 353,926 | $ | 231,003 | ||||||||
| Production bonus and other |
41,469 | 27,077 | 36,142 | 32,067 | ||||||||||||
|
|
|
|
|
|
|
|
|
|||||||||
| Total revenue |
337,469 | 233,688 | 390,068 | 263,070 | ||||||||||||
| Operating Costs and Expenses: |
||||||||||||||||
| Cost of revenue |
104,421 | 83,340 | 126,488 | 80,294 | ||||||||||||
| Marketing and advertising |
110,265 | 82,122 | 132,246 | 84,427 | ||||||||||||
| Technical development |
8,326 | 9,913 | 9,088 | 6,232 | ||||||||||||
| General and administrative |
15,864 | 12,349 | 25,779 | 13,095 | ||||||||||||
| Restructuring |
2,305 | 2,808 | — | — | ||||||||||||
|
|
|
|
|
|
|
|
|
|||||||||
| Total operating costs and expenses |
241,181 | 190,532 | 293,601 | 184,048 | ||||||||||||
|
|
|
|
|
|
|
|
|
|||||||||
| Income from operations |
96,288 | 43,156 | 96,467 | 79,022 | ||||||||||||
| Interest expense |
(1,660 | ) | (929 | ) | (16,239 | ) | (1,122 | ) | ||||||||
| Other expenses |
(15 | ) | (709 | ) | (20 | ) | (8 | ) | ||||||||
|
|
|
|
|
|
|
|
|
|||||||||
| Income before income tax expense |
94,613 | 41,518 | 80,208 | 77,892 | ||||||||||||
| Income tax expense |
22,034 | 6,619 | 19,110 | 18,200 | ||||||||||||
|
|
|
|
|
|
|
|
|
|||||||||
| Net income |
$ | 72,579 | $ | 34,899 | $ | 61,098 | $ | 59,692 | ||||||||
|
|
|
|
|
|
|
|
|
|||||||||
| Net income (loss) per share (1): |
||||||||||||||||
| Basic |
$ | 0.70 | $ | 0.27 | $ | (0.38 | ) | $ | 0.59 | |||||||
| Diluted |
$ | 0.55 | $ | 0.23 | $ | (0.38 | ) | $ | 0.45 | |||||||
| Weighted-average common stock outstanding (1): |
||||||||||||||||
| Basic |
85,378 | 81,314 | 89,989 | 84,976 | ||||||||||||
| Diluted |
132,491 | 96,421 | 89,989 | 132,976 | ||||||||||||
| Pro forma net income per share: (1) |
||||||||||||||||
| Pro forma net income per share attributable to common shareholders (unaudited): |
||||||||||||||||
| Basic |
$ | 0.56 | $ | 0.46 | ||||||||||||
| Diluted |
$ | 0.55 | $ | 0.44 | ||||||||||||
| Pro forma weighted-average common stock outstanding (unaudited): |
||||||||||||||||
| Basic |
129,449 | 134,060 | ||||||||||||||
| Diluted |
132,491 | 138,206 | ||||||||||||||
| (1) | See Note 10 to our audited financial statements and Note 8 to our unaudited consolidated financial statements appearing at the end of this prospectus for an explanation of the method used to calculate historical and pro forma net income (loss) per share, basic and diluted, and the weighted-average number of shares used in the computation of the per share amounts. |
-57-
Table of Contents
| As of March 31, 2020 | As of June 30, 2019 |
As of June 30, 2018 |
||||||||||||||||||
| (in thousands) | Actual | Pro Forma (1) | Pro Forma As Adjusted (2) |
Actual | Actual | |||||||||||||||
| Balance Sheet Data: |
||||||||||||||||||||
| Cash, cash equivalents and restricted cash |
$ | 83,627 | $ | 212,627 | $ | 512,644 | $ | 570 | $ | 958 | ||||||||||
| Accounts receivable |
76,886 | 76,886 | 76,886 | 59,829 | 51,153 | |||||||||||||||
| Commissions receivable—current |
46,699 | 46,699 | 46,699 | 36,108 | 27,863 | |||||||||||||||
| Commissions receivable—net |
411,352 | 411,352 | 411,352 | 279,489 | 196,095 | |||||||||||||||
| Total assets |
661,661 | 790,661 | 1,090,678 | 406,940 | 297,557 | |||||||||||||||
| Total current liabilities |
57,045 | 57,045 | 57,045 | 33,222 | 24,283 | |||||||||||||||
| Debt |
411,054 | 411,054 | 411,054 | 11,032 | 19,752 | |||||||||||||||
| Non-recourse debt—net |
18,689 | 18,689 | 18,689 | 10,615 | — | |||||||||||||||
| Deferred income taxes |
100,369 | 100,369 | 100,369 | 81,252 | 59,614 | |||||||||||||||
| Total liabilities |
597,664 | 597,664 | 597,664 | 143,688 | 109,631 | |||||||||||||||
| Total temporary equity |
602 | — | — | 797 | 797 | |||||||||||||||
| Total shareholders’ equity |
$ | 63,395 | $ | 192,997 | $ | 493,014 | $ | 262,455 | $ | 187,129 | ||||||||||
| (1) | The pro forma balance sheet data give effect to the issuance and sale of 135,000 shares of our Series E preferred stock and related receipt of net proceeds of approximately $129.0 million subsequent to March 31, 2020 and the automatic conversion of all outstanding shares of our Series A, B, C, D and E preferred stock into an aggregate of 52,404,685 shares of common stock upon the closing of this offering. |
| (2) | The pro forma as adjusted balance sheet data give further effect to our issuance and sale of 18,000,000 shares of common stock in this offering at an assumed initial public offering price of $18 per share, which is the midpoint of the estimated price range set forth on the cover page of this prospectus, after deducting estimated underwriting discounts and commissions and estimated offering expenses payable by us. |
The pro forma as adjusted information discussed above is illustrative only and will change based on the actual initial public offering price, the number of common shares sold in this offering, and other terms of this offering determined at pricing.
| Fiscal Year Ended June 30, |
Nine Months Ended March 31, |
|||||||||||||||
| (in thousands, except for percentages and Senior Approved Policies) | 2019 | 2018 | 2020 | 2019 | ||||||||||||
| Other Unaudited Financial and Operating Data: |
||||||||||||||||
| Adjusted EBITDA (1) |
$ | 105,278 | $ | 49,926 | $ | 113,886 | $ | 85,759 | ||||||||
| Adjusted EBITDA Margin (1) |
31.2 | % | 21.4 | % | 29.2 | % | 32.6 | % | ||||||||
| Senior Approved Policies |
168,742 | 106,882 | 234,955 | 136,636 | ||||||||||||
| Life Premium |
$ | 89,966 | $ | 78,354 | $ | 74,240 | $ | 64,663 | ||||||||
| Auto & Home Premium |
$ | 56,719 | $ | 50,460 | $ | 48,925 | $ | 40,117 | ||||||||
| (1) | These financial measures are not calculated in accordance with GAAP. See “Non-GAAP Financial Measures” below and “Management’s Discussion and Analysis of Financial Condition and Results of Operations—Non-GAAP Financial Measures (Adjusted EBITDA)” in this prospectus for information regarding our use of these non-GAAP financial measures and a reconciliation of such measures to their nearest comparable financial measures calculated and presented in accordance with GAAP. |
-58-
Table of Contents
Non-GAAP Financial Measures
To supplement our financial statements presented in accordance with GAAP and to provide investors with additional information regarding our GAAP financial results, we have presented in this prospectus Adjusted EBITDA and Adjusted EBITDA Margin, which are non-GAAP financial measures. These non-GAAP financial measures are not based on any standardized methodology prescribed by GAAP and are not necessarily comparable to similarly titled measures presented by other companies.
Adjusted EBITDA. We define Adjusted EBITDA as income before interest expense, income tax expense, depreciation and amortization, and certain addbacks for non-cash or non-recurring expenses, including restructuring and share-based compensation expenses. The most directly comparable GAAP measure is net income. We monitor and have presented in this prospectus Adjusted EBITDA because it is a key measure used by our management and Board of Directors to understand and evaluate our operating performance, to establish budgets and to develop operational goals for managing our business. In particular, we believe that excluding the impact of these expenses in calculating Adjusted EBITDA can provide a useful measure for period-to-period comparisons of our core operating performance.
We believe that this non-GAAP financial measure helps identify underlying trends in our business that could otherwise be masked by the effect of the expenses that we exclude in the calculations of this non-GAAP financial measure. Accordingly, we believe that this financial measure provides useful information to investors and others in understanding and evaluating our operating results, enhancing the overall understanding of our past performance and future prospects.
Adjusted EBITDA is not prepared in accordance with GAAP and should not be considered in isolation of, or as an alternative to, measures prepared in accordance with GAAP. There are a number of limitations related to the use of this non-GAAP financial measure rather than net income, which is the most directly comparable financial measure calculated and presented in accordance with GAAP. These limitations include the fact that Adjusted EBITDA excludes depreciation and amortization expense, share-based compensation expense and income tax expense. In addition, other companies may use other measures to evaluate their performance, all of which could reduce the usefulness of our non-GAAP financial measures as tools for comparison.
The following tables reconcile Adjusted EBITDA and net income, the most directly comparable financial measure calculated and presented in accordance with GAAP.
Adjusted EBITDA for the nine month period ended March 31, 2020
| (in thousands) | Senior | Life | Auto & Home |
Corp & Elims |
Consolidated | |||||||||||||||
| Net income |
$ | 61,098 | ||||||||||||||||||
| Interest expense |
16,239 | |||||||||||||||||||
| Income tax expense |
19,110 | |||||||||||||||||||
| Depreciation and amortization |
5,273 | |||||||||||||||||||
| Non-recurring expenses (1) |
2,648 | |||||||||||||||||||
| Share-based compensation expense |
9,283 | |||||||||||||||||||
| Loss on disposal of property, equipment and software |
235 | |||||||||||||||||||
|
|
|
|
|
|
|
|
|
|
|
|||||||||||
| Adjusted EBITDA |
$ | 112,352 | $ | 15,552 | $ | 5,594 | $ | (19,612 | ) | $ | 113,886 | |||||||||
| (1) | These expenses consist of one-time consulting expenses associated with adopting ASC 606, non-recurring compensation to certain former Board members, non-restructuring severance expenses, employer payroll taxes on the one-time Distribution to stock option holders, costs related to our initial public offering, and expenses related to business continuity in response to the COVID-19 pandemic. |
-59-
Table of Contents
Adjusted EBITDA for the nine month period ended March 31, 2019
| (in thousands) | Senior | Life | Auto & Home |
Corp & Elims |
Consolidated | |||||||||||||||
| Net income |
$ | 59,692 | ||||||||||||||||||
| Interest expense |
1,122 | |||||||||||||||||||
| Income tax expense |
18,200 | |||||||||||||||||||
| Depreciation and amortization |
3,446 | |||||||||||||||||||
| Non-recurring expenses (1) |
3,180 | |||||||||||||||||||
| Share-based compensation expense |
67 | |||||||||||||||||||
| Loss on disposal of property, equipment and software |
52 | |||||||||||||||||||
|
|
|
|
|
|
|
|
|
|
|
|||||||||||
| Adjusted EBITDA |
$ | 77,179 | $ | 16,721 | $ | 5,540 | $ | (13,681 | ) | $ | 85,759 | |||||||||
| (1) | These expenses consist primarily of one-time consulting expenses associated with adopting ASC 606, non-recurring compensation to certain former Board members, restructuring expenses consisting primarily of expenses associated with initiatives to reduce costs and consolidate leadership and back office functions from San Francisco to Kansas City, and non-restructuring severance expenses. |
Adjusted EBITDA for fiscal 2019
| (in thousands) | Senior | Life | Auto & Home |
Corp & Elims |
Consolidated | |||||||||||||||
| Net income |
$ | 72,579 | ||||||||||||||||||
| Interest expense |
1,660 | |||||||||||||||||||
| Income tax expense |
22,034 | |||||||||||||||||||
| Depreciation and amortization |
4,702 | |||||||||||||||||||
| Non-recurring expenses (1) |
1,691 | |||||||||||||||||||
| Restructuring expenses (2) |
2,305 | |||||||||||||||||||
| Share-based compensation expense |
86 | |||||||||||||||||||
| Loss on disposal of property, equipment and software |
221 | |||||||||||||||||||
|
|
|
|
|
|
|
|
|
|
|
|||||||||||
| Adjusted EBITDA |
$ | 90,174 | $ | 25,821 | $ | 7,817 | $ | (18,534 | ) | $ | 105,278 | |||||||||
| (1) | These expenses consist primarily of one-time consulting expenses associated with adopting ASC 606, non-recurring compensation to certain Board members and non-restructuring severance expenses. |
| (2) | Restructuring expenses consist primarily of expenses associated with initiatives to reduce costs and consolidate leadership and back office functions from San Francisco to Kansas City. |
-60-
Table of Contents
Adjusted EBITDA for fiscal 2018
| (in thousands) | Senior | Life | Auto & Home |
Corp & Elims |
Consolidated | |||||||||||||||
| Net income |
$ | 34,899 | ||||||||||||||||||
| Interest expense |
929 | |||||||||||||||||||
| Income tax expense |
6,619 | |||||||||||||||||||
| Depreciation and amortization |
3,468 | |||||||||||||||||||
| Non-recurring expenses (1) |
436 | |||||||||||||||||||
| Restructuring expenses (2) |
2,808 | |||||||||||||||||||
| Share-based compensation expense |
67 | |||||||||||||||||||
| Loss on disposal of property, equipment and software |
700 | |||||||||||||||||||
|
|
|
|
|
|
|
|
|
|
|
|||||||||||
| Adjusted EBITDA |
$ | 36,688 | $ | 22,969 | $ | 9,221 | $ | (18,952 | ) | $ | 49,926 | |||||||||
| (1) | These expenses consist primarily of one-time consulting expenses associated with adopting ASC 606, non-recurring compensation to certain Board members and non-restructuring severance expenses. |
| (2) | Restructuring expenses consist primarily of expenses associated with initiatives to reduce costs and consolidate leadership and back office functions from San Francisco to Kansas City. |
Adjusted EBITDA Margin. We define Adjusted EBITDA Margin as Adjusted EBITDA divided by Revenue.
-61-
Table of Contents
MANAGEMENT’S DISCUSSION AND ANALYSIS OF FINANCIAL CONDITION AND
RESULTS OF OPERATIONS
This section presents management’s perspective on our financial condition and results of operations. The following discussion and analysis is intended to highlight and supplement data and information presented elsewhere in this prospectus, including the consolidated financial statements and related notes, and should be read in conjunction with the accompanying tables and our annual audited financial statements. To the extent that this discussion describes prior performance, the descriptions relate only to the periods listed, which may not be indicative of our future financial outcomes. In addition to historical information, this discussion contains forward-looking statements that involve risks, uncertainties and assumptions that could cause results to differ materially from management’s expectations. Factors that could cause such differences are discussed in the sections titled “Cautionary Note Regarding Forward-Looking Statements” and “Risk Factors.”
Management’s discussion and analysis of our financial condition and results of operations should be read in conjunction with the sections “Prospectus Summary—Summary Historical Consolidated Financial and Operating Data,” “Selected Historical Consolidated Financial and Operating Data,” and our consolidated financial statements and notes thereto included elsewhere in this prospectus. The following discussion includes forward-looking statements that reflect our plans, estimates and assumptions and involves numerous risks and uncertainties, including, but not limited to, those described in the “Risk Factors” section of this prospectus. See “Cautionary Note Regarding Forward-Looking Statements.” Future results could differ significantly from the historical results presented in this section.
The following Management’s Discussion and Analysis of Financial Condition and Results of Operations is provided to supplement the consolidated financial statements and the related notes included elsewhere in this prospectus. We intend for this discussion to provide you with information that will assist you in understanding our financial statements, the changes in key items in those financial statements from year to year, and the primary factors that accounted for those changes.
Data as of and for the years ended June 30, 2019 and 2018 has been derived from our audited consolidated financial statements included elsewhere in this prospectus. Data as of and for the nine month periods ended March 31, 2020 and 2019 has been derived from our unaudited condensed consolidated financial statements included elsewhere in this prospectus. Where applicable, all share and per share data for the periods shown have been adjusted, on a retroactive basis, to reflect an eight-for-one stock split, which became effective on February 28, 2020.
Overview
We are a leading technology-enabled, DTC distribution platform that provides consumers with a transparent and convenient venue to shop for complex senior health, life and auto & home insurance policies from a curated panel of the nation’s leading insurance carriers. Our proprietary technology allows us to take a broad funnel approach to marketing by analyzing and identifying high quality consumer leads sourced from a wide variety of online and offline marketing channels. We continue to enhance our visibility with advertisements on nationwide TV networks (including CNN, Fox News and ESPN) and radio outlets, while also maintaining a strong online presence through our market-leading comparison websites, complemented by search engine advertising and a social media presence (Facebook, YouTube, etc.). We distribute in all 50 states and the District of Columbia, and during the year ended June 30, 2019 and the nine month period ended March 31, 2020, we provided over 225,000 and 285,000 new individuals with insurance coverage, respectively.
Founded over 30 years ago as what we believe was the first DTC term life insurance exchange platform in the U.S., our technology-driven, differentiated model allows consumers to easily compare pricing and policy options from over 50 of the nation’s leading insurance carriers. Working in tandem, our agents and technology systems are the foundational pillars of our franchise. Our highly trained and licensed agents are subject matter experts in the products they sell, and this, in combination with our purpose-built software and business process,
-62-
Table of Contents
differentiates the service we provide to consumers relative to other insurance distributors or “online only” offerings. We believe providing personalized advice and guidance from policy research to enrollment is a key differentiator in the senior health market as consumers tend to prefer or require more personalized attention to navigate increasingly complex and ever-changing coverage options. Our agents on the SelectQuote platform are trained to offer unbiased advice in order to be more aligned to the specific needs of each customer.
Direct distribution is becoming an increasingly important part of the overall distribution strategies of insurance carriers as they drive to lower customer acquisition costs. Internet and mobile devices enable distributors to target and reach consumers directly in a highly controlled and efficient manner. Our software allows our agents to have more effective interactions with customers, driving agent productivity and sales volumes. Direct channels provide consumers with a more convenient way to purchase insurance, as well as the optionality to build customized coverage.
Our core mission has been to provide solutions that help consumers with their overall financial well-being by protecting their most valued assets: their families, their health and their property. In pursuit of this, SelectQuote began distributing life insurance policies in 1985 and over time has expanded to also offer senior health and auto & home insurance products to a policyholder base of over 2 million. Key highlights of our history of innovation and growth include:
| • | In 1985, we founded SelectQuote, as what we believe was the pioneer of direct marketing of term life insurance; |
| • | In 2011, we launched a comparison shopping platform for senior health insurance, initially focusing on Medicare Supplement and Medicare Advantage, and auto & home insurance; |
| • | In 2011, we instituted the AEP flex team to capitalize on seasonal Medicare sales volumes; |
| • | In 2014, we launched carrier pods; |
| • | In 2017, we opened a regional sales office in Denver, Colorado to drive additional AEP scale; |
| • | In 2017, Tim Danker was promoted to Chief Executive Officer and Raffaele Sadun was hired as Chief Financial Officer; and |
| • | In 2018, we moved our headquarters to a newly-built complex in Overland Park, Kansas. |
These business strategies have allowed us to rapidly and efficiently scale our business. For the year ended June 30, 2019, we earned $337.5 million of revenue representing 44% growth over the $233.7 million of revenue that we earned during the year ended June 30, 2018. For the year ended June 30, 2019, we generated $72.6 million in net income, an increase of 108% over the year ended June 30, 2018 net income we generated of $34.9 million. For the year ended June 30, 2019, we generated $105.3 million in Adjusted EBITDA, an increase of 111% over the year ended June 30, 2018 when we generated $49.9 million in Adjusted EBITDA, and our Adjusted EBITDA Margin increased to 31.2% for the year ended June 30, 2019, from 21.4% for the year ended June 30, 2018.
For the nine month period ended March 31, 2020, we earned $390.1 million of revenue representing 48.3% growth over the $263.1 million of revenue that we earned for the nine month period ended March 31, 2019. Net income increased 2.4% from $59.7 million for the nine month period ended March 31, 2019 to $61.1 million for the nine month period ended March 31, 2020. During the nine month period ended March 31, 2020, we generated $113.9 million in Adjusted EBITDA, an increase of 32.8% over the nine month period ended March 31, 2019, when we generated $85.8 million in Adjusted EBITDA. Our Adjusted EBITDA Margin decreased to 29.2% for the nine month period ended March 31, 2020, from 32.6% for the nine month period ended March 31, 2019.
Adjusted EBITDA and Adjusted EBITDA Margin are Non-GAAP financial measures that we use to measure our operating performance. For a reconciliation of these Non-GAAP financial measures to our GAAP
-63-
Table of Contents
financial measures, please see “Selected Historical Consolidated Financial and Operating Data—Non-GAAP Financial Measures” and “Management’s Discussion and Analysis of Financial Condition and Results of Operations—Non-GAAP Financial Measures (Adjusted EBITDA)” in this prospectus.
Industry Trends
We estimate that the total addressable market for the insurance products we distribute is greater than $180 billion. Further, while these markets are already substantial, they are also growing, in part due to a number of highly attractive demographic trends. Our Senior segment serves consumers predominantly in the over 65 age category. The over 65 age category grew at a 3.4% CAGR from 2010 to 2016, and grew from 12.9% of the total population to 15.2% of the total population according to the United States Census Bureau. The over 65 age category is expected to grow at a 3.2% CAGR from 2016 to 2025, by which point it will account for 18.9% of the population, according to the United States Census Bureau. On average, 10,000 “Baby Boomers” are expected to turn 65 every day or nearly 4 million per year, for the next 10 years. As a result, Medicare enrollment is growing steadily, with the number of Medicare enrollees expected to grow from 59.9 million in 2018 (up from 45.5 million in 2008 and 52.5 million in 2013), to approximately 68.4 million in 2023 then rising to 76.7 million by 2028, according to CSG Actuarial. Of this, Medicare Advantage plans are representing an increasing share of the Medicare market. At the end of 2017, there were approximately 20 million Medicare Advantage enrollees, representing approximately 35% penetration of the Medicare market. By 2025, the number of Medicare Advantage enrollees is expected to swell to approximately 38 million, representing a 50% penetration rate of the Medicare market. Medicare Advantage is expected to reach 60% to 70% penetration between 2030 and 2040, according to LEK Consulting, highlighting the pace with which this already large segment of the Medicare market is growing. The degree to which we will realize a corresponding increase in revenue will be determined by our ability to continue to successfully place new Medicare policies for this enlarged potential consumer base.
Our Life segment is one of the country’s largest DTC insurance distributors for term life insurance and provides unbiased comparison shopping for life insurance and ancillary products such as guaranteed issue, final expense, term life express, accidental death and juvenile insurance. The U.S. life insurance market is mature and has experienced annual premium growth of 1.4% since 2013, according to S&P Global. Growth in the life insurance sector is driven by a number of macro-economic factors including population growth, general economic growth and individual wealth accumulation.
Our Auto & Home segment predominantly sells automobile and homeowners insurance. The auto insurance industry has grown at an annual rate of 6.3% from 2013—2018 based on Statutory Direct Premiums Written, according to S&P Global, with 2018 written premium totaling $247 billion. Industry growth is driven by growth in the number of registered vehicles, increases in insurance premium rates and general economic growth. The homeowners insurance industry has grown at an annual rate of 3.8% from 2013—2018 based on Statutory Direct Premiums Written, according to S&P Global, with 2018 written premium totaling $99 billion. Industry growth is driven by growth in housing supply, increases in insurance premium rates and general economic growth.
Recent technological innovations, including the development of machine learning for business applications and the proliferation of smart mobile devices as a means of consumer purchasing, are changing the insurance distribution landscape. As the composition of the U.S. population gradually shifts to the mobile-first generation, consumers are becoming more tech-savvy and comfortable shopping online. The internet plays a role in 8 out of 10 life insurance purchases, according to LIMRA. Additionally, 71% of U.S. auto insurance shoppers obtain online quotes annually, according to Comscore. We believe our proprietary technology platform, vast datasets and use of machine learning in all aspects of our business put us in an excellent position to take advantage of these consumer trends.
Factors Affecting Our Results of Operations
We generate commission revenue from selling policies in the senior health, life and auto and home markets on behalf of our insurance carrier partners, the majority of which compensate us through first year and renewal
-64-
Table of Contents
commissions. We use our proprietary technology and processes to generate and obtain consumer leads and allocate those leads to agents who are best suited for those consumers. As a result, one of the primary factors affecting our growth is our total number of agents, comprised of both existing core agents and the number of new flex agents that we hire and train to sell new policies. We view agents as a critical component of helping consumers through the purchasing process to enable them to identify the most appropriate coverage that suits their needs. Through our years of experience, we have expanded our recruiting efforts and enhanced our training programs, both of which have allowed us to expand our agent force.
We have also developed proprietary technologies and processes that enable us to expand our lead acquisition efforts to keep pace with our expanding sales force and maintain agent productivity despite the significant growth in number of agents.
The amount of revenue we expect to recognize per policy is based on multiple factors, including our commission rates with our insurance carrier partners and the expected retention rates of different types of policies. The higher our retention rates, the more revenue we expect to generate pursuant to our carrier agreements, which generally entitle us to receive annual renewal commissions for so long as the policyholder renews his or her policy. Additionally, we earn certain volume-based bonuses from some carriers on first-year policies sold, which we refer to as production bonuses and marketing development funds, based on attaining various predetermined target sales levels or other agreed upon objectives, as presented in the consolidated statements of operations as production bonus and other revenue. These commissions that we expect to generate over the life of an approved policy less the cost of acquiring the business is a key component to our overall profitability. Our goal is to maximize policyholder lifetime value by increasing retention rates, which starts by providing consumers with a transparent, valuable and best-in-class consumer experience and making sure they are buying a policy that meets their specific needs.
Our business is highly competitive and we compete with other insurance brokers, brokerages who sell primarily or exclusively online and with insurance carriers who sell directly to consumers. We believe that we compete effectively against these competitors through our platform, which aims to provide best-in-class service to deliver greater transparency, choice and value to the consumer.
Our business is seasonal with 36% of our revenue for the year ended June 30, 2019, generated during our second quarter. This is driven by the size and seasonality of our Senior segment, which generated 45% of its revenue during the second quarter. AEP is the main driver of this seasonality and we meet this seasonal demand by hiring flex agents in our first quarter and training them for up to 10 weeks before they start selling during AEP in the second quarter.
Financial Highlights for the Nine Month Period Ended March 31, 2020
| • | Total revenue increased 48% from the nine month period March 31, 2019 to $390.1 million; |
| • | Net income and Adjusted EBITDA, a non-GAAP measure, increased 2% and increased 33%, respectively, from the nine month period ended March 31, 2019, to $61.1 million and $113.9 million, respectively; |
| • | Senior revenue increased 73% from the nine month period ended March 31, 2019 to $273.8 million; |
| • | Senior total approved policies increased 72% from the nine month period ended March 31, 2019 to 234,955 policies; |
| • | Life revenue increased 10% from the nine month period ended March 31, 2019 to $87.5 million; and |
| • | Auto & Home revenue increased 15% from the nine month period ended March 31, 2019 to $29.1 million. |
-65-
Table of Contents
Financial Highlights for the Year Ended June 30, 2019
| • | Total revenue increased 44% from the year ended June 30, 2018 to $337.5 million; |
| • | Net income and Adjusted EBITDA, a non-GAAP measure, increased 108% and 111%, respectively, from the year ended June 30, 2018, to $72.6 million and $105.3 million, respectively; |
| • | Senior revenue increased 88% from the year ended June 30, 2018 to $192.3 million; |
| • | Senior total approved policies increased 58% from the year ended June 30, 2018 to 168,742 policies; |
| • | Life revenue increased 13% from the year ended June 30, 2018 to $110.5 million; and |
| • | Auto & Home revenue increased 5% from the year ended June 30, 2018 to $35.1 million. |
Response to COVID-19
With social distancing measures having been implemented to curtail the spread of COVID-19, we enacted a robust business continuity plan, including a work-from-home policy for all of our agents and other employees. We believe our technology platform and pre-existing remote agent capabilities have allowed for a seamless transition to a remote working environment without any material impacts to our business, highlighting the resilience of our business model. We believe that a business like ours is well-suited to navigate the current environment in which consumers are particularly focused on healthcare issues and mortality and social distancing requirements push consumers to conduct business remotely, while the underlying demand dynamics for our core products remains unchanged. We further believe that our remote agent platform and our commission-based agent compensation model continue to provide agents with productivity incentives and a stable and attractive source of income, thereby allowing us to continue to retain and attract agents. Further, as consumers become more comfortable with conducting business remotely, we believe consumer adoption of distribution models such as ours may continue to accelerate long after the COVID-19 pandemic ends.
The extent to which the COVID-19 outbreak affects our business will depend on future developments in the United States and around the world, which are highly uncertain and cannot be predicted, including new information which may emerge concerning the severity of the coronavirus and the actions required to contain and treat it, among others. Although the extent of the effect of the COVID-19 pandemic on our business and financial results is uncertain, the effects of a continued and prolonged public health crisis such as the COVID-19 pandemic could have a material negative impact on our business, operating results and financial condition. See “Risk Factors—Risks Related to Our Business and Industry—The COVID-19 pandemic could adversely affect our business, operating results and financial condition” for additional information.
Key Business and Operating Metrics by Segment
In addition to traditional financial metrics, we rely upon certain business and operating metrics to estimate and recognize commission revenue, evaluate our business performance and facilitate our operations. In our Senior segment, our primary product, Medicare Advantage, pays us flat commission rates based on the number of policies we sell on behalf of our insurance carrier partners. Therefore, we have determined that units and unit metrics are the most appropriate measures to evaluate the performance of the Senior segment. In our Life and Auto & Home segments, we are typically paid a commission that is a percent of the premium that we generate for our insurance carrier partners. Therefore, we have determined that premium-based metrics are the most relevant measures to evaluate the performance of these segments. Below are the most relevant business and operating metrics for each segment:
-66-
Table of Contents
Senior
Submitted Policies
Submitted policies are counted when an individual completes an application with our licensed agent and provides authorization to them to submit it to the insurance carrier partner. The applicant may have additional actions to take before the application will be reviewed by the insurance carrier, such as providing additional information.
The following table shows the number of submitted policies for the periods presented:
| Fiscal Year Ended June 30, |
Nine Months Ended March 31, |
|||||||||||||||
| 2019 | 2018 | 2020 | 2019 | |||||||||||||
| Medicare Advantage |
119,562 | 57,973 | 205,270 | 98,816 | ||||||||||||
| Medicare Supplement |
23,593 | 27,059 | 16,383 | 20,052 | ||||||||||||
| Dental, Vision and Hearing |
36,619 | 27,571 | 52,806 | 24,941 | ||||||||||||
| Prescription Drug Plan |
12,691 | 11,330 | 11,135 | 11,200 | ||||||||||||
| Other |
5,746 | 9,984 | 3,612 | 5,454 | ||||||||||||
|
|
|
|
|
|
|
|
|
|||||||||
| Total |
198,211 | 133,917 | 289,206 | 160,463 | ||||||||||||
Total submitted policies increased by 48% for the year ended June 30, 2019 compared to the year ended June 30, 2018. The increase was driven primarily by a 106% increase in MA submitted policies and a 33% increase in dental, vision and hearing submitted policies. These increases were partially offset by a 13% decrease in Medicare Supplement submitted policies. The increase in submitted policies was primarily due to the increase in the number of agents we employ. We increased the number of core and flex productive agents by 54% and 41%, respectively, from 2018, particularly during AEP and OEP. AEP tends to drive more Medicare Advantage volume than Medicare Supplement volume, and the increase in popularity of Medicare Advantage plans, some of which have zero premiums associated with them, also contributed to the decrease in Medicare Supplement submitted policies. Additionally, the expansion of OEP for 2019, which enabled Medicare Advantage consumers to switch their plans between January 1 and March 31, also increased the number of MA policies we sold year over year, contributing to the decrease in MS submitted policies as well.
Total submitted policies increased by 80% for the nine month period ended March 31, 2020 compared to the nine month period ended March 31, 2019. The increase was driven primarily by a 108% increase in MA submitted policies and a 112% increase in dental, vision and hearing submitted policies. These increases were partially offset by an 18% decrease in Medicare Supplement submitted policies. The increase in submitted policies was primarily due to the increase in the number of agents we employ. During the nine month period ended March 31, 2020, we increased the number of average productive agents by 56% from the nine month period ended March 31, 2019. AEP and OEP tend to drive more Medicare Advantage volume than Medicare Supplement volume, and the increase in popularity of Medicare Advantage plans, some of which have zero premiums associated with them, also contributed to the decrease in Medicare Supplement submitted policies.
-67-
Table of Contents
Approved Policies
Approved policies represents the number of submitted policies that were approved by our insurance carrier partners for the identified product during the indicated period. Not all approved policies will go in force.
The following table shows the number of approved policies for the periods presented:
| Fiscal Year Ended June 30, |
Nine Months Ended March 31, |
|||||||||||||||
| 2019 | 2018 | 2020 | 2019 | |||||||||||||
| Medicare Advantage |
107,665 | 50,255 | 171,099 | 88,523 | ||||||||||||
| Medicare Supplement |
16,593 | 19,310 | 11,740 | 14,055 | ||||||||||||
| Dental, Vision and Hearing |
28,643 | 20,247 | 38,992 | 19,567 | ||||||||||||
| Prescription Drug Plan |
11,739 | 10,203 | 10,528 | 10,567 | ||||||||||||
| Other |
4,102 | 6,867 | 2,596 | 3,924 | ||||||||||||
|
|
|
|
|
|
|
|
|
|||||||||
| Total |
168,742 | 106,882 | 234,955 | 136,636 | ||||||||||||
In general, the relationship between submitted policies and approved policies has been steady over time. Therefore, factors impacting the number of submitted policies also impact the number of approved policies.
Total approved policies increased by 58% for the year ended June 30, 2019 compared to the year ended June 30, 2018. The increase was driven primarily by a 114% increase in MA approved policies and a 41% increase in dental, vision and hearing approved policies. These increases were partially offset by a 14% decrease in Medicare Supplement approved policies. Fluctuations in approved policies are in direct correlation to submitted policies; therefore, the increases in the number of core and flex productive agents and the dynamics of AEP and OEP noted above, also resulted in the increase in approved policies compared to the year ended June 30, 2018.
Total approved policies increased by 72% for the nine month period ended March 31, 2020 compared to the nine month period ended March 31, 2019. The increase was driven primarily by a 93% increase in MA approved policies and a 99% increase in dental, vision and hearing approved policies. These increases were partially offset by a 16% decrease in Medicare Supplement approved policies. Fluctuations in approved policies are in direct correlation to submitted policies; therefore, the increases in the number of core and flex productive agents and the dynamics of AEP noted above, also resulted in the increase in approved policies compared to the nine month period ended March 31, 2019.
Lifetime Value of Commissions per Approved Policy
Lifetime value of commissions per approved policy represents commissions estimated to be collected over the estimated life of an approved policy based on multiple factors, including but not limited to, contracted commission rates, carrier mix and expected policy persistency with applied constraints. The lifetime value of commissions per approved policy is equal to the sum of the commission revenue due upon the initial sale of a policy, and when applicable, an estimate of future renewal commissions. The estimate of the future renewal commissions is determined using contracted renewal commission rates constrained by a persistency-adjusted 10-year renewal period based on a combination of our historical experience and available industry and insurance carrier historical experience to estimate renewal revenue only to the extent probable that a material reversal in revenue would not be expected to occur. These factors may result in varying values from period to period. The lifetime value of commissions per approved policy represents commissions only from policies sold during the period. That figure excludes renewals during the period from policies originally sold in a prior period with insurance carrier partners whose contracts preclude us from recognizing variable consideration for estimated renewal commissions and updated estimates of prior period variable consideration based on actual policy renewals in the current period.
-68-
Table of Contents
The following table shows the lifetime value of commissions per approved policy for the periods presented:
| Fiscal Year Ended June 30, |
Nine Months Ended March 31, |
|||||||||||||||
| (dollars per policy): | 2019 | 2018 | 2020 | 2019 | ||||||||||||
| Medicare Advantage |
$ | 1,279 | $ | 1,235 | $ | 1,297 | $ | 1,283 | ||||||||
| Medicare Supplement |
1,312 | 1,184 | 1,372 | 1,287 | ||||||||||||
| Dental, Vision and Hearing |
152 | 141 | 146 | 144 | ||||||||||||
| Prescription Drug Plan |
267 | 285 | 229 | 266 | ||||||||||||
| Other |
621 | 362 | 99 | 623 | ||||||||||||
The lifetime value of commissions per Medicare Advantage approved policy increased 4% for the year ended June 30, 2019 compared to the year ended June 30, 2018. The increase was primarily due to an increase in our retention rates for MA policies. Medicare Supplement lifetime value of commissions per approved policy increased 11% for the year ended June 30, 2019 compared to the year ended June 30, 2018. The increase was primarily due to a carrier mix shift of policies to carriers that pay us higher commissions.
The lifetime value of commissions per Medicare Advantage approved policy increased 1% for the nine month period ended March 31, 2020 compared to the nine month period ended March 31, 2019. Medicare Supplement lifetime value of commissions per approved policy increased 7% for the nine month period ended March 31, 2020 compared to the nine month period ended March 31, 2019. The increase was primarily due to a carrier mix shift of policies to carriers that pay us higher commissions.
Per Unit Economics
Per unit economics represents total Medicare Advantage and Medicare Supplement commissions, other product commissions, other revenues, and costs associated with the Senior segment, each shown as per number of approved Medicare Advantage and Medicare Supplement approved policies over a given time period. Management assesses the business on a per unit basis to help ensure that the revenue opportunity associated with a successful policy sale is attractive relative to the marketing acquisition cost. Because not all acquired leads result in a successful policy sale, all per policy metrics are based on approved policies which is the measure that triggers revenue recognition.
The Medicare Advantage and Medicare Supplement commission per MA/MS policy represents the lifetime value of commissions for policies sold in the period. Other commission per MA/MS policy represents the lifetime value of commissions for other products sold in the period, including dental, vision and hearing, prescription drug plan, and other products, which management views as additional commission revenue on our agents’ core function of MA/MS policy sales. Other per MA/MS policy represents the production bonuses, renewals from policies originally sold in a prior period with insurance carrier partners whose contracts preclude us from recognizing variable consideration for estimated renewal commissions and updated estimates of prior period variable consideration based on actual policy renewals in the current period. Total operating expenses per MA/MS policy represent all of the operating expenses within the Senior segment. The Revenue to customer acquisition cost (“CAC”) multiple represents total revenue per MA/MS policy as a multiple of total marketing acquisition cost, which represents the direct costs of acquiring leads which is included in marketing and advertising expense within the total operating expenses per MA/MS policy.
-69-
Table of Contents
The following table shows per unit economics for the periods presented. Based on the seasonality of the Senior segment and the fluctuations between quarters, we believe that the most relevant view of per unit economics is on a rolling 12-month basis. All per MA/MS policy metrics below are based on the sum of approved MA/MS policies, as both products have similar commission profiles. These metrics are the basis on which management assesses the business:
| Fiscal Year Ended June 30, |
12 Months Ended March 31, |
|||||||||||||||
| (dollars per approved policy): | 2019 | 2018 | 2020 | 2019 | ||||||||||||
| Medicare Advantage and Medicare Supplement approved policies |
124,258 | 69,565 | 204,519 | 115,518 | ||||||||||||
| Medicare Advantage and Medicare Supplement commission per MA / MS policy |
$ | 1,283 | $ | 1,221 | $ | 1,300 | $ | 1,267 | ||||||||
| Other commission per MA/MS policy |
81 | 119 | 51 | 91 | ||||||||||||
| Other per MA / MS policy |
183 | 133 | 154 | 178 | ||||||||||||
|
|
|
|
|
|
|
|
|
|||||||||
| Total revenue per MA / MS policy |
1,547 | 1,473 | 1,505 | 1,536 | ||||||||||||
| Total operating expenses per MA / MS policy |
(822 | ) | (945 | ) | (891 | ) | (836 | ) | ||||||||
|
|
|
|
|
|
|
|
|
|||||||||
| Adjusted EBITDA per MA / MS policy |
$ | 725 | $ | 528 | $ | 614 | $ | 700 | ||||||||
|
|
|
|
|
|
|
|
|
|||||||||
| Adjusted EBITDA Margin per MA / MS policy |
47 | % | 36 | % | 41 | % | 46 | % | ||||||||
| Revenue / CAC multiple |
4.0x | 3.2x | 3.6x | 3.8x | ||||||||||||
Total revenue per policy increased 5% for the year ended June 30, 2019 compared to the year ended June 30, 2018, due to a shift in mix to MA, the higher persistency of MA policies, higher commissions on MS policies due to carrier mix and an increase in the amount of marketing development funds we received from carriers. Total cost per policy decreased 13% for the year ended June 30, 2019 compared to the year ended June 30, 2018, due to an improvement in the efficiency of our marketing and advertising expenses which drove a lower cost of acquisition per approved policy and the benefit of scale within our sales and fulfillment expenses.
Total revenue per policy decreased 2% for the 12 months ended March 31, 2020 compared to the 12 months ended March 31, 2019, due to a decrease in the amount of other ancillary insurance policies sold as a percent of MA/MS policies and lower marketing development funds received per approved MA/MS policy due to a shift in mix towards carriers that do not pay us marketing development funds. These decreases were partially offset by higher commissions on MS policies due to carrier mix and a one-time positive adjustment for estimated renewal commissions related to an amendment to a carrier contract that previously precluded us from recognizing variable consideration. Total cost per policy increased 6% for the 12 months ended March 31, 2020, compared to the 12 months ended March 31, 2019, due to an increase in our marketing and advertising expense, including an increase in marketing spend intended to drive growth during OEP. Sales and fulfillment expense per approved policy also increased as a result of our employing flex agents during both AEP and OEP, instead of employing flex agents just during AEP, as in prior years.
Life
Life premium represents the total premium value for all policies that were approved by the relevant insurance carrier partner and for which the policy document was sent to the policyholder and payment information was received by the relevant insurance carrier partner during the indicated period. Core premiums are for term life and permanent life insurance policies, while ancillary premiums are for other products. Because our commissions are earned based on a percentage of total premium, total premium volume for a given period is the key driver of revenue for our Life segment.
-70-
Table of Contents
The following table shows core premiums and ancillary premiums for the periods presented:
| Fiscal Year Ended June 30, |
Nine Months Ended March 31, |
|||||||||||||||
| (in thousands): | 2019 | 2018 | 2020 | 2019 | ||||||||||||
| Core Premiums |
$ | 75,681 | $ | 71,753 | $ | 56,486 | $ | 55,424 | ||||||||
| Ancillary Premiums |
14,286 | 6,601 | 17,754 | 9,239 | ||||||||||||
Total core premiums increased 5% for the year ended June 30, 2019 compared to the year ended June 30, 2018, due to an increase in the average premium per policy sold. This was driven by new initiatives in 2019 that increased the term of policies we sell on behalf of our insurance carrier partners (longer term policies drive more premium) and enabled customers to add additional coverage once they had been approved for their policy. Total ancillary premiums increased 116% for the year ended June 30, 2019 compared to the year ended June 30, 2018, due to a 124% increase in the number of agents selling final expense and other ancillary insurance products.
Total core premiums increased 2% for the nine month period ended March 31, 2020 compared to the nine month period ended March 31, 2019, due to increases in the average face amount of policies we sell which drives up the average premium per policy sold. Total ancillary premiums increased 92% for the nine month period ended March 31, 2020 compared to the nine month period ended March 31, 2019, due to a 58% increase in the number of policies sold as a result of more agents selling final expense and other ancillary insurance products and a 22% increase in average premium per product.
Auto & Home
Auto & Home premium represents the total premium value of all new policies that were approved by our insurance carrier partners during the indicated period. Because our commissions are earned based on a percentage of total premium, total premium volume for a given period is the key driver of revenue for our Auto & Home segment.
The following table shows premiums for the periods presented:
| Fiscal Year Ended June 30, |
Nine Months Ended March 31, |
|||||||||||||||
| (in thousands): | 2019 | 2018 | 2020 | 2019 | ||||||||||||
| Premiums |
$ | 56,719 | $ | 50,460 | $ | 48,925 | $ | 40,117 | ||||||||
Total premiums increased 12% for the year ended June 30, 2019 compared to the year ended June 30, 2018, due to hiring more agents for the Auto & Home segment which resulted in an increase in the number of policies sold.
Total premiums increased 22% for the nine month period ended March 31, 2020 compared to the nine month period ended March 31, 2019, primarily due to hiring more agents for the Auto & Home segment which resulted in an increase in the number of policies sold.
-71-
Table of Contents
Adjusted EBITDA
Adjusted EBITDA for the Nine Month Period Ended March 31, 2020
The following table reconciles Adjusted EBITDA and net income, the most directly comparable financial measure calculated and presented in accordance with GAAP, for the nine month period ended March 31, 2020:
| (in thousands) | Senior | Life | Auto & Home |
Corp & Elims |
Consolidated | |||||||||||||||
| Net income |
$ | 61,098 | ||||||||||||||||||
| Interest expense |
16,239 | |||||||||||||||||||
| Income tax expense |
19,110 | |||||||||||||||||||
| Depreciation and amortization |
5,273 | |||||||||||||||||||
| Non-recurring expenses (1) |
2,648 | |||||||||||||||||||
| Share-based compensation expense |
9,283 | |||||||||||||||||||
| Loss on disposal of property, equipment and software |
235 | |||||||||||||||||||
|
|
|
|
|
|
|
|
|
|
|
|||||||||||
| Adjusted EBITDA |
$ | 112,352 | $ | 15,552 | $ | 5,594 | $ | (19,612 | ) | $ | 113,886 | |||||||||
| (1) | These expenses consist of one-time consulting expenses associated with adopting ASC 606, non-recurring compensation to certain former Board members, non-restructuring severance expenses, employer payroll taxes on the one-time Distribution to stock option holders, costs related to our initial public offering, and expenses related to business continuity in response to the COVID-19 pandemic. |
Adjusted EBITDA for the Nine Month Period Ended March 31, 2019
The following table reconciles Adjusted EBITDA and net income, the most directly comparable financial measure calculated and presented in accordance with GAAP, for the nine month period ended March 31, 2019:
| (in thousands) | Senior | Life | Auto & Home |
Corp & Elims |
Consolidated | |||||||||||||||
| Net income |
$ | 59,692 | ||||||||||||||||||
| Interest expense |
1,122 | |||||||||||||||||||
| Income tax expense |
18,200 | |||||||||||||||||||
| Depreciation and amortization |
3,446 | |||||||||||||||||||
| Non-recurring expenses (1) |
3,180 | |||||||||||||||||||
| Share-based compensation expense |
67 | |||||||||||||||||||
| Loss on disposal of property, equipment and software |
52 | |||||||||||||||||||
|
|
|
|
|
|
|
|
|
|
|
|||||||||||
| Adjusted EBITDA |
$ | 77,179 | $ | 16,721 | $ | 5,540 | $ | (13,681 | ) | $ | 85,759 | |||||||||
| (1) | These expenses consist primarily of one-time consulting expenses associated with adopting ASC 606, non-recurring compensation to certain former Board members, restructuring expenses consisting primarily of expenses associated with initiatives to reduce costs and consolidate leadership and back office functions from San Francisco to Kansas City, and non-restructuring severance expenses. |
-72-
Table of Contents
Adjusted EBITDA for the Year Ended June 30, 2019
The following table reconciles Adjusted EBITDA and net income, the most directly comparable financial measure calculated and presented in accordance with GAAP, for the year ended June 30, 2019:
| (in thousands) | Senior | Life | Auto & Home |
Corp & Elims |
Consolidated | |||||||||||||||
| Net income |
$ | 72,579 | ||||||||||||||||||
| Interest expense |
1,660 | |||||||||||||||||||
| Income tax expense |
22,034 | |||||||||||||||||||
| Depreciation and amortization |
4,702 | |||||||||||||||||||
| Non-recurring expenses (1) |
1,691 | |||||||||||||||||||
| Restructuring expenses (2) |
2,305 | |||||||||||||||||||
| Share-based compensation expense |
86 | |||||||||||||||||||
| Loss on disposal of property, equipment and software |
221 | |||||||||||||||||||
|
|
|
|
|
|
|
|
|
|
|
|||||||||||
| Adjusted EBITDA |
$ | 90,174 | $ | 25,821 | $ | 7,817 | $ | (18,534 | ) | $ | 105,278 | |||||||||
| (1) | These expenses consist primarily of one-time consulting expenses associated with adopting ASC 606, non-recurring compensation to certain Board members and non-restructuring severance expenses. |
| (2) | Restructuring expenses consist primarily of expenses associated with initiatives to reduce costs and consolidate leadership and back office functions from San Francisco to Kansas City. |
Adjusted EBITDA for the Year Ended June 30, 2018
The following table reconciles Adjusted EBITDA and net income, the most directly comparable financial measure calculated and presented in accordance with GAAP, for the year ended June 30, 2018:
| (in thousands) | Senior | Life | Auto & Home |
Corp & Elims |
Consolidated | |||||||||||||||
| Net income |
$ | 34,899 | ||||||||||||||||||
| Interest expense |
929 | |||||||||||||||||||
| Income tax expense |
6,619 | |||||||||||||||||||
| Depreciation and amortization |
3,468 | |||||||||||||||||||
| Non-recurring expenses (1) |
436 | |||||||||||||||||||
| Restructuring expenses (2) |
2,808 | |||||||||||||||||||
| Share-based compensation expense |
67 | |||||||||||||||||||
| Loss on disposal of property, equipment and software |
700 | |||||||||||||||||||
|
|
|
|
|
|
|
|
|
|
|
|||||||||||
| Adjusted EBITDA |
$ | 36,688 | $ | 22,969 | $ | 9,221 | $ | (18,952 | ) | $ | 49,926 | |||||||||
| (1) | These expenses consist primarily of one-time consulting expenses associated with adopting ASC 606, non-recurring compensation to certain Board members and non-restructuring severance expenses. |
| (2) | Restructuring expenses consist primarily of expenses associated with initiatives to reduce costs and consolidate leadership and back office functions from San Francisco to Kansas City. |
Key Components of our Results of Operations
Revenue
We earn commissions for the sale of first year and renewal policies from our insurance carrier partners, which are presented in our consolidated statements of operations as commission revenue. Additionally, we earn certain volume-based bonuses from some carriers on first-year policies sold, which we refer to as production bonuses and marketing development funds, based on attaining various predetermined target sales levels or other
-73-
Table of Contents
agreed upon objectives, as presented in the consolidated statements of operations as production bonus and other revenue (“other revenue”). Our contracts with our insurance carrier partners contain a single performance obligation satisfied at the point in time to which we allocate the total transaction price. The transaction price is identified as the first year commission due upon the initial sale of a policy as well as an estimate of future renewal commissions and other revenue when applicable. After a policy is sold, we have no material additional or recurring obligations to the policyholder or the insurance carrier partner. Therefore, we do not incur any additional expense related to our receipt of future renewal commissions or other revenue. All of the costs associated with the sale of an individual policy are incurred prior to or at the time of the initial sale of an individual policy.
Operating Costs and Expenses
Cost of Revenue
Cost of revenue represents the direct costs associated with fulfilling our obligations to our insurance carrier partners for the sale of insurance policies. Such costs primarily consist of compensation and related benefit costs for agents, fulfillment specialists and others directly engaged in servicing policy holders. It also includes licensing costs for our agents and allocations for facilities, telecommunications and software maintenance costs, which are all based on headcount. Facilities costs include rent and utilities expenses and other costs to maintain our office locations. Telecommunications and software maintenance costs includes costs related to the internal phone systems and various software applications that our agents use to make sales. These costs directly correlate to the number of agents we have as we are primarily charged based on per person usage for the phone systems and software applications.
Marketing and Advertising
Marketing and advertising expenses consist primarily of the direct costs associated with marketing and advertising of our services, such as television and radio commercials and online advertising. These direct costs generally represent over 90% of our marketing and advertising expenses. Other costs consist of compensation and other expenses related to marketing, business development, partner management, public relations, carrier relations personnel who support our offerings, and allocations for facilities, telecommunications and software maintenance costs. Our marketing and advertising costs increase during AEP and OEP to generate more leads during these high-volume periods.
Technical Development
Technical development expenses consist primarily of compensation and benefits costs for internal and external personnel associated with developing, maintaining and enhancing our applications, infrastructure and other IT-related functions as well as allocations for facilities, telecommunications and software maintenance costs.
General and Administrative
General and administrative expenses include compensation and benefits costs for staff working in our executive, finance, accounting, recruiting, human resources, administrative, business intelligence and data science departments. These expenses also include fees paid for outside professional services, including audit, tax and legal fees and allocations for facilities, telecommunications and software maintenance costs.
Restructuring
We account for employee-related costs, including severance and other termination benefits, included in restructuring expense based on long-standing benefit practices, local statutory requirements and contract
-74-
Table of Contents
termination costs. Restructuring liabilities are recognized at fair value in the period the liability is incurred. In some jurisdictions, we have ongoing benefit arrangements under which we record the estimated severance and other termination benefits when such costs are deemed probable and estimable, approved by the appropriate corporate management and if actions required to complete the termination plan indicate that it is unlikely that significant changes to the plan will be made or the plan will be withdrawn. In jurisdictions where there is not an ongoing benefit arrangement, we record estimated severance and other termination benefits when appropriate corporate management has committed to the plan and the benefit arrangement is communicated to the affected employees. A liability for costs to terminate a contract before the end of its term is recognized at fair value when we terminate the contract in accordance with its terms. Estimates are evaluated periodically to determine whether an adjustment is required.
The following table sets forth our operating results and related percentage of total revenues for the periods presented:
| Nine Months Ended March 31, | ||||||||||||||||
| (in thousands) | 2020 | 2019 | ||||||||||||||
| Revenue |
||||||||||||||||
| Commission |
$ | 353,926 | 91 | % | $ | 231,003 | 88 | % | ||||||||
| Production bonus and other |
36,142 | 9 | % | 32,067 | 12 | % | ||||||||||
|
|
|
|
|
|
|
|
|
|||||||||
| Total revenue |
390,068 | 100 | % | 263,070 | 100 | % | ||||||||||
| Operating costs and expenses |
||||||||||||||||
| Cost of revenue |
126,488 | 32 | % | 80,294 | 31 | % | ||||||||||
| Marketing and advertising |
132,246 | 34 | % | 84,427 | 32 | % | ||||||||||
| Technical development |
9,088 | 2 | % | 6,232 | 2 | % | ||||||||||
| General and administrative |
25,779 | 7 | % | 13,095 | 5 | % | ||||||||||
|
|
|
|
|
|
|
|
|
|||||||||
| Total operating costs and expenses |
293,601 | 75 | % | 184,048 | 70 | % | ||||||||||
|
|
|
|
|
|
|
|
|
|||||||||
| Income from operations |
96,467 | 25 | % | 79,022 | 30 | % | ||||||||||
| Interest expense |
(16,239 | ) | (4 | )% | (1,122 | ) | NM | (1) | ||||||||
| Other expenses |
(20 | ) | NM | (1) | (8 | ) | NM | (1) | ||||||||
|
|
|
|
|
|
|
|
|
|||||||||
| Income before income tax expense |
80,208 | 21 | % | 77,892 | 30 | % | ||||||||||
| Income tax expense |
19,110 | 5 | % | 18,200 | 7 | % | ||||||||||
|
|
|
|
|
|
|
|
|
|||||||||
| Net income |
$ | 61,098 | 16 | % | $ | 59,692 | 23 | % | ||||||||
|
|
|
|
|
|
|
|
|
|||||||||
| (1) | Not meaningful. |
Revenue
The following table presents our commission revenue, production bonus and other revenue, and total revenue for the periods presented, and the dollar and percentage changes from the prior year:
| (dollars in thousands) | Nine Months Ended March 31, 2020 |
$ | % | Nine Months Ended March 31, 2019 |
||||||||||||
| Commission |
$ | 353,926 | $ | 122,923 | 53 | % | $ | 231,003 | ||||||||
| Percentage of total revenue |
91 | % | 88 | % | ||||||||||||
| Production bonus and other |
36,142 | 4,075 | 13 | % | 32,067 | |||||||||||
| Percentage of total revenue |
9 | % | 12 | % | ||||||||||||
| Total revenue |
$ | 390,068 | $ | 126,998 | 48 | % | $ | 263,070 | ||||||||
Commission revenue increased $122.9 million, or 53%, due to increases in Senior, Life, and Auto & Home commission revenues of $112.9 million, $7.1 million and $3.1 million, respectively. For Senior, the revenue
-75-
Table of Contents
growth was driven by the significant increase in our agent count that led to a 93% increase in Medicare Advantage commission revenue. Life’s $7.1 million revenue growth was driven by an increase of $6.7 million in ancillary revenue as a result of more agents selling final expense and other ancillary insurance products, increasing the number of policies sold by 92% over the nine month period ended March 31, 2019. The revenue growth for Auto & Home was primarily due to hiring more agents which resulted in an increase in the number of policies sold along with a 22% increase in premium sold. The $4.1 million increase in production bonus and other revenue was primarily driven by the $2.5 million increase in marketing development funds received for Senior, from $15.1 million during the nine month period ended March 31, 2019, to $17.5 million during the nine month period ended March 31, 2020.
Operating Costs and Expenses
Cost of Revenue
The following table presents our cost of revenue for the periods presented, and the dollar and percentage changes from the prior year:
| (dollars in thousands) | Nine Months Ended March 31, 2020 |
$ | % | Nine Months Ended March 31, 2019 |
||||||||||||
| Cost of revenue |
$ | 126,488 | $ | 46,194 | 58 | % | $ | 80,294 | ||||||||
| Percentage of total revenue |
32 | % | 31 | % | ||||||||||||
Cost of revenue increased $46.2 million, or 58%, primarily due to a $36.7 million increase in compensation expenses driven by the growth in the number of agents, mostly within the Senior segment. The increase in headcount also drove increases in the allocations of $4.7 million for facilities, telecommunications and software maintenance costs and $2.0 million for licensing costs.
Marketing and Advertising
The following table presents our marketing and advertising expenses for the periods presented, and the dollar and percentage changes from the prior year:
| (dollars in thousands) | Nine Months Ended March 31, 2020 |
$ | % | Nine Months Ended March 31, 2019 |
||||||||||||
| Marketing and advertising |
$ | 132,246 | $ | 47,819 | 57 | % | $ | 84,427 | ||||||||
| Percentage of total revenue |
34 | % | 32 | % | ||||||||||||
Marketing and advertising expenses increased $47.8 million, or 57%, primarily due to a $37.4 million increase in Senior marketing and advertising costs associated with generating more leads for our larger agent base to consume, especially during AEP and OEP. Marketing and advertising costs also increased $4.3 million in Life driven by an increase in leads specifically for our final expense policies. Compensation costs related to our marketing personnel increased $3.0 million as we increased the number of people supporting our marketing organization to produce more leads.
-76-
Table of Contents
Technical Development
The following table presents our technical development expenses for the periods presented, and the dollar and percentage changes from the prior year:
| (dollars in thousands) | Nine Months Ended March 31, 2020 |
$ | % | Nine Months Ended March 31, 2019 |
||||||||||||
| Technical development |
$ | 9,088 | $ | 2,856 | 46 | % | $ | 6,232 | ||||||||
| Percentage of total revenue |
2 | % | 2 | % | ||||||||||||
Technical development expenses increased $2.9 million, or 46%, primarily due to a $1.9 million increase in professional fees associated with external IT resources and $0.8 million increase in compensation costs associated with our IT personnel to support the additional agent headcount.
General and Administrative
The following table presents our general and administrative expenses for the periods presented, and the dollar and percentage changes from the prior year:
| (dollars in thousands) | Nine Months Ended March 31, 2020 |
$ | % | Nine Months Ended March 31, 2019 |
||||||||||||
| General and administrative |
$ | 25,779 | $ | 12,684 | 97 | % | $ | 13,095 | ||||||||
| Percentage of total revenue |
7 | % | 5 | % | ||||||||||||
General and administrative expenses increased $12.7 million, or 97%, primarily due to the Distribution to our stock option holders of $9.2 million. We also incurred $2.4 million in higher compensation costs due to growth in the number of general & administrative employees required to support the continued growth of our business and $2.5 million in higher professional fees driven by outside recruiting fees and higher audit costs. This was offset by a decrease in restructuring costs of $2.4 million as the majority of our restructuring activities took place in 2017 and 2018.
Interest Expense
The following table presents our interest expense for the periods presented, and the dollar and percentage changes from the prior year:
| (dollars in thousands) | Nine Months Ended March 31, 2020 |
$ | % | Nine Months Ended March 31, 2019 |
||||||||||||
| Interest expense |
$ | 16,239 | $ | 15,117 | 1,347 | % | $ | 1,122 | ||||||||
| Percentage of total revenue |
4 | % | NM | (1) | ||||||||||||
| (1) | Not meaningful. |
Interest expense increased $15.1 million, or 1,347%, primarily as a result of interest incurred on the Term Loan.
-77-
Table of Contents
Income Tax Expense
The following table presents our provision for income taxes for the periods presented, and the dollar and percentage changes from the prior year:
| (dollars in thousands) | Nine Months Ended March 31, 2020 |
$ | % | Nine Months Ended March 31, 2019 |
||||||||||||
| Provision for income tax |
$ | 19,110 | $ | 910 | 5 | % | $ | 18,200 | ||||||||
| Percentage of total revenue |
5 | % | 7 | % | ||||||||||||
| Effective tax rate |
23.8 | % | 23.4 | % | ||||||||||||
For the nine month period ended March 31, 2020, we recorded a provision for income taxes of $19.1 million, representing an effective tax rate of 23.8%, which was higher than the statutory federal rate primarily due to the net effect of state income taxes incurred and non-deductible meals and entertainment, partially offset by certain state credits. For the nine month period ended March 31, 2019, we recorded a provision for income taxes of $18.2 million, representing an effective tax rate of 23.4%, which was higher than the statutory federal rate primarily due to the net effect of state income taxes incurred and non-deductible meals and entertainment, partially offset by certain state credits.
The following table sets forth our operating results and related percentage of total revenues for the periods presented:
| (in thousands) | Fiscal Year Ended June 30, 2019 |
Fiscal Year Ended June 30, 2018 |
||||||||||||||
| Revenue |
||||||||||||||||
| Commission |
$ | 296,000 | 88 | % | $ | 206,611 | 88 | % | ||||||||
| Production bonus and other |
41,469 | 12 | % | 27,077 | 12 | % | ||||||||||
|
|
|
|
|
|
|
|
|
|||||||||
| Total revenue |
337,469 | 100 | % | 233,688 | 100 | % | ||||||||||
| Operating costs and expenses |
||||||||||||||||
| Cost of revenue |
104,421 | 31 | % | 83,340 | 36 | % | ||||||||||
| Marketing and advertising |
110,265 | 33 | % | 82,122 | 35 | % | ||||||||||
| Technical development |
8,326 | 2 | % | 9,913 | 4 | % | ||||||||||
| General and administrative |
15,864 | 5 | % | 12,349 | 5 | % | ||||||||||
| Restructuring |
2,305 | 1 | % | 2,808 | 1 | % | ||||||||||
|
|
|
|
|
|
|
|
|
|||||||||
| Total operating costs and expenses |
241,181 | 71 | % | 190,532 | 82 | % | ||||||||||
|
|
|
|
|
|
|
|
|
|||||||||
| Income from operations |
96,288 | 29 | % | 43,156 | 18 | % | ||||||||||
| Interest expense |
(1,660 | ) | NM | (1) | (929 | ) | NM | (1) | ||||||||
| Other expenses |
(15 | ) | NM | (1) | (709 | ) | NM | (1) | ||||||||
|
|
|
|
|
|
|
|
|
|||||||||
| Income before income tax expense |
94,613 | 28 | % | 41,518 | 18 | % | ||||||||||
| Income tax expense |
22,034 | 7 | % | 6,619 | 3 | % | ||||||||||
|
|
|
|
|
|
|
|
|
|||||||||
| Net income |
$ | 72,579 | 21 | % | $ | 34,899 | 15 | % | ||||||||
|
|
|
|
|
|
|
|
|
|||||||||
| (1) | Not meaningful. |
-78-
Table of Contents
Revenue
The following table presents our commission revenue, production bonus and other revenue, and total revenue for the years ended June 30, 2019 and 2018, and the dollar and percentage changes from the prior year:
| (dollars in thousands) | Fiscal Year Ended June 30, 2019 |
$ | % | Fiscal Year Ended June 30, 2018 |
||||||||||||
| Commission |
$ | 296,000 | $ | 89,389 | 43 | % | $ | 206,611 | ||||||||
| Percentage of total revenue |
88 | % | 88 | % | ||||||||||||
| Production bonus and other |
41,469 | 14,392 | 53 | % | 27,077 | |||||||||||
| Percentage of total revenue |
12 | % | 12 | % | ||||||||||||
| Total revenue |
$ | 337,469 | $ | 103,781 | 44 | % | $ | 233,688 | ||||||||
Commission revenue increased $89.4 million, or 43%, due to increases in Senior, Life, and Auto & Home commission revenues of $76.9 million, $11.4 million and $1.1 million, respectively. For Senior, the revenue growth was driven by the significant increase in our agent count that led to a 122% increase in Medicare Advantage commission revenue. Life’s $11.4 million revenue growth was driven by $4.1 million growth in core term revenue and $7.3 million growth in ancillary revenue. The revenue growth for Auto & Home was driven by a 15% increase in first year commission, offset by an increase in revenue from insurance carrier partners whose contracts preclude us from recognizing variable consideration for estimated renewal commissions and therefore we only recognize the first year commission revenue when a policy is initially sold and then recognize renewal commission revenue when the policy renews in future years. The $14.4 million increase in production bonus and other revenue was primarily driven by the $13.0 million increase in marketing development funds received for Senior, from $5.4 million in 2018 to $18.4 million in 2019.
Operating Costs and Expenses
Cost of Revenue
The following table presents our cost of revenue for the periods presented, and the dollar and percentage changes from the prior year:
| (dollars in thousands) | Fiscal Year Ended June 30, 2019 |
$ | % | Fiscal Year Ended June 30, 2018 |
||||||||||||
| Cost of revenue |
$ | 104,421 | $ | 21,081 | 25 | % | $ | 83,340 | ||||||||
| Percentage of total revenue |
31 | % | 36 | % | ||||||||||||
Cost of revenue increased $21.1 million in 2019 compared to 2018, primarily due to a $16.8 million increase in compensation expenses driven by the growth in the number of agents, mostly within the Senior segment. The increase in headcount also drove increases in the allocations of $2.4 million for facilities, telecommunications and software maintenance costs and $1.3 million for licensing costs.
Marketing and Advertising
The following table presents our marketing and advertising expenses for the periods presented, and the dollar and percentage changes from the prior year:
| (dollars in thousands) | Fiscal Year Ended June 30, 2019 |
$ | % | Fiscal Year Ended June 30, 2018 |
||||||||||||
| Marketing and advertising |
$ | 110,265 | $ | 28,143 | 34 | % | $ | 82,122 | ||||||||
| Percentage of total revenue |
33 | % | 35 | % | ||||||||||||
-79-
Table of Contents
Marketing and advertising expenses increased $28.1 million, or 34%, in 2019, primarily due to a $16.9 million increase in Senior marketing and advertising costs associated with generating more leads for our larger agent base to consume, especially during AEP and OEP. Marketing and advertising costs also increased $8.5 million in our Life segment driven by an increase in leads specifically for our final expense policies. Compensation costs related to our marketing personnel increased $1.9 million as we increased the number of people supporting our marketing organization to produce more leads.
Technical Development
The following table presents our technical development expenses for the periods presented, and the dollar and percentage changes from the prior year:
| (dollars in thousands) | Fiscal Year Ended June 30, 2019 |
$ | % | Fiscal Year Ended June 30, 2018 |
||||||||||||
| Technical development |
$ | 8,326 | $ | (1,587 | ) | (17 | )% | $ | 9,913 | |||||||
| Percentage of total revenue |
2 | % | 4 | % | ||||||||||||
Technical development expenses decreased $1.6 million, or 17%, in 2019, primarily due to an increase in the capitalization of internally developed software expenses. A total of $3.8 million was capitalized during the year ended June 30, 2019, versus the year ended June 30, 2018, in which such amounts were not material.
General and Administrative
The following table presents our general and administrative expenses for the periods presented, and the dollar and percentage changes from the prior year:
| (dollars in thousands) | Fiscal Year Ended June 30, 2019 |
$ | % | Fiscal Year Ended June 30, 2018 |
||||||||||||
| General and administrative |
$ | 15,864 | $ | 3,515 | 28 | % | $ | 12,349 | ||||||||
| Percentage of total revenue |
5 | % | 5 | % | ||||||||||||
General and administrative expenses increased $3.5 million, or 28%, for the year ended June 30, 2019, primarily due to $2.4 million in higher compensation costs due to growth in the number of general & administrative employees required to support the continued growth of our business and also an increase in professional fees.
Restructuring
The following table presents our restructuring expense for the periods presented, and the dollar and percentage changes from the prior year:
| (dollars in thousands) | Fiscal Year Ended June 30, 2019 |
$ | % | Fiscal Year Ended June 30, 2018 |
||||||||||||
| Restructuring charge |
$ | 2,305 | $ | (503 | ) | (18 | )% | $ | 2,808 | |||||||
| Percentage of total revenue |
1 | % | 1 | % | ||||||||||||
Restructuring expenses decreased $0.5 million, or 18%, in 2019, primarily due to the timing of certain restructuring activities and in some jurisdictions, the ongoing benefit arrangements which require us to record estimated severance and other termination benefits over the period.
-80-
Table of Contents
Income Tax Expense
The following table presents our provision for income taxes for the periods presented, and the dollar and percentage changes from the prior year:
| (dollars in thousands) | Fiscal Year Ended June 30, 2019 |
$ | Fiscal Year Ended June 30, 2018 |
|||||||||
| Provision for income tax |
$ | 22,034 | $ | 15,415 | $ | 6,619 | ||||||
| Percentage of total revenue |
7 | % | 3 | % | ||||||||
| Effective tax rate |
23.3 | % | 15.9 | % | ||||||||
For the year ended June 30, 2019, we recorded a provision for income taxes of $22.0 million, representing an effective tax rate of 23.3%, which was higher than the statutory federal rate primarily due to the net effect of state income taxes incurred. For the year ended June 30, 2018, we recorded a provision for income taxes of $6.6 million, representing an effective tax rate of 15.9%, which was lower than the statutory federal rate primarily due to the re-measurement of deferred income tax liabilities related to the corporate tax rate reduction in the JOBS Act.
Segment Information
Our reportable segments have been determined in accordance with Accounting Standards Codification (“ASC”) 280, Segment Reporting. We currently have three reportable segments: 1) Senior, 2) Life and 3) Auto & Home. In addition, we account for non-operating activity, share-based compensation expense, certain intersegment eliminations and the costs of providing corporate and other administrative services in our administrative division, Corporate & Eliminations. These services are not directly identifiable with our reportable segments and are shown in the tables below to reconcile the reportable segments to the consolidated financial statements.
We report segment information based on how our chief executive officer, who is the chief operating decision maker (“CODM”), regularly reviews our operating results, allocates resources and makes decisions regarding business operations. The performance measures of the segments include total revenue and Adjusted EBITDA because management believes that such information is the most relevant in evaluating the results of the respective segments relative to other entities that operate in the same industries.
Costs of revenue, marketing and advertising and technical development operating costs and expenses that are directly attributable to a segment are reported within the applicable segment. Indirect costs of revenue, marketing and advertising and technical development operating costs and expenses are allocated to each segment based on varying metrics such as headcount. Adjusted EBITDA is calculated as total revenue for the applicable segment less direct and allocated costs of revenue, marketing and advertising, technical development and general and administrative operating costs and expenses, excluding depreciation and amortization expense; loss on disposal of property, equipment and software; share-based compensation expense; restructuring expenses; and non-recurring expenses such as severance payments and transaction costs. Our CODM does not separately evaluate assets by segment; therefore, assets by segment are not presented.
-81-
Table of Contents
The following table presents information about the reportable segments for the nine month period ended March 31, 2020 (in thousands):
| Senior | Life | Auto & Home |
Corp & Elims |
Consolidated | ||||||||||||||||
| Revenue |
$ | 273,808 | $ | 87,543 | $ | 29,061 | $ | (344 | ) | $ | 390,068 | |||||||||
| Operating expenses |
(161,456 | ) | (71,991 | ) | (23,467 | ) | (19,248 | )(1) | (276,162 | ) | ||||||||||
| Other expenses |
— | — | — | (20 | ) | (20 | ) | |||||||||||||
|
|
|
|
|
|
|
|
|
|
|
|||||||||||
| Adjusted EBITDA |
112,352 | 15,552 | 5,594 | (19,612 | ) | 113,886 | ||||||||||||||
| Loss on disposal of property, equipment and software |
(235 | ) | ||||||||||||||||||
| Share-based compensation expense |
(9,283 | ) | ||||||||||||||||||
| Non-recurring expenses (2) |
(2,648 | ) | ||||||||||||||||||
| Depreciation and amortization |
(5,273 | ) | ||||||||||||||||||
| Income tax expense |
(19,110 | ) | ||||||||||||||||||
| Interest expense |
(16,239 | ) | ||||||||||||||||||
|
|
|
|||||||||||||||||||
| Net Income |
$ | 61,098 | ||||||||||||||||||
| (1) | Operating expenses in the Corp & Elims division primarily include $10.7 million in salaries and benefits for certain general, administrative, and IT related departments and $4.3 million in professional services fees. |
| (2) | These expenses consist of one-time consulting expenses associated with adopting ASC 606, non-recurring compensation to certain former board members, non-restructuring severance expenses, employer payroll taxes on the one-time Distribution to stock option holders, costs related to our initial public offering, and expenses related to business continuity in response to the COVID-19 pandemic. |
The following table presents information about the reportable segments for the nine month period ended March 31, 2019:
| (in thousands) | Senior | Life | Auto & Home |
Corp & Elims |
Consolidated | |||||||||||||||
| Revenue |
$ | 158,459 | $ | 79,585 | $ | 25,235 | $ | (209 | ) | $ | 263,070 | |||||||||
| Operating expenses |
(81,280 | ) | (62,864 | ) | (19,695 | ) | (13,464 | )(1) | (177,303 | ) | ||||||||||
| Other expenses |
— | — | — | (8 | ) | (8 | ) | |||||||||||||
|
|
|
|
|
|
|
|
|
|
|
|||||||||||
| Adjusted EBITDA |
77,179 | 16,721 | 5,540 | (13,681 | ) | 85,759 | ||||||||||||||
| Loss on disposal of property, equipment and software |
(52 | ) | ||||||||||||||||||
| Share-based compensation expense |
(67 | ) | ||||||||||||||||||
| Non-recurring expenses (2) |
(3,180 | ) | ||||||||||||||||||
| Depreciation and amortization |
(3,446 | ) | ||||||||||||||||||
| Income tax expense |
(18,200 | ) | ||||||||||||||||||
| Interest expense |
(1,122 | ) | ||||||||||||||||||
|
|
|
|||||||||||||||||||
| Net Income |
$ | 59,692 | ||||||||||||||||||
| (1) | Operating expenses in the Corp & Elims division primarily include $8.5 million in salaries and benefits for certain general, administrative, and IT related departments and $3.2 million in professional services fees. |
| (2) | These expenses consist primarily of one-time consulting expenses associated with adopting ASC 606, non-recurring compensation to certain former board members, restructuring expenses consisting primarily of expenses associated with initiatives to reduce costs and consolidate leadership and back office functions from San Francisco to Kansas City, and non-restructuring severance expenses |
-82-
Table of Contents
The following table presents information about the reportable segments for the year ended June 30, 2019:
| (in thousands) | Senior | Life | Auto & Home |
Corp & Elims |
Consolidated | |||||||||||||||
| Revenue |
$ | 192,257 | $ | 110,493 | $ | 35,054 | $ | (335 | ) | $ | 337,469 | |||||||||
| Operating expenses |
(102,083 | ) | (84,672 | ) | (27,237 | ) | (18,184 | ) | (232,176 | ) | ||||||||||
| Other expenses |
— | — | — | (15 | ) | (15 | ) | |||||||||||||
|
|
|
|
|
|
|
|
|
|
|
|||||||||||
| Adjusted EBITDA |
90,174 | 25,821 | 7,817 | (18,534 | ) | 105,278 | ||||||||||||||
| Loss on disposal of property, equipment and software |
(221 | ) | ||||||||||||||||||
| Share-based compensation expense |
(86 | ) | ||||||||||||||||||
| Restructuring |
(2,305 | ) | ||||||||||||||||||
| Non-recurring expenses |
(1,691 | ) | ||||||||||||||||||
| Depreciation and amortization |
(4,702 | ) | ||||||||||||||||||
| Income tax expense |
(22,034 | ) | ||||||||||||||||||
| Interest expense |
(1,660 | ) | ||||||||||||||||||
|
|
|
|||||||||||||||||||
| Net Income |
$ | 72,579 | ||||||||||||||||||
The following table presents information about the reportable segments for the year ended June 30, 2018:
| (in thousands) | Senior | Life | Auto & Home |
Corp & Elims |
Consolidated | |||||||||||||||
| Revenue |
$ | 102,408 | $ | 98,218 | $ | 33,348 | $ | (286 | ) | $ | 233,688 | |||||||||
| Operating expenses |
(65,720 | ) | (75,249 | ) | (24,127 | ) | (18,657 | ) | (183,753 | ) | ||||||||||
| Other expenses |
— | — | — | (9 | ) | (9 | ) | |||||||||||||
|
|
|
|
|
|
|
|
|
|
|
|||||||||||
| Adjusted EBITDA |
36,688 | 22,969 | 9,221 | (18,952 | ) | 49,926 | ||||||||||||||
| Loss on disposal of property, equipment and software |
(700 | ) | ||||||||||||||||||
| Share-based compensation expense |
(67 | ) | ||||||||||||||||||
| Restructuring |
(2,808 | ) | ||||||||||||||||||
| Non-recurring expenses |
(436 | ) | ||||||||||||||||||
| Depreciation and amortization |
(3,468 | ) | ||||||||||||||||||
| Income tax expense |
(6,619 | ) | ||||||||||||||||||
| Interest expense |
(929 | ) | ||||||||||||||||||
|
|
|
|||||||||||||||||||
| Net Income |
$ | 34,899 | ||||||||||||||||||
-83-
Table of Contents
The table below depicts the disaggregation of revenue by segment and product for the periods presented, and is consistent with how the Company evaluates its segments and financial performance:
| (dollars in thousands) | Nine Months Ended March 31, 2020 |
$ | % | Nine Months Ended March 31, 2019 |
||||||||||||
| Senior: |
||||||||||||||||
| Commission Revenue |
||||||||||||||||
| Medicare Advantage |
$ | 220,536 | $ | 106,178 | 93 | % | $ | 114,358 | ||||||||
| Medicare Supplement |
27,284 | 6,443 | 31 | % | 20,841 | |||||||||||
| Prescription Drug Plan |
2,391 | (484 | ) | (17 | )% | 2,875 | ||||||||||
| Dental, Vision and Health |
5,674 | 2,764 | 95 | % | 2,910 | |||||||||||
| Other commission revenue |
380 | (2,030 | ) | (84 | )% | 2,410 | ||||||||||
|
|
|
|
|
|
|
|
|
|||||||||
| Total commission revenue |
256,265 | 112,871 | 79 | % | 143,394 | |||||||||||
| Production bonus and other revenue |
17,543 | 2,478 | 16 | % | 15,065 | |||||||||||
|
|
|
|
|
|
|
|
|
|||||||||
| Total Senior revenue |
273,808 | 115,349 | 73 | % | 158,459 | |||||||||||
|
|
|
|
|
|
|
|
|
|||||||||
| Life: |
||||||||||||||||
| Commission Revenue: |
||||||||||||||||
| Term |
55,745 | 321 | 1 | % | 55,424 | |||||||||||
| Other commission revenue |
15,339 | 6,733 | 78 | % | 8,606 | |||||||||||
|
|
|
|
|
|
|
|
|
|||||||||
| Total commission revenue |
71,084 | 7,054 | 11 | % | 64,030 | |||||||||||
| Production bonus and other revenue |
16,459 | 904 | 6 | % | 15,555 | |||||||||||
|
|
|
|
|
|
|
|
|
|||||||||
| Total Life revenue |
87,543 | 7,958 | 10 | % | 79,585 | |||||||||||
|
|
|
|
|
|
|
|
|
|||||||||
| Auto & Home: |
||||||||||||||||
| Total commission revenue |
26,921 | 3,133 | 13 | % | 23,788 | |||||||||||
| Production bonus and other revenue |
2,140 | 693 | 48 | % | 1,447 | |||||||||||
|
|
|
|
|
|
|
|
|
|||||||||
| Total Auto & Home revenue |
29,061 | 3,826 | 15 | % | 25,235 | |||||||||||
|
|
|
|
|
|
|
|
|
|||||||||
| Eliminations: |
||||||||||||||||
| Total commission revenue |
(344 | ) | (135 | ) | 65 | % | (209 | ) | ||||||||
|
|
|
|
|
|
|
|
|
|||||||||
| Total commission revenue |
353,926 | 122,923 | 53 | % | 231,003 | |||||||||||
| Total production bonus and other revenue |
36,142 | 4,075 | 13 | % | 32,067 | |||||||||||
|
|
|
|
|
|
|
|
|
|||||||||
| Total revenue |
$ | 390,068 | $ | 126,998 | 48 | % | $ | 263,070 | ||||||||
|
|
|
|
|
|
|
|
|
|||||||||
Revenue by Segment
For the nine month period ended March 31, 2020, revenue from our Senior segment increased $115.3 million, or 73%, due to a $112.9 million increase in commission revenue and a $2.5 million increase in production bonus and other revenue. The increase in commission revenue was predominantly driven by a 93% increase in MA approved policies. Production bonus and other revenue was driven by an increase in marketing development funds.
For the nine month period ended March 31, 2020, revenue from our Life segment increased $8.0 million, or 10%, due to a $7.1 million increase in commission revenue and a $0.9 million increase in production bonus and other revenue. The increase in commission revenue was driven by a 92% increase in ancillary premium sold, which was the result of our focus on selling more final expense and other ancillary insurance products. Commission revenue also increased as a result of writing 2% more core term life premium. Production bonus and other revenue was driven by the increase in core term life premium sold.
-84-
Table of Contents
For the nine month period ended March 31, 2020, revenue from our Auto & Home segment increased $3.8 million, or 15%, due to a $3.1 million increase in commission revenue and $0.7 million increase in production bonus and other revenue. The increase in commission revenue and production bonus and other revenue was driven by a 22% increase in premium sold.
Adjusted EBITDA by Segment
Adjusted EBITDA from our Senior segment was $112.4 million for the nine month period ended March 31, 2020, a $35.2 million, or 46%, increase compared to Adjusted EBITDA of $77.2 million for the nine month period ended March 31, 2019. The increase in Adjusted EBITDA was primarily due to a $115.4 million increase in revenue partially offset by an $80.2 million increase in operating costs and expenses primarily attributable to an increase in variable marketing expenses and personnel costs associated with higher headcount that was driven by a significant increase in policies submitted and an increase in the number of licensed agents.
Adjusted EBITDA from our Life segment was $15.6 million for the nine month period ended March 31, 2020, a $1.2 million, or 7%, decrease compared to Adjusted EBITDA of $16.7 million for the nine month period ended March 31, 2019. The decrease in Adjusted EBITDA was primarily due to an $8.0 million increase in revenue partially offset by a $9.1 million increase in operating costs and expenses primarily attributable to an increase in variable marketing expenses and variable sales commission expenses to agents driven by an increase in the amount of premium sold for core and ancillary policies. Adjusted EBITDA was also negatively impacted by our temporarily shifting some of our Life agents into the Senior segment to maximize the opportunity of the AEP and OEP seasonal increase in demand for Senior products.
Adjusted EBITDA from our Auto & Home segment was $5.6 million for the nine month period ended March 31, 2020, a $0.1 million, or 1%, increase compared to Adjusted EBITDA of $5.5 million for the nine month period ended March 31, 2019. The increase in Adjusted EBITDA was primarily due to a $3.8 million increase in revenue offset by a $3.7 million increase in operating costs and expenses primarily attributable to an increase in variable marketing expenses and personnel costs associated with higher headcount that was driven by an increase in premium sold and an increase in the number of licensed agents. Adjusted EBITDA was also negatively impacted by our temporarily shifting some of our Auto & Home agents into the Senior segment to maximize the opportunity of the AEP and OEP seasonal increase in demand for Senior products.
-85-
Table of Contents
The table below depicts the disaggregation of revenue by segment and product for the periods presented, and is consistent with how the Company evaluates its segments and financial performance:
| (dollars in thousands) | Fiscal Year Ended June 30, 2019 |
$ | % | Fiscal Year Ended June 30, 2018 |
||||||||||||
| Senior: |
||||||||||||||||
| Commission Revenue |
||||||||||||||||
| Medicare Advantage |
$ | 138,526 | $ | 75,989 | 122 | % | $ | 62,537 | ||||||||
| Medicare Supplement |
25,118 | (1,071 | ) | (4 | %) | 26,189 | ||||||||||
| Prescription Drug Plan |
3,209 | 224 | 8 | % | 2,985 | |||||||||||
| Dental, Vision and Health |
4,470 | 1,538 | 52 | % | 2,932 | |||||||||||
| Other commission revenue |
2,526 | 181 | 8 | % | 2,345 | |||||||||||
|
|
|
|
|
|
|
|
|
|||||||||
| Total commission revenue |
173,849 | 76,861 | 79 | % | 96,988 | |||||||||||
| Production bonus and other revenue |
18,408 | 12,988 | 240 | % | 5,420 | |||||||||||
|
|
|
|
|
|
|
|
|
|||||||||
| Total Senior revenue |
192,257 | 89,849 | 88 | % | 102,408 | |||||||||||
|
|
|
|
|
|
|
|
|
|||||||||
| Life: |
||||||||||||||||
| Commission Revenue: |
||||||||||||||||
| Term |
76,135 | 4,184 | 6 | % | 71,951 | |||||||||||
| Other commission revenue |
13,111 | 7,261 | 124 | % | 5,850 | |||||||||||
|
|
|
|
|
|
|
|
|
|||||||||
| Total commission revenue |
89,246 | 11,445 | 15 | % | 77,801 | |||||||||||
| Production bonus and other revenue |
21,247 | 830 | 4 | % | 20,417 | |||||||||||
|
|
|
|
|
|
|
|
|
|||||||||
| Total Life revenue |
110,493 | 12,275 | 12 | % | 98,218 | |||||||||||
|
|
|
|
|
|
|
|
|
|||||||||
| Auto & Home: |
||||||||||||||||
| Total commission revenue |
33,240 | 1,132 | 4 | % | 32,108 | |||||||||||
| Production bonus and other revenue |
1,814 | 574 | 46 | % | 1,240 | |||||||||||
|
|
|
|
|
|
|
|
|
|||||||||
| Total Auto & Home revenue |
35,054 | 1,706 | 5 | % | 33,348 | |||||||||||
|
|
|
|
|
|
|
|
|
|||||||||
| Eliminations: |
||||||||||||||||
| Total commission revenue |
(335 | ) | (49 | ) | 17 | % | (286 | ) | ||||||||
|
|
|
|
|
|
|
|
|
|||||||||
| Total commission revenue |
296,000 | 89,389 | 43 | % | 206,611 | |||||||||||
| Total production bonus and other revenue |
41,469 | 14,392 | 53 | % | 27,077 | |||||||||||
|
|
|
|
|
|
|
|
|
|||||||||
| Total revenue |
$ | 337,469 | $ | 103,781 | 44 | % | $ | 233,688 | ||||||||
|
|
|
|
|
|
|
|
|
|||||||||
Revenue by Segment
For the year ended June 30, 2019, revenue from our Senior segment increased $89.8 million, or 88%, due to a $76.8 million increase in commission revenue and a $13.0 million increase in production bonus and other revenue. The increase in commission revenue was predominantly driven by a 114% increase in MA approved policies and a slight increase in lifetime value per Medicare approved policy. Production bonus and other revenue was driven by an increase in marketing development funds.
For the year ended June 30, 2019, revenue from our Life segment increased $12.3 million, or 12%, due to a $11.4 million increase in commission revenue and $0.8 million increase in production bonus and other revenue. The increase in commission revenue was driven by a 116% increase in ancillary premium sold which was the result of our focus on selling more guaranteed issue and fixed indemnity policies. Commission revenue also increased as a result of writing 5% more core term life premium. Production bonus and other revenue was driven by the increase in core term life premium sold.
For the year ended June 30, 2019, revenue from our Auto & Home segment increased $1.7 million, or 5%, due to a $1.1 million increase in commission revenue and $0.6 million increase in production bonus and other
-86-
Table of Contents
revenue. The increase in commission revenue was driven by a 12% increase in premium sold, offset by a shift in mix to insurance carrier partners whose contracts preclude us from recognizing variable consideration for estimated renewal commissions and therefore we only recognize the first year commission revenue when a policy is initially sold and then recognize renewal commission revenue when the policy renews in future years. Production bonus and other revenue was driven by the increase in premium sold.
Adjusted EBITDA by Segment
Adjusted EBITDA from our Senior segment was $90.2 million for the year ended June 30, 2019, a $53.5 million, or 146%, increase compared to Adjusted EBITDA of $36.7 million for the year ended June 30, 2018. The increase in Adjusted EBITDA was primarily due to a $89.8 million increase in revenue partially offset by a $36.4 million increase in operating costs and expenses primarily attributable to an increase in variable marketing expenses and personnel costs associated with higher headcount that was driven by a significant increase in policies submitted and an increase in the number of licensed agents.
Adjusted EBITDA from our Life segment was $25.8 million for the year ended June 30, 2019, a $2.8 million, or 12%, increase compared to Adjusted EBITDA of $23.0 million for the year ended June 30, 2018. The increase in Adjusted EBITDA was primarily due to a $12.3 million increase in revenue partially offset by a $9.4 million increase in operating costs and expenses primarily attributable to an increase in variable marketing expenses and variable sales commission expenses to agents driven by an increase in the amount of premium sold for core and ancillary policies, partially offset by a reduction in fulfillment expenses associated with the restructuring activities we took during the years ended June 30, 2019 and 2018.
Adjusted EBITDA from our Auto & Home segment was $7.8 million for the year ended June 30, 2019, a $1.4 million, or 15%, decrease compared to Adjusted EBITDA of $9.2 million for the year ended June 30, 2018. The reduction in Adjusted EBITDA was primarily due to a $1.7 million increase in revenue offset by a $3.1 million increase in operating costs and expenses primarily attributable to an increase in personnel costs associated with higher headcount that was driven by an increase in premium sold and an increase in the number of licensed agents. Adjusted EBITDA was also negatively impacted by a shift in the mix to insurance carrier partners whose contracts preclude us from recognizing variable consideration for estimated renewal commissions and therefore we only recognize the first year commission revenue when a policy is initially sold and then recognize renewal commission revenue when the policy renews in future years.
Liquidity and Capital Resources
Our liquidity needs primarily include working capital and debt service requirements. We believe that our current sources of liquidity, which include cash and funds available under the Credit Agreement, along with the proceeds of this offering, will be sufficient to meet our projected operating and debt service requirements for at least the next 12 months. To the extent that our current liquidity is insufficient to fund future activities, we may need to raise additional funds. In the future, we may attempt to raise additional capital through the sale of equity securities or through debt financing arrangements. If we raise additional funds by issuing equity securities, the ownership of our existing stockholders will be diluted. The incurrence of additional debt financing would result in debt service obligations, and any future instruments governing such debt could provide for operating and financing covenants that could restrict our operations.
As of March 31, 2020 and 2019, our cash, cash equivalents, and restricted cash totaled $83.6 million and $0.8 million, respectively.
-87-
Table of Contents
The following table presents a summary of our cash flows for the periods presented:
| Fiscal Year Ended June 30, |
Nine Months Ended March 31, |
|||||||||||||||
| (dollars in thousands) | 2019 | 2018 | 2020 | 2019 | ||||||||||||
| Net cash provided by (used in) operating activities |
$ | 113 | $ | (4,846 | ) | $ | (42,032 | ) | $ | 3,837 | ||||||
| Net cash used in investing activities |
$ | (8,636 | ) | $ | (6,020 | ) | $ | (10,625 | ) | $ | (6,976 | ) | ||||
| Net cash provided by financing activities |
$ | 8,135 | $ | 11,482 | $ | 135,714 | $ | 2,935 | ||||||||
Operating Activities
Cash provided by operating activities primarily consists of net income, adjusted for certain non-cash items including depreciation; amortization of intangible assets and internally developed software; deferred income taxes; share-based compensation expense and the effect of changes in working capital and other activities.
Collection of commissions receivable depends upon the timing of our receipt of commission payments and associated commission statements from our insurance carrier partners. If we were to experience a delay in receiving a commission payment from an insurance carrier partner within a quarter, our operating cash flows for that quarter could be adversely impacted.
A significant portion of our marketing and advertising expenses is driven by the number of leads required to generate the insurance applications we submit to our insurance carrier partners. Our marketing and advertising costs are expensed and generally paid as incurred and since commission revenue is recognized upon approval of a policy but commission payments are paid to us over time there are working capital requirements to fund the upfront cost of acquiring new policies. During AEP, we experience an increase in the number of submitted Senior insurance applications and marketing and advertising expenses compared to periods outside of AEP. The timing of AEP affects the positive or negative impacts of our cash flows during each quarter.
Nine Month Period Ended March 31, 2020—Cash used in operating activities was $42.0 million, consisting of net income of $61.1 million and adjustments for non-cash items of $35.3 million, offset by cash used in operating assets and liabilities of $138.5 million. Adjustments for non-cash items primarily consisted of $19.1 million of deferred income taxes because we defer revenue related to certain commissions receivable into following years until it is collected, $9.3 million of stock compensation expense primarily for the Distribution to stock option holders, and $5.3 million of depreciation and amortization related to the additional fixed assets purchased for new office space to accommodate our growth in headcount. The cash decrease resulting from changes in net operating assets and liabilities primarily consisted of increases of $142.5 million and $17.1 million in commissions receivable and accounts receivable, respectively, in addition to increases of $12.9 million in accounts payable and accrued expenses and $6.6 million in accrued compensation and benefits, all driven by the increased marketing and personnel costs required to produce our increased revenue.
Nine Month Period Ended March 31, 2019—Cash provided by operating activities was $3.8 million, consisting of net income of $59.7 million and adjustments for non-cash items of $21.8 million, offset by cash used in operating assets and liabilities of $77.7 million. Adjustments for non-cash items primarily consisted of $18.2 million of deferred income taxes as the Company defers revenue related to certain commissions receivable into following years until it is collected and $3.4 million of depreciation and amortization related to the additional fixed assets purchased for new office space to accommodate our growth in headcount. The cash decrease resulting from changes in net operating assets and liabilities primarily consisted of increases of $69.4 million and $11.3 million in commissions receivable and accounts receivable, respectively, partially offset by increases of $3.1 million in accounts payable and accrued expenses and $3.1 million in accrued compensation and benefits, all driven by the increased marketing and personnel costs required to produce our increased revenue.
-88-
Table of Contents
Year Ended June 30, 2019—Cash provided by operating activities was $0.1 million, consisting of net income of $72.6 million and adjustments for non-cash items of $27.1 million, offset by cash used in operating assets and liabilities of $99.6 million. Adjustments for non-cash items primarily consisted of $22.0 million of deferred income taxes as the Company defers revenue related to certain commissions receivable into following years until it is collected, and $4.7 million of depreciation and amortization related to the additional fixed assets purchased for new office space to accommodate our growth in headcount. The cash decrease resulting from changes in net operating assets and liabilities primarily consisted of increases of $8.7 million and $91.6 million in accounts receivable and commissions receivable, respectively, partially offset by decreases of $2.8 million in accounts payable and accrued expenses and $3.5 million in accrued compensation and benefits, all driven by the increased marketing and personnel costs required to produce our increased revenue.
Year Ended June 30, 2018—Cash used in operating activities was $4.8 million, consisting of net income of $34.9 million and adjustments for non-cash items of $10.9 million, offset by cash used in operating assets and liabilities of $50.6 million. Adjustments for non-cash items primarily consisted of $6.6 million of deferred income taxes as the Company defers revenue related to certain commissions receivable into following years until it is collected and $3.5 million of depreciation and amortization related to the additional fixed assets purchased for new office space to accommodate our growth in headcount. The cash decrease resulting from changes in net operating assets and liabilities primarily consisted of increases of $6.3 million and $46.4 million in accounts receivable and commissions receivable, respectively, partially offset by a $3.1 million decrease in accounts payable and accrued expenses, all driven by the increased marketing and personnel costs required to produce our increased revenue.
Investing Activities
Our investing activities primarily consist of purchases of furniture and fixtures, computer hardware, leasehold improvements related to facilities expansion and capitalized salaries related to the development of internal-use software.
Nine Month Period Ended March 31, 2020—Net cash used in investing activities of $10.6 million was due to $6.2 million of purchases of property and equipment and $4.4 million in purchases of software and capitalized internal-use software spent to develop new programs and systems to efficiently accommodate our increased volumes.
Nine Month Period Ended March 31, 2019—Net cash used in investing activities of $7.0 million was due to $3.5 million of purchases of property and equipment and $3.4 million in purchases of software and capitalized internal-use software spent to develop new programs and systems to efficiently accommodate our increased volumes.
Year Ended June 30, 2019—Net cash used in investing activities of $8.6 million was due to $3.9 million of purchases of property and equipment and $4.7 million in purchases of software and capitalized internal-use software spent to develop new programs and systems to efficiently accommodate our increased volumes.
Year Ended June 30, 2018—Net cash used in investing activities of $6.0 million was due to $5.4 million of purchases of property and equipment and $0.6 million in purchases of software and capitalized internal-use software spent to develop new programs and systems to efficiently accommodate our increased volumes.
Acquisitions
On May 1, 2020, we acquired 100% of the outstanding membership units of InsideResponse, an online marketing consulting firm from which we have historically purchased leads, for an aggregate purchase price of up to $65.0 million (subject to customary adjustments), as set forth in the Agreement and Plan of Merger, dated February 12, 2020, by and among the Company, SQ-IR Merger Sub LLC, a wholly owned subsidiary of the
-89-
Table of Contents
Company, InsideResponse and the other parties thereto, as amended on May 1, 2020 (the “Merger Agreement”). The purchase price is comprised of $32.7 million, which was paid in cash at the closing of the transaction, and an earn-out of up to $32.3 million, to be paid 65% in cash and 35% in shares of our common stock (to be valued based on the average closing price of our common stock for the 10 trading days ending three trading days immediately preceding such payment date). The earn-out is contingent upon the achievement of certain gross profit targets for InsideResponse in calendar year 2020, as set forth in the Merger Agreement. See “Certain Relationships and Related Party Transactions—InsideResponse.”
Financing Activities
Our financing activities primarily consist of net proceeds from the revolving line of credit, non-recourse debt and common stock options exercised along with dividend payments to stockholders.
Nine Month Period Ended March 31, 2020—Net cash provided by financing activities of $135.7 million was primarily due to $416.5 million net proceeds from the Term Loan, $12.1 million gross proceeds from non-recourse debt, and $5.4 million in proceeds from common stock options exercised, partially offset by $275.0 million for the Distribution, $11.0 million in net payments for our revolving line of credit which is used to fund working capital, mostly due to our seasonality around AEP, and $7.7 million and $2.1 million in debt and equity issuance costs, respectively, incurred for the Term Loan and our proposed initial public offering.
Nine Month Period Ended March 31, 2019—Net cash provided by financing activities of $2.9 million was primarily due to $12.1 million gross proceeds from non-recourse debt and $3.5 million in proceeds from common stock options exercised, partially offset by $10.7 million in net payments for our revolving line of credit which is used to fund working capital, mostly due to our seasonality around AEP.
Year Ended June 30, 2019—Net cash provided by financing activities of $8.1 million was primarily due to $16.2 million gross proceeds from non-recourse debt and $4.3 million of common stock options exercised, partially offset by $8.7 million in net payments for our revolving line of credit which is used to fund working capital mostly due to our seasonality around AEP.
Year Ended June 30, 2018—Net cash provided by financing activities of $11.5 million was primarily due to $15.4 million net proceeds from our revolving line of credit to fund working capital mostly due to our seasonality around AEP, partially offset by a $2.0 million payoff of our subordinated debt.
Senior Secured Credit Facilities
On November 6, 2017, we entered into a two-year Loan and Security Agreement (the “Loan and Security Agreement”) with UMB Bank N.A. which allowed us to borrow against certain borrowing base assets on a revolving basis.
On November 5, 2019, in conjunction with entering into the Credit Agreement, we terminated the Loan and Security Agreement. See “Description of Certain Indebtedness” for further details. There is currently $425.0 million of Term Loans outstanding pursuant to the Credit Agreement.
Delayed Draw Credit Facilities
On December 14, 2018, we entered into a senior secured delayed draw credit facility (as amended, the “Receivables Financing Agreement”). Pursuant to the Receivables Financing Agreement, we have access to a senior secured delayed draw credit facility consisting of up to $30.0 million aggregate principal amount of commitments (the “Commitment”), with no more than quarterly draws in an aggregate original principal amount not to exceed the Commitment, with the commissions receivable from the Auto & Home insurance policies sold by SelectQuote Auto & Home as collateral. As the underlying policyholders renew their policies, the renewal
-90-
Table of Contents
commissions received from our insurance carrier partners are transferred to the lender as repayment of the draw, with any accrued interest being paid first. Each loan accrues interest at 11.5% that is computed on a daily basis on the unpaid principal and interest amounts. If the amount of renewal commissions received is not enough to pay off the loan balances, there is no recourse to the Company. If we continue to receive renewal commissions on the underlying policies after the time at which the loan balances are paid off, the right to those renewal commissions reverts back to the Company. The Receivables Financing Agreement contains customary events of default and a tangible net worth covenant. As of March 31, 2020, the Company was in compliance with all of the covenants.
As of March 31, 2020, we have received $28.3 million in proceeds from six draws on the facility and have made principal payments of $3.7 million, of which $2.4 million was repaid during the nine month period ended March 31, 2020, with the remaining balance due included in non-recourse debt in the condensed consolidated balance sheet. The proceeds from the loans are being used for general working capital purposes. As of March 31, 2020, we had unused borrowing availability of $1.7 million. On April 20, 2020, we made our seventh draw on the facility in the amount of $4.5 million which was recorded in non-recourse debt in the condensed consolidated balance sheet. The seventh draw, and the prepayment obligation it triggered, were waived by the sole lender.
In its capacity as servicer under the Receivables Financing Agreement, SQAH performs administrative duties such as transferring principal and interest payments between the two parties, tracking loan balances and weekly and monthly reporting and receives a monthly de minimis servicing fee as payment. We incurred $0.3 million of debt issuance costs in connection with the facility. Debt issuance costs are amortized through interest expense over the estimated time to pay off the individual note balances of five years for each draw. As of March 31, 2020, the unamortized debt issuance costs recorded as a discount to non-recourse debt—net in the condensed consolidated balance sheet was $0.2 million. Accrued interest related to the Receivables Financing Agreement was $0.3 million as of March 31, 2020, and is recorded in accounts payable and accrued expenses in the condensed consolidated balance sheet.
The loans drawn on the Receivables Financing Agreement are recorded on the consolidated balance sheet at amortized cost. The fair value of the loans is measured as a level 3 liability and is based on the incremental borrowing rate for similar debt. However, as the underlying assets securing the loans are of high credit quality and turn over quickly, we have determined that the fair value approximates carrying value and no further assessment of fair value is required.
On November 4, 2019, in conjunction with entering into the Credit Agreement, we executed a technical amendment to the Receivables Financing Agreement to reflect our entry into the Credit Agreement.
Private Placement of Series E Preferred Stock
On April 17, 2020 and May 6, 2020, we issued and sold an aggregate of 100,000 shares and 35,000 shares, respectively, of our Series E preferred stock to certain “accredited investors” (as defined in Regulation D promulgated under the Securities Act), at a purchase price of $1,000 per share, for aggregate proceeds of approximately $135.0 million and net proceeds to the Company of approximately $129.0 million, after deducting commissions and expenses. We applied a portion of the net proceeds from the private placement of Series E preferred stock to complete our acquisition of InsideResponse, an online marketing consulting firm from which we have historically purchased leads, and intend to use the remaining proceeds for general corporate purposes. Upon the closing of this offering, all outstanding shares of Series E preferred stock will automatically convert into shares of common stock at a fixed discount to the initial offering price. See “Description of Capital Stock—Series E Preferred Stock Rights” and “Recent Sales of Unregistered Securities” for additional information.
-91-
Table of Contents
Contractual Obligations
The following tables summarize our contractual obligations as of March 31, 2020 and June 30, 2019. Our principal commitments consisted of obligations under our outstanding operating leases for office facilities, capital lease obligations related to copy machines and our Senior Secured Credit Facility. The amount of the obligations presented in the table summarizes our commitments to settle contractual obligations in cash as of the dates presented (in thousands).
| Payments due by Period—March 31, 2020 (in thousands) | ||||||||||||||||||||
| Total | Less than 1 Year |
1–3 years | 4–5 Years | More Than 5 Years |
||||||||||||||||
| Operating lease obligations |
$ | 61,987 | $ | 8,543 | $ | 15,387 | $ | 15,202 | $ | 22,855 | ||||||||||
| Capital lease obligations |
169 | 84 | 85 | — | — | |||||||||||||||
| Long-term debt obligations (1) |
425,000 | — | 5,313 | 419,687 | — | |||||||||||||||
|
|
|
|
|
|
|
|
|
|
|
|||||||||||
| Total contractual obligations |
$ | 487,156 | $ | 8,627 | $ | 20,785 | $ | 434,889 | $ | 22,855 | ||||||||||
| (1) | This includes our Revolving Credit Facility and Term Loan. The non-recourse debt related to the Receivables Financing Agreement does not have contractually required principal or interest payments due on certain dates. It is paid in correlation to when the renewal commissions are received. |
| Payments due by Period—June 30, 2019 (in thousands) | ||||||||||||||||||||
| Total | Less than 1 Year |
1–3 years | 4–5 Years | More Than 5 Years |
||||||||||||||||
| Operating lease obligations |
$ | 44,057 | $ | 5,874 | $ | 10,927 | $ | 9,436 | $ | 17,820 | ||||||||||
| Capital lease obligations |
184 | 87 | 97 | — | — | |||||||||||||||
| Long-term debt obligations (1) |
11,032 | — | 11,032 | — | — | |||||||||||||||
|
|
|
|
|
|
|
|
|
|
|
|||||||||||
| Total contractual obligations |
$ | 55,273 | $ | 5,961 | $ | 22,056 | $ | 9,436 | $ | 17,820 | ||||||||||
| (1) | The non-recourse debt related to the Receivables Financing Agreement does not have contractually required principal or interest payments due on certain dates. It is paid in correlation to when the renewal commissions are received. |
Off-Balance Sheet Arrangements
We have not entered into any off-balance sheet arrangements, as defined in Regulation S-K.
Recent Accounting Pronouncements
For a discussion of new accounting pronouncements recently adopted and not yet adopted, see the notes to our consolidated financial statements included elsewhere in this prospectus.
Quantitative and Qualitative Disclosures about Market Risk
In the normal course of business, we are subject to market risks. Market risk represents the risk of loss that may impact our financial position due to adverse changes in financial market prices and rates. Our financial instruments that are exposed to concentrations of credit risk primarily consist of accounts and commissions receivable. We do not require collateral or other security for our receivables, but believe the potential for collection issues with any of our customers was minimal as of March 31, 2020 and June 30, 2019, based on the lack of collection issues in the past and the high financial standards we require of our customers. As of March 31, 2020, three insurance carrier partners accounted for 25%, 20% and 11% of total accounts and commissions receivable. As of March 31, 2019, two insurance carrier partners accounted for 20% and 17% of total accounts and commissions receivable. As of June 30, 2019, two insurance carrier partners accounted for 20% and 17% of total accounts and commissions receivable. As of June 30, 2018, two insurance carrier partners accounted for 16% and 14% of total accounts and commissions receivable.
-92-
Table of Contents
Interest Rate Risk
As of March 31, 2020, we had cash of $2.4 million deposited in non-interest bearing accounts and $54.7 million deposited in an interest bearing account, all at a major bank with limited to no interest rate risk. As of March 31, 2020, we had cash of $26.6 million deposited in a money market account at the same bank. As of June 30, 2019, we had cash of $0.6 million deposited in non-interest-bearing accounts at a major bank with limited to no interest rate risk. Interest-earning instruments carry a degree of interest rate risk. We do not enter into investments for trading or speculative purposes.
Our Senior Secured Credit Facilities bear interest at a variable rate. As a result, we may be exposed to fluctuations in interest rates to the extent of our borrowings under these credit facilities. A hypothetical 1.0% increase or decrease in the interest rate associated with our Senior Secured Credit Facilities would have resulted in a $1.7 million impact to interest expense for the period starting November 5, 2019 (the date on which we entered into the Credit Agreement) and ending March 31, 2020. To help manage borrowing costs, we entered into an interest rate swap on May 12, 2020 to mitigate the variability in cash flows on our debt-related interest payments. That swap was designated as an accounting cash flow hedge.
See “Risk Factors—Risks Related to Our Business and Industry—Our existing and any future indebtedness could adversely affect our ability to operate our business” and “Risk Factors—Risks Related to Our Business and Industry—Developments with respect to LIBOR may affect our borrowings under our credit facilities” for additional information.
Seasonality
As a result of the Medicare AEP from October 15th to December 7th and the Medicare OEP from January 1st to March 31st, we experience an increase in the number of submitted Medicare-related applications during the first and fourth quarters of the calendar year and an increase in Medicare plan related expense during the third and fourth quarters of the calendar year. Therefore, our revenue increases significantly in the first and fourth quarters of the calendar year compared to other quarters. The impacts of these seasonal trends are reflected in our quarterly operating results.
Critical Accounting Policies and Estimates
The preparation of consolidated financial statements in conformity with accounting principles generally accepted in the United States of America requires management to make estimates and assumptions that affect the reported amounts of revenues, expenses, assets, and liabilities and disclosure of contingent assets and liabilities in our financial statements. We regularly assess these estimates; however, actual amounts could differ from those estimates. The most significant items involving management’s estimates include estimates of revenue recognition, commissions receivable, accrued compensation, capitalized software and the provision for income taxes. The impact of changes in estimates is recorded in the period in which they become known.
An accounting policy is considered to be critical if the nature of the estimates or assumptions is material due to the levels of subjectivity and judgment necessary to account for highly uncertain matters or the susceptibility of such matters to change, and the effect of the estimates and assumptions on financial condition or operating performance. The accounting policies we believe to reflect our more significant estimates, judgments and assumptions that are most critical to understanding and evaluating our reported financial results are: revenue recognition, commissions receivables and accounting for income taxes.
Revenue Recognition and Commissions Receivables
In accordance with ASC 606, revenue is recognized when a customer obtains control of promised goods or services and is recognized in an amount that reflects the consideration that an entity expects to receive in
-93-
Table of Contents
exchange for those goods or services. We apply the following five-step model in order to determine this amount: (i) identification of the promised goods in the contract; (ii) determination of whether the promised goods are performance obligations, including whether they are distinct in the context of the contract; (iii) measurement of the transaction price, including the constraint on variable consideration; (iv) allocation of the transaction price to the performance obligations; and (v) recognition of revenue when (or as) we satisfy each performance obligation.
Significant management judgments and estimates must be made in connection with determination of the revenue to be recognized in any accounting period. If we made different judgments or utilized different estimates for any period, material differences in the amount and timing of revenue recognized could result. The accounting estimates and judgments related to the recognition of revenue require us to make assumptions about numerous factors such as the determination of performance obligations and determination of the transaction price. The estimates of renewal commissions and production bonuses are considered variable consideration in the transaction price and require significant judgment including determining the number of periods in which a renewal will occur and the value of those renewal commissions to be received if renewed. We utilize the expected value approach to do this, incorporating a combination of historical lapse and premium increase data, available industry and carrier experience data, historical payment data by segment and insurance carrier, as well as current forecast data to estimate forecasted renewal consideration and production bonuses and then to constrain revenue recognized to the extent that it is probable that a significant reversal in the amount of cumulative revenue recognized will not occur. Before the adoption of ASC 606, we were already using a similar method to calculate the lifetime revenue value of a contract for internal forecasting purposes so we believe we have the ability to make reasonable estimates for these items and have the appropriate accounting policies and controls in place to do so. The uncertainty associated with the variable consideration is subsequently resolved when the policy renews, and any adjustments in variable consideration are recognized in the period incurred.
Commissions receivable represent the variable consideration for policies that have not renewed yet and therefore are subject to the same assumptions, judgements and estimates used when recognizing revenue as noted above.
Income Taxes
We account for income taxes using an asset and liability approach. Deferred income tax assets and liabilities result from temporary differences between the tax basis of assets and liabilities and their reported amounts in the consolidated financial statements that will result in taxable or deductible amounts in future years. Valuation allowances are provided when necessary to reduce deferred tax assets to the amount expected to be realized.
The determination of our provision for income taxes requires management’s judgment in the use of estimates and the interpretation and application of complex tax laws. Judgment is also required in assessing the timing and amounts of deductible and taxable items. We establish liabilities for material, known tax exposures relating to deductions, transactions and other matters involving some uncertainty as to the proper tax treatment of the item. Our liabilities reflect our judgment as to the resolution of the issues involved if subject to judicial review. When facts and circumstances change (including a resolution of an issue or statute of limitations expiration), these liabilities are adjusted through the provision for income taxes in the period of change.
-94-
Table of Contents
Company Overview
We are united by our mission to provide solutions that help consumers with their overall financial well-being and protect their most valued assets: their families, their health and their property. Our highly skilled agents strive to deliver a best-in-class consumer experience through a comparison shopping process of leading insurance carriers to provide consumers with greater choice, transparency and value.
We are a leading technology-enabled, DTC distribution platform that provides consumers with a transparent and convenient venue to shop for complex senior health, life and auto & home insurance policies from a curated panel of the nation’s leading insurance carriers. As an insurance distributor, we do not insure the consumer, but rather identify consumers looking to acquire insurance products and place these consumers with insurance carrier partners that provide these products and, in return, earn commissions from our insurance carrier partners for the policies we sell on their behalf. Our proprietary technology allows us to take a broad funnel approach to marketing by analyzing and identifying high quality consumer leads sourced from a wide variety of online and offline marketing channels. Our primary sources of leads include search engine marketing, radio, television, and third-party marketing partners. We monitor our acquisition costs to dynamically allocate our marketing spend to the most attractive channel, benefitting from over thirty years of data accumulated through our proprietary, purpose-built technologies. Our advanced workflow processing system scores each acquired lead in real-time, matching it with an agent whom we determine is best suited to meet the consumer’s need. Our platform then captures and utilizes our experience to further build upon the millions of data points that feed our marketing algorithms, which further enhances our ability to deploy subsequent marketing dollars efficiently and target more high-quality consumer leads.
Our proprietary routing and workflow system is a key competitive advantage and driver of our business performance. Our systems analyze and intelligently route consumer leads to agents and allow us to monitor, segment and enhance our agents’ performance. This technological advantage also allows us to rapidly conduct a needs-based, bespoke analysis for each consumer that maximizes sales, enhances customer retention and ultimately maximizes policyholder lifetime revenues. Although we have the ability to conduct end-to-end enrollments online, our expertise and value add stems from the coupling of our technology with our skilled agents, which provides greater transparency in pricing terms and choice, and an overall better consumer experience. When customers are satisfied, their propensity to switch policies decreases, thereby improving retention rates, increasing policyholder lifetime values and ultimately, optimizing and increasing the visibility of our financial performance.
We generate commission revenue from selling policies on behalf of our insurance carrier partners, the majority of which compensate us through first year and renewal commissions. We have built our business model to maximize commissions collected over the life of an approved policy less the cost of acquiring the business, a metric we refer to as policyholder lifetime value and which is a key component to our overall profitability.
For our fiscal 2019, we earned $337.5 million of revenue representing 44% growth over the $233.7 million of revenue that we earned during our fiscal 2018. In fiscal 2019, we generated $72.6 million in net income, an increase of 108% over fiscal 2018 when we generated $34.9 million in net income. In fiscal 2019, we generated $105.3 million in Adjusted EBITDA, an increase of 111% over fiscal 2018 when we generated $49.9 million in Adjusted EBITDA. Our Adjusted EBITDA Margin increased to 31.2% in fiscal 2019 from 21.4% in fiscal 2018.
For the nine month period ended March 31, 2020, we earned $390.1 million of revenue representing 48.3% growth over the $263.1 million of revenue that we earned for the nine month period ended March 31, 2019. Net income increased 2.4% from $59.7 million for the nine month period ended March 31, 2019 to $61.1 million for the nine month period ended March 31, 2020. During the nine month period ended March 31, 2020, we generated $113.9 million in Adjusted EBITDA, an increase of 32.8% over the nine month period ended March 31, 2019,
-95-
Table of Contents
when we generated $85.8 million in Adjusted EBITDA. Our Adjusted EBITDA Margin decreased to 29.2% for the nine month period ended March 31, 2020, from 32.6% for the nine month period ended March 31, 2019.
Adjusted EBITDA and Adjusted EBITDA Margin are Non-GAAP financial measures that we use to measure our operating performance. For a reconciliation of these Non-GAAP financial measures to our GAAP financial measures, please see “Selected Historical Consolidated Financial and Operating Data—Non-GAAP Financial Measures” and “Management’s Discussion and Analysis of Financial Condition and Results of Operations—Non-GAAP Financial Measures (Adjusted EBITDA)” in this prospectus.
Our Business Model
We operate in an attractive segment of the insurance value chain, distributing insurance products on behalf of our insurance carrier partners who, in return, pay us commissions. Accordingly, we do not currently generate revenues directly from the consumers with whom we interact. In addition, because we are not the issuer of the insurance policy to the consumer, we bear no underwriting risks.
Founded over 30 years ago as what we believe was the first DTC term life insurance exchange platform in the U.S., our technology-driven, differentiated model allows consumers to easily compare pricing and policy options from over 50 of the nation’s leading insurance carriers. Working in tandem, our agents and technology systems are the foundational pillars of our franchise. Our highly trained and licensed agents are subject matter experts in the products they sell, and this, in combination with our purpose-built software and business process, differentiates the service we provide to consumers relative to other insurance distributors or “online only” offerings. We believe providing personalized advice and guidance from policy research to enrollment is a key differentiator in the senior health market as consumers tend to prefer or require more personalized attention to navigate increasingly complex and ever-changing coverage options. Our agents on the SelectQuote platform are trained to offer unbiased advice in order to be more aligned to the specific needs of each customer.
As one of the few technology-enabled distributors of scale in our end markets, we believe that we are well-positioned to capitalize on the accelerating trend of digital transformation across the insurance distribution landscape. Under the traditional insurance distribution model, consumers are often unaware of their full range of coverage options and are at risk of receiving opaque, “one size fits all” recommendations primarily intended to maximize agent commissions over their needs. In contrast, the insurance distribution landscape today is one in which consumers of insurance demand greater choice, seek more transparency in pricing and use the internet to self-research their insurance options. Recent technological innovations, including the proliferation of smart mobile devices as a means of consumer purchasing, consumer demand for price transparency and comparison shopping, and the development of machine learning for business applications, continue to transform the insurance distribution landscape. As the composition of the U.S. population gradually shifts to the mobile-first generation, consumers are becoming more tech-savvy and increasingly comfortable shopping online. We believe our ability to offer multiple carriers’ policies, proprietary technology platform, vast datasets and use of machine learning in key aspects of our business puts us in an excellent position to take advantage of these consumer trends.
Direct distribution is becoming an increasingly important part of the overall distribution strategies of insurance carriers as they drive to lower customer acquisition costs. Internet and mobile devices enable distributors to target and reach consumers directly in a highly controlled and efficient manner. Our software allows our agents to have more effective interactions with customers, driving agent productivity and sales volumes and providing an attractive distribution alternative for our insurance carrier partners. While traditional insurance distributors use a time-intensive, in-person purchasing process, consumers are increasingly researching insurance policies for their needs online and ultimately, purchasing through direct channels. Platforms like ours are well-positioned to serve these customers as we allow consumers to compare insurance in a transparent manner, without having to solicit individual quotes from carriers in the market or rely on the options presented by a traditional insurance distributor and to do so from the comfort of their homes.
-96-
Table of Contents
Our systems allow us to gain valuable insights from the rich sources of consumer information we have gathered over three decades, and we use data analytics and proprietary algorithms to enhance our sales and marketing strategies in an effort to maximize our return on our marketing spend and enhance our agents’ close rates. As we have grown, we have continued to gather valuable data that has allowed us to further enhance our algorithms. Accordingly, we have been able to improve our lead acquisition efficiency and scoring and workflow processing capabilities, which has enabled us to serve customers more efficiently and has improved the value proposition we offer to our insurance carrier partners. As our value proposition has grown, our insurance carrier partners have come to rely more on our distribution capabilities and have collaborated with us more deeply in product design, helping fuel our growth. We expect this virtuous cycle, which we refer to as the SelectQuote “Fly Wheel,” to continue as we execute on our mission.
Our Agents
Our agent force is one of two foundational pillars that support our business. The insurance products we sell are often complicated and each consumer has different needs. We believe the most effective method for matching products with each consumer’s needs requires the attention of highly-trained and skilled agents, and we believe this training and expertise differentiates us from the traditional distribution model. Each of our lines of business has dedicated licensed agents that are subject matter experts in that line which allows them to provide deep expertise and helpful advice that are specific to a client’s needs. We have developed what we believe is a best-in-class talent management system that allows us to recruit from across the U.S. and build and retain top agents. We provide each new agent with up to 10 weeks of proprietary in-house training, which is later supplemented by ongoing training during the agents’ full-time employment. Our training is designed to ensure that every agent is well-equipped with a deep understanding of the products he or she sells and the customer service and sales skills necessary to best service the customer. A goal of ours is that every agent in whom we invest will build a long and rewarding career with us.
We recruit agents to work in our six U.S. offices using a structured process that we have continuously improved over our long operating history. We pride ourselves on being able to attract and retain individuals from diverse backgrounds and experience sets, positively contributing to our inclusive culture. We have been strategic in selecting our office locations, choosing cost effective markets we believe have a sufficient pool of potential agents. Our in-house recruiting team systematically reviews over 60,000 applications annually and conducts over 6,500 phone interviews. These phone interviews ultimately culminate with a subset being interviewed by a hiring
-97-
Table of Contents
manager before ultimately being extended an offer to join as a flex agent ahead of AEP, an 8-week period from October 15 to December 7, during which eligible U.S. seniors are able to sign up for, change or dis-enroll from Medicare Advantage and Prescription Drug plans. Once extended an offer, we require our incoming agents to take a self-study approach to obtaining requisite licenses, a process which allows less committed recruits to self-select out of our program before we expend significant training costs. Our agents are compensated on a variable, performance basis from the start, including on the basis of performance during training. This approach enables us to recruit higher quality potential agents that are more willing to leave their current jobs as it provides an opportunity to earn a run rate compensation similar to what they could earn once they start selling policies but months before actually start doing so. Our assessment of their performance, including their fit within our unique sales-oriented culture, continues through AEP after which we extend a subset offers to join as core agents or in other positions within our Company.
We launched our remote agent program in 2019 as a means to expand our access to agent talent on a more cost-effective basis. Remote agents are recruited in a similar manner to our core and flex agents, where resumes are screened by our internal teams and a hiring manager ultimately interviews and approves the extension of offers. These remote agents are compensated on the same basis as our onsite agents, though at a slightly lower cost to us as these agents bear the cost of his or her own office space. Like our core and flex agents, these remote agents undergo training, though training is online in lieu of onsite training at a SelectQuote office. Once on board, remote agents have full access to benefits afforded by our technology platform. We believe the expansion of this remote program will be accretive to overall agent productivity, as the large potential pool of remote agents allows us to be highly selective about individuals we hire. While most of our agents work from one of our six office locations, the technology underlying our remote agent program enables all of our agents to work remotely.
Our need for agent capacity is seasonal, peaking during AEP and remaining elevated during OEP. We hire additional flex agents during these periods to address this expected increase in transaction volume and temporarily reassign agents from our Senior business to our Life and Auto & Home businesses during non-AEP/OEP periods. Our flex agents undergo up to 10 weeks of proprietary in-house training, further supplemented by additional training. We continuously assess flex agent performance throughout AEP and OEP. The majority of our flex agents that we regard as high performers during this period move on to become core agents or accept other roles with us. This opportunity to assess flex agent performance before offering a permanent role within the Company is an important factor in placing employees in the right roles over the long term, which allows us to maintain our strong agent productivity and helps create a positive career path leading to strong employee engagement as evidenced by multiple awards of “Best Places to Work.” In fact, based on our past experience, average agent productivity increases by approximately 40% in an agent’s second AEP.
Our agents are segmented into multiple levels based on their productivity, with the most productive agents given first access to the highest quality leads. In our Senior segment, level one agents demonstrate higher productivity and higher close rates than similarly situated Senior agents in levels below them. In addition, we experience much lower agent attrition with our top-level agents. Essentially, this process allows us to match a lead with the appropriate agent and to optimize our agent’s most valuable asset: time. Each agent guides the potential customer through tailored policy options and provides education on complex senior health, life and auto & home products, thereby helping consumers select the option that best suits their needs and circumstances. This personalized approach enhances the customer experience and when customers are satisfied, their propensity to switch policies decreases, which extends the renewal revenue stream paid to us by our insurance carrier partners, and enhances the lifetime value of policyholder relationships. Our processes and technologies come together to drive strong economic results, allowing us to reward top agents with market leading pay, which coupled with our corporate culture, drives what we believe to be an industry-leading agent retention rate of over 93% among our level 1, or top performing, agents, and a 70% overall agent retention rate.
As of March 31, 2020, we employed a total of 922 core agents and 73 flex agents across our Senior, Life and Auto & Home segments.
-98-
Table of Contents
Our Technology
Technology is the second foundational pillar that supports our business. Our proprietary technology permeates our business process, from lead generation to scoring and routing, product selection and eventually to customer conversion, post-sale management, and cross-selling opportunities. Applying information gathered since our founding more than 30 years ago to drive sophisticated attribution modeling, we have continued to optimize our decision-making and advance our goal of maximizing policyholder lifetime value and profitability.
Lead Acquisition: We utilize a broad policyholder acquisition funnel strategy, generating new business leads through a wide variety of online and offline marketing channels, such as search engine, television, radio advertising and third-party marketing partners. Our software continuously monitors the cost of acquiring customers and uses our algorithm to dynamically adjust our bids for specific leads based on our expectation of the lead’s lifetime value. As we continue to operate, these algorithms feed a vast and ever growing pool of millions of data points, which, with the assistance of our team of highly skilled data scientists, enhances our ability to more accurately estimate a new lead’s lifetime value and enables us to make more informed decisions when generating leads. Our data science team creates algorithms that support lead buying, scoring and routing and consumer lifecycle management of closed leads. We believe what sets us apart from our competitors is our more than 30 years of proprietary data that our data scientists use as part of our bidding strategy for purchased leads, grouping phone and web leads by likelihood to purchase specific products, scoring phone and web leads using historical performance of similar leads based on demographics, tiering leads for routing to the corresponding agent levels, and performing predictive analysis of current customers’ persistency.
Lead Management & Routing: Regardless of how a lead is generated, our proprietary software will score the lead in real-time on a scale of 1 to 10 based on multiple factors, then route the lead to the most appropriate level of agent to maximize expected lifetime policyholder value. This works in tandem with our bespoke, purpose-built lead routing and workflow management technology, GAL. Based on lead score, agent level, and agent availability, GAL uses a “rapid fire approach” to quickly assign these leads to a licensed agent. We believe that our use of proprietary technology to monitor, segment and enhance agent performance, such as through real-time lead routing to the most effective agents, is a key competitive advantage and driver of our business performance.
Sales: Once assigned a lead, our highly skilled, licensed agents utilize their training, experience and our proprietary software and systems to rapidly conduct a bespoke needs-based analysis for each consumer. This coupling of our technology with our skilled agents provides the consumer with greater transparency in pricing terms and choice, and an overall better consumer experience that maximizes sales, enhances customer retention and, ultimately, maximizes our policyholder lifetime revenues.
-99-
Table of Contents
Customer Engagement & Lifecycle Management: We use advanced algorithms informed by over 1 billion consumer and third-party data points to enrich our consumer engagement strategy. Our dedicated retention-focused CCA team leverages this technology to help consumers successfully onboard and to identify customers we determine to be likely to purchase additional products, thereby improving the likelihood that a consumer retains his or her policy and identifying cross-sell opportunities.
Our Products
The core products we distribute on behalf of our insurance carrier partners are needs-based and critical to the overall financial well-being of consumers and the protection of their most valued assets: their families, their health and their property. Increasing household financial obligations, rising healthcare costs, importance of health and wellbeing, and government and lender mandates for certain insurance coverage drive the need for the insurance products we distribute. These products are underwritten by leading insurance carrier partners that we carefully select across our three business lines: SelectQuote Senior, SelectQuote Life and SelectQuote Auto & Home.
SelectQuote Senior, our fastest growing and largest segment, was launched in 2010 and provides unbiased comparison shopping for Medicare Advantage and Medicare Supplement insurance plans as well as prescription drug plan, dental, vision and hearing and critical illness products. We represent approximately 15 leading, nationally-recognized insurance carrier partners, including Humana, UnitedHealthcare and Aetna. Medicare Advantage and Medicare Supplement plans accounted for 74% of our approved Senior policies during fiscal 2019 and 78% of our approved Senior policies during the nine month period ended March 31, 2020, with ancillary policies including prescription drug, dental, vision and hearing plans, accounting for most of the remainder.
Medicare is a health insurance program offered by the federal government for people 65 and older, people under 65 with certain disabilities, and people of any age with end stage renal disease requiring kidney dialysis or kidney transplant. Original Medicare includes Medicare Part A, which covers inpatient treatment in a variety of settings including hospitals, skilled nursing facilities, hospice, and other inpatient facilities, and Part B, which is health insurance that covers doctor visits, exams, immunizations, checkups, and durable medical equipment. With original Medicare, the beneficiary is responsible for deductibles, coinsurance and premiums. Medicare Part D is the part of Medicare that provides prescription drug coverage. Medicare Part D plans reduce the beneficiary’s overall health care costs by lowering the beneficiary’s cost of their prescriptions. Each plan can vary by cost and drug coverage. According to the Kaiser Family Foundation analysis of the Centers for Medicare and Medicaid Services Current Beneficiary Survey, healthcare expenses can consume 12% of income during retirement and one quarter of all beneficiaries spent at least 23% of their incomes on health-related services in 2016, while 10% spent nearly half of their income. Without adequate planning and risk protection, healthcare costs can significantly affect a retired beneficiary’s income and overall wealth.
Medicare insurance plans from private insurers complement Medicare coverage or replace the benefits of original Medicare. These plans, distributed by SelectQuote, help cover some of the out-of-pocket expenses not paid by Medicare, such as co-payments, co-insurance and deductibles associated with Original Medicare, and can mitigate the impact of unexpected healthcare costs if a beneficiary only has original Medicare.
SelectQuote Life is one of the country’s largest and most established DTC insurance distributors for term life insurance, having sold over 1.75 million policies nationwide since our founding in 1985. Our platform provides unbiased comparison shopping for life insurance and ancillary products including term life, guaranteed issue, final expense, accidental death and juvenile insurance. We represent approximately 15 leading, nationally-recognized insurance carrier partners, with many of these relationships exceeding 15 years. Term and permanent life products accounted for 84% of new premium within the Life segment during fiscal 2019 and 76% of new premium within the Life segment during the nine month period ended March 31, 2020, with ancillary products, primarily final expense, accident and juvenile life policies, accounting for the majority of the remainder.
-100-
Table of Contents
SelectQuote Auto & Home was founded in 2011 as an unbiased comparison shopping platform for auto, home and specialty insurance lines. We offer insurance products, including homeowners, auto, dwelling fire and other ancillary insurance products, underwritten by 29 leading, nationally-recognized insurance carrier partners. Homeowners and 12-month auto products accounted for 75% of new premium within the Auto & Home segment during fiscal 2019 and 78% of new premium within the Auto & Home segment during the nine month period ended March 31, 2020, with six-month auto, dwelling and other products accounting for the remainder.
As illustrated below, we have a diverse revenue base from a variety of products and carriers across each business line. We experienced strong revenue, net income and Adjusted EBITDA growth across each of our segments in fiscal 2019 that has continued into fiscal 2020. Revenues from Senior, Life and Auto & Home grew by 88%, 12% and 5%, respectively, in fiscal 2019 compared to fiscal 2018, and have grown by 73%, 10% and 15%, respectively, for the nine month period ended March 31, 2020, compared to the nine month period ended March 31, 2019. Adjusted EBITDA and Adjusted EBITDA Margin are Non-GAAP financial measures that we use to measure our operating performance. For a reconciliation of these Non-GAAP financial measures to our GAAP financial measures, please see “Selected Historical Consolidated Financial and Operating Data—Non-GAAP Financial Measures” and “Management’s Discussion and Analysis of Financial Condition and Results of Operations—Non-GAAP Financial Measures (Adjusted EBITDA)” in this prospectus.
| Revenue for Fiscal 20193 |
Adjusted EBITDA for Fiscal 20194 | |
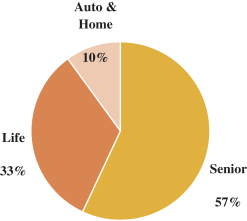
|
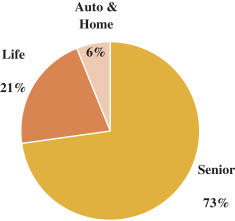
| |
Our Insurance Carrier Partners
We maintain longstanding, deeply integrated relationships with over 50 of the nation’s leading insurance carriers, who have some of the industry’s most widely recognizable brands, including approximately 15 insurance carrier partners in each of our Senior and Life segments and approximately 20 insurance carrier partners in our Auto & Home segment. For fiscal 2019 and for the nine month period ended March 31, 2020, our primary insurance carrier partners in our Senior segment were carriers owned by Humana, UnitedHealthcare and Aetna, the primary insurance carrier partners in our Life segment were Pacific Life and carriers owned by Prudential and the primary insurance carrier partners in our Auto & Home segment were Travelers, Safeco and Allied/Nationwide. These high-quality relationships have resulted in strong insurance carrier retention rates and the fact that we have never been dropped by an insurance carrier partner. We believe carriers see our method of acquiring customers as scalable and efficient and, ultimately, as cost advantageous compared to their own models, and provide us, in some cases, with marketing development funds as additional compensation to deliver policies. Marketing development funds are similar to production bonuses in that they are based on attaining
| 3 | Excludes Corporate & Eliminations. |
| 4 | Excludes Corporate & Eliminations. |
-101-
Table of Contents
various predetermined target sales levels or other agreed upon objectives for individual insurance carrier partners. Our insurance carrier partners are responsible for paying our commissions and, for these purposes, act as our customers. We do not currently generate revenues directly from the consumers to whom we sell insurance policies on behalf of our insurance carrier partners.
A core element of our value proposition to our insurance carrier partners relates to our ability to reliably place policies in compliance with applicable regulations and carrier-specific requirements. As such, we work closely with our insurance carrier partners to develop approved scripts and to undertake regular audits of our compliance with carrier requirements. In addition, our agents operate under compensation structures established to fully align their incentives to our compliance objectives.
Separate from SelectQuote’s comparison shopping platform, we have established several carrier-specific sales platform arrangements with several of our insurance carrier partners, which we call pods. These arrangements give us access to various marketing assets from our insurance carrier partners, such as use of the insurance carrier’s brand, which allows us to target customers for specific insurance carrier partners to give us access to incremental sales volume. Consumers directed to a pod agent come from either leads that are not branded as SelectQuote or come directly from an insurance carrier-affiliated channel. Our software assigns a propensity score to unbranded leads, potentially assigning those with a high propensity to purchase from a specific carrier to that carrier’s pod. The number of insurance carrier partners with which we have pod relationships can vary quarter to quarter depending on the insurance carrier partner and the business line.
Our Market Opportunity
We estimate that the total addressable market for the insurance products we distribute is greater than $180 billion. Further, while these markets are already substantial, they are also growing, in part due to a number of highly attractive demographic trends. We base our market opportunity estimates on third-party demographic data, our historical policy revenue experience and customer retention expectations. According to the Kaiser Family Foundation, there are approximately 67.7 million Medicare beneficiaries in 2020. We believe this addressable market, which is the core focus of the products we distribute, presents an annual commission revenue opportunity of approximately $30 billion for our Senior segment. The products marketed by our Life and Auto & Home segments also address large markets that present annual commission revenue opportunities of approximately $105 billion and $47 billion, respectively, which present us with additional opportunities for growth. In each of our three segments, we estimate our market share to be less than 1% and we believe we can benefit from greater market penetration in addition to underlying market growth.
Senior Market
Demand for senior insurance products in the U.S. is underpinned by powerful demographic trends. The number of people reaching retirement each year took a step-change in 2011 as the first wave of the post-war “Baby Boomer” generation turned 65. The proportion of the population that is age 65 or higher increased from 12.9% in 2010 to 15.2% in 2016 and is expected to reach 16.9% by 2020, according to the United States Census Bureau. On average, 10,000 “Baby Boomers” are expected to turn 65 every day or nearly 4 million per year, for the next 10 years. As a result, Medicare enrollment is growing steadily, with the number of Medicare enrollees expected to grow from 59.9 million in 2018 (up from 45.5 million in 2008 and 52.5 million in 2013), to approximately 68.4 million in 2023 then rising to 76.7 million by 2028, according to CSG Actuarial. Not only is the population of people age 65 and higher growing, but according to Pew Research Center, internet usage within this group has also risen, with 73% using the internet in 2019 compared to 40% in 2009. This group is also transacting more online, with 55% of people age 65 and higher making online purchases monthly according to SheerID, and accessing online health resources, with 68% doing so according to the Journal of Medical Internet Research.
-102-
Table of Contents
Within the growing Medicare market, Medicare Advantage plans are gaining prominence, as these private market solutions displace the traditional, government Medicare program. CSG Actuarial estimated that, at the end of 2019, there were approximately 23 million Medicare Advantage enrollees, representing approximately 38% penetration of the Medicare market. According to LEK Consulting, by 2025, the number of Medicare Advantage enrollees is expected to swell to approximately 38 million, representing a 50% penetration rate of the Medicare market. LEK Consulting projects that Medicare Advantage products will reach 60% to 70% penetration between 2030 and 2040, highlighting the pace with which this already large segment of the Medicare market is growing. The chart below illustrates the historical and projected increase in Medicare Advantage and Medicare Supplement enrollment compared to total Medicare enrollment, according to CSG Actuarial.
The degree to which we will realize a corresponding increase in revenue will be determined by our ability to continue to successfully place new Medicare policies for this enlarged potential consumer base. Despite our scale, we account for only a fraction of the total market for Medicare Advantage and Medicare Supplement plans, with only 0.3 million of the 35.7 million total enrollment for such plans in 2018, providing ample opportunity for growth. From 2017 to 2018, our Medicare Supplement and Medicare Advantage active policy count grew 37.5%, or 15.6 times the 2.4% growth in total Medicare enrollment over the same time frame, according to CSG Actuarial. Accordingly, we can benefit not only from broad growth in Medicare and the increasing penetration of Medicare Advantage plans, but we can also achieve growth through market share gains in the distribution of Medicare Advantage and Medicare Supplement products. We can also grow through our offering of ancillary and non-insurance products targeting the senior market.
Life Market
DTC sales of life insurance are becoming more prevalent as an increasing proportion of consumers are conducting self-directed online research prior to buying policies. Due to the typically more complex and longer- term nature of life insurance products, we expect agent expertise and consultation to continue as a prominent aspect of the sales process prior to ultimate purchase. Our dedicated, high-touch agents coupled with our user-friendly online platform caters to these evolving consumer preferences, which we believe favorably positions us to capture an increasing share of the overall market. Our approach to consumer engagement provides transparency and, we believe, an overall better experience that generates higher conversion rates than achievable by other forms of distribution, creating a cost advantage for our distribution platform relative to others.
Auto & Home Market
Property & Casualty insurance is a large addressable market in which policyholders often have a government or lender-mandated need for coverage. The DTC channel for sales of these products is well established and growing, driven by continued adoption of online sources for research and quotes. We believe the combination of our technology and agents is an important differentiator that better enables us to help potential
-103-
Table of Contents
policyholders compare and choose between multiple products, and also to give valuable advice on bundled options that provide more holistic coverage across multiple risks. We differentiate ourselves from carrier captive agents and traditional insurance distributors on the basis of choice, convenience and consumer experience.
Our Competitive Strengths
Leading technology-based sales platform. Our primary focus is to provide best-in-class service to bring policyholders value through greater choice and transparency. Since 1985, we have helped over 2 million policyholders save time and money on critical insurance purchases. Since our founding in 1985, we have been pioneers of insurance distribution and, through our technology-driven sales model, we believe we are well placed to support policyholders and insurance carrier partners as consumers continue shifting towards online channels to make purchasing decisions for their insurance needs. We believe that our data and our technology are key competitive advantages and drivers of our business performance. We continue to upgrade and optimize our technology as new opportunities are identified by our Information Technology and Analytics teams. SelectCare is our core overarching proprietary CRM and parent system with phone bank, sales enablement / workflow optimization and reporting tools. SelectCare is a bespoke system that uses various algorithms to score leads, route them to agents and organize each agent’s work day, with the objective of maximizing return on investment. Operating within SelectCare are the following purpose-built systems:
| • | SelectBid: Advanced, data-enriched lead scoring and purchasing tool that provides real-time feedback to help us determine which consumers and campaigns are generating the most valuable opportunities, allowing us to optimize marketing spend. |
| • | Get A Lead: Bespoke, purpose-built lead routing and workflow management technology based on lead quality, agent performance and agent availability. GAL uses a targeted approach to rapidly assign consumers to a licensed agent. |
| • | Automated Rate Calculator / Automated Quote Engine: Real-time quoting and underwriting applications integrated directly into carrier systems. ARC and AQE allow us to build quotes for potential customers in real time based on specific carrier underwriting requirements and risk tolerances. |
| • | SelectQuote Revenue Tracking System: Fully integrated, proprietary revenue tracking and financial reporting tool that also supports financial and customer falloff / retention prediction algorithms, allowing for real-time workflow and actions with our customer service teams. |
We currently utilize data science across all of our key business functions and systems, and our sophisticated algorithms benefit from years of data accumulation and analysis, which are continuously enriched with new data and refined by our in-house data science team. Our algorithms are informed by data accumulated through our operating history, which includes approximately 32 million leads and over 1 billion data points in our database. Our focus on data quality ensures our data scientists can draw deep insights as accurately and efficiently as possible. Our complex regression and machine learning models drive marketing spend and lead purchasing, scoring and routing, sales execution and post-sale customer engagement, all to further our goal of maximizing policyholder lifetime value. As we continue to grow, we will naturally acquire more data that will continue to better inform our decision making.
Highly scalable platform with growing network effects. Our structured recruiting, training and agent onboarding program provides flexibility to ramp up agent hiring activity to drive sales volumes. Through significant recent investments we have made to our technological, infrastructure and reporting capabilities, our platform is designed to provide us with ample support for future years of growth with minimal ongoing working capital requirements. We have built our systems to be highly adaptable, providing us with flexibility to seamlessly provide product extensions and enter into other product verticals. We continually evaluate our insurance carrier partnerships, and we have the ability to accommodate new insurance carrier relationships and new products that may further drive growth. As we expand, we expect our appeal to consumers as a one-stop shop and our appeal to carriers as a leading platform with large consumer audiences to continue to grow. These
-104-
Table of Contents
network effects will allow us to accumulate more data and insights, which serve to strengthen our algorithms and the value of our connections, thus accelerating our “Fly Wheel.”
Strong brand awareness. We were founded over 30 years ago as what we believe was the first DTC term life insurance exchange platform in the U.S. Over this time, we have built a highly successful and recognizable household brand. We continue to enhance our visibility with advertisements on nationwide TV networks (including CNN, Fox News and ESPN) and radio outlets, while also maintaining a strong online presence through our market-leading comparison websites, complemented by search engine advertising and a social media presence (Facebook, YouTube, etc.). There is also meaningful potential for us to leverage our strong brand awareness for intragroup cross sales and expansion into adjacent products and markets that further enhance revenue.
Ability to attract and retain productive, career-based agent force. We believe that a technology-enabled agent-based distribution model generates superior return on investment and policyholder lifetime value relative to solely web-based or traditional distribution models. As a result, we have built processes that allow us to attract, train and retain top talent, and to grow our agent force. Our sophisticated recruitment engine is employed across our six major city center locations and nationally with our remote agent capability and involves personality tests, multiple interviews and final approval by a senior manager. Seasonally, we utilize flex agents in our Senior segment for AEP and OEP to capitalize on the heightened activity during these windows. The use of flex agents allows us to identify top performing agents who will ultimately be transitioned to core agents or other roles at the Company following OEP. The fact that we offer our flex agents multiple career paths gives us a strategic advantage in recruiting highly talented individuals. Many of our top producing core agents previously served as flex agents. These recruiting and development processes lead to agent productivity rates that we believe are materially above the industry norm, allowing us to offer competitive compensation packages and attractive career paths, which in turn drives tenured core agent retention levels of over 93% among our most productive agents. This results in a virtuous cycle, that we believe gives SelectQuote a sustainable competitive advantage in the recruitment of new agents.
Diverse product offering. At our inception, we specialized in the distribution of term life insurance products. Since then, in addition to introducing a range of other life insurance products, SelectQuote expanded into the fast growing senior health insurance market (in 2010) and auto & home insurance market (in 2011). Our three product segments are a natural fit with consumer insurance and healthcare needs across different life stages. We believe we are unique among insurance distributors for our diverse product range, which provides us with greater stability as demand for certain products fluctuates over the calendar year, and over longer periods of time. Today we provide consumers with access to over 20 products, sourced from over 50 carriers.
Deep and broad insurance carrier partnerships. We are a key distribution partner for over 50 of the largest and most respected blue-chip insurance carriers. Our strong and long-standing relationships with many of our insurance carrier partners, some of which have been on our platform since our inception, represent a mutual commitment which we believe is difficult to replicate. While we are focused on providing consumers with greater choice, we also strive to be a meaningful component of our insurance carrier partners’ distribution strategy, and are therefore selective when it comes to which carriers we accept on to our platform. Our national presence, scale, broad consumer reach and our sales capability make us a partner of choice and a critical distribution channel for these carriers. We are a leading DTC insurance distributor for a number of insurance carrier partners, which helps us negotiate for attractive economics from our insurance carrier partners. In fiscal 2019, we sold more than 160,000 Senior policies for our Senior insurance carrier partners and produced more than $145.0 million in new premium for our Life and Auto & Home insurance carrier partners. In the nine month period ended March 31, 2020, we sold approximately 235,000 Senior policies for our Senior insurance carrier partners and produced more than $123.0 million in new premium for our Life and Auto & Home insurance carrier partners. Furthermore, our proprietary technology and tech-enabled agent model is focused on maximizing policyholder lifetime value, meaning that our insurance carrier partners enjoy higher quality business from each transaction sourced through us. Our insurance carrier partners also rely on our strong internal
-105-
Table of Contents
compliance function, which records all of our calls and audits a subset of them with our Quality Assurance team to ensure that we are complying with CMS rules and regulation, telemarketing regulations, carrier internal requirements and that the agents are meeting certain quality metrics that we deem important. Our compliance record and efficiency have led insurance carriers to partner with us on another key value proposition—our insurance carrier dedicated agent pods. These pods deepen our relationship with these insurance carrier partners and enable us to sell more policies. Pod marketing is specific to each individual pod and is separate from SelectQuote’s comparison shopping platform. This ensures a SelectQuote lead always gets presented with the comparison shopping platform.
Data driven approach to maximization of policyholder lifetime value. We use advanced algorithms informed by over 1 billion consumer data points to enrich our consumer engagement strategy. Our algorithms help agents identify opportunities for cross-sell, such as offering complementary plans at the point of sale. After a sale is made, our algorithms effectively identify customers likely to purchase additional products, thereby improving the likelihood that a policyholder retains his or her policy and generating highly predictable future income. As of March 31, 2020, our dedicated CCA team, which we launched four years ago, was comprised of 127 professionals who aim to improve the consumer experience during the post-sale carrier onboarding process, drive improved retention in the out years and improve cross selling opportunities. A number of the CCA team members are former licensed agents already familiar with the business and the consumer journey. This function allows our core agent force to allocate time towards new business generation. The CCA team leverages our systems to identify opportunities for consumers to purchase additional products and for us to implement tailored retention strategies. Part of the team’s function also involves a data-driven targeted outreach program to Medicare Advantage clients ahead of AEP to gauge potential interest in insurance shopping plans during the upcoming season. In order to make sure that we are making decisions with the best data possible, we partner with leading external industry consultants to review and validate our historical retention experience and projected performance. Our consistent track record of delivering strong customer retention rates creates additional value for our insurance carrier partners, solidifying SelectQuote’s position as a key partner with insurance carriers, which produces a positive reinforcement loop across our business. Our database is the result of more than 30 years of dedicated focus and investment, providing us with unparalleled insights that are difficult for competitors to replicate.
Attractive financial profile. As a distributor of insurance products, we benefit from favorable industry trends. We earn commission revenue on the successful sale and renewal of polices we distribute and, accordingly, our financial model does not reflect the inherent uncertainties associated with underwriting insurance risk. We have a high degree of visibility into the commission we earn at the time of sale, as well as the renewal commissions we would earn should a policyholder renew his or her policy. Our CCA team’s efforts enhance the policyholder experience and thereby improve policyholder retention and our opportunity to generate renewal commissions. Because our agents do not receive a share of renewal commissions, each dollar of renewal revenue directly adds to our income from operations, thereby improving our margins. Our platform is highly scalable, which enables margin expansion as we grow.
Strong company culture developed by an experienced management team. We maintain a unique sales and consumer service-oriented culture. We are a diverse group of women and men who are united in our mission to provide solutions that help consumers with their overall financial well-being and protect their most valued assets. Through our recruiting processes, we are able to identify people who enjoy being a part of, and are motivated by, a performance-based, meritocratic organization. This allows us to assemble a world-class team of people who envision building their careers at SelectQuote. Our company culture is promoted by a highly experienced management team with deep industry experience and a track record of industry innovation. The key members of our management team have over 60 total years of industry experience and several members of our management team have worked together to build our business over the last eight years.
-106-
Table of Contents
Our Growth Strategy
Maximize policyholder lifetime value. Policyholder lifetime value represents commissions estimated to be collected over the life of an approved policy less the cost of acquiring the business and is a key component of our overall profitability. Our goal is to maximize policyholder lifetime value, and we do so through strategies designed to maximize the revenue opportunity and minimize our customer acquisition cost. Maximizing policyholder lifetime value involves continued investment in:
| • | Our agent experience and customer care team, which together enhance our close rates, commissionable premium, and our ability to earn renewal and cross-sell revenue; |
| • | Carrier relationships, and in particular, negotiation of more favorable terms; |
| • | Pre-AEP outreach to our Senior segment policyholders to better understand emerging trends in consumer decision making; |
| • | Technology, data and analytics to optimize our marketing and lead acquisition spend; and |
| • | Our pod offerings, which offer an opportunity to earn economics on a more favorable basis than our broader comparison shopping platform. |
Increase the size and enhance the productivity of our agent force. Agents and their productivity are a key element of our ability to distribute policies and earn commission revenue. We intend to continue to invest in our agent force, widening our recruiting funnel through our new remote agent program as well as selectively expanding our physical offices and growing our agent ranks. We intend to continue to invest in training, technology and widening our product offering, all of which enable our agents to be more productive. In doing so, we believe we will be able to offer more rewarding career opportunities for our agents, which should further enhance our ability to grow our agent force.
Deepen consumer penetration and drive cross-selling opportunities. We are highly focused on the consumer experience and believe that customer satisfaction is a key driver to maximizing cross-sell opportunities and repeat business. We believe there are natural synergies across our portfolio of products, and we are focused on increasing cross-sell across our existing customer base. Our success cross-selling ancillary products (e.g., dental, vision and hearing, prescription drug plans and fixed indemnity) to our clients is improving and we continue to look at ways to broaden our cross-selling opportunities. Within our Auto & Home business, we have been successful in bundling products (selling multiple products to the same customer). For fiscal 2019 and the nine month period ended March 31, 2020, our agents sold policies to over 30,000 and 26,000 customers, respectively, with bundle rates of 47% and 50%, respectively, which we believe are significantly higher than industry averages. A large and relatively untapped opportunity is to deepen cross-sell of products to customers across our three segments, and we are currently employing technology and data designed to enable us to better track the customer life journey to allow us to identify and better execute on this opportunity.
Deepen and broaden our insurance carrier partnerships. We are selective with the carriers that we choose to do business with and seek to maintain a balance between offering consumers choice, while sustaining a meaningful relationship with carriers to ensure we are able to get the best terms for consumers. We continuously evaluate our insurance carrier partner panel and have the ability to quickly accommodate new insurance carrier relationships and new products from existing carriers. Our focus on offering high-quality products has resulted in strong retention rates, increasing the value of our distribution model to insurance carrier partners.
Introduce new products. We have an attractive and scalable platform with strong policyholder acquisition capabilities, backed by flexible systems that can be leveraged to introduce new product offerings to consumers. We also have established relationships with major carriers that are familiar with our business model, providing a natural advantage for sourcing new product opportunities. We currently offer over 20 products on behalf of our insurance carrier partners to consumers and continuously evaluate new product opportunities, including simplified annuities, retirement solutions and other financial services products.
-107-
Table of Contents
Competition
The market for distribution of insurance products is highly competitive, fragmented and evolving as consumers increasingly transact online. Products are distributed through a variety of channels that we must compete against, including captive agents employed by carriers, independent agents working individually or in groups small and large, through online platforms that employ agents or outsource sales to independent agents, or other online platforms that distribute directly to the consumer.
Our primary competitors are insurance companies who sell products directly, either online or through captive agent forces, instead of paying commissions to third-party agents and brokers. We, along with a number of independent agents (working individually or in groups small or large) and online distribution platforms acting as distributors for third-party insurance products, compete for business from these direct distributors.
We also compete with eHealth, Inc. and other online distribution platforms acting as distributors for third-party insurance products for commission opportunities. We aim to differentiate our products and services on the basis of our agents’ ability, leveraging our technology platform, to match our consumers with insurance products we expect best match their needs.
Employees
As of March 31, 2020, we had approximately 1,800 full-time equivalent employees, which includes 922 core agents and 73 flex agents. During AEP, we typically hire additional full time employees. During the 2020 AEP, we hired approximately 1,400 additional employees. None of our employees are represented by any collective bargaining unit or is a party to a collective bargaining agreement.
Regulation
The sale of insurance products is a heavily regulated industry. Various aspects of our business are, may become, or may be viewed by regulators from time to time as subject, directly or indirectly, to U.S. federal, state and foreign laws and regulations. We are affected by laws and regulations that apply to businesses in general and the insurance industry, as well as to businesses operating on the internet. This includes a continually expanding and evolving range of laws, regulations and standards that address financial services, information security, data protection, privacy and data collection, among other things. We are also subject to laws governing marketing and advertising activities conducted by telephone, email, mobile devices and the internet. In addition, we are a licensed insurance producer in all 50 U.S. states and the District of Columbia. Insurance is highly regulated by the states in which we do business, and we are required to comply with and maintain various licenses and approvals. Regulatory authorities often have the discretion to grant, renew and revoke the various licenses and approvals we need to conduct our activities and, should we fail to retain our licenses, our business and results of operations could be adversely affected.
New York’s cybersecurity regulation for financial services companies require entities under the jurisdiction of NYDFS, including insurance entities, to establish and maintain a cybersecurity program designed to protect private consumer data. The Cybersecurity Model Law adopted by the NAIC is functionally similar to the NYDFS rule and is intended to establish the standards for data security and for the investigation and notification of data breaches applicable to insurance licensees in states adopting the law.
There are numerous federal and state laws and regulations related to the privacy and security of health information. In particular, regulations promulgated pursuant to the Health Insurance Portability and Accountability Act of 1996, as amended by the Health Information Technology for Economic and Clinical Health Act (“HIPAA”), establish privacy, security and breach reporting standards that, among other things, limit the use and disclosure of certain individually identifiable health information and require the implementation of administrative, physical and technological safeguards to protect such information. As a provider of services to
-108-
Table of Contents
entities subject to HIPAA, we are directly subject to certain provisions of the regulations as a “Business Associate.” When acting as a Business Associate under HIPAA, to the extent permitted by applicable privacy regulations and contracts with customers, we are permitted to use and disclose protected health information to provide our services and for other limited purposes, but other uses and disclosures such as marketing communications, require written authorization from the patient or must meet an exception specified under the privacy regulations. If we were to be found to have breached our obligations under HIPAA, we could be subject to enforcement actions by the U.S. Department of Health and Human Services and state health regulators and lawsuits, including class action law suits, by private plaintiffs.
In particular, our Senior segment is subject to a complex legal and regulatory framework and the laws and regulations governing the marketing and sale of Medicare plans. The regulations and guidance issued by CMS for Medicare Advantage and Medicare Part D prescription drug plans, change frequently and changes to laws, regulations, CMS guidance or the enforcement or interpretation of CMS guidance applicable to our Senior segment could cause healthcare providers or state departments of insurance to object to or not to approve aspects of our marketing materials and processes.
In addition, the United States regulates marketing by telephone and email and the laws and regulations governing the use of emails and telephone calls for marketing purposes continue to evolve, and changes in technology, the marketplace or consumer preferences may lead to the adoption of additional laws or regulations or changes in interpretation of existing laws or regulations. The Telephone Consumer Protection Act prohibits companies from making telemarketing calls to numbers listed in the Federal Do-Not-Call Registry and imposes other obligations and limitations on making phone calls and sending text messages to consumers. The CAN-SPAM Act regulates commercial email messages and specifies penalties for the transmission of commercial email messages that do not comply with certain requirements, such as providing an opt-out mechanism for stopping future emails from senders. We may be required to comply with these and similar laws, rules and regulations.
See “Risk Factors—Risks Related to Laws and Regulation” for additional information.
Intellectual Property
We rely on a combination of copyright, trademark, and trade secret laws and contractual agreements to establish, maintain and protect our intellectual property rights and technology. We enter into confidentiality and invention assignment agreements with our employees and enter into confidentiality agreements with third parties, including suppliers and other partners. We monitor our intellectual property regularly with the goal of ensuring all applicable registrations are maintained.
Facilities
Our principal executive offices are located in Overland Park, Kansas. In addition to our Kansas office, we operate from five other offices located in San Francisco, California; San Diego, California; Denver, Colorado; Jacksonville, Florida; and Des Moines, Iowa. We lease each of our offices.
Legal Proceedings
From time to time we are a party to various litigation matters incidental to the conduct of our business. We are not presently party to any legal proceedings the resolution of which we believe would have a material adverse effect on our business, prospects, financial condition, liquidity, results of operation, cash flows or capital levels.
-109-
Table of Contents
Executive Officers Upon Completion of the Offering
The following table sets forth information as of May 15, 2020 regarding individuals who are expected to serve as our executive officers following the completion of this offering:
| Name |
Age | Position | ||||
| Tim Danker |
47 | Chief Executive Officer | ||||
| Raffaele Sadun |
44 | Chief Financial Officer | ||||
| William Grant III |
45 | Chief Operating Officer | ||||
| Robert Grant |
35 | President, Senior Segment | ||||
| Matthew Gunter |
46 | President, Auto & Home Segment | ||||
| Paul Gregory |
37 | Executive Vice President, Life Segment | ||||
| Al Boulware |
44 | General Counsel and Secretary | ||||
| Floyd May III |
44 | Chief Information Officer | ||||
Timothy “Tim” Danker, 47, has served as the Chief Executive Officer of the Company since 2017. Mr. Danker served as the President of the Company’s Life segment from 2016 to 2019, as the Executive Vice President of the Company’s Life segment from 2015 to 2016 and as the President of the Company’s Auto & Home segment from 2012 to 2015. Prior to joining the Company, Mr. Danker co-founded and served as the Chief Executive Officer of Spring Venture Group, a senior healthcare insurance distribution platform, from 2007 to 2012. Mr. Danker received his undergraduate degree in business administration from the University of Missouri and his Master of Business Administration from the University of Kansas.
Raffaele Sadun, 44, has served as the Chief Financial Officer of the Company since 2017. Mr. Sadun previously served as the Chief Financial Officer of The Mutual Fund Store from 2014 to 2016 until its sale to Financial Engines, one of the largest independent registered investment advisors in the United States, where he served as Senior Vice President of Finance from 2016 to 2017. Prior to that, Mr. Sadun served as the Chief Financial Officer of Adknowledge, one of the largest digital advertising companies in the United States, from 2012 to 2014 and as the Chief Financial Officer of SeaWorld Parks & Entertainment from 2010 to 2011. Mr. Sadun is an honors graduate in Management of The London School of Economics.
William Grant III, 45, has served as the Chief Operating Officer of the Company since 2019. Mr. Grant previously served as the President of the Company’s Senior segment and as Chief Marketing Officer of the Company from 2017 to 2019. Prior to that, Mr. Grant served as the Senior Vice President of Marketing for the Company’s Senior segment from 2012 to 2017. Mr. Grant received his undergraduate degree from the University of Kansas. Mr. Grant is the son of William Grant II, the Vice Chairman of the Company’s Board of Directors, and the brother of Robert Grant, the President of the Company’s Senior segment.
Robert Grant, 35, has served as the President of the Company’s Senior segment since 2019. Mr. Grant previously served as the Company’s Chief Revenue Officer from 2017 to 2019. Prior to that, Mr. Grant served as the Senior Vice President of Sales for the Company’s Life segment from 2016 to 2017 and as the Director of Sales and Operations for the Company’s Senior segment from 2013 to 2016. Mr. Grant received his undergraduate degree from the University of Kansas. Mr. Grant is the son of William Grant II, the Vice Chairman of the Company’s Board of Directors, and the brother of William Grant III, the Company’s Chief Operating Officer.
Matthew Gunter, 46, has served as the President of the Company’s Auto & Home segment since 2016. Mr. Gunter previously served as the Vice President of National Retail Channels for Sprint Corporation from 2013 to 2016 and in a variety of leadership roles within the Finance and Marketing organizations at Sprint Corporation from 2003 to 2013. Prior to joining Sprint, Mr. Gunter worked as a business consultant for Bain & Company and for Arthur Andersen. Mr. Gunter earned his Bachelor of Business Administration from the University of Notre Dame and his Master of Business Administration from the Kellogg School of Management at Northwestern University.
-110-
Table of Contents
Paul Gregory, 37, has served as the Executive Vice President of the Company’s Life segment since 2019. Mr. Gregory previously served as the Company’s Senior Vice President of IT, Data Science and Recruiting in 2019 and as the Company’s Senior Vice President of IT and Data Science from 2016 to 2019. Prior to that, Mr. Gregory served as the Vice President of Sales and Operations for the Company’s Senior segment in 2016 and as the Chief Revenue Officer of Corvisa, a provider of cloud-based communications solutions, from 2012 to 2016. Mr. Gregory serves on the board of directors of System Target, a private consulting company. Mr. Gregory earned his undergraduate degree and Master of Business Administration from the University of Kansas.
Daniel “Al” Boulware, 44, has served as the Company’s General Counsel and Secretary since 2019. Mr. Boulware previously served as the Vice President and General Counsel for SS&C Health, the healthcare segment of SS&C Technologies Holdings, Inc., a public company that provides technology to the financial services industry as well as pharmacy benefit management, medical claims processing, data analytics, and associated technology to the healthcare industry. Prior to that, Mr. Boulware served as a Shareholder of Polsinelli, P.C. from 2012 to 2013 and as an associate of that law firm from 2002 to 2012. Mr. Boulware earned his undergraduate degree, Juris Doctor degree and Master of Business Administration from the University of Kansas.
Floyd May III, 44, has served as the Company’s Chief Information Officer since 2019. Mr. May previously served as the Director of Operations for the United States Office of Public and Indian Housing from 2018 to 2019. Prior to that, Mr. May served as a Business Program Manager for the United States Department of Housing and Urban Development (“HUD”) from 2013 to 2018 and in a variety of other operational leadership roles at HUD from 2006 to 2013. Mr. May earned his undergraduate degree in Business Administration from the Howard University School of Business, from which he graduated with honors.
Board of Directors Upon Completion of the Offering
Upon completion of this offering, we expect that our Board of Directors will consist of seven members. The following table sets forth information as of May 15, 2020 regarding individuals who are expected to serve as members of our Board of Directors upon completion of this offering.
| Name |
Age | Position |
Committee Memberships | |||||
| Donald Hawks III |
45 | Chairman and Director | Compensation, Nominating and Corporate Governance | |||||
| William Grant II |
69 | Vice Chairman and Director | — | |||||
| Donald Britton |
71 | Director | Compensation | |||||
| Tim Danker |
47 | Director and Chief Executive Officer | — | |||||
| Earl Devanny III |
68 | Director | Audit, Nominating and Corporate Governance | |||||
| Denise Devine |
64 | Director | Audit, Compensation, Nominating and Corporate Governance | |||||
| Raymond Weldon |
61 | Director | Audit | |||||
Donald Hawks III, 45, has served as a director of the Company since 2014 and was appointed to serve as the Chairman of the Board in February 2020. He has served as a Managing Director and the President of Brookside Equity Partners LLC since its formation in 2012. He is a director of multiple private companies, including BEP AUL Holdings LLC, Cash Management Solutions Limited, Hillsdale Furniture Holdings LLC and Ultra Aluminum Manufacturing Inc. He serves on the Investment Committee of the Rockefeller Family Fund and is a Board Member of the Fresh Air Fund. Mr. Hawks received his undergraduate degree from Georgetown University and his Masters in Business Administration from The Wharton School at the University of Pennsylvania. Mr. Hawks’ extensive experience in business and investing in and advising companies qualifies
-111-
Table of Contents
him to serve on our Board of Directors. Mr. Hawks was appointed to the Board in 2014 in connection with the Company’s entry into the original Series D Preferred Stock Investors’ Rights and Stockholders Agreement and was appointed to serve upon the completion of this offering as a Class III director pursuant to the Amended and Restated Series D Preferred Stock Investors’ Rights and Stockholders Agreement, dated November 4, 2019, by and between the Company and certain affiliates of Brookside Equity Partners LLC and The Ampex Retirement Master Trust (the “Series D Holders”) (the “Amended and Restated Series D Preferred Stock Investors’ Rights and Stockholders Agreement”).
William Grant II, 69, has served as a director of the Company since 2010 and as the Vice Chairman of the Board since 2017. Mr. Grant previously served as the Company’s President from 2015 to 2017, as the Senior Vice President of Health and Risk Management at Quest Diagnostics Incorporated from 2005 to 2007 and as the Chairman, President and Chief Executive Officer of LabOne, Inc. from 1995 to 2005. Prior to that, Mr. Grant served as the Chairman of the Board and Chief Executive Officer from 1993 to 1995, and as the President and Chief Executive Officer from 1990 to 1993, of Seafield Capital Corporation. Mr. Grant also served as the President and Chief Executive Officer of Business Men’s Assurance Company of America from 1986 to 1990. Mr. Grant received his undergraduate degree from Kansas University and his Masters in Business Administration from The Wharton School at the University of Pennsylvania. Mr. Grant is the father of William Grant III, the Chief Operating Officer of the Company, and Robert Grant, the President of the Company’s Senior segment. Mr. Grant’s extensive experience in the healthcare industry and deep knowledge of our business qualifies him to serve on our Board of Directors.
Donald Britton, 71, has served as a director of the Company since 2014 and as the chair of the Board’s Compensation Committee since 2015. Mr. Britton previously served as the President and CEO of the United States Life Insurance and Employee Benefits Business of ING US from 2004 to 2013. After the IPO of ING US in 2013 (renamed Voya), he served in the same role until his retirement in 2014. Prior to that, Mr. Britton served as the President of the Life Division at American General Financial Group from 1999 to 2002, as the President and CEO of the Life and Annuity Business of First Colony Life from 1997 to 1999 and as the Executive Vice President of Marketing and Operations of First Colony Life from 1992 to 1997. Mr. Britton earned his undergraduate and graduate degrees in Mathematics from East Carolina University. Mr. Britton started his career as an actuary at Integon Life and is a Fellow of The Society of Actuaries (FSA). Mr. Britton serves on the Board of LifeMark Re, a private insurance marketing company’s wholly owned reinsurance company, which he helped found in 2018. Mr. Britton’s extensive experience in the insurance industry qualifies him to serve on our Board of Directors.
Earl Devanny III, 68, was appointed to serve as a director of the Company in February 2020. Mr. Devanny has served as the Chief Executive Officer of Tract Manager, a provider of healthcare strategic sourcing and compliance application suites, since 2016. Mr. Devanny previously served as the President of Nuance Communications’ healthcare business, a provider of voice and language solutions for businesses and consumers, from 2014 to 2016. Prior to that, Mr. Devanny served as the Chairman and Chief Executive Officer of Trizetto Corporation, a healthcare information technology provider, from 2010 to 2013. Prior to that, Mr. Devanny served as the President of Cerner Corporation, a supplier of health information technology solutions, services, devices and hardware, from 1999 to 2010. Mr. Devanny has served as a director of Commerce Bancshares, Inc. (NASDAQ: CBSH), the publicly traded bank holding company for Commerce Bank since 2010 and he also currently serves as a director of Next Health Technologies and McNeil Trusts, both private companies. Mr. Devanny received his undergraduate degree from the University of the South (Sewanee). Mr. Devanny’s extensive experience in the healthcare technology industry qualifies him to serve on our Board of Directors.
Denise Devine, 64, was appointed to serve as a director of the Company in February 2020. Ms. Devine is the founder and since 2008 has served as the Chief Executive Officer of FNB Holdings, LLC, a company dedicated to initiatives in the health and wellness space, and is the founder and since 2014 has served as the Chief Financial Officer of RTM Vital Signs, LLC, an early stage medical device company. Ms. Devine also founded and served as the Chief Executive Officer from 1994 to 2006 of Nutripharm, Inc., a company that has generated a
-112-
Table of Contents
portfolio of composition and process patents to create innovative natural food, beverage, pharmaceutical and nutraceutical products. Ms. Devine, a Certified Public Accountant, also previously served as Chief Financial Officer for Energy Solutions International from 2006 to 2008. Ms. Devine has served as a member of the Board of Ben Franklin Technology Partners of Southeastern Pennsylvania since 2016 and was appointed to the Board of Ben Franklin Technology Development Authority in 2018. Ms. Devine has served as a director of Fulton Financial Corporation (NASDAQ: FULT) since 2012, AgroFresh Solutions, Inc. (NASDAQ: AGFS) since 2018 and Cubic Corporation (NYSE: CUB) since 2019. Ms. Devine received her Masters in Business Administration from The Wharton School at the University of Pennsylvania, her Masters in Taxation from Villanova Law School and her undergraduate degree in Accounting from Villanova University. Ms. Devine’s management, business and finance experience qualifies her to serve on our Board of Directors.
Raymond Weldon, 61, has served as a director of the Company since 2014 and served as the Chairman of the Audit Committee from 2016 to 2019. He is a co-founder of Brookside Equity Partners LLC and has served as one of its Managing Directors since its formation in 2012. Mr. Weldon has been employed by Hillside Capital Incorporated, a private investment company and an affiliate of Brookside Equity Partners LLC, since 1999 and currently serves as one of its Managing Directors. Mr. Weldon is a Certified Public Accountant (inactive) and is a director of several private companies, including TJ Acquisition LLC and Hillsdale Furniture LLC. Mr. Weldon received his undergraduate degree from the Honors Program of LaSalle University and his Masters in Taxation from Villanova University. Mr. Weldon’s extensive experience in business and investing in and advising companies qualifies him to serve on our Board of Directors. Mr. Weldon was appointed to the Board in 2014 in connection with the Company’s entry into the original Series D Preferred Stock Investors’ Rights and Stockholders Agreement and was appointed to serve upon the completion of this offering as a Class II director pursuant to the Amended and Restated Series D Preferred Stock Investors’ Rights and Stockholders Agreement.
Election of Directors
At the completion of this offering, we expect that our Board of Directors will initially be divided into three classes, each of which is expected to be composed initially of two or three directors. The directors designated as Class I directors will have terms expiring at the first annual meeting of stockholders following the completion of this offering, which we expect to hold in 2020. The directors designated as Class II directors will have terms expiring at the following year’s annual meeting of stockholders, which we expect to hold in 2021, and the directors designated as Class III directors will have terms expiring at the following year’s annual meeting of stockholders, which we expect to hold in 2022. Commencing with the first annual meeting of stockholders following the completion of this offering, which we expect to hold in 2020, directors for each class will be elected at the annual meeting of stockholders held in the year in which the term for that class expires and thereafter will serve for a term of three years. At any meeting of stockholders for the election of directors at which a quorum is present, the election will be determined by a plurality of the votes cast by the stockholders entitled to vote in the election.
| • | Our Class I directors will initially be Donald Britton and Tim Danker. |
| • | Our Class II directors will initially be Raymond Weldon and Earl Devanny III. |
| • | Our Class III directors will initially be William Grant II, Donald Hawks III and Denise Devine. |
We expect our amended and restated bylaws will provide that the authorized number of directors may only be changed by a resolution adopted by a majority of our Board of Directors.
Director Independence
In February 2020, our Board of Directors undertook a review of the composition of our Board of Directors, the audit committee, the compensation committee and the independence of each director. Based upon information requested from and provided by each director concerning his or her background, employment and
-113-
Table of Contents
affiliations, including family relationships, our Board of Directors has determined that, with the exception of Messrs. Grant and Danker, each of our directors is “independent” as defined under the rules of the NYSE. Our Board of Directors also determined that Messrs. Weldon and Devanny and Ms. Devine, who comprise our Audit Committee, and that Messrs. Britton and Hawks and Ms. Devine, who comprise our Compensation Committee, satisfy the independence standards for those committees established by the Securities and Exchange Commission and the rules of the NYSE. In making such determinations, our Board of Directors considered the relationships that each such non-employee director has with our Company and all other facts and circumstances our Board of Directors deemed relevant in determining independence, including the beneficial ownership of our capital stock by each non-employee director and any institutional stockholder with which he or she is affiliated.
Board Committees
Our Board of Directors has established standing committees in connection with the discharge of its responsibilities. These committees include the Audit Committee, the Compensation Committee and the Nominating and Corporate Governance Committee. Our Board of Directors may also establish such other committees as it deems appropriate, in accordance with applicable law and our corporate governance documents. Following this offering, a copy of each committee’s charter will be posted on the corporate governance section of our website, www.selectquote.com. Information contained on our website is not incorporated by reference into this prospectus, and you should not consider information contained on our website to be part of this prospectus or in deciding whether to purchase shares of our common stock.
Audit Committee
The audit committee’s primary responsibilities will include:
| • | overseeing management’s establishment and maintenance of adequate systems of internal accounting and financial controls; |
| • | reviewing the effectiveness of our legal and regulatory compliance programs; |
| • | overseeing our financial reporting process, including the filing of financial reports; and |
| • | selecting independent auditors, evaluating their independence and performance and approving audit fees and services performed by them. |
The members of our Audit Committee are Messrs. Weldon and Devanny and Ms. Devine. Our Board of Directors has determined that Mr. Weldon and Ms. Devine are “audit committee financial experts” as defined by applicable SEC rules. Our Board of Directors has affirmatively determined that Ms. Devine’s simultaneous service on the audit committees of more than three public companies does not impair her ability to effectively serve on our Audit Committee.
Compensation Committee
The Compensation Committee’s responsibilities include:
| • | ensuring our executive compensation programs are appropriately competitive, supporting organizational objectives and stockholder interests and emphasizing pay for performance linkage; |
| • | evaluating and approving compensation and setting performance criteria for compensation programs for our chief executive officer and other executive officers; and |
| • | overseeing the implementation and administration of our compensation plans. |
The members of our Compensation Committee are Messrs. Britton and Hawks and Ms. Devine. None of our executive officers serves as a member of the board of directors or compensation committee, or other committee
-114-
Table of Contents
serving an equivalent function, of any entity that has one or more executive officers who serve as members of our Board of Directors or a committee of our Board of Directors.
Nominating and Corporate Governance Committee
The Nominating and Corporate Governance Committee’s responsibilities include:
| • | recommending nominees for our Board of Directors and its committees; |
| • | recommending the size and composition of our Board of Directors and its committees; |
| • | reviewing our corporate governance guidelines and proposed amendments to our certificate of incorporation and bylaws; and |
| • | reviewing and making recommendations to address stockholder proposals. |
The members of our Nominating and Corporate Governance Committee are Messrs. Hawks and Devanny and Ms. Devine.
Code of Business Conduct and Ethics
Prior to the completion of this offering, our Board of Directors intends to adopt a code of business conduct and ethics, or “Code of Ethics,” which will apply to all of our directors, officers and employees, including our principal executive officer, principal financial officer, principal accounting officer and persons performing similar functions. The Code of Ethics will be available upon written request to our Corporate Secretary or on our website at www.selectquote.com. If we amend or grant any waiver from a provision of our Code of Ethics that applies to any of our executive officers, we will publicly disclose such amendment or waiver on our website and as required by applicable law.
-115-
Table of Contents
The following is a discussion and analysis of compensation arrangements of our named executive officers. This discussion contains forward-looking statements that are based on our current plans, considerations, expectations and determinations regarding future compensation programs. Actual compensation programs that we adopt may differ materially from currently planned programs as summarized in this discussion. As an “emerging growth company” as defined in the JOBS Act, we are not required to include a Compensation Discussion and Analysis section and have elected to comply with the scaled back disclosure requirements applicable to emerging growth companies.
Impact of Stock Split
As noted above, on February 28, 2020, the Company effected an eight-for-one stock split. All references in the Executive Compensation section to numbers of shares of common stock, including in Outstanding Equity Awards at Fiscal 2019 Year-End and Director’s Compensation and the descriptions of the terms of the 2003 Stock Plan, 2020 Plan and ESPP, have been adjusted retroactively, where applicable, to reflect this stock split, by multiplying each such number by eight. Additionally, the exercise price of each outstanding stock option under the 2003 Stock Plan as of the date of the stock split has been equitably adjusted by dividing such pre-stock split exercise price by eight.
Overview
Our current executive compensation program is intended to align executive compensation with our business objectives and to enable us to attract, retain and reward executive officers who contribute to our long-term success. The compensation paid or awarded to our executive officers is generally based on an assessment of each individual’s performance compared against the business objectives established for the fiscal year as well as our historical compensation practices. For fiscal 2019, the material elements of our compensation program were base salary, annual cash bonuses and equity-based compensation in the form of stock options.
We expect that our executive compensation program will evolve to reflect our status as a newly publicly traded company, while still supporting our overall business and compensation objectives. Therefore, the compensation reported in the Fiscal 2019 Summary Compensation Table below is not necessarily indicative of how we will compensate our named executive officers in the future. We expect that we will continue to review, evaluate and modify our compensation framework and that the compensation program following this offering may vary significantly from our historical practices. In connection with this offering, the compensation committee of our Board has retained Semler Brossy, an independent compensation consultant, to assist the compensation committee in designing our post-offering executive compensation program. As part of this engagement, Semler Brossy is performing a market-based review of our executive compensation program.
This section provides a discussion of the compensation paid or awarded to our principal executive officer and our two other most highly compensated executive officers as of June 30, 2019. We refer to these individuals as our Named Executive Officers, or “NEOs.” For fiscal 2019, our NEOs were Tim Danker, our Chief Executive Officer and President of our Life segment, Raffaele Sadun, our Chief Financial Officer, and William Grant III, our Chief Operating Officer.
Compensation of Named Executive Officers
Base Salary
Base salaries are intended to provide a level of compensation sufficient to attract and retain an effective management team, when considered in combination with the other components of our executive compensation program. The relative levels of base salary for our NEOs are designed to reflect each NEO’s scope of
-116-
Table of Contents
responsibility and accountability with the Company. Please see the “Salary” column of the Fiscal 2019 Summary Compensation Table for the base salary amounts received by each NEO in fiscal 2019. In connection with the market-based review performed by Semler Brossy in connection with this offering, the base salary levels of our NEOs will be modified as of the completion of this offering, as described below.
Annual Cash Bonuses
Historically, we have provided our senior leadership team with short-term incentive compensation through our annual cash bonus plan. Annual bonus compensation holds executives accountable, rewards the executives based on actual business results and helps create a “pay for performance” culture. Our annual cash bonus program provides cash incentive award opportunities for the achievement of performance goals established by our Board of Directors at the beginning of each fiscal year. Please see the “Non-Equity Incentive Plan Compensation” column of the Fiscal 2019 Summary Compensation Table below for the actual cash bonuses and “—Fiscal 2019 Bonuses” for a description of the terms of the cash bonuses awarded to each NEO for fiscal 2019 performance. In connection with the market-based review performed by Semler Brossy in connection with this offering, the target annual bonus levels of our NEOs will be modified as of the completion of this offering, as described below.
Stock Options
To further align the interests of our executive officers with the interests of our stockholders and to further focus our executive officers on our long-term performance, we have historically granted equity compensation in the form of stock options. Stock options generally vest as to one-third after the vesting commencement date and as to 1/24 of the remaining shares subject to the stock option monthly thereafter, subject to the award recipient’s continued employment through the applicable vesting date. In fiscal 2019, no stock options were granted to the NEOs.
Fiscal 2019 Summary Compensation Table
The following table sets forth the total compensation awarded to or earned by or paid to our NEOs with respect to fiscal 2019.
| Name and Principal Position |
Fiscal Year |
Salary ($) |
Bonus ($) (1) |
Non-equity incentive plan compensation ($) (2) |
All other compensation ($) (3) |
Total ($) |
||||||||||||||||||
| Tim Danker |
||||||||||||||||||||||||
| Chief Executive Officer |
2019 | 305,000 | 256 | 126,767 | 9,023 | 441,046 | ||||||||||||||||||
| Raffaele Sadun |
||||||||||||||||||||||||
| Chief Financial Officer |
2019 | 300,000 | 128 | 124,688 | 8,950 | 433,766 | ||||||||||||||||||
| William Grant III |
||||||||||||||||||||||||
| Chief Operating Officer |
2019 | 250,000 | 256 | 103,907 | 7,500 | 361,663 | ||||||||||||||||||
| (1) | Represents amount paid pursuant to a Company-wide holiday bonus program, with bonus amount based solely on seniority. |
| (2) | Messrs. Danker, Sadun and Grant received annual bonuses pursuant to our Management Incentive Plan (the “MIP”), the terms of which are described below under “—Fiscal 2019 Bonuses.” Bonuses were subject to the achievement of earnings related goals and personal objectives. The bonus payments reflected performance under the MIP at the maximum level of achievement. |
| (3) | Represents Company contributions under the Company’s retirement plan. |
-117-
Table of Contents
Outstanding Equity Awards at Fiscal 2019 Year-End
The following table sets forth information regarding outstanding equity compensation awards held as of June 30, 2019 by our NEOs. The share numbers and exercise price reported in this table have been adjusted to reflect the impact of the stock split, as described above.
| Option Awards (1) | ||||||||||||||||||||
| Name |
Grant Date | Number of securities underlying unexercised options (#) exercisable |
Number of securities underlying unexercised options (#) unexercisable |
Option exercise price ($) |
Option expiration date |
|||||||||||||||
| Tim Danker (3) |
— | — | — | — | — | |||||||||||||||
| Raffaele Sadun |
5/16/2017 | 33,344 | 366,856 | (2) | $ | 1.38 | 5/16/2027 | |||||||||||||
| William Grant III (3) |
— | — | — | — | — | |||||||||||||||
| (1) | The option award listed in the table above was granted pursuant to the 2003 Stock Plan, the terms of which are described below under “—Equity Compensation.” |
| (2) | These options vested 33% on May 16, 2018 with the remaining 67% vesting in equal monthly installments over the next two years, subject to Mr. Sadun’s continued employment through the applicable vesting date. |
| (3) | Although neither Mr. Danker nor Mr. Grant currently hold, and as of June 30, 2019 did not hold, any outstanding equity awards, please refer to the beneficial ownership table included below under “Principal and Selling Stockholders” for the shares of common stock held by each NEO. |
Executive Employment Agreements
In May 2019, we entered into employment agreements with each of Messrs. Danker, Sadun, and Grant. Each employment agreement provides for a three-year initial employment period, with automatic annual renewals, unless either party provides notice of non-renewal at least 90 days prior to the expiration of the then-current term. Each employment agreement sets forth the applicable executive’s base salary and annual bonus opportunity, and provides eligibility to participate in our benefit plans generally. The chart below indicates the current base salary and target annual bonus for each NEO. See “Fiscal 2019 Summary Compensation Table” above for information on base salary and annual bonus paid in fiscal 2019.
| Name |
Base Salary | Target Annual Bonus | Total Target Cash Compensation |
|||||||||
| Tim Danker |
$ | 305,000 | 35% of base salary | $ | 411,750 | |||||||
| Raffaele Sadun |
$ | 300,000 | 35% of base salary | $ | 405,000 | |||||||
| William Grant III |
$ | 250,000 | 35% of base salary | $ | 337,500 | |||||||
Pursuant to their respective employment agreements, if the employment of the applicable NEO is terminated by us without “cause” or by the applicable executive for “good reason” (as such terms are defined in the respective employment agreements), the applicable NEO is, subject to the execution and non-revocation of a release of claims, entitled to: (i) a prorated bonus for the year during which the termination occurs; (ii) a lump sum cash severance payment, in an amount equal to the applicable severance multiple times the sum of the NEO’s annual base salary and target annual bonus; (iii) COBRA reimbursement for the excess of the monthly cost of premiums associated with medical and dental coverage over the portion of the monthly premiums for such coverage payable by a similarly situated active employee during the applicable severance period; and (iv) in the case of Mr. Sadun only, vesting of any unvested Company equity compensation awards that would have by their terms vested prior to or on the one-year anniversary of the date of termination. For the NEOs, the applicable severance multiple is one, unless the date of termination occurs during the 90-day period prior to a “change in control” (as defined in the employment agreements) or during the two-year period commencing on a change in control, in which case it is 1.5 (or, for Mr. Danker, in such circumstances or if the date of termination occurs during the two-year period commencing on the date of an initial public offering, two). If a change in control for
-118-
Table of Contents
purposes of Section 280G of the Internal Revenue Code occurs prior to May 16, 2020, Mr. Sadun would be entitled to indemnification for any associated change in control golden parachute excise taxes.
Each NEO is subject to various restrictive covenants, including an assignment of inventions covenant, a perpetual confidentiality covenant and two-year non-competition and non-solicitation covenants. However, for Messrs. Grant and Sadun, in the event of a severance-qualifying termination during the two-year period following a change in control, the non-competition and non-solicitation period would be shortened to 18 months, unless we elect to increase the severance multiple to two.
Fiscal 2019 Bonuses
In fiscal 2019, Messrs. Danker, Sadun and Grant were eligible to earn annual cash bonuses targeted at 35% of their base salaries pursuant to our MIP. Each NEO was eligible to earn his bonus based on the attainment of Company targets relating to earnings goals and personal objectives, with earnings weighted 75% and the personal objectives weighted 25%. For Mr. Danker, his earnings-based targets were weighted 33% based on the Life segment’s results and 67% based on consolidated Company results. For Mr. Sadun, his earnings-based target was weighted 100% based on consolidated Company results. For Mr. Grant, his earnings-based targets were weighted 75% based on Senior segment’s results and 25% based on consolidated Company results.
The actual cash bonuses awarded to each NEO for fiscal 2019 performance are set forth in the “Non-Equity Incentive Plan Compensation” column of the Fiscal 2019 Summary Compensation Table above.
Changes to Executive Officer Cash Compensation
Cash Compensation.
As noted above, we are engaged with Semler Brossy, our independent compensation consultant, in a market-based review of compensation programs as a result of our becoming a publicly-traded company. In connection with that review, our compensation committee approved the following changes to the cash compensation arrangements for our NEOs, effective upon the completion of this offering:
| • | Mr. Danker’s annual base salary will increase to $500,000 and his annual bonus target opportunity will equal 75% of his annual base salary; |
| • | Mr. Sadun’s annual base salary will increase to $400,000 and his annual bonus target opportunity will equal 75% of his annual base salary; and |
| • | Mr. Grant’s annual base salary will increase to $400,000 and his annual bonus target opportunity will equal 75% of his annual base salary. |
Equity Compensation. The Board has approved a grant of 100,000 restricted stock units to Mr. Grant in connection with the offering, vesting in three equal installments on the three first anniversaries of the date of grant.
Stock Ownership Guidelines
In an effort to align our directors’ and executive officers’ interests with those of our stockholders, we have adopted stock ownership guidelines that will be effective prior to the completion of this offering. Our non-employee directors are expected to hold Company common stock valued at five times their annual cash retainer for board service (not including any additional retainers for service as Lead Director or on a committee). Our Chief Executive Officer is expected to hold Company common stock valued at a multiple of five times his annual base salary and our other NEOs are expected to hold Company common stock valued at a multiple of three times annual base salary. While executive officers and directors are not required to satisfy the ownership guidelines by a specific date, until the target dollar value has been reached, executive officers and non-employee directors must
-119-
Table of Contents
retain 100%, of all net shares received under any Company equity compensation plan. Once the executive officer or director holds the target dollar value, he or she is deemed to be in compliance with the policy so long as he or she continues to hold at least the number of shares required to meet the target dollar value.
Equity Compensation Plans
2003 Stock Plan
We have historically maintained the 2003 Stock Plan to reward and attract employees and consultants with common stock, and to provide incentives that directly align their interests with those of our stockholders. However, no further awards will be made under the 2003 Stock Plan as of the effective date of the 2020 Plan, which we intend to adopt in connection with this offering, as described below. As of the date of this prospectus, there are outstanding stock options to purchase an aggregate amount of 4,095,968 shares of our common stock that have been granted to 101 individuals, with an aggregate weighted-average exercise price of $1.03. The stock options generally vest as to one-third after the vesting commencement date and as to 1/24 of the remaining shares subject to the stock option monthly thereafter, subject to the award recipient’s continued employment through the applicable vesting date. Outstanding stock options would generally vest upon a “Change in Control” (as defined in the 2003 Stock Plan). Upon a termination of employment for any reason other than for “Cause” (as defined in the 2003 Stock Plan), any unvested and outstanding stock options would generally be forfeited for no consideration, and any vested and outstanding stock options would remain exercisable for 90 days following the date of termination (and, in the case of a termination of employment due to death or disability, for 12 months following the date of termination). Each of our NEOs has been granted stock options under the 2003 Stock Plan, although only Mr. Sadun currently holds stock options, as Messrs. Danker and Grant have previously exercised all of their stock options. Our Board of Directors administers the 2003 Stock Plan.
2020 Omnibus Incentive Plan
In connection with this offering, our Board of Directors has adopted, and our current shareholders have approved, the 2020 Plan. The 2020 Plan has the terms substantially as set forth below.
Purposes
The purposes of our 2020 Plan are to attract and retain the best available personnel; to provide additional incentive to our employees, directors and consultants; and to promote the success of our business.
Stock Awards and Eligibility
The 2020 Plan provides for the grant of incentive stock options (“ISOs”), nonstatutory stock options (“NSOs”), stock appreciation rights, restricted stock awards, restricted stock unit awards and other forms of equity compensation (collectively, “stock awards”). Additionally, the 2020 Plan provides for the grant of performance-based cash awards. ISOs may be granted only to employees. All other awards may be granted to employees, non-employee directors and consultants of the Company and its subsidiaries and affiliates.
Common Stock Subject to the 2020 Plan
The number of shares of our common stock available for issuance pursuant to future awards under our 2020 Plan is 9,600,000. The number of shares of our common stock reserved under our 2020 Plan is subject to an annual increase on the first day of each fiscal year beginning on July 1, 2021 equal to 3% of our outstanding shares of common stock as of the last day of the immediately preceding fiscal year. The maximum number of shares of our common stock that may be issued upon the exercise of ISOs will be 4,000,000.
-120-
Table of Contents
The shares of our common stock covered by any award (including any award granted pursuant to the 2003 Stock Plan) that is forfeited, terminates, expires, lapses without being exercised or settles for cash will again become available for issuance under the 2020 Plan. With respect to any stock appreciation rights, the net shares issued will cease to be available under the 2020 Plan. With respect to any award, if the exercise price and/or tax withholding obligations are satisfied by delivering shares to us (by actual delivery or attestation), or if the exercise price and/or tax withholding obligations are satisfied by withholding shares otherwise issuable pursuant to the award, the share reserve shall nonetheless be reduced by the gross number of shares subject to the award.
The aggregate fair market value of the shares (determined on the grant date) covered by ISOs which first become exercisable by any participant during any calendar year may not exceed $100,000.
Director Compensation Limitations
No non-employee director may receive compensation in such capacity during any calendar year that exceeds $700,000 (calculating the value of any equity compensation awards for such purpose based on the grant date fair value of such awards for financial reporting purposes). For purposes of the preceding sentence, an equity-based award shall be deemed received upon grant (and not upon vesting or settlement) and any deferred cash compensation shall be deemed received when earned (and not when paid).
Administration
Our 2020 Plan will be administered by the compensation committee (or such other committee of the Board of Directors as our Board of Directors may from time to time designate) (the “administrator”), provided that, subject to law, all powers of the compensation committee may be exercised by the full Board of Directors. Among other things, the compensation committee will have the authority to select individuals to whom awards may be granted, determine the types of awards (as well as the number of shares of common stock to be covered by such award) granted, and determine and modify the terms and conditions of any such award.
Stock Options and Stock Appreciation Rights
Stock options will be exercisable at such times and under such conditions as the administrator determines and as set forth in the award agreement. Our 2020 Plan provides that the administrator will determine the acceptable form(s) of consideration for exercising a stock option. A stock option will be deemed exercised when we receive the notice of exercise and full payment for the shares to be exercised, together with applicable tax withholdings.
The maximum term of a stock option will not exceed ten years and will be specified in the award agreement, provided that ISOs granted to a 10% stockholder must have a term not exceeding five years. The administrator will determine and specify in each award agreement, solely in its discretion, the post-termination exercise period applicable to a stock option following a participant’s terminated service with us.
A stock appreciation right gives a participant the right to receive the appreciation in the fair market value of our common stock between the date of grant of the award and the date of its exercise. Each stock appreciation right granted under our 2020 Plan will be evidenced by an award agreement specifying the exercise price, the expiration date, the conditions of exercise, and other terms and conditions of the award.
The exercise price per share of each stock appreciation right may not be less than the fair market value of a share on the date of grant. Upon exercise of a stock appreciation right, the holder of the award will be entitled to receive a payment determined by multiplying: (1) the difference between the fair market value of a share on the date of exercise and the exercise price by (2) the number of exercised stock appreciation rights. The maximum term of a stock appreciation right will not exceed ten years and will be specified in the award agreement. The administrator will determine and specify in each award agreement, solely in its discretion, the post-termination exercise period applicable to a stock appreciation right following a participant’s terminated service with us.
-121-
Table of Contents
Restricted Stock
Awards of restricted stock are rights to acquire or purchase shares of our common stock that generally are subject to transferability and forfeitability restrictions for a specified period. Each award of restricted stock will be evidenced by an award agreement specifying the period during which the transfer of shares is subject to restriction (which, in the administrator’s sole discretion, may be based on the passage of time, the achievement of target levels of performance, the occurrence of other events the administrator determines, or a combination thereof), if any, the number of shares granted, and other terms and conditions of the award. Shares of restricted stock generally will be held in escrow until the end of the period of restriction applicable to such shares.
Unless the administrator provides otherwise, participants holding shares of restricted stock will have the right to vote the shares and to receive any dividends paid with respect to such shares, provided that unless otherwise determined by the administrator, (i) cash dividends on shares of our common stock will be payable in cash and will be held subject to the vesting of the underlying restricted stock and (ii) dividends payable in shares of our common stock will be paid in the form of restricted stock, and will be held subject to the vesting of the underlying restricted stock. The administrator, in its sole discretion, may accelerate the time at which any restrictions will lapse or be removed.
Restricted Stock Units
The administrator may grant restricted stock units, which represent a right to receive cash or shares of our common stock at a future date. Each restricted stock unit granted under our 2020 Plan will be evidenced by an award agreement specifying the number of shares subject to the award, the form of payout, and other terms and conditions of the award.
Restricted stock units will result in a payment to a participant only if the vesting criteria the administrator establishes are achieved or the awards otherwise vest. The administrator may condition the vesting of the restricted stock units upon the continued service of the applicable participant or may condition the grant or vesting of restricted stock units upon the attainment of performance goals or the continued service of the applicable participant. After the grant of restricted stock units, the administrator, in its sole discretion, may reduce or waive any restrictions (including vesting criteria) with respect to such restricted stock units.
Transferability of Awards
Unless otherwise determined by the compensation committee, awards generally are not transferable other than by will or by the laws of descent or distribution.
Change in Control
Our 2020 Plan provides that, in the event of a “change in control” (as defined in our 2020 Plan), each award will be treated as described below, except to the extent the administrator specifically provides otherwise in an award agreement.
Upon a change in control, if the successor corporation does not cancel, assume or substitute for the award with a replacement award, then stock options and stock appreciation rights will become fully vested and exercisable, all restrictions on restricted stock and restricted stock units will lapse, and, for awards with performance-based vesting conditions, all performance goals or other vesting criteria will be deemed achieved at the greater of (x) actual performance as determined in the sole discretion of the compensation committee and (y) 100% of target levels, and all other terms and conditions will be deemed met. An award will be considered assumed or substituted with a replacement award if (1) the replacement award is the same type as the replaced award, (2) the replacement award has a value equal to the value of the replaced award as determined by the compensation committee in its discretion, (3) if the replaced award was equity-based, the replacement award
-122-
Table of Contents
relates to our publicly traded securities or the publicly traded securities of the surviving entity following the change in control, (4) the replacement award contains terms relating to vesting that are substantially identical to those of the replaced award and (5) the terms and conditions of the replacement award are not less favorable to the participant than the terms and conditions of the replaced award as of the date of the change in control.
Unless otherwise determined by the compensation committee and set forth in the applicable agreement, upon a termination of service of a participant by the successor corporation other than for cause within 24 months following a change in control, all replacement awards will be treated as if such awards had not been assumed or substituted with a replacement award as described above. Additionally, any stock option or stock appreciation right held by the participant as of the date of the change in control that remains outstanding as of the date of such termination of service may thereafter be exercised until the expiration of the stated full term of such stock option or stock appreciation right.
Termination and Amendment
Our 2020 Plan will automatically terminate ten years from the date of its adoption by our Board of Directors, unless terminated earlier by our Board of Directors. The administrator may amend, alter, suspend or terminate our 2020 Plan at any time, provided that no amendment, alteration or discontinuation may materially impair the rights of any participant without the participant’s consent.
New Plan Benefits
The compensation committee has the discretion to grant awards under the 2020 Plan, and therefore it is not possible at the time of filing of this prospectus to determine future awards that will be received by our NEOs or others under the 2020 Plan. All of our officers, directors, employees or consultants are eligible for consideration to participate in the 2020 Plan. While we expect to grant awards under the 2020 Plan to eligible participants, we have not yet established specific parameters regarding the granting of future awards under the 2020 Plan to any NEO or non-employee director (other than the grant of restricted stock units to Mr. Grant described above and the non-employee director grants described below). As such, the benefits or amounts that will be received by or allocated to any eligible participants under the 2020 Plan following the completion of this offering are not currently determinable.
2020 Employee Stock Purchase Plan
Our Board of Directors and shareholders have adopted the 2020 Employee Stock Purchase Plan (the “ESPP”), which will be effective upon the completion of this offering and will have terms substantially as set forth below.
Purpose
The purpose of the ESPP will be to provide our eligible employees with an opportunity to purchase shares of our common stock through accumulated payroll deductions. We believe that allowing our employees to participate in the ESPP will provide them with a further incentive to ensure our success and accomplish our corporate goals.
Shares Available for Issuance
A total of 1,400,000 shares of our common stock will be available for issuance under our ESPP.
Administration
Our Board of Directors or a committee designated by our Board (referred to herein as the “administrator”) will administer the ESPP. All questions of interpretation or application of the ESPP are determined by the administrator and its decisions are final and binding upon all participants.
-123-
Table of Contents
Eligibility
Generally, each of our common law employees whose customary employment with us is at least 20 hours per week and more than five months in a calendar year will be eligible to participate in the ESPP; except that no employee will be granted an option under the ESPP (1) to the extent that, immediately after the grant, such employee would own or have the right to purchase 5% or more of the total combined voting power or value of all classes of our capital stock or any of our parents or subsidiaries, or (2) to the extent that his or her rights to purchase stock under all of our employee stock purchase plans accrues at a rate which exceeds $25,000 worth of stock (determined at the fair market value of the shares at the time such option is granted) for each calendar year in which such option is outstanding at any time.
Offering Period
Each offering period during which an option granted pursuant to the ESPP may be exercised will have a duration as determined by the Board. No offering period will commence prior to the completion of the offering, and the Board will decide when following the offering to commence the initial offering period. There is no requirement that the administrator commence any offering period.
Purchase Price
Unless and until the administrator determines otherwise, the per share purchase price is 95% of the fair market value of a share of common stock on the exercise date; provided, however, that the purchase price may be adjusted by the administrator. In no event will the per share purchase price be less than the lesser of (i) 85% of the fair market value of a share of common stock on the date the offering period commences or (ii) 85% of the fair market value of the common stock on the exercise date.
Exercise and Payment of the Purchase Right; Payroll Deductions
The number of whole shares of common stock that a participant may purchase in each offering period is determined by dividing the total amount of payroll deductions withheld from the participant’s compensation during that offering period by the purchase price. The maximum number of shares that may be purchased by any participant in any offering period is 40,000.
Non-Transferability
Neither payroll deductions credited to a participant’s account nor any rights with regard to the exercise of an option or to receive shares under the ESPP may be assigned, transferred, pledged or otherwise disposed of in any way (other than by will, the laws of descent and distribution or by designation of a beneficiary) by the participant.
Withdrawal
Generally, a participant may withdraw all but not less than all of his or her payroll deductions credited to his or her account and not yet used to exercise his or her option under the ESPP for an offering period at any time by written notice prior to the last trading day of the offering period without affecting his or her eligibility to participate in future offering periods. Once a participant withdraws from an offering period, however, that participant may not participate again in the same offering period. To participate in a subsequent offering period, the participant must deliver a new subscription agreement.
Termination of Employment
Upon termination of a participant’s employment for any reason, including death or disability, he or she shall be deemed to have elected to withdraw from the ESPP and any payroll deductions credited to the participant’s
-124-
Table of Contents
account (to the extent not yet used to purchase shares of our common stock) shall be returned to the participant or, in the case of death, to the person or persons entitled thereto as provided in the ESPP, and such participant’s option will automatically be terminated.
Corporate Transactions
Subject to any required action by our stockholders, in the event of any stock split, reverse stock split, stock dividend, combination or reclassification of our common stock, or any other change in the number of shares of our common stock effected without receipt of consideration by us (provided, however, that conversion of any of our convertible securities shall not be deemed to have been “effected without receipt of consideration”), proportionate adjustments will be made to the purchase price per share and the number and kind of shares of common stock covered by each option under the ESPP (which has not yet been exercised), as well as to the number and kind of the shares available for purchase under the ESPP and the per-person numerical limits on the number of shares that may be purchased during an offering period under the ESPP.
In the event of our proposed dissolution or liquidation, the offering period then in progress will be shortened by setting a new exercise date on which such offering period will end, unless provided otherwise by the administrator. The new exercise date will be prior to the dissolution or liquidation. If the administrator shortens any offering period then in progress, the administrator will notify each participant in writing, at least ten business days prior to the new exercise date, that the exercise date has been changed to the new exercise date and that the participant’s option will be exercised automatically on the new exercise date, unless the participant has already withdrawn from the offering period.
In the event of a “change in control,” as defined in the ESPP, each option under the ESPP will be assumed or an equivalent option will be substituted by the successor corporation or a parent or subsidiary of such successor corporation. In the event the successor corporation refuses to assume or substitute for the options, any offering periods then in progress will be shortened by setting a new exercise date on which such offering period will end. The new exercise date will occur prior to the change in control. Further, the administrator will notify each participant in writing, at least ten business days prior to the new exercise date, that the exercise date has been changed to the new exercise date and that the participant’s option will be exercised automatically on the new exercise date, unless the participant withdraws from the offering period.
Amendment and Termination
Our ESPP will automatically terminate ten years from the date of its adoption by our Board of Directors, unless terminated earlier by the administrator. The administrator may, at any time and for any reason, terminate, amend or suspend the ESPP, including the term of any offering period then in progress. Generally, no such termination or amendment can adversely affect options previously granted and stockholder approval will be sought for certain changes as required by applicable law.
Other Elements of Compensation
Retirement Plans
We maintain a 401(k) retirement savings plan for the benefit of our employees, including our NEOs, who satisfy certain eligibility requirements. The NEOs are eligible to participate in the 401(k) plan on the same terms as other full-time employees and receive matching contributions equal to 100% of the first 2% of their individual contributions and a potential additional 1% profit sharing contribution based on Company achievement of performance targets.
Director Compensation
In fiscal 2019, our Board of Directors consisted of six directors: Donald Britton, William T. Grant II, Donald Hawks III, David Paulsen, Charan Singh and Raymond Weldon. Prior to this offering, we did not
-125-
Table of Contents
maintain a formal director compensation policy. Each of Charan Singh, our non-Executive Chairman, and William T. Grant II, our non-Executive Vice-Chairman, is party to an employment agreement with the Company, in each case with a term scheduled to expire on December 31, 2020. Pursuant to these employment agreements, Mr. Singh and Mr. Grant each receive an annual base salary and are eligible for annual bonuses, equity compensation awards, and employee benefits. Currently, Mr. Singh’s base salary is $324,170 per year and Mr. Grant’s base salary is $220,000 per year. In addition, with respect to 2019, Mr. Singh and Mr. Grant received annual bonuses of $41,250 and $60,783, respectively, in their capacities of employees of the Company, and received $556 and $358, respectively, pursuant to a Company-wide holiday bonus program. Each agreement provides that if the Company terminates the applicable director’s employment prior to expiration of the term, it will pay the director a severance payment equal to the base salary that would have been payable over the remaining scheduled term, as well as a prorated annual bonus, and will generally provide continued welfare benefits for two years following the date of termination. In addition, the applicable director’s stock options would vest upon such a termination. If the Company terminates the applicable director’s employment within 60 days following a change in control (as defined in the agreement), no severance would be due, although any stock options held by the director would vest. Mr. Paulsen has historically received consulting fees on an hourly basis, currently at a rate of $140 per hour, a portion of which was for his services in his capacity as a director. Mr. Britton has historically been compensated on a per-meeting basis for his director service, most recently at a rate of $5,000 per meeting. Mr. Hawks and Mr. Weldon did not earn compensation in connection with their board service during fiscal year 2019. We also reimburse our directors for reasonable and necessary out-of-pocket expenses incurred in attending board and committee meetings or performing other services in their capacities as directors.
The following table sets forth compensation paid, earned or awarded during fiscal 2019 to each of our directors:
| Name |
Fees Earned or Paid in Cash ($) (1) |
Option Awards ($) (2) |
All Other Compensation ($) (3) |
Total Compensation ($) |
||||||||||||
| Donald Britton |
20,000 | — | — | 20,000 | ||||||||||||
| William T. Grant II |
— | — | 261,806 | 261,806 | ||||||||||||
| Donald Hawks III |
— | — | — | — | ||||||||||||
| David Paulsen |
— | — | 22,418 | 22,418 | ||||||||||||
| Charan Singh |
— | — | 376,311 | 376,311 | ||||||||||||
| Raymond Weldon |
— | — | — | — | ||||||||||||
| (1) | For fiscal year 2019, Mr. Britton was compensated at a rate of $5,000 per meeting. |
| (2) | As of June 30, 2019, the following stock option awards held by our directors were outstanding and fully vested: options held by Mr. Grant to acquire 1,680,000 shares of common stock, options held by Mr. Paulsen to acquire 320,000 shares of common stock and options held by Mr. Singh to acquire 800,000 shares of common stock. Each of these awards were granted in January 2014 in connection with the recipient’s services to the Company in their capacities as employees, and not in connection with service as a member of our board or directors. |
| (3) | Messrs. Grant and Singh received base salary of $220,000 and $315,170, respectively, for fiscal year 2019, and also received annual bonuses of $41,250 and $60,783, respectively, in their capacities of employees of the Company. Additionally Messrs. Grant and Singh received $556 and $358, respectively, pursuant to a Company-wide holiday bonus program, with the bonus amount based solely on seniority. Mr. Paulsen received consulting fees at a rate of $140 per hour in fiscal year 2019, a portion of which was for his services in his capacity as a director. |
In preparing for this offering, we requested that Semler Brossy, our independent compensation consultant of the compensation committee of the Board, undertake a review of our director compensation program in order to transition to a new standardized director compensation program that is more typical of public company director compensation programs. In connection with this offering, we are implementing a new compensation policy for our non-employee directors that will become effective upon the completion of this offering. Following the
-126-
Table of Contents
completion of this offering, our non-employee directors will be compensated for service on our Board of Directors pursuant to our policy described below.
Annual Cash Retainers
Each non-employee member of our Board of Directors will receive a $40,000 annual cash retainer. The lead director of the Board of Directors and chairpersons of each committee of the Board of Directors will also receive the additional annual cash retainers described below:
| • | Lead Director. The lead director will receive an annual cash retainer of $22,500. |
| • | Audit Committee Chairperson. The chairperson of the audit committee will receive an annual cash retainer of $17,500. |
| • | Compensation Committee Chairperson. The chairperson of the compensation committee will receive an annual cash retainer of $12,500. |
| • | Nominating and Corporate Governance Committee Chairperson. The chairperson of the nominating and corporate governance committee will receive an annual cash retainer of $7,500 |
Equity Retainer
Annual RSU Retainer. On an annual basis, each non-employee director will be eligible to receive an annual grant of a number of restricted stock units equal to $100,000 divided by the closing price of our common stock on the date of the annual shareholder meeting (rounded down to the nearest whole share), which will vest, subject to continued service, on the date of the following year’s annual shareholder meeting.
Initial Stock Option Grant. Upon joining the Board of Directors, each non-employee director will receive an initial grant of non-qualified stock options with a grant date fair value of $125,000, which will vest in three annual installments over a three-year period. Earl Devanny III and Denise Devine will receive such an award immediately following completion of the offering with an exercise price equal to the initial public offering price of a share of Company common stock.
-127-
Table of Contents
CERTAIN RELATIONSHIPS AND RELATED PARTY TRANSACTIONS
Other than compensation arrangements for our executive officers and directors which are described elsewhere in this prospectus, below we describe transactions since July 1, 2016 to which we were or will be a participant and in which:
| • | The amounts involved exceeded or will exceed $120,000; and |
| • | Any of our directors, executive officers or holders of more than 5% of our outstanding voting securities, or any member of the immediate family of, or person sharing the household with, the foregoing persons, had or will have a direct or indirect material interest. |
Paid Leads and InsideResponse Acquisition
InsideResponse
The Company has historically purchased leads from InsideResponse, an online marketing consulting firm previously owned in part by Tim Danker, our Chief Executive Officer, William Grant III, our Chief Operating Officer and Robert Grant, the President of the Company’s Senior segment. The Company incurred $10.1 million, $10.0 million and $7.8 million in lead costs with this firm for the years ended June 30, 2019, 2018 and 2017, respectively, and $13.6 million in lead costs with this firm for the nine month period ended March 31, 2020, that were recorded in marketing and advertising expense in the consolidated statements of operations. The Company owed $0.2 million, $0.5 million and $0.4 million to this firm as of June 30, 2019, 2018 and 2017, respectively, and $2.2 million as of March 31, 2020, that were recorded in accounts payable and accrued expenses in the consolidated balance sheets.
The approximate dollar value of Mr. Danker’s interest in the transactions described above was $0.2 million for each of the years ended June 30, 2019 and 2018, $0.1 million for the year ended June 30, 2017 and $0.1 million for the nine month period ended March 31, 2020. The approximate dollar value of Mr. William Grant III’s interest in the transactions described above was $1.3 million for each of the years ended June 30, 2019 and 2018, $1.0 million for the year ended June 30, 2017 and $1.0 million for the nine month period ended March 31, 2020. The approximate dollar value of Mr. Robert Grant’s interest in the transactions described above was $1.3 million for each of the years ended June 30, 2019 and 2018, $1.0 million for the year ended June 30, 2017 and $1.0 million for the nine month period ended March 31, 2020.
On May 1, 2020, we acquired 100% of the outstanding membership units of InsideResponse for an aggregate purchase price of up to $65.0 million (subject to customary adjustments), as set forth in the Agreement and Plan of Merger, dated February 12, 2020, by and among the Company, SQ-IR Merger Sub LLC, a wholly owned subsidiary of the Company, InsideResponse and the other parties thereto, as amended on May 1, 2020 (the “Merger Agreement”). The purchase price is comprised of $32.7 million, which was paid in cash at the closing of the transaction, and an earn-out of up to $32.3 million, to be paid 65% in cash and 35% in shares of our common stock (to be valued based on the average closing price of our common stock for the 10 trading days ending three trading days immediately preceding such payment date). The earn-out is contingent upon the achievement of certain gross profit targets for InsideResponse in calendar year 2020, as set forth in the Merger Agreement. The approximate dollar values of Mr. Danker’s, Mr. William Grant III’s and Mr. Robert Grant’s interest in this transaction are $0.6 million, $4.3 million and $4.3 million, respectively, based upon a purchase price of $32.7 million and assuming no earn-out consideration is paid, and the approximate dollar values of Mr. Danker’s, Mr. William Grant III’s and Mr. Robert Grant’s interest in this transaction are up to $1.1 million, $8.5 million and $8.5 million, respectively, based upon an aggregate purchase price of $65.0 million, assuming the earn-out consideration is paid in full.
Spring Venture Group
The Company also purchases leads from Spring Venture Group, a senior healthcare insurance distribution platform owned in part by Tim Danker, our Chief Executive Officer, William Grant III, our Chief Operating
-128-
Table of Contents
Officer, William Grant II, the Vice Chairman of the Board and a director of the Company, Robert Grant, the President of the Company’s Senior segment and Paul Gregory, the Executive Vice President of the Company’s Life segment. The Company incurred $1.6 million, $0.7 million and $0.6 million in lead costs with this firm for the years ended June 30, 2019, 2018 and 2017, respectively, and $0.5 million for the nine month period ended March 31, 2020, that were recorded as marketing and advertising expense in the consolidated statements of operations. The Company did not have any outstanding payables due to this firm as of June 30, 2019 and 2017, owed $0.1 million as of June 30, 2018 and owed less than $0.1 million as of March 31, 2020, that was recorded in accounts payable and accrued expenses in the consolidated balance sheet. In addition, the Company has acted as the field marketing organization on behalf of this firm. The net financial impact of this relationship to the Company was not material for each of the years ended June 30, 2019, 2018 and 2017, or for the nine month period ended March 31, 2020.
The approximate dollar value of Mr. Danker’s interest in the transactions described above was $0.2 million, $0.1 million and $0.08 million for the years ended June 30, 2019, 2018 and 2017, respectively, and $0.06 million for the nine month period ended March 31, 2020. The approximate dollar value of Mr. William Grant III’s interest in the transactions described above was $0.1 million, $0.05 million and $0.04 million for the years ended June 30, 2019, 2018 and 2017, respectively, and $0.03 million for the nine month period ended March 31, 2020. The approximate dollar value of Mr. William Grant II’s interest in the transactions described above was $0.04 million, $0.02 million and $0.02 million for the years ended June 30, 2019, 2018 and 2017, respectively, and $0.01 million for the nine month period ended March 31, 2020. The approximate dollar value of Mr. Robert Grant’s interest in the transactions described above was $0.1 million, $0.05 million and $0.04 million for the years ended June 30, 2019, 2018 and 2017, respectively, and $0.03 million for the nine month period ended March 31, 2020. The approximate dollar value of Mr. Gregory’s interest in the transactions described above was less than $0.01 million for each of the years ended June 30, 2019, 2018 and 2017, and $0.01 million for the nine month period ended March 31, 2020.
Consulting Agreements
In January 2011, the Company entered into a consulting agreement with David Paulsen, a former director and employee of the Company, effective until canceled by either party. During each of the years ended June 30, 2019 and 2018, the Company incurred consulting expenses of less than $0.1 million and $0.1 million, respectively, and for the year ended June 30, 2017, the Company incurred $0.3 million in consulting expenses that were recorded in general and administrative expense in the consolidated statements of operations. During the nine month period ended March 31, 2020, the Company incurred consulting expenses of less than $0.1 million. The Company did not have any outstanding payables due to this consultant as of June 30, 2019 or March 31, 2020, and owed less than $0.1 million as of each of June 30, 2018 and 2017 that was recorded in accounts payable and accrued expenses in the consolidated balance sheets.
On April 20, 2017, Brookside Equity Partners LLC entered into a letter agreement with the Company with respect to the provision of certain advisory services to the Company during the period ending June 30, 2018, pursuant to which Brookside Equity Partners LLC was paid $0.8 million by the Company. In accordance with the terms of its advisory services agreements with BEP III LLC, BEP III Co-Invest LLC and SQ Co-Investors LLC, such amounts were then paid to such entities. Donald Hawks III and Raymond Weldon, two of the members of our Board of Directors, are members and Managing Directors of Brookside Equity Partners LLC.
Related Party Receivable
As of June 30, 2019, the Company had a related party receivable outstanding from Donald Britton, one of the members of our Board of Directors, that arose from a stock option exercise that was initiated before June 30, 2019, but the payment was not received by the Company until after June 30, 2019, thus causing a $0.4 million receivable recorded in other current assets in the consolidated balance sheet as of June 30, 2019. As of March 31, 2020, we did not have any related party receivables.
-129-
Table of Contents
Indemnification Agreements
We intend to enter into an indemnification agreement with each of our directors and officers. These agreements will require us to indemnify these individuals to the fullest extent permitted under the DGCL against liabilities that may arise by reason of their service to us, and to advance expenses incurred as a result of any proceeding against them as to which they could be indemnified. See “Description of Capital Stock—Limitations on Liability, Indemnification of Officers and Directors and Insurance.”
Subordinated Promissory Notes
On January 1, 2016, the Company issued $2.0 million aggregate principal amount of subordinated promissory notes to seven stockholders of the Company, including Charan Singh, a former director of the Company, and entities affiliated with Robert Edwards, the former Chief Financial Officer of the Company, William Grant II, the Vice Chairman of the Board and a director of the Company, William Grant III, our Chief Operating Officer and Robert Grant, the President of the Company’s Senior segment, as a condition of obtaining a $17.5 million revolving credit facility (the “Revolver”) with MUFG Union Bank. The subordinated promissory notes were paid off in January 2018, and the Company recorded interest expense for the year ended June 30, 2018 of $0.1 million.
Compensation of Certain Executive Officers
In connection with his service as the President of the Company’s Senior segment, Robert Grant’s total compensation was $0.2 million during the nine month period ended March 31, 2020. In connection with his service as the Chief Revenue Officer of the Company, Mr. Grant’s total compensation was $0.3 million during fiscal 2019 and $0.2 million during fiscal 2018. In connection with his service as the Company’s Senior Vice President of Sales, Operations and Training, Mr. Grant’s total compensation was $0.3 million during fiscal 2017. The Board has approved a grant of 50,000 restricted stock units and 200,000 stock options to Mr. Grant in connection with the offering (and such stock options will have an exercise price equal to the initial public offering price of a share of Company common stock), vesting in three equal installments on the three first anniversaries of the date of grant. Mr. Grant is the son of William Grant II, the Vice Chairman of the Company’s Board of Directors.
Amended and Restated Series D Preferred Stock Investors’ Rights and Stockholders Agreement
In 2014, in connection with the sale of shares of our Series D preferred stock, we entered into the Series D Preferred Stock Investors’ Rights and Stockholders Agreement with the Series D Holders, which grants the Series D Holders certain rights, including but not limited to certain preemptive rights, rights to put their shares of Series D preferred stock, director appointment rights, information rights and registration rights. On November 4, 2019, we entered into the Amended and Restated Series D Investors’ Rights and Stockholders Agreement, whereby, among other things, the Company agreed to classify the Board upon the consummation of a qualifying initial public offering and the Company granted the Series D Holders the right to appoint two directors to our Board (one to Class II and one to Class III) upon the consummation of such offering. On April 17, 2020, we entered into Amendment No. 1 to the Amended and Restated Series D Investors’ Rights and Stockholders Agreement, extending the maturity date for the Series D Holders’ right to put their shares of Series D preferred stock from January 31, 2025 to March 30, 2025.
Upon the closing of this offering, the foregoing rights will terminate other than certain information and registration rights afforded to the Series D Holders, which will survive pursuant to the terms of the Amended and Restated Series D Investors’ Rights and Stockholders Agreement. See “Description of Capital Stock—Series D Preferred Stock Rights” for additional information.
-130-
Table of Contents
Directed Share Program
At our request, the underwriters have reserved up to 1,250,000 shares of common stock, or up to 5% of the shares of common stock and offered by this prospectus for sale by the Company, at the initial public offering price, to directors, director nominees, officers, employees, business associates and related persons of SelectQuote, Inc. The sales will be made at our direction by Morgan Stanley & Co. LLC and its affiliates through a directed share program. If purchased by these persons, these shares will be subject to a 180-day lock-up restriction. The number of shares of common stock available for sale to the general public will be reduced to the extent these individuals purchase such reserved shares. Any reserved shares that are not so purchased will be offered by the underwriters to the general public on the same basis as the other shares offered by this prospectus.
Policies and Procedures for Related Party Transactions
We will have a policy that all material transactions with a related party, as well as all material transactions in which there is an actual, or in some cases, perceived, conflict of interest, will be subject to prior review and approval by our Audit Committee and its independent members, who will determine whether such transactions or proposals are fair and reasonable to SelectQuote and its stockholders. In general, potential related-party transactions will be identified by our management and discussed with our Audit Committee at its meetings. Detailed proposals, including, where applicable, financial and legal analyses, alternatives and management recommendations, will be provided to our Audit Committee with respect to each issue under consideration, and decisions will be made by our Audit Committee with respect to the foregoing related-party transactions after opportunity for discussion and review of materials. When applicable, our Audit Committee will request further information and, from time to time, will request guidance or confirmation from internal or external counsel or auditors.
All related party transactions described in this section occurred prior to adoption of this policy and as such, these transactions were not subject to the approval and review procedures set forth in the policy.
-131-
Table of Contents
PRINCIPAL AND SELLING STOCKHOLDERS
The following table sets forth information with respect to the beneficial ownership of our capital stock, as of (1) immediately prior to the completion of this offering and (2) following the sale of common stock in this offering, by:
| • | each person, or group of affiliated persons, known by us to beneficially own more than 5% of our outstanding common stock; |
| • | each of our directors; |
| • | each of our named executive officers; |
| • | all of our executive officers and directors as a group; and |
| • | the selling stockholders. |
The number of shares beneficially owned by each stockholder is determined under rules of the SEC and includes voting or investment power with respect to securities. Under these rules, beneficial ownership includes any shares as to which the individual or entity has sole or shared voting power or investment power. In computing the number of shares beneficially owned by an individual or entity and the percentage ownership of that person, shares of common stock subject to options, warrants or other rights held by such person that are currently exercisable or will become exercisable within 60 days are considered outstanding, although these shares are not considered outstanding for purposes of computing the percentage ownership of any other person.
We have based our calculation of the percentage of beneficial ownership prior to this offering on 144,650,597 shares of common stock outstanding as of immediately prior to the completion of this offering (assuming the automatic conversion of all outstanding shares of our Series A, B, C, D and E preferred stock into an aggregate of 52,404,685 shares of common stock upon the completion of this offering). We have based our calculation of the percentage of beneficial ownership after this offering on 162,650,597 shares of common stock (assuming the automatic conversion of all outstanding shares of our Series A, B, C, D and E preferred stock into an aggregate of 52,404,685 shares of common stock upon the completion of this offering) outstanding immediately after the completion of this offering, assuming that the underwriters do not exercise their option to purchase up to 3,750,000 additional shares of our common stock from the selling stockholders. The table below does not reflect any shares that may be acquired by our directors or officers pursuant to the directed share program.
-132-
Table of Contents
Unless otherwise indicated, the address of all listed stockholders is c/o SelectQuote, Inc., 6800 West 115th Street, Suite 2511, Overland Park, Kansas 66211. Each of the stockholders listed has sole voting and investment power with respect to the shares beneficially owned by the stockholder unless noted otherwise, subject to community property laws where applicable.
| Shares Beneficially Owned Prior to Offering |
Number of Shares Offered |
Shares Beneficially Owned After Offering |
||||||||||||||||||
| Name |
Number | % | Number | % | ||||||||||||||||
| 5% Stockholders |
||||||||||||||||||||
| Entities Associated with Brookside Equity Partners LLC (1) |
32,000,000 | 22.12 | % | 3,971,694 | 28,028,306 | 17.23 | % | |||||||||||||
| Charan Singh (2) |
12,743,976 | 8.80 | % | 635,430 | 12,108,546 | 7.43 | % | |||||||||||||
| Directors and Executive Officers |
||||||||||||||||||||
| Donald Britton (3) |
361,336 | 0.25 | % | 18,017 | 343,319 | 0.21 | % | |||||||||||||
| Tim Danker |
1,960,000 | 1.35 | % | 97,728 | 1,862,272 | 1.14 | % | |||||||||||||
| Earl Devanny III |
— | — | — | — | — | |||||||||||||||
| Denise Devine |
— | — | — | — | — | |||||||||||||||
| William Grant II (4) |
6,708,752 | 4.60 | % | 316,770 | 6,391,982 | 3.90 | % | |||||||||||||
| William Grant III (5) |
3,956,613 | 2.74 | % | 171,971 | 3,784,642 | 2.33 | % | |||||||||||||
| Donald Hawks III (6) |
40,000 | 0.03 | % | — | 40,000 | 0.02 | % | |||||||||||||
| Raffaele Sadun (7) |
1,200,000 | 0.83 | % | 59,834 | 1,140,166 | 0.70 | % | |||||||||||||
| Raymond Weldon (8) |
40,000 | 0.03 | % | — | 40,000 | 0.02 | % | |||||||||||||
| All executive officers and directors as a group (14 persons) (9) |
18,667,742 | 12.79 | % | 861,420 | 17,806,322 | 10.86 | % | |||||||||||||
| Selling Stockholders |
||||||||||||||||||||
| David L. Paulsen and Sally J. Paulsen (10)+ |
5,049,952 | 3.48 | % | 251,798 | 4,798,154 | 2.94 | % | |||||||||||||
| John C. Gamble and Laura G. Gamble (11) |
4,855,424 | 3.36 | % | 242,099 | 4,613,325 | 2.84 | % | |||||||||||||
| Joseph Grant (12) |
2,996,597 | 1.72 | % | 124,103 | 2,364,865 | 1.45 | % | |||||||||||||
| Ellen E. Petri and Jonathan T. Klein (13) |
2,328,168 | 1.61 | % | 116,086 | 2,212,082 | 1.36 | % | |||||||||||||
| Haakon Capital LLC (14) |
1,522,888 | 1.05 | % | 75,933 | 1,446,955 | 0.89 | % | |||||||||||||
| Charles Martin (15)+ |
1,090,272 | 0.75 | % | 54,363 | 1,035,909 | 0.64 | % | |||||||||||||
| Sylvia Singh (16)+ |
916,576 | 0.63 | % | 45,702 | 870,874 | 0.54 | % | |||||||||||||
| Seguro Investments, LLC (17) |
892,600 | 0.62 | % | 44,506 | 848,094 | 0.52 | % | |||||||||||||
| Scott A. Striegel + |
846,048 | 0.58 | % | 42,185 | 803,863 | 0.49 | % | |||||||||||||
| Ian Kirwan + |
838,000 | 0.58 | % | 41,784 | 796,216 | 0.49 | % | |||||||||||||
| Thomas E. Williams (18) |
712,576 | 0.49 | % | 35,530 | 677,046 | 0.42 | % | |||||||||||||
| Nancy Malik Long (19)+ |
601,128 | 0.41 | % | 29,973 | 571,155 | 0.35 | % | |||||||||||||
| Garry Dahl + |
600,000 | 0.41 | % | 29,917 | 570,083 | 0.35 | % | |||||||||||||
| Andrea Hatch (20)+ |
543,880 | 0.38 | % | 27,119 | 516,761 | 0.32 | % | |||||||||||||
| Phillip D. Bright and Jane M. Starkman (21) |
525,104 | 0.36 | % | 26,182 | 498,922 | 0.31 | % | |||||||||||||
| W. Randall Garr and Laura Kalman (22) |
499,984 | 0.35 | % | 24,930 | 475,054 | 0.29 | % | |||||||||||||
| Paul E. Roberts (23) |
413,792 | 0.29 | % | 20,632 | 393,160 | 0.24 | % | |||||||||||||
| Kathryn R. Miller (24) |
384,368 | 0.27 | % | 19,165 | 365,203 | 0.22 | % | |||||||||||||
| Gerald Freeman and Virginia Freeman (25) |
351,712 | 0.24 | % | 17,537 | 334,175 | 0.21 | % | |||||||||||||
| Jeffrey Randolph + |
320,000 | 0.22 | % | 15,956 | 304,044 | 0.19 | % | |||||||||||||
| Michael Hardin (26)+ |
256,655 | 0.18 | % | 13,961 | 242,694 | 0.15 | % | |||||||||||||
| Stephen F. Perry+ |
260,000 | 0.18 | % | 12,964 | 247,036 | 0.15 | % | |||||||||||||
| Bowen Investments, LLC (27) |
225,320 | 0.16 | % | 11,235 | 214,085 | 0.13 | % | |||||||||||||
| C. Richard Kramlich (28) |
173,336 | 0.12 | % | 8,643 | 164,693 | 0.10 | % | |||||||||||||
| Caralee Weich (29) |
160,992 | 0.11 | % | 8,000 | 152,992 | 0.09 | % | |||||||||||||
| Brett Zimmerman (30) |
158,456 | 0.11 | % | 7,901 | 150,555 | 0.09 | % | |||||||||||||
| Tracy Zimmerman (31) |
158,456 | 0.11 | % | 7,901 | 150,555 | 0.09 | % | |||||||||||||
| Donna Lovett and Allen Lovett (32) |
141,632 | 0.10 | % | 7,062 | 134,570 | 0.08 | % | |||||||||||||
| Kimberly J. Terrill (33) |
139,152 | 0.10 | % | 6,938 | 132,214 | 0.08 | % | |||||||||||||
| Kent J. McAllister (34) |
118,296 | 0.08 | % | 5,898 | 112,398 | 0.07 | % | |||||||||||||
| John H. Mize, Jr. and Cheryl L. Mize (35) |
112,664 | 0.08 | % | 5,618 | 107,046 | 0.07 | % | |||||||||||||
| Dennis Stephen and Billie Jean Stephen (36) |
177,600 | 0.12 | % | 8,856 | 168,744 | 0.10 | % | |||||||||||||
| Michael Connor and Blish Connor (37) |
99,064 | 0.07 | % | 4,939 | 94,125 | 0.06 | % | |||||||||||||
| Certain other current employees as a group (38) |
1,194,951 | 0.82 | % | 62,913 | 1,132,038 | 0.69 | % | |||||||||||||
| Certain other former employees as a group (39) |
1,019,872 | 0.70 | % | 50,583 | 969,019 | 0.60 | % | |||||||||||||
| Certain other selling stockholder investors as a group (40) |
1,363,280 | 0.94 | % | 67,976 | 1,295,304 | 0.80 | % | |||||||||||||
-133-
Table of Contents
| * | Less than 1%. |
| + | Current or former employee of the Company. |
| (1) | Includes 15,470,824 shares of common stock issuable upon the conversion of the Series D preferred stock held by BEP III LLC, 12,044,344 shares of common stock issuable upon the conversion of the Series D preferred stock held by BEP III Co-Invest LLC, 3,292,320 shares of common stock issuable upon the conversion of the Series D preferred stock held by SQ Co-Investors LLC and 1,192,512 shares of common stock issuable upon the conversion of the Series D preferred stock held by The Ampex Retirement Master Trust. The business address for each of these entities is 201 Tresser Boulevard, Suite 320, Stamford, Connecticut 06901. |
| (2) | Includes 11,590,776 shares of common stock held directly by Mr. Singh and 858,208 shares of common stock and 58,368 shares of common stock issuable upon the conversion of the Series A preferred stock held by Mr. Singh’s spouse, Sylvia Singh. Also includes 236,624 shares of common stock subject to options exercisable within 60 days of May 15, 2020. |
| (3) | Includes 333,520 shares of common stock and 27,816 shares of common stock issuable upon the conversion of the Series B preferred stock. |
| (4) | Includes 2,354,424 shares of common stock, 454,352 shares of common stock issuable upon the conversion of the Series A preferred stock, 421,080 shares of common stock issuable upon the conversion of the Series B preferred stock and 233,488 shares of common stock issuable upon the conversion of the Series C preferred stock. Also includes 1,773,024 shares of common stock beneficially owned by Mr. Grant as the trustee of the W. Thomas Grant II Family Irrevocable Trust and 355,760 shares of common stock beneficially owned by Mr. Grant through his Mainstar Trust IRA. Also includes 1,116,624 shares of common stock subject to options exercisable within 60 days of May 15, 2020. |
| (5) | Includes 1,811,872 shares of common stock, 37,112 shares of common stock issuable upon the conversion of the Series A preferred stock, 1,600,000 shares of common stock beneficially owned by Mr. Grant as the trustee of the William Thomas Grant III Irrevocable Trust and 507,629 shares of common stock beneficially owned by Mr. Grant through Haakon Capital LLC, an investment company in which Mr. Grant owns a 33.3% ownership stake. Mr. Grant disclaims beneficial ownership of the shares held by Haakon Capital LLC, except to the extent of his pecuniary interest therein. Without giving effect to these shares, Mr. Grant would have beneficial ownership of 3,448,984 shares of the Company’s common stock, representing 2.38% of our common stock outstanding as of May 15, 2020. |
| (6) | Includes 40,000 shares of common stock held directly by Mr. Hawks. Does not include 15,470,824 shares of common stock issuable upon the conversion of the Series D preferred stock held by BEP III LLC, 12,044,344 shares of common stock issuable upon the conversion of the Series D preferred stock held by BEP III Co-Invest LLC and 3,292,320 shares of common stock issuable upon the conversion of the Series D preferred stock held by SQ Co-Investors LLC. In his capacity as a Managing Director of Brookside Equity Partners LLC, the manager of BEP III LLC, BEP III Co-Invest LLC and SQ Co-Investors LLC, Mr. Hawks exercises shared voting and investment control over the above-listed securities. Mr. Hawks disclaims beneficial ownership of the shares held by these entities, except to the extent of his pecuniary interest therein. |
| (7) | Includes 1,099,944 shares of common stock and 100,056 shares of common stock subject to options exercisable within 60 days of May 15, 2020. |
| (8) | Includes 40,000 shares of common stock held directly by Mr. Weldon and his spouse Lea Weldon. Does not include 15,470,824 shares of common stock issuable upon the conversion of the Series D preferred stock held by BEP III LLC, 12,044,344 shares of common stock issuable upon the conversion of the Series D preferred stock held by BEP III Co-Invest LLC, 3,292,320 shares of common stock issuable upon the conversion of the Series D preferred stock held by SQ Co-Investors LLC and 1,192,512 shares of common stock issuable upon the conversion of the Series D preferred stock held by The Ampex Retirement Master Trust. In his capacity as a Managing Director of Brookside Equity Partners LLC, the manager of BEP III LLC, BEP III Co-Invest LLC and SQ Co-Investors LLC, Mr. Weldon exercises shared voting and investment control over the above-listed securities. In his capacity as a member of the board of directors of Park AQ Pension Management, Inc., the investment adviser to The Ampex Retirement Master Trust, Mr. Weldon also exercises shared voting and investment control over the securities held by that entity. Mr. Weldon disclaims beneficial ownership of the shares held by these entities, except to the extent of his pecuniary interest therein. |
-134-
Table of Contents
| (9) | Includes 16,161,483 shares of common stock, 528,576 shares of common stock issuable upon the conversion of the Series A preferred stock, 448,896 shares of common stock issuable upon the conversion of the Series B preferred stock, and 233,488 shares of common stock issuable upon the conversion of the Series C preferred stock held by our executive directors and officers. Also includes 1,295,300 shares of common stock subject to options exercisable within 60 days of May 15, 2020. |
| (10) | Includes 320,000 shares of common stock subject to options exercisable within 60 days of May 15, 2020 and 4,729,952 shares of common stock beneficially owned by Mr. Paulsen and Ms. Paulsen as co-trustees of the David and Sally Paulsen 2019 Trust. David Paulsen is a former director and employee of the Company. |
| (11) | Includes 3,033,752 shares of common stock and 48,648 shares of common stock issuable upon the conversion of the Series A preferred stock beneficially owned by Mr. Gamble and Ms. Gamble as co-trustees of the Gamble Family Trust, and 1,773,024 shares of common stock beneficially owned by Ms. Gamble as trustee of the Laura Grant Gamble Family Irrevocable Trust. |
| (12) | Includes 851,856 shares of common stock held directly by Mr. Grant, 1,600,000 shares of common stock beneficially owned by Mr. Grant as the trustee of the Joseph Michael Grant Irrevocable Trust, 37,112 shares of common stock issuable upon the conversion of the Series A preferred stock held by Mr. Grant and 507,629 shares of common stock beneficially owned by Mr. Grant through Haakon Capital LLC, an investment company in which Mr. Grant owns a 33.3% ownership stake. Mr. Grant disclaims beneficial ownership of the shares held by Haakon Capital LLC, except to the extent of his pecuniary interest therein. Without giving effect to these shares, Mr. Grant would have beneficial ownership of 2,488,968 shares of the Company’s common stock, representing 1.72% of our common stock outstanding as of May 15, 2020. |
| (13) | Includes 93,056 shares of common stock held directly by Ms. Petri and Mr. Klein and 1,043,312 shares of common stock, 778,328 shares of common stock issuable upon the conversion of the Series A preferred stock, 291,864 shares of common stock issuable upon the conversion of the Series B preferred stock and 121,608 shares of common stock issuable upon the conversion of the Series C preferred stock held by the Jonathan T. Klein Benefits Trust, of which Mr. Klein is the beneficiary. |
| (14) | The business address for Haakon Capital LLC is 9800 Metcalf Ave., Suite 500, Overland Park, KS 66212. Mr. William Grant III, the Company’s Chief Operating Officer, Mr. Joseph Grant, and Mr. Robert Grant, the President of the Company’s Senior Segment, each own a 33.3% ownership stake in Haakon Capital LLC. |
| (15) | Includes 1,058,456 shares of common stock and 31,186 shares of common stock issuable upon the conversion of the Series A preferred stock. |
| (16) | Includes 858,208 shares of common stock and 58,368 shares of common stock issuable upon the conversion of the Series A preferred stock. Ms. Singh is the spouse of Charan Singh, a former director and employee of the Company. |
| (17) | Includes 843,144 shares of common stock and 49,456 shares of common stock issuable upon the conversion of the Series A preferred stock. The business address for Seguro Investments, LLC is 250 N. Water St., Suite 300, Wichita, KS 67202. Mr. John Bowen and Mr. Matthew Bowen serve as the Managers of Seguro Investments, LLC and exercise voting and investment control over the securities held by that entity. |
| (18) | Includes 177,440 shares of common stock held directly by Mr. Williams and 535,136 shares of common stock beneficially owned by Mr. Williams through his Mainstar Trust IRA. |
| (19) | Includes 281,128 shares of common stock and 320,000 shares of common stock subject to options exercisable within 60 days of March 10, 2020 beneficially owned by Ms. Long as the trustee of the Nancy Malik Long Separate Property Trust. |
| (20) | Includes 343,880 shares of common stock and 200,000 shares of common stock subject to options exercisable within 60 days of May 15, 2020. |
| (21) | Includes 466,736 shares of common stock and 58,368 shares of common stock issuable upon the conversion of the Series B preferred stock beneficially owned by Mr. Bright and Ms. Starkman as co-trustees of the Bright & Starkman Revocable Trust. |
| (22) | Includes 224,000 shares of common stock, 229,984 shares of common stock issuable upon the conversion of the Series B preferred stock and 46,000 shares of common stock issuable upon the conversion of the Series C preferred stock beneficially owned by Mr. Garr and Ms. Kalman as co-trustees of the W. Randall Garr and Laura Kalman Living Trust. |
| (23) | Includes 92,736 shares of common stock and 321,056 shares of common stock issuable upon the conversion of the Series A preferred stock. |
-135-
Table of Contents
| (24) | Includes 384,368 shares of common stock beneficially owned by Ms. Miller as trustee of the Kathryn R. Miller Revocable Trust. |
| (25) | Includes 199,352 shares of common stock, 35,608 shares of common stock issuable upon the conversion of the Series A preferred stock and 116,752 shares of common stock issuable upon the conversion of the Series B preferred stock beneficially owned by Mr. Freeman and Ms. Freeman as co-trustees of the Gerald Freeman and Virginia Freeman Living Trust. |
| (26) | Includes 209,960 shares of common stock and 46,695 shares of common stock subject to options exercisable within 60 days of May 15, 2020. |
| (27) | The business address for Bowen Investments, LLC is 520 West Pennway, Suite 300, Kansas City, MO 64108. Mr. Robert D. Young serves as the President of Murfin, Inc. and Mr. David L. Murfin serves as its Chairman and CEO. Murfin, Inc. is the Manager of Bowen Investments, LLC and exercises voting and investment control over the securities held by that entity. |
| (28) | Includes 173,336 shares of common stock beneficially owned by Mr. Kramlich as trustee of the Kramlich Living Trust. |
| (29) | Includes 160,992 shares of common stock beneficially owned by Ms. Weich as trustee of the Caralee Weich Revocable Living Trust. |
| (30) | Includes 31,984 shares of common stock, 97,288 shares of common stock issuable upon the conversion of the Series A preferred stock and 29,184 shares of common stock issuable upon the conversion of the Series B preferred stock. |
| (31) | Includes 31,984 shares of common stock, 97,288 shares of common stock issuable upon the conversion of the Series A preferred stock and 29,184 shares of common stock issuable upon the conversion of the Series B preferred stock. |
| (32) | Includes 32,184 shares of common stock, 97,288 shares of common stock issuable upon the conversion of the Series A preferred stock and 12,160 shares of common stock issuable upon the conversion of the Series B preferred stock beneficially owned by Ms. Lovett and Mr. Lovett as co-trustees of the Donna and Allen Revocable Trust. |
| (33) | Includes 79,152 shares of common stock and 60,000 shares of common stock subject to options exercisable within 60 days of May 15, 2020. |
| (34) | Includes 118,296 shares of common stock beneficially owned by Mr. McAllister through his Mainstar Trust IRA. |
| (35) | Includes 112,664 shares of common stock beneficially owned by Mr. Mize and Ms. Mize as co-trustees of the John H. Mize, Jr. and Cheryl L. Mize Trust. |
| (36) | Includes 88,800 shares of common stock held directly by Mr. Stephens and 88,800 shares of common stock held directly by Ms. Stephens. |
| (37) | Includes 20,000 shares of common stock held directly by Mr. Connor, 62,168 shares of common stock beneficially owned by Mr. Connor and Ms. Connor through MBC Holdings, LLC, an investment company owned by Mr. Connor and Ms. Connor and 16,896 shares of common stock beneficially owned by Mr. Connor through his Mainstar Trust IRA. |
| (38) | Consists of selling stockholder employees not otherwise listed in this table who collectively own less than 1% of our common stock. Includes 911,328 shares of common stock, 18,184 shares of common stock issuable upon the conversion of the Series B preferred stock and 265,439 shares of common stock that such selling stockholders have the right to acquire pursuant to options exercisable within 60 days of May 15, 2020. |
| (39) | Consists of selling stockholder former employees not otherwise listed in this table who collectively own less than 1% of our common stock. Includes 860,384 shares of common stock, 3,888 shares of common stock issuable upon the conversion of the Series A preferred stock, 36,808 shares of common stock issuable upon the conversion of the Series B preferred stock and 118,792 shares of common stock that such selling stockholders have the right to acquire pursuant to options exercisable within 60 days of May 15, 2020. |
| (40) | Consists of selling stockholders not otherwise listed in this table (or included in the groups indicated in footnotes 38 and 39 to this table) who collectively own less than 1% of our common stock. Includes 1,231,864 shares of common stock, 1,968 shares of common stock issuable upon the conversion of the Series A preferred stock and 129,448 shares of common stock issuable upon the conversion of the Series B preferred stock. |
-136-
Table of Contents
DESCRIPTION OF CERTAIN INDEBTEDNESS
The following is a summary of the material terms of certain indebtedness of us and our subsidiaries. The summary is qualified in its entirety by reference to the full text of the agreements governing the terms of such indebtedness, which are filed as exhibits to the registration statement of which this prospectus is a part.
Senior Secured Credit Facilities
On November 5, 2019, we entered into a credit agreement (the “Credit Agreement”) with Morgan Stanley Capital Administrators, Inc., as lender and administrative agent, UMB Bank N.A., as lender and revolver agent, and the other lenders party thereto, providing for (i) a $75.0 million senior secured revolving credit facility (the “Revolving Credit Facility”) and (ii) a $425.0 million senior secured term loan (the “Term Loan” and, together with the Revolving Credit Facility, the “Senior Secured Credit Facilities”). Proceeds from the Term Loans may be used to pay dividends, purchase shares or otherwise return capital to stockholders in an amount not to exceed $325.0 million and for general corporate purposes. A portion of the proceeds of the Term Loans were used to fund an account of the Company (which the Company cannot make withdrawals from or otherwise direct the disposition of funds from (other than the payment of interest on the Term Loans)) (such account, the “Specified Deposit Account”) holding two years of interest payments on the Term Loans. The Revolving Credit Facility is available for general corporate purposes and includes a letter of credit sub-facility of up to $5.0 million. The Senior Secured Credit Facilities also include an uncommitted incremental facility, which, subject to certain conditions, provides for additional term loans or an increase of existing term loans and/or an increase in commitments under the Revolving Credit Facility, in each case, in an aggregate amount of up to $100.0 million. Notwithstanding the foregoing, the aggregate amount of increases in commitments under the Revolving Credit Facility may not exceed $15.0 million. As of the date of this prospectus, the aggregate principal amount of the Term Loan is $425.0 million and our borrowing capacity under the Revolving Credit Facility is $75.0 million.
Interest Rates and Fees
The Term Loan bears interest on the outstanding principal amount thereof at a rate per annum equal to either (a) LIBOR plus 6.00% or (b) a base rate plus 5.00%, at our option; provided that, on and after the first business day of the first fiscal quarter commencing after the date on which a qualifying underwritten primary public offering has occurred and we have prepaid at least $150.0 million of aggregate principal amount of Term Loans, the Term Loan bears interest on the outstanding principal amount thereof at a rate per annum equal to either (a) LIBOR plus 5.50% or (b) a base rate plus 4.50%, at our option.
The Revolving Credit Facility accrues interest on amounts drawn at a rate per annum equal to either (a) LIBOR plus 4.00% or (b) a base rate plus 3.00%, at our option. The Term Loan will be mandatorily repayable beginning from March 31, 2022 in equal quarterly installments in an aggregate annual amount equal to 1% of the original principal amount of the Initial Term Loan (as defined in the Credit Agreement), with the balance payable on the maturity date, which is November 5, 2024.
In addition to paying interest on outstanding principal amounts under the Senior Secured Credit Facilities, we are required to pay a commitment fee, in respect of the unutilized commitments under the Revolving Credit Facility, equal to the daily balance of the Aggregate Revolving Loan Commitment (as defined in the Credit Agreement) during the preceding calendar month, less the sum of (x) the daily balance of all Revolving Loans (as defined in the Credit Agreement) plus (y) the daily amount of aggregate Letter of Credit Obligations (as defined in the Credit Agreement) during such preceding calendar month, multiplied by 15 basis points (0.15%) per annum. We are also required to pay customary letter of credit fees.
To help manage borrowing costs, we entered into an interest rate swap on May 12, 2020 to mitigate the variability in cash flows on our debt-related interest payments. That swap was designated as an accounting cash flow hedge.
-137-
Table of Contents
Mandatory Prepayments
Subject to certain exceptions and limitations, the Credit Agreement requires us to prepay the Term Loan with:
| (a) | 100% of the net proceeds of non-permitted debt incurrences; |
| (b) | 100% of net asset sale proceeds (including insurance and condemnation events), subject to customary exceptions and reinvestment rights; |
| (c) | 50% of annual excess cash flow (as defined in the Credit Agreement); and |
| (d) | 25% of the net proceeds to the Company from this offering or any follow-on offering, not to exceed $150.0 million. |
Security and Guarantees
Our obligations under the Senior Secured Credit Facilities are guaranteed by our domestic subsidiaries, subject to certain exceptions. All obligations under the Senior Secured Credit Facilities and the related guarantees are secured by a first priority lien on substantially all of our and our guarantors’ tangible and intangible assets, in each case, subject to permitted liens and certain exceptions. The Revolving Credit Facility is super senior in right of payment from the proceeds of any collateral (other than the proceeds of the Specified Deposit Account).
Covenants
The Senior Secured Credit Facilities contain customary affirmative and negative covenants, including limitations on liens; limitations on dispositions of assets; limitations on certain fundamental changes (including, without limitation, mergers, consolidations, liquidations and dissolutions); limitations on investments, loans, advances and acquisitions; limitations on indebtedness; limitations on transactions with affiliates; limitations on dividends, other payments in respect of capital stock and other restricted payments; limitations on changes in lines of business; limitations on changes in accounting treatment or reporting practices, fiscal periods and jurisdiction of organization; limitations on agreements restricting liens and/or dividends; and limitations on prepayments of subordinated indebtedness. In addition, the Senior Secured Credit Facilities contain a financial maintenance covenant, which is tested on the last day of each fiscal quarter, requiring that our Asset Coverage Ratio (as defined in the Credit Agreement) not exceed a range starting at 0.85:1.00 at the end of the first quarter and 2.60:1.00 at the end of the last quarter.
Events of Default
Events of default under the Senior Secured Credit Facilities include, among other things, nonpayment of principal when due; nonpayment of interest, fees or other amounts when due; cross-defaults; covenant defaults; material inaccuracy of representations and warranties; bankruptcy or insolvency events; monetary judgments in an amount agreed; certain ERISA events; or a change of control.
-138-
Table of Contents
The following description summarizes the most important terms of our capital stock, as they are expected to be in effect upon the consummation of this offering. We expect to adopt a sixth amended and restated certificate of incorporation and amended and restated bylaws in connection with this offering, and this description summarizes the provisions that are expected to be included in such documents. This description is not complete and is qualified by reference to the full text of our sixth amended and restated certificate of incorporation and amended and restated bylaws, the forms of which are filed as exhibits to the registration statement of which this prospectus is a part, as well as the applicable provisions of the DGCL.
General
Following the closing of this offering, our authorized capital stock will consist of 700,000,000 shares of common stock, par value $0.01 per share, and 70,000,000 shares of preferred stock, par value $0.01 per share.
As of the date of this prospectus, assuming the automatic conversion of all outstanding shares of our Series A, B, C, D and E preferred stock into an aggregate of 52,404,685 shares of common stock upon the completion of this offering, there were 144,650,597 shares of common stock outstanding, held by 414 stockholders of record and no shares of preferred stock outstanding.
Common Stock
Each holder of our common stock will be entitled to one vote for each share on all matters to be voted upon by the common stockholders, and there will be no cumulative voting rights. Subject to any preferential rights of any outstanding preferred stock, holders of our common stock will be entitled to receive ratably the dividends, if any, as may be declared from time to time by our Board of Directors out of funds legally available for that purpose. If there is a liquidation, dissolution or winding up of our Company, holders of our common stock would be entitled to ratable distribution of our assets remaining after the payment in full of liabilities and any preferential rights of any outstanding preferred stock.
Holders of our common stock will have no preemptive or conversion rights or other subscription rights, and there are no redemption or sinking fund provisions applicable to the common stock. After the initial public offering, all outstanding shares of our common stock will be fully paid and non-assessable. The rights, preferences and privileges of the holders of our common stock are subject to, and may be adversely affected by, the rights of the holders of shares of any series of preferred stock that we may designate and issue in the future.
Preferred Stock
Under the terms of our sixth amended and restated certificate of incorporation, our Board of Directors will be authorized, subject to limitations prescribed by the DGCL and by our sixth amended and restated certificate of incorporation, to issue up to 70,000,000 shares of preferred stock in one or more series without further action by the holders of our common stock. Our Board of Directors will have the discretion, subject to limitations prescribed by the DGCL and by our sixth amended and restated certificate of incorporation, to determine the rights, preferences, privileges and restrictions, including voting rights, dividend rights, conversion rights, redemption privileges and liquidation preferences, of each series of preferred stock. We have no current plans to issue any shares of preferred stock.
Anti-Takeover Effects of Various Provisions of Delaware Law and Our Sixth Amended and Restated Certificate of Incorporation and Amended and Restated Bylaws
Provisions of the DGCL and our sixth amended and restated certificate of incorporation and amended and restated bylaws could make it more difficult to acquire SelectQuote by means of a tender offer, a proxy contest or otherwise, or to remove incumbent officers and directors. These provisions, summarized below, may discourage
-139-
Table of Contents
certain types of coercive takeover practices and takeover bids that our Board of Directors may consider inadequate and to encourage persons seeking to acquire control of the Company to first negotiate with our Board of Directors. SelectQuote believes that the benefits of increased protection of its ability to negotiate with the proponent of an unfriendly or unsolicited proposal to acquire or restructure it outweigh the disadvantages of discouraging takeover or acquisition proposals because, among other things, negotiation of these proposals could result in an improvement of their terms.
Delaware Anti-Takeover Statute
As a Delaware corporation, SelectQuote will be subject to Section 203 of the DGCL regarding corporate takeovers. In general, Section 203 of the DGCL prohibits a publicly held Delaware corporation from engaging in a “business combination” with an “interested stockholder” for a period of three years following the time the person became an interested stockholder, unless:
| • | prior to the date of the transaction, the board of directors of such corporation approved either the business combination or the transaction that resulted in the stockholder becoming an interested stockholder; |
| • | upon completion of the transaction that resulted in the stockholder becoming an interested stockholder, the interested stockholder owned at least 85% of the voting stock of the corporation outstanding at the time such transaction commenced, excluding, for purposes of determining the number of shares outstanding, (a) shares owned by persons who are directors and also officers of the corporation and (b) shares owned by employee stock plans in which employee participants do not have the right to determine confidentially whether shares held subject to the plan will be tendered in a tender or exchange offer; or |
| • | on or subsequent to such time the business combination is approved by the board of directors of such corporation and authorized at a meeting of stockholders by the affirmative vote of at least two-thirds of the outstanding voting stock of such corporation not owned by the interested stockholder. |
In this context, a “business combination” includes a merger, asset or stock sale, or other transaction resulting in a financial benefit to the interested stockholder. An “interested stockholder” is a person who, together with affiliates and associates, owns or, within three years prior to the determination of interested stockholder status owned, 15% or more of a corporation’s outstanding voting stock. The existence of this provision would be expected to have an anti-takeover effect with respect to transactions not approved in advance by our Board of Directors, including discouraging attempts that might result in a premium over the market price for the shares of common stock held by our stockholders.
A Delaware corporation may “opt out” of Section 203 with an express provision in its original certificate of incorporation or an express provision in its certificate of incorporation or bylaws resulting from amendments approved by holders of at least a majority of the corporation’s outstanding voting shares. We will not elect to “opt out” of Section 203. However, following this offering and subject to certain restrictions, we may elect to “opt out” of Section 203 by an amendment to our certificate of incorporation or bylaws.
Classified Board
Our sixth amended and restated certificate of incorporation and amended and restated bylaws will provide that our Board of Directors will be divided into three classes, each of which is expected to be composed initially of two or three directors. The directors designated as Class I directors will have terms expiring at the first annual meeting of stockholders following the completion of this offering, which we expect to hold in 2020. The directors designated as Class II directors will have terms expiring at the following year’s annual meeting of stockholders, which we expect to hold in 2021, and the directors designated as Class III directors will have terms expiring at the following year’s annual meeting of stockholders, which we expect to hold in 2022. Commencing
-140-
Table of Contents
with the first annual meeting of stockholders following the completion of this offering, which we expect to hold in 2020, directors for each class will be elected at the annual meeting of stockholders held in the year in which the term for that class expires and thereafter will serve for a term of three years. At any meeting of stockholders for the election of directors at which a quorum is present, the election will be determined by a plurality of the votes cast by the stockholders entitled to vote in the election. Under the classified board provisions, it may take two elections of directors for any individual or group to gain control of our Board of Directors. Accordingly, these provisions could discourage a third party from initiating a proxy contest, making a tender offer or otherwise attempting to gain control of SelectQuote.
Removal of Directors
Our sixth amended and restated certificate of incorporation will provide that our stockholders may remove our directors only for cause, by an affirmative vote of holders of at least a majority of the voting power of the then-outstanding shares of voting stock.
Amendments to Certificate of Incorporation and Bylaws
Our sixth amended and restated certificate of incorporation will provide that it may be amended or altered in any manner provided by the DGCL. Our amended and restated bylaws may be adopted, amended, altered or repealed by stockholders upon the approval of at least two-thirds of the voting power of all of the then-outstanding shares of stock entitled to vote at an election of directors. Additionally, our sixth amended and restated certificate of incorporation and our amended and restated bylaws will provide that our bylaws may be adopted, amended, altered or repealed by the Board of Directors.
Size of Board and Vacancies
Our sixth amended and restated certificate of incorporation and our amended and restated bylaws will provide that the number of directors on our Board of Directors will be fixed exclusively by our Board of Directors. Any vacancies on our Board of Directors resulting from any increase in the authorized number of directors or the death, resignation, retirement, disqualification, removal from office or other cause will be filled by a majority of the Board of Directors then in office, whether or not less than a quorum. Our sixth amended and restated certificate of incorporation and our amended and restated bylaws will provide that any director appointed to fill a vacancy on our Board of Directors will hold office for a term expiring at the annual meeting of stockholders at which the term of office of the class to which he or she been appointed expires and until such director’s successor shall have been duly elected and qualified.
Special Stockholder Meetings
Our amended and restated bylaws will provide that only the chairman of the Board of Directors, the chief executive officer or an officer at the request of a majority of the members of the Board of Directors pursuant to a resolution approved by the Board of the Directors may call special meetings of SelectQuote stockholders. Stockholders may not call special stockholder meetings.
Stockholder Action by Written Consent
Our sixth amended and restated certificate of incorporation will expressly prohibit the right of our stockholders to act by written consent. From and after the effectiveness of our sixth amended and restated certificate of incorporation, stockholder action must take place at the annual or a special meeting of SelectQuote stockholders.
-141-
Table of Contents
Requirements for Advance Notification of Stockholder Nominations and Proposals
Our amended and restated bylaws will establish advance notice procedures with respect to stockholder proposals and nomination of candidates for election as directors, as well as minimum qualification requirements for stockholders making the proposals or nominations. Additionally, our amended and restated bylaws will require that candidates nominated by stockholders for election as director disclose their qualifications and make certain representations, including that (a) they are not a party to any undisclosed voting commitment, any voting commitment that could interfere with their ability to fulfill their fiduciary duties as a director of SelectQuote, should they be elected, or any undisclosed agreement pursuant to which they would receive compensation, reimbursement or indemnification in connection with their service as a director of SelectQuote, (b) they will be in compliance, should they be elected, with the Company’s corporate governance guidelines and the Company’s conflict of interest, confidentiality and stock ownership and trading policies and (c) they will abide by the procedures for the election of directors in our amended and restated bylaws.
No Cumulative Voting
The DGCL provides that stockholders will not have the right to cumulate votes in the election of directors unless the company’s certificate of incorporation provides otherwise. Our sixth amended and restated certificate of incorporation will not provide for cumulative voting.
Undesignated Preferred Stock
The authority that our Board of Directors will possess to issue preferred stock could potentially be used to discourage attempts by third parties to obtain control of SelectQuote through a merger, tender offer, proxy contest or otherwise by making such attempts more difficult or more costly. Our Board of Directors may be able to issue preferred stock with voting rights or conversion rights that, if exercised, could adversely affect the voting power of the holders of common stock.
Corporate Opportunities
Our sixth amended and restated certificate of incorporation provides that, to the fullest extent permitted by law, we have, on behalf of ourselves, our stockholders and any of our and their respective affiliates, renounced any interest or expectancy in, or in being notified of or offered an opportunity to participate in, any business opportunity that may be presented to our directors that are not our employees or to any of their affiliates, partners or other representatives, and that no such person has any duty to communicate or offer such business opportunity to us or any of our affiliates or stockholders or shall be liable to us or any of our affiliates or stockholders for breach of any duty, as a director or otherwise, by reason of the fact that such person pursues or acquires such business opportunity, directs such business opportunity to another person or fails to present such business opportunity, or information regarding such business opportunity, to us or any of our affiliates or stockholders, unless, in the case of any such person who is a director of our Company, such business opportunity is expressly offered to such director solely in his or her capacity as a director of our Company.
Limitations on Liability, Indemnification of Officers and Directors and Insurance
Elimination of Liability of Directors
The DGCL authorizes corporations to limit or eliminate the personal liability of directors to corporations and their stockholders for monetary damages for breaches of directors’ fiduciary duties as directors, and our sixth amended and restated certificate of incorporation will include such an exculpation provision. Our sixth amended and restated certificate of incorporation will provide that, to the fullest extent permitted by the DGCL, no director will be personally liable to us or to our stockholders for monetary damages for breach of fiduciary duty as a director. While our sixth amended and restated certificate of incorporation will provide directors with protection from awards for monetary damages for breaches of their duty of care, it will not eliminate this duty. Accordingly,
-142-
Table of Contents
our sixth amended and restated certificate of incorporation will have no effect on the availability of equitable remedies such as an injunction or rescission based on a director’s breach of his or her duty of care. The provisions of our sixth amended and restated certificate of incorporation described above apply to an officer of SelectQuote only if he or she is a director of SelectQuote and is acting in his or her capacity as director, and do not apply to officers of SelectQuote who are not directors.
Indemnification of Directors, Officers and Employees
Our sixth amended and restated certificate of incorporation and our amended and restated bylaws will require us to indemnify any person who was or is a party or is threatened to be made a party to or is otherwise involved in any threatened, pending or completed action, suit or proceeding by reason of the fact that he or she is or was a director or officer of SelectQuote, or is or was serving at the request of SelectQuote as a director, officer, trustee, employee or agent of another corporation or of a partnership, joint venture, trust or other enterprise, including service with respect to employee benefit plans maintained or sponsored by SelectQuote, against all expense, liability and loss (including attorneys’ fees, judgments, fines, ERISA excise taxes or penalties and amounts paid or to be paid in settlement) incurred or suffered by such person in connection with such proceeding if the person acted in good faith and in a manner reasonably believed to be in or not opposed to the best interests of SelectQuote, and, with respect to any criminal action or proceeding, had no reasonable cause to believe his or her conduct was unlawful.
We will be authorized under our sixth amended and restated certificate of incorporation and our amended and restated bylaws to purchase and maintain insurance to protect SelectQuote and any current or former director, officer, employee or agent of SelectQuote or another corporation, partnership, joint venture, trust or other enterprise against any expense, liability or loss, whether or not SelectQuote would have the power to indemnify such person against such expense, liability or loss under the DGCL.
We intend to enter into an indemnification agreement with each of our directors and officers. The indemnification agreements will provide that we will indemnify each indemnitee to the fullest extent permitted by the DGCL from and against all loss and liability suffered and expenses, judgments, fines and amounts paid in settlement incurred in connection with defending, investigating or settling any threatened, pending, or completed action, suit or proceeding related to the indemnitee’s service with the Company. Additionally, we will agree to advance to the indemnitee expenses incurred in connection therewith.
The limitation of liability and indemnification provisions in these indemnification agreements and our sixth amended and restated certificate of incorporation and amended and restated bylaws may discourage stockholders from bringing a lawsuit against our directors for breach of fiduciary duty. These provisions also may reduce the likelihood of derivative litigation against our directors and officers, even though such an action, if successful, might otherwise benefit us and our stockholders. In addition, your investment in our common stock may be adversely affected to the extent we pay the costs of settlement and damage awards under these indemnification provisions. There is currently no pending material litigation or proceeding against any SelectQuote directors or officers for which indemnification is sought.
Exclusive Forum
Our sixth amended and restated certificate of incorporation will provide that, unless the Board of Directors otherwise determines, the state courts located within the State of Delaware or, if no state court located in the State of Delaware has jurisdiction, the federal court for the District of Delaware, will be the sole and exclusive forum for any derivative action or proceeding brought on behalf of SelectQuote, any action asserting a claim of breach of a fiduciary duty owed by any director or officer of SelectQuote to SelectQuote or our stockholders, any action asserting a claim against SelectQuote or any director or officer of SelectQuote arising pursuant to any provision of the DGCL or our sixth amended and restated certificate of incorporation or amended and restated bylaws, or any action asserting a claim against SelectQuote or any director or officer of SelectQuote governed by
-143-
Table of Contents
the internal affairs doctrine. Under our sixth amended and restated certificate of incorporation, to the fullest extent permitted by law, this exclusive forum provision will apply to all actions asserting covered Delaware state law claims, including any other claims, such as federal securities law claims, that a stockholder chooses to bring in the same action. This exclusive forum provision does not apply to actions that do not assert any covered Delaware state law claims, such as, for example, any action asserting solely federal securities law claims.
Authorized but Unissued Shares
Our authorized but unissued shares of common stock and preferred stock will be available for future issuance without your approval. We may use additional shares for a variety of purposes, including future public offerings to raise additional capital, to fund acquisitions and as employee compensation. The existence of authorized but unissued shares of common stock and preferred stock could render more difficult or discourage an attempt to obtain control of SelectQuote by means of a proxy contest, tender offer, merger or otherwise.
Stock Options
As of the date of this prospectus, options to purchase 4,095,968 shares of common stock were outstanding under the 2003 Stock Plan at a weighted-average exercise price of $1.03 per share, of which 3,456,350 shares were vested and exercisable at a weighted-average exercise price of $0.87 per share.
Series D Preferred Stock Rights
In 2014, in connection with the sale of shares of our Series D preferred stock, we entered into the Series D Preferred Stock Investors’ Rights and Stockholders Agreement with the Series D Holders, which grants the Series D Holders certain rights, including but not limited to certain preemptive rights, rights to put their shares of Series D preferred stock, director appointment rights, information rights and registration rights. On November 4, 2019, we entered into the Amended and Restated Series D Investors’ Rights and Stockholders Agreement, whereby, among other things, the Company agreed to classify the Board upon the consummation of a qualifying initial public offering and the Company granted the Series D Holders the right to appoint two directors to our Board (one to Class II and one to Class III) upon the consummation of such offering. On April 17, 2020, we entered into Amendment No. 1 to the Amended and Restated Series D Investors’ Rights and Stockholders Agreement, extending the maturity date for the Series D Holders’ right to put their shares of Series D preferred stock from January 31, 2025 to March 30, 2025.
Upon the closing of this offering, the foregoing rights will terminate other than certain information and registration rights afforded to the Series D Holders, which will survive pursuant to the terms of the Amended and Restated Series D Investors’ Rights and Stockholders Agreement.
Series E Preferred Stock Rights
On May 6, 2020 and May 14, 2020, in connection with the sale of shares of our Series E preferred stock, we entered into Investor Rights Letters with the Series E Holders, which grant the Series E Holders certain rights, including but not limited to certain preemptive rights and information rights. Upon the closing of this offering, these rights will terminate.
Transfer Agent and Registrar
The transfer agent and registrar for the common stock will be Computershare Trust Company, N.A.
Listing
We intend to apply to list our common stock on the NYSE under the symbol “SLQT.”
-144-
Table of Contents
SHARES ELIGIBLE FOR FUTURE SALE
Prior to this offering, there was no public market for the common stock. Future sales of substantial amounts of common stock in the public market, or the perception that such sales may occur, could adversely affect the market price of the common stock. Although we intend to apply to list our common stock on the NYSE, we cannot assure you that there will be an active public market for the common stock.
Upon the closing of this offering, we will have outstanding an aggregate of 162,650,597 shares of common stock, assuming (a) the issuance of 18,000,000 shares of common stock offered in this offering and (b) the automatic conversion of all outstanding shares of our Series A, B, C, D and E preferred stock into an aggregate of 52,404,685 shares of common stock upon the closing of this offering. Of these 162,650,597 shares, 25,000,000 shares of common stock sold in this offering will be freely tradable without restriction or further registration under the Securities Act, except for any shares purchased by our “affiliates,” as that term is defined in Rule 144 under the Securities Act and any shares purchased in this offering by participants in our directed share program who are subject to lock-up restrictions, whose sales would be subject to the restrictions described below.
The remaining shares of common stock outstanding upon completion of this offering will be “restricted securities,” as that term is defined in Rule 144 under the Securities Act. These restricted securities are eligible for public sale only if they are registered under the Securities Act or if they qualify for an exemption from registration under Rules 144 or 701 under the Securities Act, which are summarized below.
In addition, of the 4,095,968 shares of common stock that were subject to stock options outstanding as of the date of this prospectus, options to purchase 3,456,350 shares of common stock were vested as of the date of this prospectus, and the shares issued upon exercise will be eligible for public sale subject to the lock-up agreements and securities laws described below.
Lock-Up Agreements
We, the selling stockholders and each of our directors and certain stockholders have agreed that, without the prior written consent of Credit Suisse Securities (USA) LLC and Morgan Stanley & Co. LLC, as representative for the several underwriters, we and they will not, subject to limited exceptions, during the applicable 90 or 180-day restricted period:
| • | offer, pledge, sell, contract to sell, sell any option or contract to purchase, purchase any option or contract to sell, grant any option, right or warrant to purchase, lend, or otherwise transfer or dispose of, directly or indirectly, any shares of our common stock beneficially owned by them or any other securities so owned that are convertible into or exercisable or exchangeable for shares of our common stock; |
| • | file any registration statement with the SEC relating to the offering of any shares of common stock or any securities convertible into or exercisable or exchangeable for shares of common stock; or |
| • | enter into any swap or other arrangement that transfers to another, in whole or in part, any of the economic consequences of ownership of shares of our common stock, |
whether any such transaction described above is to be settled by delivery of common stock or such other securities, in cash or otherwise. In addition, we and each such person have agreed that, without the prior written consent of Credit Suisse Securities (USA) LLC and Morgan Stanley & Co. LLC on behalf of the underwriters, we or such other person will not, during the applicable 90 or 180-day restricted period, make any demand for, or exercise any right with respect to, the registration of any shares of common stock or any security convertible into or exercisable or exchangeable for shares of common stock. None of our other stockholders is subject to any such restrictions and, accordingly, common stock or other securities held by these other stockholders may be transferred or disposed of, to or through any broker-dealer, at any time during or following this offering, subject to such stockholder’s compliance with applicable securities laws.
-145-
Table of Contents
The foregoing restrictions will remain in effect for 90 days following the date of this prospectus with respect to the Series E Restricted Shares, which together represent 2.56% of our outstanding shares of common stock after this offering, and for 180 days following the date of this prospectus with respect to all other shares of our common stock subject to the lock-up agreement described above.
Credit Suisse Securities (USA) LLC and Morgan Stanley & Co. LLC, in their sole discretion as representatives, may release the common stock and other securities subject to the lock-up agreements described above in whole or in part at any time. Subject to certain exceptions, in the event that Credit Suisse Securities (USA) LLC and Morgan Stanley & Co. LLC grant such a release with respect to all or a portion of another holder’s shares, the same percentage of the Series E Restricted Shares will be automatically released from their lock-up restrictions.
These agreements are subject to certain exceptions, as described in the section of this prospectus entitled “Underwriting (Conflicts of Interest).”
Upon the expiration of the applicable lock-up periods, substantially all of the shares subject to such lock-up restrictions will become eligible for sale, subject to the limitations discussed above.
Rule 144
Affiliate Resales of Restricted Securities
In general, beginning 90 days after the effective date of the registration statement for this offering, a person who is an affiliate of ours, or who was an affiliate at any time during the 90 days before a sale, who has beneficially owned shares of our capital stock for at least six months would be entitled to sell in “broker’s transactions” or certain “riskless principal transactions” or to market makers, a number of shares within any three-month period that does not exceed the greater of:
| • | 1% of the total number of then-outstanding shares of the class of security sold, which will equal, immediately after this offering, approximately 1,626,506 shares of common stock; or |
| • | the average weekly trading volume in the class of security sold on the NYSE during the four calendar weeks preceding the filing of a notice on Form 144 with respect to such sale. |
Affiliate resales under Rule 144 are also subject to the availability of current public information about us.
Non-Affiliate Resales of Restricted Securities
In general, beginning 90 days after the effective date of the registration statement for this offering, a person who is not an affiliate of ours at the time of sale, and has not been an affiliate at any time during the three months preceding a sale, and who has beneficially owned shares of our capital stock for at least six months but less than a year, is entitled to sell such shares subject only to the availability of current public information about us. If such person has held our shares for at least one year, such person can resell under Rule 144(b)(1) without regard to any Rule 144 restrictions, including the 90-day public company requirement and the current public information requirement.
Non-affiliate resales are not subject to the manner of sale, volume limitation or notice filing provisions of Rule 144.
Rule 701
In general, under Rule 701, any of our employees, directors, officers, consultants or advisors who purchased shares from us in connection with a compensatory stock or option plan or other written agreement before the
-146-
Table of Contents
effective date of a registration statement under the Securities Act are entitled to sell such shares 90 days after such effective date in reliance on Rule 144. An affiliate of ours can resell shares in reliance on Rule 144 without having to comply with the holding period requirement, and non-affiliates of ours can resell shares in reliance on Rule 144 without having to comply with the current public information and holding period requirements.
The SEC has indicated that Rule 701 will apply to typical stock options granted before we become subject to the reporting requirements of the Exchange Act, along with the shares acquired upon exercise of such options, including exercises after we become subject to the reporting requirements of the Exchange Act.
Equity Plans
We intend to file one or more registration statements on Form S-8 under the Securities Act to register all shares of capital stock issued or issuable under the 2020 Plan. We expect to file that registration statement after the date of this prospectus, permitting the resale of such shares by non-affiliates in the public market without restriction under the Securities Act and the sale by affiliates in the public market, subject to compliance with the resale provisions of Rule 144, in each case subject to the lock-up agreements described above.
Registration Rights
Upon the closing of this offering, the holders of 28,028,306 shares of common stock will be entitled to various rights with respect to the registration of these shares under the Securities Act. Registration of these shares under the Securities Act would result in these shares becoming fully tradable without restriction under the Securities Act immediately upon the effectiveness of the registration statement for this offering, except for shares held by affiliates. See “Description of Capital Stock—Series D Preferred Stock Rights” for additional information. Shares covered by a registration statement will be eligible for sale in the public market upon the expiration or release from the terms of the lock-up agreement.
-147-
Table of Contents
MATERIAL U.S. FEDERAL INCOME TAX CONSIDERATIONS FOR NON-U.S. HOLDERS OF COMMON STOCK
The following is a general discussion of material U.S. federal income tax considerations with respect to the ownership and disposition of shares of our common stock applicable to non-U.S. holders who acquire such shares in this offering. This discussion is based on current provisions of the Code, U.S. Treasury regulations promulgated thereunder, administrative rulings of the IRS and court decisions, each as in effect as of the date hereof. All of these authorities are subject to change and differing interpretations, possibly with retroactive effect, and any such change or differing interpretation could result in U.S. federal income tax consequences different from those discussed below.
For purposes of this discussion, the term “non-U.S. holder” means a beneficial owner of our common stock that is not, for U.S. federal income tax purposes, a partnership or any of the following:
| • | an individual who is a citizen or resident of the United States; |
| • | a corporation created or organized in the United States or under the laws of the United States, any state thereof or the District of Columbia; |
| • | an estate, the income of which is includible in gross income for U.S. federal income tax purposes regardless of its source; or |
| • | a trust if (1) a court within the United States is able to exercise primary supervision over the administration of the trust and one or more U.S. persons have the authority to control all substantial decisions of the trust, or (2) it has a valid election in effect under applicable U.S. Treasury regulations to be treated as a U.S. person for U.S. federal income tax purposes. |
This discussion is limited to non-U.S. holders that acquire shares of our common stock pursuant to this offering and hold such shares as a capital asset within the meaning of Section 1221 of the Code (generally, property held for investment). This discussion does not address all aspects of U.S. federal income taxation that may be relevant to a non-U.S. holder in light of that non-U.S. holder’s particular circumstances or that may be applicable to non-U.S. holders subject to special treatment under U.S. federal income tax laws (including, for example, banks or other financial institutions, brokers or dealers in securities, traders in securities that elect mark-to-market treatment, insurance companies, “controlled foreign corporations,” “passive foreign investment companies,” tax-exempt entities, entities or arrangements treated as partnerships for U.S. federal income tax purposes or other “flow-through” entities and investors therein, certain former citizens or former long-term residents of the United States, holders who hold our common stock as part of a hedge, straddle, constructive sale or conversion transaction, and holders who own or have owned (directly, indirectly or constructively) five percent or more of our common stock (by vote or value)). In addition, this discussion does not address U.S. federal tax laws other than those pertaining to the U.S. federal income tax, nor does it address any aspects of the unearned income Medicare contribution tax pursuant to the Health Care and Education Reconciliation Act of 2010, any considerations in respect of the Foreign Account Tax Compliance Act of 2010 (including the U.S. Treasury regulations promulgated thereunder and intergovernmental agreements entered into pursuant thereto) or U.S. state, local or non-U.S. taxes. Prospective investors should consult with their own tax advisors regarding the U.S. federal, state, local, non-U.S. income and other tax considerations with respect to acquiring, holding and disposing of shares of our common stock.
If an entity or arrangement treated as a partnership for U.S. federal income tax purposes holds shares of our common stock, the tax treatment of a person treated as a partner in such partnership generally will depend on the status of the partner and the activities of the partnership. Persons that for U.S. federal income tax purposes are treated as a partnership or a partner in a partnership holding shares of our common stock should consult their tax advisors.
THIS DISCUSSION IS FOR GENERAL INFORMATION ONLY AND IS NOT INTENDED TO CONSTITUTE A COMPLETE DESCRIPTION OF ALL TAX CONSEQUENCES RELATING TO THE
-148-
Table of Contents
ACQUISITION, OWNERSHIP AND DISPOSITION OF OUR COMMON STOCK. PROSPECTIVE HOLDERS OF OUR COMMON STOCK SHOULD CONSULT WITH THEIR TAX ADVISORS REGARDING THE TAX CONSEQUENCES TO THEM OF THE ACQUISITION, OWNERSHIP AND DISPOSITION OF OUR COMMON STOCK, INCLUDING THE APPLICATION AND EFFECT OF ANY U.S. FEDERAL, STATE, LOCAL, NON-U.S. INCOME AND OTHER TAX LAWS.
Distributions
In general, subject to the discussion below regarding “effectively connected” dividends, the gross amount of any distribution we make to a non-U.S. holder with respect to its shares of our common stock will be subject to U.S. withholding tax at a rate of 30% to the extent the distribution constitutes a dividend for U.S. federal income tax purposes, unless the non-U.S. holder is eligible for an exemption from, or a reduced rate of, such withholding tax under an applicable income tax treaty and the non-U.S. holder provides proper certification of its eligibility for such exemption or reduced rate. A distribution with respect to shares of our common stock will constitute a dividend for U.S. federal income tax purposes to the extent of our current or accumulated earnings and profits, as determined for U.S. federal income tax purposes. To the extent any distribution does not constitute a dividend, it will be treated first as reducing the adjusted basis in the non-U.S. holder’s shares of our common stock and then, to the extent it exceeds the non-U.S. holder’s adjusted basis in its shares of our common stock, as gain from the sale or exchange of such stock. Any such gain will be subject to the treatment described below under “—Gain on Sale or Other Disposition of our Common Stock.”
Dividends we pay with respect to our common stock to a non-U.S. holder that are effectively connected with the conduct by such non-U.S. holder of a trade or business within the United States (or, if required by an applicable income tax treaty, are attributable to a permanent establishment or a fixed base of such non-U.S. holder in the United States) generally will not be subject to U.S. withholding tax, as described above, if the non-U.S. holder complies with applicable certification and disclosure requirements. Instead, such dividends generally will be subject to U.S. federal income tax on a net income basis, at the U.S. federal income tax rates applicable to U.S. citizens, nonresident aliens or domestic corporations, as applicable. Dividends received by a non-U.S. holder that is a corporation and that are effectively connected with its conduct of trade or business within the United States may be subject to an additional “branch profits tax” at a rate of 30% (or such lower rate as may be specified by an applicable income tax treaty).
Gain on Sale or Other Disposition of our Common Stock
Subject to the discussion below under the heading “—Informational Reporting and Backup Withholding,” in general, a non-U.S. holder will not be subject to U.S. federal income tax on any gain realized upon the sale or other disposition of the non-U.S. holder’s shares of our common stock unless:
| • | the gain is effectively connected with a trade or business carried on by the non-U.S. holder within the United States (or, if required by an applicable income tax treaty, is attributable to a permanent establishment or a fixed base of such non-U.S. holder in the United States); |
| • | the non-U.S. holder is an individual and is present in the United States for 183 days or more in the taxable year of disposition and certain other conditions are met; or |
| • | we are or have been a U.S. real property holding corporation (a “USRPHC”) for U.S. federal income tax purposes at any time during the shorter of the five-year period ending on the date of such disposition or such non-U.S. holder’s holding period of such shares of our common stock. |
Gain described in the first bullet immediately above generally will be subject to U.S. federal income tax on a net income tax basis, at the U.S. federal income tax rates applicable to U.S. citizens, nonresident aliens or domestic corporations, as applicable. A non-U.S. holder that is a corporation and that recognizes gain described in the first bullet immediately above may also be subject to branch profits tax at a rate of 30% (or such lower rate
-149-
Table of Contents
as may be specified by an applicable income tax treaty) with respect to such effectively connected gain. An individual non-U.S. holder described in the second bullet immediately above will be subject to a flat 30% tax (unless the non-U.S. holder is eligible for a lower rate under an applicable income tax treaty) on the gain from such sale or other disposition, which may be offset by U.S. source capital losses, if any, of the non-U.S. holder.
We believe we are not, and do not anticipate becoming, a USRPHC for U.S. federal income tax purposes. However, no assurance can be given that we are not or will not become a USRPHC. If we were or were to become a USRPHC, however, any gain recognized on a sale or other disposition of shares of our common stock by a non-U.S. holder that did not own (directly, indirectly or constructively) more than 5% of our common stock during the applicable period would not be subject to U.S. federal income tax, provided that our common stock is “regularly traded on an established securities market” (within the meaning of Section 897(c)(3) of the Code).
Informational Reporting and Backup Withholding
We must report annually to the IRS and to each non-U.S. holder the amount of dividends paid to such non-U.S. holder and the tax withheld with respect to such dividends. These reporting requirements apply regardless of whether withholding was reduced or eliminated by an applicable tax treaty.
A non-U.S. holder generally will be subject to backup withholding (currently at a rate of 24%) on dividends paid with respect to such non-U.S. holder’s shares of our common stock unless such holder certifies under penalties of perjury that, among other things, it is a non-U.S. holder (and the payor does not have actual knowledge or reason to know that such holder is a U.S. person as defined under the Code).
Information reporting and backup withholding generally is not required with respect to any proceeds from the sale or other disposition of our common stock by a non-U.S. holder outside of the United States through a foreign office of a foreign broker that does not have certain specified connections to the United States. However, if a non-U.S. holder sells or otherwise disposes of its shares of our common stock through a U.S. broker or the U.S. offices of a foreign broker, the broker will generally be required to report the amount of proceeds paid to the non-U.S. holder to the IRS, and may also be required to backup withhold on such proceeds unless such non-U.S. holder certifies under penalties of perjury that, among other things, it is a non-U.S. holder (and the payor does not have actual knowledge or reason to know that such holder is a U.S. person as defined under the Code). Information reporting will also apply if a non-U.S. holder sells its shares of our common stock through a foreign broker with certain specified connections to the United States, unless such broker has documentary evidence in its records that such non-U.S. holder is a non-U.S. person and certain other conditions are met, or such non-U.S. holder otherwise establishes an exemption (and the payor does not have actual knowledge or reason to know that such holder is a U.S. person as defined under the Code).
Copies of any information returns may also be made available to the tax authorities in the country in which the non-U.S. holder resides or is established under the provisions of an applicable income tax treaty or agreement.
Backup withholding is not an additional tax. Any amounts withheld under the backup withholding rules from a payment to a non-U.S. holder can be credited against the non-U.S. holder’s U.S. federal income tax liability, if any, or refunded, provided that the required information is furnished to the IRS in a timely manner. Non-U.S. holders should consult their tax advisors regarding the application of the information reporting and backup withholding rules to them.
-150-
Table of Contents
UNDERWRITING (CONFLICTS OF INTEREST)
Under the terms and subject to the conditions in an underwriting agreement dated the date of this prospectus, the underwriters named below, for whom Credit Suisse Securities (USA) LLC and Morgan Stanley & Co. LLC are acting as representatives, have severally agreed to purchase, and we and the selling stockholders have agreed to sell to them, severally, the number of shares indicated below:
| Name |
Number of Shares | |||
| Credit Suisse Securities (USA) LLC |
||||
| Morgan Stanley & Co. LLC |
||||
| Evercore Group L.L.C. |
||||
| RBC Capital Markets, LLC |
||||
| Barclays Capital Inc. |
||||
| Citigroup Global Markets Inc. |
||||
| Jefferies LLC |
||||
| Cantor Fitzgerald & Co. |
||||
| Keefe, Bruyette & Woods, Inc. |
||||
| Piper Sandler & Co. |
||||
| Drexel Hamilton, LLC |
||||
|
|
|
|||
| Total: |
25,000,000 | |||
The underwriters and the representatives are collectively referred to as the “underwriters” and the “representatives,” respectively. The underwriters are offering the shares of common stock subject to their acceptance of the shares from us and subject to prior sale. The underwriting agreement provides that the obligations of the several underwriters to pay for and accept delivery of the shares of common stock offered by this prospectus are subject to the approval of certain legal matters by their counsel and to certain other conditions. The underwriters are obligated to take and pay for all of the shares of common stock offered by this prospectus if any such shares are taken. However, the underwriters are not required to take or pay for the shares covered by the underwriters’ option to purchase additional shares described below.
The underwriters initially propose to offer part of the shares of common stock directly to the public at the offering price listed on the cover page of this prospectus and part to certain dealers at a price that represents a concession not in excess of $ per share under the public offering price. After the initial offering of the shares of common stock, the offering price and other selling terms may from time to time be varied by the representatives.
The selling stockholders have granted to the underwriters an option, exercisable for 30 days from the date of this prospectus, to purchase up to 3,750,000 additional shares of common stock at the public offering price listed on the cover page of this prospectus, less underwriting discounts and commissions. The underwriters may exercise this option solely for the purpose of covering over-allotments, if any, made in connection with the offering of the shares of common stock offered by this prospectus. To the extent the option is exercised, each underwriter will become obligated, subject to certain conditions, to purchase about the same percentage of the additional shares of common stock as the number listed next to the underwriter’s name in the preceding table bears to the total number of shares of common stock listed next to the names of all underwriters in the preceding table.
-151-
Table of Contents
The following table shows the per share and total public offering price, underwriting discounts and commissions, and proceeds before expenses to us and the selling stockholders. These amounts are shown assuming both no exercise and full exercise of the underwriters’ option to purchase up to an additional 3,750,000 shares of common stock.
| Total | ||||||||||||
| Per Share |
No Exercise |
Full Exercise |
||||||||||
| Public offering price |
$ | $ | $ | |||||||||
| Underwriting discounts and commissions to be paid by: |
||||||||||||
| Us |
$ | $ | $ | |||||||||
| The selling stockholders |
$ | $ | $ | |||||||||
| Proceeds, before expenses, to us |
$ | $ | $ | |||||||||
| Proceeds, before expenses, to selling stockholders |
$ | $ | $ | |||||||||
The estimated offering expenses payable by us, exclusive of the underwriting discounts and commissions, are approximately $6 million. We have agreed to reimburse the underwriters for expenses relating to clearance of this offering with the Financial Industry Regulatory Authority of up to $45,000.
The underwriters have informed us that they do not intend sales to discretionary accounts to exceed 5% of the total number of shares of common stock offered by them.
We intend to apply to list our common stock on the NYSE under the trading symbol “SLQT”.
We and all directors and officers and certain stockholders have agreed, subject to certain exceptions, that, without the prior written consent of Credit Suisse Securities (USA) LLC and Morgan Stanley & Co. LLC on behalf of the underwriters, we and they will not, and will not publicly disclose an intention to, during the applicable 90 or 180-day restricted period:
| • | offer, pledge, sell, contract to sell, sell any option or contract to purchase, purchase any option or contract to sell, grant any option, right or warrant to purchase, lend, or otherwise transfer or dispose of, directly or indirectly, any shares of our common stock beneficially owned by them or any other securities so owned that are convertible into or exercisable or exchangeable for shares of our common stock; |
| • | file any registration statement with the SEC relating to the offering of any shares of common stock or any securities convertible into or exercisable or exchangeable for shares of common stock; or |
| • | enter into any swap or other arrangement that transfers to another, in whole or in part, any of the economic consequences of ownership of shares of our common stock, |
whether any such transaction described above is to be settled by delivery of common stock or such other securities, in cash or otherwise. In addition, we and each such person have agreed that, without the prior written consent of Credit Suisse Securities (USA) LLC and Morgan Stanley & Co. LLC on behalf of the underwriters, we or such other person will not, during the applicable 90 or 180-day restricted period, make any demand for, or exercise any right with respect to, the registration of any shares of common stock or any security convertible into or exercisable or exchangeable for shares of common stock. None of our other stockholders is subject to any such restrictions and, accordingly, common stock or other securities held by these other stockholders may be transferred or disposed of, to or through any broker-dealer, at any time during or following this offering, subject to such stockholder’s compliance with applicable securities laws.
The restrictions described in the immediately preceding paragraph do not apply to:
| • | the sale of shares to the underwriters; or |
-152-
Table of Contents
| • | the issuance by the Company of shares of common stock or securities convertible into or exercisable for common stock upon the conversion or exchange of convertible or exchangeable securities, the exercise of an option or a warrant or the settlement of restricted stock units, in each case outstanding on the date of this prospectus of which the underwriters have been advised in writing; provided that the recipient executes a lock-up agreement with respect to the remaining portion of the applicable restricted period, and that no filing under Section 16(a) of the Exchange Act is required or voluntarily made; or |
| • | grants of stock options, stock awards, restricted stock, restricted stock units or other equity awards and the issuance of common stock or securities convertible into or exercisable for common stock (whether upon the exercise of stock options or otherwise) to employees, officers, directors, advisors, or consultants of the Company pursuant to the terms of a plan in effect on the date hereof and described herein; provided that each newly appointed director or executive officer that is a recipient executes a lock-up agreement with respect to the remaining portion of the applicable restricted period; or |
| • | the establishment or amendment of a trading plan pursuant to Rule 10b5-1 under the Exchange Act for the transfer of shares of common stock, provided that (i) such plan does not provide for the transfer of common stock during the applicable restricted period and (ii) to the extent a public announcement or filing under the Exchange Act, if any, is required of or voluntarily made by the Company regarding the establishment or amendment of such plan, such announcement or filing shall include a statement to the effect that no transfer of common stock may be made; or |
| • | the filing of any registration statement on Form S-8 relating to securities granted or to be granted pursuant to any plan in effect on the date hereof and described herein or any assumed benefit plan contemplated below; or |
| • | the offer or issuance or agreement to issue by the Company of common stock or securities convertible into, exercisable for or which are otherwise exchangeable for or represent the right to receive common stock in connection with an acquisition, merger, joint venture, strategic alliance, commercial or other collaborative relationship or the acquisition or license by the Company or any of its subsidiaries of the securities, business, property or other assets of another person or entity or pursuant to any employee benefit plan as assumed by the Company in connection with any such acquisition or transaction, provided that the aggregate number of shares of common stock, securities convertible into, exercisable for or which are otherwise exchangeable for or represent the right to receive common stock (on an as-converted, as-exercised or as-exchanged basis) that the Company sells or issues does not exceed 5% of the total number of shares of common stock outstanding immediately following the completion of this offering, and provided that unless such issuance is registered under the Securities Act, the recipient executes a lock-up agreement with respect to the remaining portion of the applicable restricted period. |
Credit Suisse Securities (USA) LLC and Morgan Stanley & Co. LLC, in their sole discretion as representatives, may release the common stock and other securities subject to the lock-up agreements described above in whole or in part at any time. Subject to certain exceptions, in the event that Credit Suisse Securities (USA) LLC and Morgan Stanley & Co. LLC grant such a release with respect to all or a portion of another holder’s shares, the same percentage of the Series E Restricted Shares will be automatically released from their lock-up restrictions.
In order to facilitate the offering of the common stock, the underwriters may engage in transactions that stabilize, maintain or otherwise affect the price of the common stock. Specifically, the underwriters may sell more shares than they are obligated to purchase under the underwriting agreement, creating a short position. A short sale is covered if the short position is no greater than the number of shares available for purchase by the underwriters under the over-allotment option. The underwriters can close out a covered short sale by exercising the over-allotment option or purchasing shares in the open market. In determining the source of shares to close out a covered short sale, the underwriters will consider, among other things, the open market price of shares compared to the price available under the over-allotment option. The underwriters may also sell shares in excess
-153-
Table of Contents
of the over-allotment option, creating a naked short position. The underwriters must close out any naked short position by purchasing shares in the open market. A naked short position is more likely to be created if the underwriters are concerned that there may be downward pressure on the price of the common stock in the open market after pricing that could adversely affect investors who purchase in this offering. As an additional means of facilitating this offering, the underwriters may bid for, and purchase, shares of common stock in the open market to stabilize the price of the common stock. These activities may raise or maintain the market price of the common stock above independent market levels or prevent or retard a decline in the market price of the common stock. The underwriters are not required to engage in these activities and may end any of these activities at any time.
We, the selling stockholders and the underwriters have agreed to indemnify each other against certain liabilities, including liabilities under the Securities Act.
A prospectus in electronic format may be made available on websites maintained by one or more underwriters, or selling group members, if any, participating in this offering. The representatives may agree to allocate a number of shares of common stock to underwriters for sale to their online brokerage account holders. Internet distributions will be allocated by the representatives to underwriters that may make internet distributions on the same basis as other allocations.
Pricing of the Offering
Prior to this offering, there has been no public market for our common stock. The initial public offering price was determined by negotiations between us and the representatives. Among the factors considered in determining the initial public offering price were our future prospects and those of our industry in general, our sales, earnings and certain other financial and operating information in recent periods, and the price-earnings ratios, price-sales ratios, market prices of securities, and certain financial and operating information of companies engaged in activities similar to ours.
Directed Share Program
At our request, the underwriters have reserved up to 1,250,000 shares of common stock, or up to 5% of the shares of common stock offered by this prospectus for sale by the Company, at the initial public offering price, to directors, director nominees, officers, employees, business associates and related persons of SelectQuote, Inc. The sales will be made at our direction by Morgan Stanley & Co. LLC and its affiliates through a directed share program. If purchased by these persons, these shares will be subject to a 180-day lock-up restriction described above. The number of shares of common stock available for sale to the general public will be reduced to the extent these individuals purchase such reserved shares. Any reserved shares that are not so purchased will be offered by the underwriters to the general public on the same basis as the other shares offered by this prospectus.
Other Relationships
The underwriters and their respective affiliates are full service financial institutions engaged in various activities, which may include securities trading, commercial and investment banking, financial advisory, investment management, investment research, principal investment, hedging, financing and brokerage activities. Certain of the underwriters and their respective affiliates have, from time to time, performed, and may in the future perform, various financial advisory and investment banking services for us, for which they received or will receive customary fees and expenses.
In addition, in the ordinary course of their various business activities, the underwriters and their respective affiliates may make or hold a broad array of investments and actively trade debt and equity securities (or related derivative securities) and financial instruments (including bank loans) for their own account and for the accounts of their customers and may at any time hold long and short positions in such securities and instruments. Such
-154-
Table of Contents
investment and securities activities may involve our securities and instruments. The underwriters and their respective affiliates may also make investment recommendations or publish or express independent research views in respect of such securities or instruments and may at any time hold, or recommend to clients that they acquire, long or short positions in such securities and instruments.
Conflicts of Interest
Affiliates of Morgan Stanley & Co. LLC, one of the underwriters of this offering, are lenders under our Credit Agreement. As a result of the repayment of a portion of the borrowed funds under the Term Loan using proceeds from this offering, Morgan Stanley & Co. LLC will therefore indirectly receive more than 5% of the proceeds from this offering. Because of the foregoing, a “conflict of interest” is deemed to exist within the meaning of FINRA Rule 5121. Accordingly, this offering will be conducted in accordance with FINRA Rule 5121, which requires, among other things, that a “qualified independent underwriter” participate in the preparation of, and exercise the usual standards of “due diligence” with respect to, the registration statement and this prospectus. Credit Suisse Securities (USA) LLC has agreed to act as a qualified independent underwriter for this offering and to undertake the legal responsibilities and liabilities of an underwriter under the Securities Act, specifically including those inherent in Section 11 of the Securities Act. Credit Suisse Securities (USA) LLC will not receive any additional fees for serving as a qualified independent underwriter in connection with this offering. The Company and the selling stockholders have agreed to indemnify Credit Suisse Securities (USA) LLC against certain liabilities incurred in connection with acting as a qualified independent underwriter, including liabilities under the Securities Act. Morgan Stanley & Co. LLC will not confirm any sales to any account over which it exercises discretionary authority without the specific written approval of the transaction from the account holder.
On May 7, 2020, the Company entered into an interest rate swap agreement with Morgan Stanley Capital Services LLC, an affiliate of Morgan Stanley & Co. LLC, one of the underwriters of this offering.
Selling Restrictions
European Economic Area
In relation to each Member State, no offer of shares of common stock which are the subject of the offering contemplated by this prospectus and any related free writing prospectus may be made to the public in that Member State other than:
| (a) | to any legal entity which is a qualified investor as defined in the Prospectus Regulation; |
| (b) | to fewer than 150 natural or legal persons (other than qualified investors as defined in the Prospectus Regulation), subject to obtaining the prior consent of the relevant underwriter or underwriters nominated by us for any such offer; or |
| (c) | in any other circumstances falling within Article 1(4) of the Prospectus Regulation, |
provided that no such offer of shares of common stock shall require us or any underwriter to publish a prospectus pursuant to Article 3 of the Prospectus Regulation and each person who initially acquires any shares of common stock or to whom any offer is made will be deemed to have represented, acknowledged and agreed to and with each of the representatives and us that it is a “qualified investor” as defined in the Prospectus Regulation.
In the case of any shares of common stock being offered to a financial intermediary as that term is used in Article 5 of the Prospectus Regulation, each such financial intermediary will be deemed to have represented, acknowledged and agreed that the shares of common stock acquired by it in the offer have not been acquired on a nondiscretionary basis on behalf of, nor have they been acquired with a view to their offer or resale to, persons in circumstances which may give rise to an offer of any shares of common stock to the public other than their offer or resale in a Member State to qualified investors as so defined or in circumstances in which the prior consent of the representatives has been obtained to each such proposed offer or resale.
-155-
Table of Contents
For the purposes of this provision, the expression an “offer of shares of common stock to the public” in relation to any shares of common stock in any Member State means the communication in any form and by any means of sufficient information on the terms of the offer and the shares of common stock to be offered so as to enable an investor to decide to purchase or subscribe for the shares of common stock and the expression “Prospectus Regulation” means Regulation (EU) 2017/1129.
United Kingdom
Any invitation or inducement to engage in investment activity (within the meaning of Section 21 of the United Kingdom’s Financial Services and Markets Act 2000, as amended (the “FSMA”)) in connection with the issue or sale of the shares of our common stock may only be communicated or caused to be communicated in circumstances in which Section 21(1) of the FSMA does not apply to us.
All applicable provisions of the FSMA must be complied with in respect to anything done by any person in relation to the shares of our common stock in, from or otherwise involving the United Kingdom.
Canada
The shares of our common stock may be sold only to purchasers purchasing, or deemed to be purchasing, as principal that are accredited investors, as defined in National Instrument 45-106 Prospectus Exemptions or subsection 73.3(1) of the Securities Act (Ontario), and are permitted clients, as defined in National Instrument 31-103 Registration Requirements, Exemptions and Ongoing Registrant Obligations. Any resale of the shares of common stock must be made in accordance with an exemption from, or in a transaction not subject to, the prospectus requirements of applicable securities laws.
Securities legislation in certain provinces or territories of Canada may provide a purchaser with remedies for rescission or damages if this prospectus (including any amendment thereto) contains a misrepresentation, provided that the remedies for rescission or damages are exercised by the purchaser within the time limit prescribed by the securities legislation of the purchaser’s province or territory. The purchaser should refer to any applicable provisions of the securities legislation of the purchaser’s province or territory for particulars of these rights or consult with a legal advisor.
Pursuant to Section 3A.3 (or, in the case of securities issued or guaranteed by the government of a non-Canadian jurisdiction, Section 3A.4) of National Instrument 33-105 Underwriting Conflicts (NI 33-105), the underwriters are not required to comply with the disclosure requirements of NI 33-105 regarding underwriter conflicts of interest in connection with this offering.
Japan
No registration pursuant to Article 4, paragraph 1 of the Financial Instruments and Exchange Law of Japan (Law No. 25 of 1948, as amended) (the “FIEL”) has been made or will be made with respect to the solicitation of the application for the acquisition of the shares of our common stock.
Accordingly, the shares of common stock have not been, directly or indirectly, offered or sold and will not be, directly or indirectly, offered or sold in Japan or to, or for the benefit of, any resident of Japan (which term as used herein means any person resident in Japan, including any corporation or other entity organized under the laws of Japan) or to others for re-offering or re-sale, directly or indirectly, in Japan or to, or for the benefit of, any resident of Japan except pursuant to an exemption from the registration requirements, and otherwise in compliance with, the FIEL and the other applicable laws and regulations of Japan.
For Qualified Institutional Investors (“QII”)
Please note that the solicitation for newly-issued or secondary securities (each as described in Paragraph 2, Article 4 of the FIEL) in relation to the shares of common stock constitutes either a “QII only private placement”
-156-
Table of Contents
or a “QII only secondary distribution” (each as described in Paragraph 1, Article 23-13 of the FIEL). Disclosure regarding any such solicitation, as is otherwise prescribed in Paragraph 1, Article 4 of the FIEL, has not been made in relation to the shares of common stock. The shares of common stock may only be transferred to QIIs.
For Non-QII Investors
Please note that the solicitation for newly-issued or secondary securities (each as described in Paragraph 2, Article 4 of the FIEL) in relation to the shares of common stock constitutes either a “small number private placement” or a “small number private secondary distribution” (each as is described in Paragraph 4, Article 23-13 of the FIEL). Disclosure regarding any such solicitation, as is otherwise prescribed in Paragraph 1, Article 4 of the FIEL, has not been made in relation to the shares of common stock. The shares of common stock may only be transferred en bloc without subdivision to a single investor.
Hong Kong
The shares of our common stock have not been offered or sold and will not be offered or sold in Hong Kong, by means of any document, other than (a) to “professional investors” as defined in the Securities and Futures Ordinance (Cap. 571) of Hong Kong (the “SFO”) and any rules made under the SFO; or (b) in other circumstances which do not result in the document being a “prospectus” as defined in the Companies Winding Up and Miscellaneous Provisions Ordinance (Cap. 32) of Hong Kong (the “C(WUMP)O”) or which do not constitute an offer to the public within the meaning of the C(WUMP)O. No advertisement, invitation or document relating to the shares of common stock has been or may be issued or has been or may be in the possession of any person for the purposes of issue, whether in Hong Kong or elsewhere, which is directed at, or the contents of which are likely to be accessed or read by, the public of Hong Kong (except if permitted to do so under the securities laws of Hong Kong) other than with respect to shares of common stock which are or are intended to be disposed of only to persons outside Hong Kong or only to “professional investors” as defined in the SFO and any rules made under the SFO.
Singapore
This prospectus has not been registered as a prospectus under the Securities and Futures Act, Chapter 289 of Singapore (the “SFA”) by the Monetary Authority of Singapore, and the offer of shares of our common stock in Singapore is made primarily pursuant to the exemptions under Sections 274 and 275 of the SFA. Accordingly, this prospectus and any other document or material in connection with the offer or sale, or invitation for subscription or purchase, of shares of common stock may not be circulated or distributed, nor may shares be offered or sold, or be made the subject of an invitation for subscription or purchase, whether directly or indirectly, to any person in Singapore other than (i) to an institutional investor as defined in Section 4A of the SFA (an “Institutional Investor”) pursuant to Section 274 of the SFA, (ii) to an accredited investor as defined in Section 4A of the SFA (an “Accredited Investor”) or other relevant person as defined in Section 275(2) of the SFA (a “Relevant Person”) and pursuant to Section 275(1) of the SFA, or any person pursuant to Section 275(1A) of the SFA, and in accordance with the conditions specified in Section 275 of the SFA, or (iii) otherwise pursuant to, and in accordance with the conditions of, any other applicable provision of the SFA.
It is a condition of the offer that where shares of common stock are subscribed for or acquired pursuant to an offer made in reliance on Section 275 of the SFA by a Relevant Person which is:
| • | a corporation (which is not an Accredited Investor), the sole business of which is to hold investments and the entire share capital of which is owned by one or more individuals, each of whom is an Accredited Investor; or |
| • | a trust (where the trustee is not an Accredited Investor), the sole purpose of which is to hold investments and each beneficiary of the trust is an individual who is an Accredited Investor, |
-157-
Table of Contents
securities or securities-based derivatives contracts (each term as defined in Section 2(1) of the SFA) of that corporation or the beneficiaries’ rights and interest (howsoever described) in that trust shall not be transferred within six months after that corporation or that trust has subscribed for or acquired the shares of common stock, except:
| • | to an Institutional Investor, an Accredited Investor, a Relevant Person, or which arises from an offer referred to in Section 275(1A) of the SFA (in the case of that corporation) or Section 276(4)(i)(B) of the SFA (in the case of that trust); |
| • | where no consideration is or will be given for the transfer; |
| • | where the transfer is by operation of law; |
| • | as specified in Section 276(7) of the SFA; or |
| • | as specified in Regulation 37A of the Securities and Futures (Offers of Investments) (Securities and Securities-based Derivatives Contracts) Regulations 2018. |
Notification under Section 309B(1)(c) of the SFA—Solely for the purposes of its obligations pursuant to Sections 309B(1)(a) and 309B(1)(c) of the SFA, the issuer has determined, and hereby notifies all relevant persons (as defined in Section 309A of the SFA) that the shares of common stock are “prescribed capital markets products” / capital markets products other than prescribed capital markets products (as defined in the Securities and Futures (Capital Markets Products) Regulations 2018) and “Excluded Investment Products” / “Specified Investment Products” (as defined in MAS Notice SFA 04-N12: Notice on the Sale of Investment Products and MAS Notice FAA-N16: Notice on Recommendations on Investment Products).
Australia
No placement document, prospectus, product disclosure statement or other disclosure document has been lodged with the Australian Securities and Investments Commission in relation to the offering. This prospectus does not constitute a prospectus, product disclosure statement or other disclosure document under the Corporations Act 2001 (the “Corporations Act”), and does not purport to include the information required for a prospectus, product disclosure statement or other disclosure document under the Corporations Act.
Any offer in Australia of the shares of common stock may only be made to persons (the “Exempt Investors”) who are “sophisticated investors” (within the meaning of section 708(8) of the Corporations Act), “professional investors” (within the meaning of section 708 (11) of the Corporations Act) or otherwise pursuant to one or more exemptions contained in section 708 of the Corporations Act so that it is lawful to offer the shares of common stock without disclosure to investors under Chapter 6D of the Corporations Act.
The shares of common stock applied for by Exempt Investors in Australia must not be offered for sale in Australia in the period of 12 months after the date of allotment under the offering, except in circumstances where disclosure to investors under Chapter 6D of the Corporations Act would not be required pursuant to an exemption under section 708 of the Corporations Act or otherwise or where the offer is pursuant to a disclosure document which complies with Chapter 6D of the Corporations Act. Any person acquiring shares of common stock of must observe such Australian on-sale restrictions.
This prospectus contains general information only and does not take account of the investment objectives, financial situation or particular needs of any particular person. It does not contain any securities recommendations or financial product advice. Before making an investment decision, investors need to consider whether the information in this prospectus is appropriate to their needs, objectives and circumstances, and, if necessary, seek expert advice on those matters.
Switzerland
This document is not intended to constitute an offer or solicitation to purchase or invest in the shares of our common stock. The shares of our common stock may not be publicly offered, directly or indirectly, in
-158-
Table of Contents
Switzerland within the meaning of the Swiss Financial Services Act (“FinSA”) and will not be listed on the SIX Swiss Exchange (“SIX”) or on any other stock exchange or regulated trading venue (exchange or multilateral trading facility) in Switzerland. Neither this document nor any other offering or marketing material relating to the shares of our common stock constitutes a prospectus within the meaning of, and has been prepared without regard to, the FinSA, the disclosure standards for issuance prospectuses under art. 652a or art. 1156 of the Swiss Code of Obligations or the disclosure standards for listing prospectuses under art. 27 ff. of the SIX Listing Rules or the listing rules of any other stock exchange or regulated trading venue (exchange or multilateral trading facility) in Switzerland. Neither this document nor any other offering or marketing material relating to the shares of common stock or the offering may be publicly distributed or otherwise made publicly available in Switzerland.
Neither this document nor any other offering or marketing material relating to the offering, the Company, the shares of common stock have been or will be filed with or approved by any Swiss regulatory authority. In particular, this document will not be filed with, and the offer of shares of common stock will not be supervised by, the Swiss Financial Market Supervisory Authority FINMA, and the offer of shares of common stock has not been and will not be authorized under the Swiss Federal Act on Collective Investment Schemes (“CISA”). The investor protection afforded to acquirers of interests in collective investment schemes under the CISA does not extend to acquirers of shares of common stock.
United Arab Emirates
The shares of our common stock have not been, and are not being, publicly offered, sold, promoted or advertised in the United Arab Emirates (including the Dubai International Financial Centre) other than in compliance with the laws of the United Arab Emirates (and the Dubai International Financial Centre) governing the issue, offering and sale of securities. Further, this prospectus does not constitute a public offer of securities in the United Arab Emirates (including the Dubai International Financial Centre) and is not intended to be a public offer. This prospectus has not been approved by or filed with the Central Bank of the United Arab Emirates, the Securities and Commodities Authority or the Dubai Financial Services Authority.
Dubai International Financial Centre
This prospectus relates to an Exempt Offer in accordance with the Offered Securities Rules of the Dubai Financial Services Authority (“DFSA”). This prospectus is intended for distribution only to persons of a type specified in the Offered Securities Rules of the DFSA. It must not be delivered to, or relied on by, any other person. The DFSA has no responsibility for reviewing or verifying any documents in connection with Exempt Offers. The DFSA has not approved this prospectus nor taken steps to verify the information set forth herein and has no responsibility for the prospectus. The shares of common stock to which this prospectus relates may be illiquid and/or subject to restrictions on their resale. Prospective purchasers of the shares of common stock offered should conduct their own due diligence on the shares of common stock. If you do not understand the contents of this prospectus you should consult an authorized financial advisor.
-159-
Table of Contents
The validity of the shares of common stock offered hereby will be passed upon for us by Wachtell, Lipton, Rosen & Katz, New York, New York. Certain legal matters in connection with this offering will be passed upon for the underwriters by Sidley Austin LLP, New York, New York.
The financial statements as of June 30, 2019 and 2018, and the related statements of operations, changes in shareholders’ equity, and cash flows, for each of the two years in the period ended June 30, 2019, included in this prospectus have been audited by Deloitte & Touche LLP, an independent registered public accounting firm, as stated in their report appearing herein. Such financial statements have been so included in reliance upon the report of such firm given upon their authority as experts in accounting and auditing.
WHERE YOU CAN FIND MORE INFORMATION
We have filed with the Securities and Exchange Commission a registration statement on Form S-1 under the Securities Act with respect to the shares of common stock offered hereby. This prospectus, which constitutes a part of the registration statement, does not contain all of the information set forth in the registration statement or the exhibits and schedules filed therewith. For further information about us and the common stock offered hereby, we refer you to the registration statement and the exhibits and schedules filed thereto. Statements contained in this prospectus regarding the contents of any contract or any other document that is filed as an exhibit to the registration statement are not necessarily complete, and each such statement is qualified in all respects by reference to the full text of such contract or other document filed as an exhibit to the registration statement.
The SEC maintains an internet website, which is located at www.sec.gov, that contains reports, proxy and information statements and other information regarding issuers that file electronically with the SEC. You may access the registration statement for this offering at the SEC’s internet website.
Upon closing of this offering, we will be subject to the informational and periodic reporting requirements of the Exchange Act. We will fulfill our obligations with respect to such requirements by filing periodic reports and other information with the SEC. We intend to furnish our stockholders with annual reports containing financial statements certified by an independent registered public accounting firm. We also maintain a website at www.selectquote.com. The information contained in, or which can be accessed through, our website does not constitute a part of this prospectus and you should not consider information contained on our website when deciding whether to purchase shares of our common stock.
-160-
Table of Contents
SelectQuote, Inc. and Subsidiaries
| Unaudited Condensed Consolidated Financial Statements |
||||
| Consolidated Balance Sheets as of June 30, 2019 and March 31, 2020 |
F-2 | |||
| Consolidated Statements of Operations for the Nine Month Periods Ended March 31, 2019 and 2020 |
F-3 | |||
| F-4 | ||||
| Consolidated Statements of Cash Flows for the Nine Month Periods Ended March 31, 2019 and 2020 |
F-5 | |||
| F-6 | ||||
| Audited Consolidated Financial Statements |
||||
| F-22 | ||||
| Consolidated Balance Sheets as of June 30, 2019 and June 30, 2018 |
F-23 | |||
| Consolidated Statements of Operations for the Years Ended June 30, 2019 and 2018 |
F-24 | |||
| F-25 | ||||
| Consolidated Statements of Cash Flows for the Years Ended June 30, 2019 and 2018 |
F-26 | |||
| F-27 |
F-1
Table of Contents
SELECTQUOTE, INC. AND SUBSIDIARIES
CONDENSED CONSOLIDATED BALANCE SHEETS
(Unaudited)
(In thousands, except share and per share amounts)
| June 30, 2019 |
March 31, 2020 |
Pro Forma as of March 31, 2020 |
||||||||||
| ASSETS |
||||||||||||
| CURRENT ASSETS: |
||||||||||||
| Cash and cash equivalents |
$ | 570 | $ | 28,960 | $ | 157,960 | ||||||
| Restricted cash |
— | 54,667 | 54,667 | |||||||||
| Accounts receivable |
59,829 | 76,886 | 76,886 | |||||||||
| Commissions receivable—current |
36,108 | 46,699 | 46,699 | |||||||||
| Other current assets |
6,450 | 4,890 | 4,890 | |||||||||
|
|
|
|
|
|
|
|||||||
| Total current assets |
102,957 | 212,102 | 341,102 | |||||||||
| COMMISSIONS RECEIVABLE—Net |
279,489 | 411,352 | 411,352 | |||||||||
| PROPERTY AND EQUIPMENT—Net |
13,759 | 20,017 | 20,017 | |||||||||
| SOFTWARE—Net |
4,895 | 7,839 | 7,839 | |||||||||
| GOODWILL |
5,364 | 5,364 | 5,364 | |||||||||
| OTHER ASSETS |
476 | 4,987 | 4,987 | |||||||||
|
|
|
|
|
|
|
|||||||
| TOTAL ASSETS |
$ | 406,940 | $ | 661,661 | $ | 790,661 | ||||||
|
|
|
|
|
|
|
|||||||
| LIABILITIES, TEMPORARY EQUITY, AND SHAREHOLDERS’ EQUITY |
||||||||||||
| CURRENT LIABILITIES: |
||||||||||||
| Accounts payable and accrued expenses |
$ | 13,648 | $ | 29,110 | $ | 29,110 | ||||||
| Accrued compensation and benefits |
12,566 | 19,206 | 19,206 | |||||||||
| Commission advances |
2,025 | 1,627 | 1,627 | |||||||||
| Capital lease obligations—current |
33 | 47 | 47 | |||||||||
| Deferred rent and lease incentives—current |
1,030 | 1,437 | 1,437 | |||||||||
| Non-recourse debt—current |
3,920 | 5,618 | 5,618 | |||||||||
|
|
|
|
|
|
|
|||||||
| Total current liabilities |
33,222 | 57,045 | 57,045 | |||||||||
| DEBT |
11,032 | 411,054 | 411,054 | |||||||||
| CAPITAL LEASE OBLIGATIONS—Net |
79 | 71 | 71 | |||||||||
| DEFERRED RENT AND LEASE INCENTIVES—Net |
7,488 | 10,210 | 10,210 | |||||||||
| NON-RECOURSE DEBT—Net |
10,615 | 18,689 | 18,689 | |||||||||
| DEFERRED INCOME TAXES |
81,252 | 100,369 | 100,369 | |||||||||
| OTHER LIABILITIES |
— | 226 | 226 | |||||||||
|
|
|
|
|
|
|
|||||||
| Total liabilities |
143,688 | 597,664 | 597,664 | |||||||||
|
|
|
|
|
|
|
|||||||
| COMMITMENTS AND CONTINGENCIES (Note 7) |
||||||||||||
| TEMPORARY EQUITY: |
||||||||||||
| Series A redeemable convertible preferred stock, $0.01 par value—1,137,235 shares authorized; 1,137,235 and 847,776 shares issued as of June 30, 2019 and March 31, 2020, respectively; 847,776 shares outstanding as of June 30, 2019 and March 31, 2020, respectively (aggregate liquidation preference, $127) |
171 | 127 | — | |||||||||
| Series B convertible preferred stock, $0.01 par value—821,690 shares authorized; 821,690 and 609,774 shares issued as of June 30, 2019 and March 31, 2020, respectively; 609,774 shares outstanding as of June 30, 2019 and March 31, 2020, respectively (aggregate liquidation preference, $372) |
501 | 372 | |
— |
| |||||||
| Series C convertible preferred stock, $0.01 par value—69,925 shares authorized; 69,925 and 51,369 shares issued as of June 30, 2019 and March 31, 2020, respectively; 51,369 shares outstanding as of June 30, 2019 and March 31, 2020, respectively (aggregate liquidation preference, $63) |
85 | 63 | |
— |
| |||||||
| Series D convertible preferred stock, $0.01 par value—4,000,000 shares authorized, issued, and outstanding (aggregate liquidation preference, $127,244) |
40 | 40 | |
— |
| |||||||
| Series E convertible preferred stock, $0.01 par value—no shares authorized, issued and outstanding |
— | — | |
— |
| |||||||
|
|
|
|
|
|
|
|||||||
| Total temporary equity |
797 | 602 | — | |||||||||
|
|
|
|
|
|
|
|||||||
| SHAREHOLDERS’ EQUITY: |
||||||||||||
| Common stock, $0.01 par value—$0.01 par value—184,000,000 and 700,000,000 shares authorized as of June 30, 2019 and March 31, 2020, respectively; 115,268,248 and 92,245,912 shares issued as of June 30, 2019 and March 31, 2020, respectively; 87,097,912 and 92,245,912 shares outstanding as of June 30, 2019 and March 31, 2020, respectively; 136,317,264 shares issued and outstanding as of March 31, 2020, pro forma |
906 | 922 | 1,446 | |||||||||
| Additional paid-in capital |
138,378 | 85,314 | 214,392 | |||||||||
| Treasury stock—4,041,223 shares at cost as of June 30, 2019, and no treasury shares as of March 31, 2020 |
(77,275 | ) | — | — | ||||||||
| Retained earnings |
200,446 | (22,841 | ) | (22,841 | ) | |||||||
|
|
|
|
|
|
|
|||||||
| Total shareholders’ equity |
262,455 | 63,395 | 192,997 | |||||||||
|
|
|
|
|
|
|
|||||||
| TOTAL LIABILITIES, TEMPORARY EQUITY, AND SHAREHOLDERS’ EQUITY |
$ | 406,940 | $ | 661,661 | $ | 790,661 | ||||||
|
|
|
|
|
|
|
|||||||
See accompanying notes to condensed consolidated financial statements.
F-2
Table of Contents
SELECTQUOTE, INC. AND SUBSIDIARIES
CONDENSED CONSOLIDATED STATEMENTS OF OPERATIONS
(Unaudited)
(In thousands, except per share amounts)
| Nine Months Ended March 31, |
||||||||
| 2019 | 2020 | |||||||
| REVENUE: |
||||||||
| Commission |
$ | 231,003 | $ | 353,926 | ||||
| Production bonus and other |
32,067 | 36,142 | ||||||
|
|
|
|
|
|||||
| Total revenue |
263,070 | 390,068 | ||||||
|
|
|
|
|
|||||
| OPERATING COSTS AND EXPENSES: |
||||||||
| Cost of revenue |
80,294 | 126,488 | ||||||
| Marketing and advertising |
84,427 | 132,246 | ||||||
| Technical development |
6,232 | 9,088 | ||||||
| General and administrative |
13,095 | 25,779 | ||||||
|
|
|
|
|
|||||
| Total operating costs and expenses |
184,048 | 293,601 | ||||||
|
|
|
|
|
|||||
| INCOME FROM OPERATIONS |
79,022 | 96,467 | ||||||
| INTEREST EXPENSE, NET |
(1,122 | ) | (16,239 | ) | ||||
| OTHER EXPENSES |
(8 | ) | (20 | ) | ||||
|
|
|
|
|
|||||
| INCOME BEFORE INCOME TAX EXPENSE |
77,892 | 80,208 | ||||||
| INCOME TAX EXPENSE |
18,200 | 19,110 | ||||||
|
|
|
|
|
|||||
| NET INCOME |
$ | 59,692 | $ | 61,098 | ||||
|
|
|
|
|
|||||
| NET INCOME (LOSS) PER SHARE: |
||||||||
| Basic |
$ | 0.59 | $ | (0.38 | ) | |||
| Diluted |
$ | 0.45 | $ | (0.38 | ) | |||
| WEIGHTED-AVERAGE COMMON STOCK OUTSTANDING USED IN PER SHARE AMOUNTS: |
||||||||
| Basic |
84,976 | 89,989 | ||||||
| Diluted |
132,976 | 89,989 | ||||||
| PRO FORMA NET INCOME PER SHARE: |
||||||||
| Basic |
$ | 0.46 | ||||||
| Diluted |
$ | 0.44 | ||||||
| PRO FORMA WEIGHTED-AVERAGE COMMON STOCK OUTSTANDING USED IN PER SHARE AMOUNTS: |
||||||||
| Basic |
134,060 | |||||||
| Diluted |
138,206 | |||||||
See accompanying notes to the condensed consolidated financial statements.
F-3
Table of Contents
SELECTQUOTE, INC. AND SUBSIDIARIES
CONDENSED CONSOLIDATED STATEMENTS OF CHANGES IN SHAREHOLDERS’ EQUITY
(Unaudited)
(In thousands)
| Common Stock | Additional Capital |
Retained Earnings(1) |
Treasury Stock |
Total Equity |
||||||||||||||||||||
| Shares | Amount | |||||||||||||||||||||||
| BALANCES—June 30, 2018 |
84,997 | $ | 850 | $ | 134,048 | $ | 129,472 | $ | (77,241 | ) | $ | 187,129 | ||||||||||||
| Cumulative effect of adoption of ASU 2016-09 |
— | — | — | 353 | — | 353 | ||||||||||||||||||
| Stock options exercised |
5,022 | 50 | 3,477 | — | — | 3,527 | ||||||||||||||||||
| Share-based compensation expense |
— | — | 67 | — | — | 67 | ||||||||||||||||||
| Dividends declared |
— | — | — | (979 | ) | — | (979 | ) | ||||||||||||||||
| Common stock repurchased |
(20 | ) | — | — | — | (34 | ) | (34 | ) | |||||||||||||||
| Net income |
— | — | — | 59,692 | — | 59,692 | ||||||||||||||||||
|
|
|
|
|
|
|
|
|
|
|
|
|
|||||||||||||
| BALANCES—March 31, 2019 |
89,999 | $ | 900 | $ | 137,592 | $ | 188,538 | $ | (77,275 | ) | $ | 249,755 | ||||||||||||
|
|
|
|
|
|
|
|
|
|
|
|
|
|||||||||||||
| (1) | As adjusted for the adoption of ASC 606 using the full retrospective method. |
Reflects the retrospective application of the eight-for-one stock split effective February 28, 2020, whereby each share of common stock issued and outstanding immediately prior to the effective date was split and converted into eight shares of common stock. The par value per share remained unchanged. The Company’s capital accounts have been retroactively restated to reflect the stock split.
| Common Stock | Additional Capital |
Retained Earnings |
Treasury Stock |
Total Equity |
||||||||||||||||||||
| Shares | Amount | |||||||||||||||||||||||
| BALANCES—June 30, 2019 |
90,619 | $ | 906 | $ | 138,378 | $ | 200,446 | $ | (77,275 | ) | $ | 262,455 | ||||||||||||
| Stock options exercised |
5,148 | 52 | 5,312 | — | — | 5,364 | ||||||||||||||||||
| Share-based compensation expense |
— | — | 9,283 | — | — | 9,263 | ||||||||||||||||||
| Dividends paid |
— | — | — | (207,341 | ) | — | (207,341 | ) | ||||||||||||||||
| Dividends paid on unexercised stock options |
— | — | (9,221 | ) | — | — | (9,221 | ) | ||||||||||||||||
| Return of capital |
— | — | (58,438 | ) | — | — | (58,438 | ) | ||||||||||||||||
| Treasury stock retirement |
(3,521 | ) | (36 | ) | — | (77,044 | ) | 77,275 | 195 | |||||||||||||||
| Net income |
— | — | — | 61,098 | — | 61,098 | ||||||||||||||||||
|
|
|
|
|
|
|
|
|
|
|
|
|
|||||||||||||
| BALANCES—March 31, 2020 |
92,246 | $ | 922 | $ | 85,314 | $ | (22,841 | ) | $ | — | $ | 63,395 | ||||||||||||
|
|
|
|
|
|
|
|
|
|
|
|
|
|||||||||||||
Reflects the retrospective application of the eight-for-one stock split effective February 28, 2020, whereby each share of common stock issued and outstanding immediately prior to the effective date was split and converted into eight shares of common stock. The par value per share remained unchanged. The Company’s capital accounts have been retroactively restated to reflect the stock split.
See accompanying notes to condensed consolidated financial statements.
F-4
Table of Contents
SELECTQUOTE, INC. AND SUBSIDIARIES
CONDENSED CONSOLIDATED STATEMENTS OF CASH FLOWS
(Unaudited)
(In thousands)
| Nine Months Ended March 31, |
||||||||
| 2019 | 2020 | |||||||
| CASH FLOWS FROM OPERATING ACTIVITIES: |
||||||||
| Net income |
$ | 59,692 | $ | 61,098 | ||||
| Adjustments to reconcile net income to net cash, cash equivalents, and restricted cash: |
||||||||
| Depreciation and amortization |
3,446 | 5,273 | ||||||
| Loss on disposal of property, equipment and software |
52 | 235 | ||||||
| Stock compensation expense |
67 | 9,283 | ||||||
| Deferred income taxes |
18,178 | 19,117 | ||||||
| Amortization of debt issuance costs and debt discount |
98 | 1,431 | ||||||
| Changes in operating assets and liabilities: |
||||||||
| Accounts receivable |
(11,309 | ) | (17,057 | ) | ||||
| Commissions receivable |
(69,405 | ) | (142,454 | ) | ||||
| Other assets |
(888 | ) | 1,420 | |||||
| Accounts payable and accrued expenses |
3,068 | 12,896 | ||||||
| Commission advances |
(967 | ) | (398 | ) | ||||
| Accrued compensation and benefits |
3,133 | 6,640 | ||||||
| Deferred rent and lease incentives |
(1,328 | ) | 258 | |||||
| Other long-term liabilities |
— | 226 | ||||||
|
|
|
|
|
|||||
| Net cash provided by (used in) operating activities |
3,837 | (42,032 | ) | |||||
|
|
|
|
|
|||||
| CASH FLOWS FROM INVESTING ACTIVITIES: |
||||||||
| Purchases of property and equipment |
(3,536 | ) | (6,185 | ) | ||||
| Proceeds from sales of property and equipment |
— | 3 | ||||||
| Purchases of software and capitalized software development costs |
(3,440 | ) | (4,443 | ) | ||||
|
|
|
|
|
|||||
| Net cash used in investing activities |
(6,976 | ) | (10,625 | ) | ||||
|
|
|
|
|
|||||
| CASH FLOWS FROM FINANCING ACTIVITIES: |
||||||||
| Proceeds from revolving line of credit |
99,579 | 85,975 | ||||||
| Payments on revolving line of credit |
(110,315 | ) | (97,007 | ) | ||||
| Net proceeds from Term Loan |
— | 416,500 | ||||||
| Proceeds from non-recourse debt |
12,050 | 12,125 | ||||||
| Payments on non-recourse debt |
(612 | ) | (2,405 | ) | ||||
| Payments on capital lease obligations |
(23 | ) | (27 | ) | ||||
| Proceeds from common stock options exercised |
3,527 | 5,364 | ||||||
| Purchase of treasury stock |
(34 | ) | — | |||||
| Cash dividends paid |
(979 | ) | (275,000 | ) | ||||
| Debt issuance costs |
(258 | ) | (7,694 | ) | ||||
| Equity issuance costs |
— | (2,117 | ) | |||||
|
|
|
|
|
|||||
| Net cash provided by financing activities |
2,935 | 135,714 | ||||||
|
|
|
|
|
|||||
| NET INCREASE IN CASH, CASH EQUIVALENTS, AND RESTRICTED CASH |
(204 | ) | 83,057 | |||||
| CASH, CASH EQUIVALENTS, AND RESTRICTED CASH—Beginning of year |
958 | 570 | ||||||
|
|
|
|
|
|||||
| CASH, CASH EQUIVALENTS, AND RESTRICTED CASH—End of year |
$ | 754 | $ | 83,627 | ||||
|
|
|
|
|
|||||
| SUPPLEMENTAL CASH FLOW INFORMATION: |
||||||||
| Interest paid, net |
$ | 1,027 | $ | 14,654 | ||||
| Income taxes paid, net |
22 | 48 | ||||||
| SUPPLEMENTAL DISCLOSURES OF NONCASH INVESTING ACTIVITIES: |
||||||||
| Landlord funded allowance for tenant improvements |
$ | 2,562 | $ | 2,871 | ||||
| Capital expenditures in accounts payable and accrued expenses |
27 | 1,146 | ||||||
| SUPPLEMENTAL DISCLOSURES OF NONCASH FINANCING ACTIVITIES: |
||||||||
| Payoff of the Credit Agreement |
$ | — | $ | (21,645 | ) | |||
| Property acquired under capital lease |
66 | 33 | ||||||
| Debt issuance costs in accounts payable and accrued expenses |
— | 205 | ||||||
| Equity issuance costs in accounts payable and accrued expenses |
— | 1,215 | ||||||
| Reconciliation to the Consolidated Balance Sheets |
||||||||
| Cash and cash equivalents |
$ | 754 | $ | 28,960 | ||||
| Restricted Cash |
— | 54,667 | ||||||
|
|
|
|
|
|||||
| Total cash and cash equivalents and restricted cash |
$ | 754 | $ | 83,627 | ||||
|
|
|
|
|
|||||
See accompanying notes to condensed consolidated financial statements.
F-5
Table of Contents
SELECTQUOTE, INC. AND SUBSIDIARIES
NOTES TO CONDENSED CONSOLIDATED FINANCIAL STATEMENTS
| 1. | SUMMARY OF BUSINESS AND SIGNIFICANT ACCOUNTING POLICIES |
Description of Business—SelectQuote, Inc. and its subsidiaries (the “Company” or “SelectQuote”) contract with numerous insurance carriers to sell senior health (“Senior”), life (“Life”), and auto and home insurance (“Auto & Home”) policies by telephone to individuals throughout the United States through the use of multi-channel marketing and advertising campaigns. Senior sells Medicare Advantage, Medicare Supplement, Medicare Part D, and other ancillary senior health insurance related policies. Life sells primarily term life insurance policies. Auto & Home primarily sells non-commercial auto & home property and casualty insurance policies. SelectQuote’s licensed insurance agents provide comparative rates from a variety of insurance carriers relying on a combination of proprietary and commercially available software to perform its quote service and sell insurance policies on behalf of the insurance carriers. The Company earns revenue in the form of commission payments from the insurance carriers. Commission payments are received both when the initial policy is sold (“first year”) and also when the underlying policyholder renews their policy in subsequent years (“renewal”), as well as production bonuses based on metrics for first year policies sold.
Basis of Presentation—The accompanying unaudited condensed consolidated financial statements include the accounts of SelectQuote, Inc., and its wholly owned subsidiaries: SelectQuote Insurance Services, SelectQuote Auto & Home Insurance Services, LLC (“SQAH”), ChoiceMark Insurance Services, Inc., and Tiburon Insurance Services. All intercompany accounts and transactions have been eliminated in consolidation. The condensed consolidated financial statements have been prepared in accordance with U.S. generally accepted accounting principles for interim financial information and reflect all normal recurring adjustments that are necessary to present fairly the results for the interim periods presented. Certain information and disclosures normally included in annual financial statements prepared in accordance with U.S. GAAP have been condensed or omitted in accordance with those accounting principles. However, the Company believes the disclosures made are adequate to make the information not misleading. The unaudited condensed consolidated financial statements have been prepared on the same basis as the audited consolidated financial statements as of and for the year ended June 30, 2019, and include all adjustments necessary for the fair presentation of our financial position as of June 30, 2019 and March 31, 2020, and our results of operations for the periods presented. The results for the nine month period ended March 31, 2020, are not necessarily indicative of the results to be expected for any subsequent period, including for the year ending June 30, 2020, and therefore should not be relied upon as an indicator of future results. The accompanying financial statements and related notes should be read in conjunction with the audited consolidated financial statements for the year ended June 30, 2019.
Use of Estimates—The preparation of condensed consolidated financial statements in conformity with accounting principles generally accepted in the United States of America requires management to make estimates and assumptions that affect the reported amounts of revenues, expenses, assets, and liabilities and disclosure of contingent assets and liabilities. The Company regularly assesses these estimates; however, actual amounts could differ from those estimates. The most significant items involving management’s estimates include estimates of revenue recognition, commissions receivable, and the provision for income taxes. The impact of changes in estimates is recorded in the period in which they become known.
Acquisition—On May 1, 2020, the Company acquired 100% of the outstanding membership units of InsideResponse, LLC (“InsideResponse”) for an aggregate purchase price of up to $65.0 million (subject to customary adjustments), as set forth in the Agreement and Plan of Merger, dated February 12, 2020, by and among the Company, SQ-IR Merger Sub LLC, a wholly owned subsidiary of the Company, InsideResponse and the other parties thereto, as amended on May 1, 2020 (the “Merger Agreement”). InsideResponse is an online marketing consulting firm from which the Company has historically purchased leads (refer to Note 11 to the condensed consolidated financial statements for related party information). The purchase price is comprised of $32.7 million, which was paid in cash at the closing of the transaction, and an earn-out of up to
F-6
Table of Contents
$32.3 million, to be paid 65% in cash and 35% in shares of the Company’s common stock (to be valued based on the average closing price of its common stock for the 10 trading days ending three trading days immediately preceding such payment date). The earn-out is contingent upon the achievement of certain gross profit targets for InsideResponse in calendar year 2020, as set forth in the Merger Agreement. Due to the limited time since the acquisition date, the accounting for this acquisition was incomplete at the time the condensed consolidated financial statements were issued. As a result, the Company is unable to provide the amounts recognized as of the acquisition date for the major classes of assets acquired and liabilities assumed.
Series E Preferred Stock—On April 17, 2020 and May 6, 2020, the Company issued and sold an aggregate of 100,000 shares and 35,000 shares, respectively, of its Series E preferred stock to certain “accredited investors” (as defined in Regulation D promulgated under the Securities Act of 1933), at a purchase price of $1,000 per share, for aggregate proceeds of approximately $135.0 million and net proceeds to the Company of approximately $129.0 million, after deducting commissions and expenses. See Note 9 to the condensed consolidated financial statements for further details.
Stock Split—On February 28, 2020, the Company effected an eight-for-one forward stock split of its issued and outstanding shares of common stock and a proportional adjustment to the existing conversion ratios for its Series A, B, C and D preferred stock, which is referred to as the “stock split.” The par value of the Company’s common stock was not adjusted as a result of the stock split. All references to common stock, options to purchase common stock, share data, per share data and related information contained in the condensed consolidated financial statements and related footnotes have been retrospectively adjusted, where applicable, to reflect the effect of the stock split and the adjustment of the Series A, B, C and D preferred stock conversion ratios. Accordingly, an adjustment was made between common stock and additional paid-in-capital in the condensed consolidated balance sheets to reflect the new values after the stock split. In connection with the stock split, the number of authorized shares of the Company’s common stock was increased to 700.0 million. The shares of treasury stock were not affected by the stock split and were retired on March 30, 2020.
Pro Forma Financial Information—The pro forma balance sheet reflects the issuance and sale of 135,000 shares of our Series E preferred stock and related receipt of net proceeds of approximately $129.0 million subsequent to March 31, 2020 and the automatic conversion of all shares of the Company’s Series A, B, C, D and E preferred stock outstanding as of May 15, 2020 into an aggregate of 52,404,685 shares of common stock as if such conversion had occurred on March 31, 2020. Pro forma basic and diluted net income per share has been computed to give effect to the conversion of all outstanding shares of the Company’s Series A, B, C and D preferred stock into an aggregate of 44,071,352 shares of common stock. The pro forma net income per share does not include the shares expected to be sold and related proceeds to be received from the Company’s anticipated initial public offering nor does it include the shares expected to be issued upon the automatic conversion of the shares of Series E preferred stock the Company issued after March 31, 2020 into shares of common stock at the time of the closing of the Company’s anticipated initial public offering. The pro forma net income per share for the nine month period ended March 31, 2020, was computed using the weighted-average number of shares of common stock outstanding, including the pro forma effect of the conversion of all outstanding shares of Series A, B, C and D preferred stock as if such conversion had occurred on July 1, 2019, or when the securities were issued, whichever is later.
Equity Issuance Costs— Equity issuance costs primarily consist of legal fees, underwriting fees, and other costs incurred that are directly related to the issuance of the Company’s shares through either a private placement or the anticipated public offering of the Company’s shares and that will be charged to shareholders’ equity upon the receipt of the capital raised. Should the anticipated equity offerings prove to be unsuccessful, these deferred costs as well as additional expenses to be incurred will be recorded in the condensed consolidated statement of operations. As of March 31, 2020, the Company has incurred $3.3 million in equity issuance costs that are recorded in other assets in the condensed consolidated balance sheet. The Company did not incur any equity issuance costs as of June 30, 2019.
F-7
Table of Contents
Restricted Cash—The Company’s restricted cash balance consists of a specified deposit account to be used only for interest payments on the Term Loan (defined below). As of March 31, 2020, the Company had $54.7 million of restricted cash in the condensed consolidated balance sheet. The Company did not have restricted cash as of June 30, 2019.
Treasury Share Retirement—The Company periodically retires treasury shares that it acquires through share repurchases and returns those shares to the status of authorized but unissued. When treasury shares are retired, the Company’s policy is to allocate the excess of the repurchase price over the par value of shares acquired to Retained Earnings. On March 30, 2020, the Company retired 4.0 million shares of its common stock and preferred stock held in treasury. The shares were returned to the status of authorized but unissued shares. As a result, the treasury stock balance as of March 31, 2020 was reduced to zero, and the common stock, preferred stock, and retained earnings balances in the condensed consolidated balance sheet were reduced by $0.1 million, $0.2 million and $77.0 million, respectively.
Recent Accounting Pronouncements Not Yet Adopted—In February 2016, the Financial Accounting Standards Board (“FASB”) issued Accounting Standards Update (“ASU”) No. 2016-02, Leases (Topic 842), and has subsequently modified several areas of the standard in order to provide additional clarity and improvements. The new standard will supersede much of the existing authoritative literature for leases. This guidance requires lessees, among other things, to recognize right-of-use assets and liabilities on their balance sheet for all leases with lease terms longer than 12 months. Entities are required to use modified retrospective application for leases that exist or are entered into after the beginning of the earliest comparative period in the financial statements with the option to elect certain transition reliefs. According to the superseding standard ASU No. 2019-10, Financial Instruments—Credit Losses (Topic 326), Derivatives and Hedging (Topic 815), and Leases (Topic 842), that deferred the effective date of Topic 842, this standard becomes effective for the Company on July 1, 2021. The Company is completing its evaluation of its contract population to begin the assessment the potential impact that the application of this guidance will have on its consolidated financial statements and related disclosures.
In August 2017, the FASB issued ASU No. 2017-12, Derivatives and Hedging (Topic 815): Targeted Improvement to Accounting for Hedging Activities, which simplifies the application of hedge accounting guidance in addition to improving the financial reporting of hedging relationships. According to the superseding standard ASU No. 2019-10, Financial Instruments—Credit Losses (Topic 326), Derivatives and Hedging (Topic 815), and Leases (Topic 842), that deferred the effective date of Topic 815, this standard becomes effective for the Company on July 1, 2021. However, the Company plans to early adopt the standard in the fourth quarter of fiscal 2020 and, since the adoption will be prospective, there will be no material impact on its consolidated financial statements and related disclosures.
In December 2019, the FASB issued ASU No. 2019-12, Income Taxes (Topic 740): Simplifying the Accounting for Income Taxes, which simplifies and changes the accounting for certain income tax transactions, among other minor improvements. This standard becomes effective for the Company on July 1, 2022 and for interim periods beginning July 1, 2023, with early adoption permitted. The Company is currently evaluating the impact to its consolidated financial statements and related disclosures.
In March of 2020, the FASB issued ASU No. 2020-04, Reference Rate Reform (Topic 848): Facilitation of the Effects of Reference Rate Reform on Financial Reporting, which provides optional expedients and exceptions for applying generally accepted accounting principles to certain contract modifications and hedging relationships that reference London Inter-bank Offered Rate (LIBOR) or another reference rate expected to be discontinued. The guidance is effective upon issuance and generally can be applied through December 31, 2022. The Company is currently evaluating the impact to its consolidated financial statements and related disclosures.
F-8
Table of Contents
| 2. | PROPERTY AND EQUIPMENT—NET |
Property and equipment—net consisted of the following for the periods presented below (in thousands):
| June 30, 2019 |
March 31, 2020 |
|||||||
| Computer hardware |
$ | 5,674 | $ | 9,834 | ||||
| Equipment |
1,769 | 2,255 | ||||||
| Leasehold improvements |
11,504 | 15,720 | ||||||
| Furniture and fixtures |
3,646 | 4,923 | ||||||
| Work in progress |
392 | 176 | ||||||
|
|
|
|
|
|||||
| Total |
22,985 | 32,908 | ||||||
| Less accumulated depreciation |
(9,226 | ) | (12,891 | ) | ||||
|
|
|
|
|
|||||
| Property and equipment—net |
$ | 13,759 | $ | 20,017 | ||||
|
|
|
|
|
|||||
Work in progress as of June 30, 2019 and March 31, 2020, primarily represents tenant improvements not yet put into service and not yet being depreciated. Depreciation expense for the nine month periods ended March 31, 2020 and 2019 was $3.8 million and $3.0 million, respectively.
| 3. | SOFTWARE—NET |
Property and equipment—net consisted of the following for the periods presented below (in thousands):
| June 30, 2019 |
March 31, 2020 |
|||||||
| Software |
$ | 7,067 | $ | 10,484 | ||||
| Work in progress |
1,876 | 1,766 | ||||||
|
|
|
|
|
|||||
| Total |
8,943 | 12,250 | ||||||
| Less accumulated amortization |
(4,048 | ) | (4,411 | ) | ||||
|
|
|
|
|
|||||
| Software—net |
$ | 4,895 | $ | 7,839 | ||||
|
|
|
|
|
|||||
Work in progress as of June 30, 2019 and March 31, 2020, primarily represents costs incurred for software not yet put into service and not yet being depreciated. Amortization expense for the nine month periods ended March 31, 2020 and 2019 was $1.5 million and $0.4 million, respectively
| 4. | DEBT |
Credit Agreement and Senior Secured Credit Facility—Debt consisted of the following for the periods presented below (in thousands):
| June 30, 2019 |
March 31, 2020 |
|||||||
| Credit Agreement |
$ | 11,032 | $ | — | ||||
| Term Loan |
— | 425,000 | ||||||
| Unamortized debt issuance costs on Term Loan |
— | (6,155 | ) | |||||
| Unamortized debt discount on Term Loan |
— | (7,791 | ) | |||||
|
|
|
|
|
|||||
| Total debt |
$ | 11,032 | 411,054 | |||||
|
|
|
|
|
|||||
On November 6, 2017, the Company entered into a two-year Loan and Security Agreement (the “Credit Agreement”) with UMB Bank N.A. (“UMB”). The Company incurred $0.2 million in debt issuance costs for the Credit Agreement for origination and legal fees that were recorded in other assets in the condensed consolidated balance sheet as of June 30, 2018. These debt issuance costs were being amortized through interest expense on a straight-line basis over the two-year life of the Credit Agreement.
F-9
Table of Contents
Subsequently, on November 5, 2019, the Credit Agreement was terminated when the Company entered into a new credit agreement with UMB as a lender and revolving agent and Morgan Stanley Capital Administrators, Inc. (“Morgan Stanley”) as a lender and the administrative agent for a syndicate of lenders party to the agreement (the “Senior Secured Credit Facility”). The termination of the Credit Agreement was treated as a debt modification pursuant to the relevant accounting guidance and the remaining balance of unamortized debt issuance costs of $0.05 million are now being amortized over the five-year life of the Senior Secured Credit Facility.
The Senior Secured Credit Facility provides for (1) a secured revolving loan facility with UMB in an aggregate principal amount of up to $75.0 million (the “Revolving Credit Facility”) and (2) a senior secured term loan facility in an aggregate principal amount of $425.0 million with a syndicate of lenders led by Morgan Stanley as the administrator for the lending group (the “Term Loan”). The outstanding balance under the prior Credit Agreement with UMB was rolled into the Revolving Credit Facility and will continue to be used for general working capital purposes as needed. The proceeds of the Term Loan were used (i) to finance a distribution to all holders of the Company’s common and Series A, B, C and D preferred stock as well as holders of stock options in an aggregate amount of $275.0 million (the “Distribution”), (ii) to fund cash to the balance sheet in an aggregate amount of $68.0 million, equal to the first two years of interest-only payments due in respect of the Term Loan, (iii) to pay the debt issuance costs incurred for the Senior Secured Credit Facility, and (iv) for general corporate purposes. The Senior Secured Credit Facility contains customary events of default and an asset coverage ratio covenant. As of March 31, 2020, the Company was in compliance with all of the covenants. The Company has granted a security interest in all of the Company’s assets as collateral (excluding the collateral designated for the Receivables Financing Agreement, as defined below).
The Company incurred $8.0 million in debt issuance costs for the Senior Secured Credit Facility for origination and legal fees which were allocated to the Revolving Credit Facility and the Term Loan on a pro rata basis based on the aggregate principal amount of $500.0 million. Accordingly, $1.2 million was recorded in other assets and $6.8 million was recorded as a reduction to the carrying amount of the Term Loan in debt in the condensed consolidated balance sheet. The debt issuance costs are being amortized through interest expense on a straight-line basis over the five-year life of the Senior Secured Credit Facility. As of March 31, 2020, the balance of the unamortized debt issuance costs in other assets and debt in the condensed consolidated balance sheet was $1.1 million and $6.2 million, respectively.
Additionally, the Company paid $8.5 million to the lenders of the Term Loan as an original issue discount which was recorded as a reduction to the carrying amount of the Term Loan in debt in the condensed consolidated balance sheet as of March 31, 2020. The debt discount is being amortized through interest expense on a straight-line basis over the five-year life of the Senior Secured Credit Facility. As of March 31, 2020, the balance of the unamortized debt discount in debt in the condensed consolidated balance sheet was $7.8 million.
The Revolving Credit Facility accrues interest on amounts drawn at a rate per annum equal to either (a) LIBOR plus 4.0% or (b) a base rate plus 3.0%, at the Company’s option. The Term Loan bears interest on the outstanding principal amount thereof at a rate per annum equal to either (a) LIBOR plus 6.0% or (b) a base rate plus 5.0%, at the Company’s option. The Company’s risk management strategy may include entering into interest rate swap agreements to protect against unfavorable interest rate changes relating to forecasted debt transactions.
The Term Loan is repayable beginning from March 31, 2022, in equal quarterly installments in an aggregate annual amount equal to 1% of the original principal amount of the Term Loan, with the balance payable on the maturity date of November 5, 2024. If the Company completes its anticipated public offering, it will be required to immediately prepay a minimum of 25% of the net proceeds from the offering, up to $150.0 million. In addition to paying interest on outstanding principal amounts under the Senior Secured Credit Facilities, the Company is required to pay UMB an unused commitment fee of 0.15%, in respect of the unutilized commitments under the Revolving Credit Facility. The Revolving Credit Facility also has a maturity date of November 5, 2024.
F-10
Table of Contents
Non-Recourse Debt—Non-recourse debt consisted of the following for the periods presented below (in thousands):
| June 30, 2019 |
March 31, 2020 |
|||||||
| Delayed draw credit facility |
$ | 14,835 | $ | 24,554 | ||||
| Unamortized debt issuance costs |
(300 | ) | (247 | ) | ||||
|
|
|
|
|
|||||
| Total non-recourse debt |
14,535 | 24,307 | ||||||
| Less non-recourse debt—current |
3,920 | 5,618 | ||||||
|
|
|
|
|
|||||
| Non-recourse debt—net |
$ | 10,615 | $ | 18,689 | ||||
|
|
|
|
|
|||||
On December 14, 2018, the Company entered into a senior secured delayed draw credit facility (the “Receivables Financing Agreement”). Pursuant to the Receivables Financing Agreement, the Company has access to a senior secured delayed draw credit facility consisting of up to $30 million aggregate principal amount of commitments (the “Commitment”), with no more than quarterly draws in an aggregate original principal amount not to exceed the Commitment, with the commissions receivable from the Auto & Home insurance policies sold by SQAH as collateral. As the underlying policyholders renew their policies, the renewal commissions received from the insurance carriers are transferred to the lender as repayment of the draw, with any accrued interest being paid first. Each loan accrues interest at 11.5% that is computed on a daily basis on the unpaid principal and interest amounts. If the amount of renewal commissions received is not enough to pay off the loan balances, there is no recourse to the Company. If the Company continues to receive renewal commissions on the underlying policies after the time at which the loan balances are paid off, the right to those renewal commissions reverts back to the Company. The Receivables Financing Agreement contains customary events of default and a tangible net worth covenant. As of March 31, 2020, the Company was in compliance with all of the covenants.
As of March 31, 2020, the Company has received $28.3 million in proceeds from six draws on the facility and has made principal payments of $3.7 million, of which $2.4 million was repaid during the nine month period ended March 31, 2020, with the remaining balance due recorded in non-recourse debt in the condensed consolidated balance sheet. The Company made $0.6 million of principal payments during the nine month period ended March 31, 2019. The proceeds from the loans are being used for general working capital purposes. As of March 31, 2020, the Company had unused borrowing availability of $1.7 million.
In its capacity as servicer under the Receivables Financing Agreement, SQAH performs administrative duties such as transferring principal and interest payments between the two parties, tracking loan balances, and weekly and monthly reporting, and receives a monthly de minimus servicing fee as payment. The Company incurred $0.3 million of debt issuance costs in connection with the facility. Debt issuance costs are amortized through interest expense over the estimated time to pay off the individual note balances of five years for each draw. As of March 31, 2020, the unamortized debt issuance costs recorded as a discount to non-recourse debt—net in the condensed consolidated balance sheet was $0.2 million. Accrued interest related to the Receivables Financing Agreement was $0.3 million as of March 31, 2020, and is recorded in accounts payable and accrued expenses in the condensed consolidated balance sheet.
On April 20, 2020, the Company made its seventh draw on the facility in the amount of $4.5 million, which was recorded in non-recourse debt in the condensed consolidated balance sheet. The seventh draw was permitted by the sole lender, but such draw triggered a prepayment obligation which was waived by the sole lender.
F-11
Table of Contents
The loans drawn on the Receivables Financing Agreement are recorded on the condensed consolidated balance sheet at amortized cost. The fair value of the loans is measured as a level 3 liability and is based on the incremental borrowing rate for similar debt. However, as the underlying assets securing the loans are of high credit quality and turn over quickly, the Company has determined that the fair value approximates carrying value.
| 5. | REVENUES FROM CONTRACTS WITH CUSTOMERS |
Disaggregation of Revenue from Contracts with Customers—The disaggregation of revenue by segment and product is depicted for the periods presented below, and is consistent with how the Company evaluates its financial performance (in thousands):
| Nine Months Ended March 31, |
||||||||
| 2019 | 2020 | |||||||
| Senior: |
||||||||
| Commission revenue: |
||||||||
| Medicare advantage |
$ | 114,358 | $ | 220,536 | ||||
| Medicare supplement |
20,841 | 27,284 | ||||||
| Prescription drug plan |
2,875 | 2,391 | ||||||
| Dental, vision, and health |
2,910 | 5,674 | ||||||
| Other commission revenue |
2,410 | 380 | ||||||
|
|
|
|
|
|||||
| Total commission revenue |
143,394 | 256,265 | ||||||
| Production bonus and other revenue |
15,065 | 17,543 | ||||||
|
|
|
|
|
|||||
| Total Senior revenue |
158,459 | 273,808 | ||||||
|
|
|
|
|
|||||
| Life: |
||||||||
| Commission revenue: |
||||||||
| Term |
55,424 | 55,745 | ||||||
| Other commission revenue |
8,606 | 15,339 | ||||||
|
|
|
|
|
|||||
| Total commission revenue |
64,030 | 71,084 | ||||||
| Production bonus and other revenue |
15,555 | 16,459 | ||||||
|
|
|
|
|
|||||
| Total Life revenue |
79,585 | 87,543 | ||||||
|
|
|
|
|
|||||
| Auto & Home: |
||||||||
| Total commission revenue |
23,788 | 26,921 | ||||||
| Production bonus and other revenue |
1,447 | 2,140 | ||||||
|
|
|
|
|
|||||
| Total Auto & Home revenue |
25,235 | 29,061 | ||||||
|
|
|
|
|
|||||
| Eliminations: |
||||||||
| Total commission revenue |
(209 | ) | (344 | ) | ||||
|
|
|
|
|
|||||
| Total commission revenue |
231,003 | 353,926 | ||||||
| Total production bonus and other revenue |
32,067 | 36,142 | ||||||
|
|
|
|
|
|||||
| Total revenue |
$ | 263,070 | $ | 390,068 | ||||
|
|
|
|
|
|||||
Contract Balances—After a policy is sold, the Company has no material additional or recurring obligations to the policyholder or the insurance carrier. As such, there are no contract liabilities recorded in the condensed consolidated balance sheets. As there was no activity in the contract balances other than the normal movement between the contract balance accounts for the nine month periods ended March 31, 2019 and 2020, a separate roll forward other than what is shown on the condensed consolidated balance sheets is not relevant. Cumulative catch-up adjustments related to changes in the estimates of transaction prices were not material during the nine month period ended March 31, 2020.
F-12
Table of Contents
| 6. | INCOME TAXES |
For the nine month periods ended March 31, 2019 and 2020, the Company recognized income tax expense of $18.2 million and $19.1 million, respectively, representing an effective tax rate of 23.4% and 23.8%, respectively. The differences from the Company’s federal statutory tax rates to the effective tax rates for both periods were primarily due to state income taxes and non-deductible meals and entertainment expenses, partially offset by Kansas High Performance Incentive Program (“HPIP”) tax credits.
Assessing the realizability of the Company’s deferred tax assets is dependent upon several factors, including the likelihood and amount, if any, of future taxable income in relevant jurisdictions during the periods in which those temporary differences become deductible. The Company forecasts taxable income by considering all available positive and negative evidence, including historical data and future plans and estimates. These assumptions require significant judgment about future taxable income. As a result, the amount of deferred tax assets considered realizable is subject to adjustment in future periods if estimates of future taxable income change. The Company continues to recognize its deferred tax assets as of March 31, 2020, as it believes it is more likely than not that the net deferred tax assets will be realized. The Company recognizes a significant deferred tax liability due to the timing of recognizing revenue when a policy is sold, while revenue recognition for tax purposes is not recognized until future renewal commission payments are received. This deferred tax liability is a source of income that can be used to support the realizability of the Company’s deferred tax assets. As such, the Company does not believe a valuation allowance is necessary as of March 31, 2020, and will continue to evaluate in the future as circumstances may change.
On March 27, 2020, the Coronavirus Aid, Relief, and Economic Security Act (“CARES Act”) was signed into law. The CARES Act provides numerous tax provisions and other stimulus measures, including temporary changes regarding the prior and future utilization of net operating losses, temporary changes to the prior and future limitations on interest deductions, temporary suspension of certain payment requirements for the employer portion of social security taxes, the creation of certain refundable employee retention credits, and technical corrections from prior tax legislation for tax depreciation of certain qualified improvement property. The Company is currently evaluating the impact on its consolidated financial statements and has not yet quantified the impact to the financial statements that may result from the CARES Act. The Company anticipates it will benefit from the technical correction for qualified leasehold improvements eligible for 100% tax bonus depreciation, and beginning with pay dates on and after April 10, 2020, the Company has elected to defer the employer-paid portion of social security taxes. The Company is also currently assessing its eligibility for certain employee retention tax credits but does not expect such credits to have a material impact on the financial statements.
| 7. | COMMITMENTS AND CONTINGENCIES |
Lease Obligations—The Company leases office facilities in the United States in San Francisco, California; San Diego, California; Centennial, Colorado; Jacksonville, Florida; Overland Park, Kansas; Wilmington, North Carolina; and Des Moines, Iowa under noncancelable operating leases that expire at various dates through July 2029.
At March 31, 2020, future annual minimum lease obligations under noncancelable operating leases are as follows (in thousands):
| Period ending March 31, | Operating Leases |
|||
| 2021 |
$ | 8,543 | ||
| 2022 |
8,057 | |||
| 2023 |
7,330 | |||
| 2024 |
7,570 | |||
| 2025 |
7,632 | |||
| Thereafter |
22,855 | |||
|
|
|
|||
| Total minimum lease payments |
$ | 61,987 | ||
|
|
|
|||
F-13
Table of Contents
The Company has entered into noncancelable agreements to sublease portions of its office facilities to unrelated third parties. Sublease rental income is recorded as a reduction of rent expense in the accompanying condensed consolidated statement of operations. Sublease rental income totaled $0.3 million and $0.2 million during the nine month periods ended March 31, 2019 and 2020, respectively. Future minimum lease payments for operating leases have not been reduced by the future minimum sublease income in the schedule above.
The Company recognizes rent expense on a straight-line basis over the lease period and has accrued for rent expense incurred but not paid. Rent expense for operating leases, net of sublease income, lease incentives, and rent recorded as restructuring expenses was $3.2 million and $5.1 million for the nine month periods ended March 31, 2019 and 2020, respectively, recorded in general and administrative operating costs and expenses in the condensed consolidated statements of operations.
Legal Contingencies and Obligations—From time to time, the Company is subject to legal proceedings and claims in the ordinary course of business. The Company currently is not aware of any legal proceedings or claims that it believes will have, individually or in the aggregate, a material adverse effect on its business, financial condition, operating results, or cash flows.
| 8. | NET INCOME (LOSS) PER SHARE AND UNAUDITED PRO FORMA NET INCOME PER SHARE |
The Company calculates net income per share as defined by ASC Topic 260, “Earnings per Share”. Basic net income (loss) per share (“Basic EPS”) is computed by dividing net income attributable to common shareholders by the weighted-average common stock outstanding during the respective period. Net income (loss) attributable to common shareholders is computed by deducting both the dividends declared in the period on preferred stock and the dividends accumulated for the period on cumulative preferred stock from net income. Diluted net income (loss) per share (“Diluted EPS”) is computed by dividing net income attributable to common and common equivalent shareholders by the total of the weighted-average common stock outstanding and common equivalent shares outstanding during the respective period. For the purpose of calculating the Company’s Diluted EPS, common equivalent shares outstanding include the conversion of the Series A, B, C and D preferred stock at an 8:1 ratio, as the rights and privileges dictate as such (refer to Note 9 to the condensed consolidated financial statements) and common shares issuable upon the exercise of outstanding employee stock options. The number of common equivalent shares outstanding has been determined in accordance with the if-converted method for the preferred stock and the treasury stock method for employee stock options to the extent they are dilutive. Under the treasury stock method, the exercise price paid by the option holder and future share-based compensation expense that the Company has not yet recognized are assumed to be used to repurchase shares.
The following table sets forth the computation of Basic and Diluted net income (loss) per share for the periods presented (in thousands, except per share amounts):
| Nine Months Ended March 31, |
||||||||
| 2019 | 2020 | |||||||
| Basic: |
||||||||
| Numerator: |
||||||||
| Net income |
$ | 59,692 | $ | 61,098 | ||||
| Less: dividends declared on Series A, B, C & D preferred stock |
(331 | ) | (86,302 | ) | ||||
| Less: cumulative dividends on Series D preferred stock |
(9,008 | ) | (9,041 | ) | ||||
|
|
|
|
|
|||||
| Net income (loss) attributable to common shareholders |
50,353 | (34,245 | ) | |||||
| Denominator: |
||||||||
| Weighted-average common stock outstanding |
84,976 | 89,989 | ||||||
|
|
|
|
|
|||||
| Net income (loss) per share—basic: |
$ | 0.59 | $ | (0.38 | ) | |||
|
|
|
|
|
|||||
F-14
Table of Contents
| Nine Months Ended March 31, |
||||||||
| 2019 | 2020 | |||||||
| Diluted: |
||||||||
| Numerator: |
||||||||
| Net income (loss) attributable to common shareholders |
$ | 50,353 | $ | (34,245 | ) | |||
| Add: dividends declared on Series A, B & C preferred stock |
91 | — | ||||||
| Add: dividends declared on Series D preferred stock |
240 | — | ||||||
| Add: cumulative dividends on Series D preferred stock |
9,008 | — | ||||||
|
|
|
|
|
|||||
| Net income (loss) attributable to common and common equivalent shareholders |
59,692 | (34,245 | ) | |||||
| Denominator: |
||||||||
| Weighted-average common stock outstanding |
84,976 | 89,989 | ||||||
| Series A, B & C preferred stock outstanding(1) |
12,071 | — | ||||||
| Series D preferred stock outstanding(1) |
32,000 | — | ||||||
| Stock options outstanding to purchase shares of common stock(1) |
3,928 | — | ||||||
|
|
|
|
|
|||||
| Total common and common equivalent shares outstanding |
132,975 | 89,989 | ||||||
|
|
|
|
|
|||||
| Net income (loss) per share—diluted: |
$ | 0.45 | $ | (0.38 | ) | |||
|
|
|
|
|
|||||
| (1) | For the nine months ended March 31, 2020, the Company had securities outstanding that could potentially dilute earnings per share, but the shares from the assumed conversion or exercise of these securities were excluded in the computation of diluted net loss per share as their effect would have been anti-dilutive. |
The number of outstanding anti-dilutive shares that were excluded from the computation of diluted net loss per share consisted of the following for the periods presented (in thousands):
| Nine Months Ended March 31, |
||||||||
| 2019 | 2020 | |||||||
| Series A, B & C preferred stock outstanding |
— | 12,071 | ||||||
| Series D preferred stock outstanding |
— | 32,000 | ||||||
| Stock options outstanding to purchase shares of common stock |
— | 4,146 | ||||||
|
|
|
|
|
|||||
| — | 48,217 | |||||||
The following table sets forth the computation of the Company’s pro forma basic and diluted net income per share for the period presented (in thousands, except per share amounts):
| Nine Months Ended March 31, 2019 |
||||
| Basic: |
||||
| Numerator: |
||||
| Net income |
$ | 61,098 | ||
| Denominator: |
||||
| Weighted-average common stock outstanding |
134,060 | |||
|
|
|
|||
| Pro forma net income per share—basic: |
$ | 0.46 | ||
|
|
|
|||
F-15
Table of Contents
| Nine Months Ended March 31, 2019 |
||||
| Diluted: |
||||
| Numerator: |
||||
| Net income attributable to common and common equivalent shareholders |
$ | 61,098 | ||
| Denominator: |
||||
| Weighted-average common stock outstanding |
134,060 | |||
| Stock options outstanding to purchase shares of common stock |
4,146 | |||
|
|
|
|||
| Total common and common equivalent shares outstanding |
138,206 | |||
|
|
|
|||
| Pro forma net income per share—diluted: |
$ | 0.44 | ||
|
|
|
|||
| 9. | SHAREHOLDERS’ EQUITY |
Common and preferred shares issued include shares outstanding and shares held in the treasury stock.
Common Stock—As of March 31, 2020, the Company has reserved the following authorized, but unissued, shares of common stock:
| Series A redeemable convertible preferred stock |
6,782,208 | |||
| Series B convertible preferred stock |
4,878,192 | |||
| Series C convertible preferred stock |
410,952 | |||
| Series D convertible preferred stock |
32,000,000 | |||
| Options issued and outstanding under stock option plans |
4,095,968 | |||
| Options available for issuance under stock option plans |
519,560 | |||
|
|
|
|||
| Total |
48,686,880 | |||
|
|
|
Series A, B, C and D Preferred Stock—The Company’s Series A, B, C and D preferred stock is all classified as temporary equity. As per guidance under ASC 480-10-S99-3A(4), ASR 268 requires equity instruments with redemption features that are not solely within the control of the issuer to be classified outside of permanent equity, in temporary equity.
As per the terms of the Series A, B and C preferred stock, it is redeemable for cash and other assets on the occurrence of a deemed liquidation event. A deemed liquidation event includes a change of control which is outside of the Company’s control, since a purchaser could acquire a majority of the voting power of the Company without the approval of the Board. As such, since Series A, B and C preferred stock is redeemable upon the occurrence of an event that is not solely within the Company’s control, the Series A, B and C preferred stock is classified as temporary equity.
As per the terms of the Series D preferred stock, it is redeemable for cash or other assets upon occurrence of a change of control (including deemed liquidation events), trigger events and passage of time. Specifically, in case of passage of time, the Series D investors may require the Company to redeem all shares of Series D for cash, at their option, on or after July 23, 2021. The Company cannot avoid such redemption, if elected by the Major Series D investors. Accordingly, the Series D preferred stock is required to be classified outside of permanent equity as it is redeemable outside the control of the Company.
F-16
Table of Contents
Significant terms of the outstanding Series A, B, C, and D preferred stock are as follows:
Conversion—Each share of Series A, B, C, and D preferred stock may be converted into eight shares of common stock. Conversion is (i) at the option of the preferred shareholders and (ii) automatic upon the closing of an initial public offering of the Company’s common stock, meeting, in the case of the Series D, certain minimum requirements with respect to aggregate cash proceeds, pre-offering valuation of the Company and listing of such shares of common stock on the New York Stock Exchange or the NASDAQ Stock Market (the “Qualified IPO”), and upon the consent of a majority of the outstanding Series D shares.
Dividends—The holders of Series A, B, and C preferred stock are entitled to receive in any fiscal year noncumulative dividends at the rate of $0.00913 per share, $0.0365 per share, and $0.073 per share, respectively, when and if declared by the Company’s board of directors and at its discretion, before any dividends are paid on common or other preferred shares. Such dividends, whether undeclared or unpaid, shall not bear or accrue interest.
The holders of Series D preferred stock are entitled to receive cumulative dividends accrued at the rate of $3.00 per year, computed on the basis of a 365-day year from July 23, 2014, until July 23, 2021. Such dividends are payable only when and if declared by the board of directors. As of March 31, 2020, the aggregate cumulative preferred dividends and per-share amount were $68.3 million and $17.07, respectively.
On November 15, 2019, the Company declared a distribution of $188.7 million on all outstanding common stock and stock options (regardless of vesting status) ($1.96 per share) and $86.3 million on all outstanding Series A, B, C and D preferred stock ($15.66 per share), which was paid on November 20, 2019 (the “Distribution”). Of the Distribution, $265.8 million was paid to existing shareholders and $9.2 million was paid to stock option holders. The Distribution to shareholders is characterized as ordinary dividends up to accumulated earnings at the time of Distribution, with the excess over earnings of $58.4 million treated as a return of capital and recorded as a reduction to additional paid-in capital in the condensed consolidated balance sheet as of March 31, 2020. The Distribution to stock option holders is characterized as an equity restructuring where a one-time large cash payment is made in lieu of modifying the option award as the Company’s stock options plans do not allow for dividends to be distributed to holders of stock options and do not provide any dividend protections. Although no other terms of the option awards were modified, this Distribution resulted in a modification to the outstanding awards and incremental share-based compensation expense was recorded in the condensed consolidated statement of operations during the nine month period ended March 31, 2020, for the increase in fair value over the original awards of $9.2 million.
Liquidation—In the event of any liquidation, dissolution or winding-up of the Company, either voluntarily or involuntarily, the holders of Series D preferred stock are entitled to receive the assets of the Company available for distribution, before any payment shall be made to the holders of any other class or series of capital stock of the Company, an amount equal to $20 per share, plus any unpaid cumulative dividends. The holders of Series A, B, and C preferred stock are, respectively, entitled to receive the remaining assets of the Company available for distribution, before any payment shall be made in respect of the common stock, an amount equal to $0.15 per share of Series A preferred stock, $0.61 per share of Series B preferred stock, and $1.22 per share of Series C preferred stock, plus any dividends thereon declared but unpaid. If the assets of the Company available for distribution are not sufficient to pay the full amount of distribution, plus any dividends thereon declared but unpaid, such assets will be distributed to Series D preferred stock holders based on its preferential amounts per share, and then ratably among the holders of the Series A, B, and C preferred stock based on the full preferential amount per share of the respective preferred stock that each such holder is entitled to receive.
Redemption—The Company may at any time, at the election of the board of directors and upon 60 days’ written notice, redeem all or part of the outstanding shares of Series A preferred stock at $0.15 per share. Shares of Series B and C preferred stock are not subject to mandatory redemption.
F-17
Table of Contents
Series D preferred stock is also not subject to mandatory redemption; however, such shall be redeemed by the Company upon the delivery of a written notice (the “Put Notice”) requesting redemption of all of such Put Shares and delivered by the holders of at least a majority of the then outstanding Put Shares held by all of the Major Series D Investors.
The price per share of the Put Shares that are Series D preferred stock, payable by the Company in connection with a Put Notice, shall be equal to the greater of (i) Original Issue Price, plus all Accruing Dividend accrued but unpaid thereon, whether or not declared, together with any other dividends declared but unpaid thereon; (ii) the amount that would be paid with respect to such Put Share, assuming the conversion of all shares of Series D preferred stock into shares of Common Stock, in connection with a sale of all of the issued and outstanding capital stock as of the date of such Redemption Event for an aggregate purchase price equal to the product of (A) ten multiplied by (B) the Consolidated GAAP EBITDA (as defined in the Series D Preferred Stock Investors’ Rights and Stockholders Agreement (the “Series D Stockholders Agreement”)) for the trailing twenty month period ending on the last day of the most recent completed fiscal quarter prior to the date of such Redemption Event, divided by two and (iii) the amount that would be paid with respect to such share in connection with a sale of all of the issued and outstanding capital stock of the Company as of the date of such Redemption Event for the fair market value of such capital stock as determined by the mutual consent of the Board and the holders of the majority of Put Shares.
Voting Rights—Each share of Series A, B, C, and D preferred stock has voting rights equal to the number of common shares into which it is convertible. Additionally, the holders of the Series D preferred were given the right to appoint two members to a six-member board of directors and of approval from those two members for certain actions by the Company.
Other Rights—On July 23, 2021, or upon the occurrence of certain material triggering events (that primarily includes, any breach, default or event of default with respect to any indebtedness for borrowed money of the Company and/or its subsidiaries, and occurrence of any material breach by the Company of its duties and obligations under the Certificate of Incorporation or the Series D Stockholders Agreement with respect to the Series D preferred stock), the holders of Series D preferred stock are entitled to either force the sale of the Company or require the repurchase of the shares at the greater of i) the original issue price plus accrued but unpaid dividends, ii) the price per share obtained in a sale for the common stock, or iii) lacking a sale, then either the appraised value or a formulaic value based on profitability during the preceding 24 months (the “put right option”). The holders of Series D preferred stock are also entitled to drag along and preemptive rights.
On November 4, 2019, the Company amended the Series D Stockholders Agreement to, among other items, extend the put right option date to January 31, 2025, subject to various terms and conditions and, upon completion of a Qualified IPO, eliminate the put right option. On April 17, 2020, the Company further amended the Series D Stockholders Agreement to extend the put right option date to March 30, 2025,
Series E Preferred Stock— On April 17, 2020 and May 6, 2020, the Company issued and sold an aggregate of 100,000 shares and 35,000 shares, respectively, of its Series E preferred stock to certain “accredited investors” (as defined in Regulation D promulgated under the Securities Act of 1933), at a purchase price of $1,000 per share, for aggregate proceeds of approximately $135.0 million and net proceeds to the Company of approximately $129.0 million, after deducting commissions and expenses. In connection with the sale of these shares, the Company entered into Investor Rights Letters with the purchasers of the Series E preferred stock which grant them certain rights, including but not limited to certain preemptive rights and information rights. Upon the closing of the Company’s anticipated initial public offering, the foregoing rights will terminate, and all outstanding shares of Series E preferred stock will automatically convert into shares of common stock at a fixed discount to the initial offering price.
Stock Split—On February 28, 2020, the Board of Directors of the Company resolved via unanimous written consent to: i) approve an eight-for-one forward stock split pursuant to which each outstanding share of the
F-18
Table of Contents
Company’s common stock would become eight shares of the Company’s common stock (the “Forward Stock Split”), ii) approve an amendment to the Company’s Fifth Amended and Restated Certificate of Incorporation, increasing the number of authorized shares of the Company’s common stock from 23.0 million shares to 700.0 million shares (the “Amendment”), and iii) submit the Amendment to the Company’s stockholders for approval. On February 28, 2020, the holders of more than 50% of the outstanding shares of voting stock of the Company approved the Amendment and the Amendment was filed with the Secretary of State of the State of Delaware. The par value of each share of the Company’s common stock was not adjusted in connection with the aforementioned Forward Stock Split. The number of shares of the Company’s Series A, B, C and D preferred stock did not change as a result of the Forward Stock Split. However, per the terms of the Company’s Series A, B, C and D preferred stock, the conversion ratios for those series of preferred stock were split effected and adjusted from 1:1 to 8:1.
Treasury Share Retirement—On March 30, 2020, the Company retired 4.0 million shares of its common stock and preferred stock held in treasury. The shares were returned to the status of authorized but unissued shares. As a result, the treasury stock balance as of March 31, 2020 was reduced to zero, and the common stock, preferred stock, and retained earnings balances in the condensed consolidated balance sheet were reduced by $0.1 million, $0.2 million and $77.0 million, respectively.
| 10. | SEGMENT INFORMATION |
The Company’s reportable segments have been determined in accordance with ASC 280, Segment Reporting. The Company currently has three reportable segments: i) Senior ii) Life and iii) Auto & Home which represent the three main different types of insurance products sold by the Company. The Senior segment primarily sells senior Medicare-related health insurance, the Life segment primarily sells term life insurance, and the Auto & Home segment primarily sells individual automobile and homeowners’ insurance. In addition, the Company accounts for non-operating activity, share-based compensation expense, certain intersegment eliminations, and the costs of providing corporate and other administrative services in its administrative division, Corporate & Eliminations. These services are not directly identifiable with the Company’s reportable segments and are shown in the tables below to reconcile the reportable segments to the condensed consolidated financial statements. The Company has not aggregated any operating segments together to represent a reportable segment.
The Company reports segment information based on how its chief executive officer, who is the chief operating decision maker (“CODM”), regularly reviews its operating results, allocates resources, and makes decisions regarding business operations. The performance measures of the segments include total revenue and Adjusted EBITDA because management believes that such information is the most relevant in evaluating the results of the respective segments relative to other entities that operate in the same industries.
Costs of revenue, marketing and advertising, and technical development operating expenses that are directly attributable to a segment are reported within the applicable segment. Indirect costs of revenue, marketing and advertising, and technical development operating expenses are allocated to each segment based on varying metrics such as headcount. Adjusted EBITDA is calculated as total revenue for the applicable segment less direct and allocated costs of revenue, marketing and advertising, technical development, and general and administrative operating costs and expenses, excluding depreciation and amortization expense; loss on disposal of property, equipment and software; share-based compensation expense; restructuring expenses; and non-recurring expenses such as restructuring expenses, severance payments and transaction costs. Our CODM does not separately evaluate assets by segment; therefore, assets by segment are not presented.
F-19
Table of Contents
The following table presents information about the reportable segments for the nine month period ended March 31, 2019 (in thousands):
| Senior | Life | Auto & Home | Corp & Elims | Consolidated | ||||||||||||||||
| Revenue |
$ | 158,459 | $ | 79,585 | $ | 25,235 | $ | (209 | ) | $ | 263,070 | |||||||||
| Operating expenses |
(81,280 | ) | (62,864 | ) | (19,695 | ) | (13,464 | )(1) | (177,303 | ) | ||||||||||
| Other expenses |
— | — | — | (8 | ) | (8 | ) | |||||||||||||
|
|
|
|
|
|
|
|
|
|
|
|||||||||||
| Adjusted EBITDA |
77,179 | 16,721 | 5,540 | (13,681 | ) | 85,759 | ||||||||||||||
| Loss on disposal of property, equipment and software |
(52 | ) | ||||||||||||||||||
| Share-based compensation expense |
(67 | ) | ||||||||||||||||||
| Non-recurring expenses(2) |
(3,180 | ) | ||||||||||||||||||
| Depreciation and amortization |
(3,446 | ) | ||||||||||||||||||
| Income tax expense |
(18,200 | ) | ||||||||||||||||||
| Interest expense |
(1,122 | ) | ||||||||||||||||||
|
|
|
|||||||||||||||||||
| Net income |
$ | 59,692 | ||||||||||||||||||
|
|
|
|||||||||||||||||||
| (1) | Operating expenses in the Corp & Elims division primarily include $8.5 million in salaries and benefits for certain general, administrative, and IT related departments and $3.2 million in professional services fees. |
| (2) | These expenses consist primarily of one-time consulting expenses associated with adopting ASC 606, non-recurring compensation to certain former board members, restructuring expenses consisting primarily of expenses associated with initiatives to reduce costs and consolidate leadership and back office functions from San Francisco to Kansas City, and non-restructuring severance expenses. |
The following table presents information about the reportable segments for the nine month period ended March 31, 2020 (in thousands):
| Senior | Life | Auto & Home | Corp & Elims | Consolidated | ||||||||||||||||
| Revenue |
$ | 273,808 | $ | 87,543 | $ | 29,061 | $ | (344 | ) | $ | 390,068 | |||||||||
| Operating expenses |
(161,456 | ) | (71,991 | ) | (23,467 | ) | (19,248 | )(1) | (276,162 | ) | ||||||||||
| Other expenses |
— | — | — | (20 | ) | (20 | ) | |||||||||||||
|
|
|
|
|
|
|
|
|
|
|
|||||||||||
| Adjusted EBITDA |
112,352 | 15,552 | 5,594 | (19,612 | ) | 113,886 | ||||||||||||||
| Loss on disposal of property, equipment and software |
(235 | ) | ||||||||||||||||||
| Share-based compensation expense |
(9,283 | ) | ||||||||||||||||||
| Non-recurring expenses(2) |
(2,648 | ) | ||||||||||||||||||
| Depreciation and amortization |
(5,273 | ) | ||||||||||||||||||
| Income tax expense |
(19,110 | ) | ||||||||||||||||||
| Interest expense |
(16,239 | ) | ||||||||||||||||||
|
|
|
|||||||||||||||||||
| Net income |
$ | 61,098 | ||||||||||||||||||
|
|
|
|||||||||||||||||||
| (1) | Operating expenses in the Corp & Elims division primarily include $10.7 million in salaries and benefits for certain general, administrative, and IT related departments and $4.3 million in professional services fees. |
| (2) | These expenses consist of one-time consulting expenses associated with adopting ASC 606, non-recurring compensation to certain former board members, non-restructuring severance expenses, employer payroll taxes on the one-time Distribution to stock option holders, costs related to our initial public offering, and expenses related to business continuity in response to the COVID-19 pandemic. |
Revenues from each of the reportable segments are earned from transactions in the United States and follow the same accounting policies used for the Company’s condensed consolidated financial statements that are described in the summary of significant accounting policies in Note 1 to the condensed consolidated financial
F-20
Table of Contents
statements. All of the Company’s long-lived assets are located in the United States. For the nine month period ended March 31, 2019, three insurance carriers customers, all from the Senior Segment, accounted for 24%, 14%, and 13% of total revenue. For the nine month period ended March 31, 2020, three insurance carrier customers, all from the Senior Segment, accounted for 27%, 19%, and 13% of total revenue.
| 11. | RELATED-PARTY TRANSACTIONS |
The Company has historically purchased leads from InsideResponse, an online marketing consulting firm previously owned in part by individuals related to one of the Company’s shareholders or are members of management. The Company incurred $7.8 million and $13.6 million in lead costs with this firm for the nine month periods ended March 31, 2019 and 2020, respectively, which were recorded in marketing and advertising expense in the condensed consolidated statements of operations. The Company owed $0.2 million and $2.2 million to this firm as of June 30, 2019 and March 31, 2020, respectively, that were recorded in accounts payable and accrued expenses in the condensed consolidated balance sheets. At June 30, 2019 and March 31, 2020, the shareholder, related affiliates, and the related members of management owned 21.36% and 17.06% of the Company, respectively.
On May 1, 2020, the Company acquired 100% of the outstanding membership units of InsideResponse for an aggregate purchase price of up to $65.0 million (subject to customary adjustments). Refer to Note 1 to the condensed consolidated financial statements for further details.
The Company purchases leads from a senior healthcare distribution platform that is owned, in part, by individuals related to one of the Company’s shareholders or who are members of the Company’s management. The Company incurred $1.5 million and $0.5 million in lead costs with this firm for the nine month periods ended March 31, 2019 and 2020, respectively, which were recorded in marketing and advertising expense in the condensed consolidated statements of operations. The Company did not have any outstanding payables as of June 30, 2019 to this firm and owed less than $0.1 million as of March 31, 2020, that was recorded in accounts payable and accrued expenses in the condensed consolidated balance sheet. In addition, the Company acts as the Field Marketing Organization on behalf of this firm. The net financial impact of this relationship to the Company was less than $0.1 million for the nine month period ended March 31, 2019, and was not material for the nine month period ended March 31, 2020. At June 30, 2019 and March 31, 2020, the shareholder, related affiliates, and the related members of management owned 21.36% and 17.06% of the Company, respectively.
The Company entered into a consulting agreement with another shareholder and former employee in January 2011 effective until canceled by either party. During each of the nine month periods ended March 31, 2019 and 2020, the Company incurred consulting expenses of less than $0.1 million that were recorded in general and administrative expense in the condensed consolidated statements of operations. The Company did not have any outstanding payables due to this consultant as of June 30, 2019 and March 31, 2020. At June 30, 2019 and March 31, 2020, the shareholder owned 3.61% and 3.47% of the Company, respectively.
As of June 30, 2019, the Company had a related party receivable outstanding from a current board member that arose from a stock option exercise that was initiated before June 30, 2019, but the payment was not received by the Company until after June 30, 2019, thus causing a $0.4 million receivable recorded in other current assets in the condensed consolidated balance sheet as of June 30, 2019. As of March 31, 2020, there were no related party receivables outstanding.
| 12. | SUBSEQUENT EVENTS |
The Company evaluated subsequent events through May 8, 2020, the date the condensed consolidated financial statements were available to be issued. Refer to Notes 1, 4, and 9 to the condensed consolidated financial statements for further information.
* * * * * *
F-21
Table of Contents
REPORT OF INDEPENDENT REGISTERED PUBLIC ACCOUNTING FIRM
To the shareholders and the Board of Directors of SelectQuote, Inc.
Opinion on the Financial Statements
We have audited the accompanying consolidated balance sheets of SelectQuote, Inc. and subsidiaries (the “Company”) as of June 30, 2019 and 2018, the related consolidated statements of operations, changes in shareholders’ equity, and cash flows, for each of the two years in the period ended June 30, 2019, and the related notes (collectively referred to as the “financial statements”). In our opinion, the financial statements present fairly, in all material respects, the financial position of the Company as of June 30, 2019 and 2018, and the results of its operations and its cash flows for each of the two years in the period ended June 30, 2019, in conformity with accounting principles generally accepted in the United States of America.
Change in Accounting Principle
As discussed in Note 1 to the financial statements, the Company changed its method of accounting for revenue as a result of the full retrospective adoption of Accounting Standards Update (“ASU”) No. 2014-09 “Revenue from Contracts with Customers (Topic 606),” as amended.
Basis for Opinion
These financial statements are the responsibility of the Company’s management. Our responsibility is to express an opinion on the Company’s financial statements based on our audits. We are a public accounting firm registered with the Public Company Accounting Oversight Board (United States) (PCAOB) and are required to be independent with respect to the Company in accordance with the U.S. federal securities laws and the applicable rules and regulations of the Securities and Exchange Commission and the PCAOB.
We conducted our audits in accordance with the standards of the PCAOB. Those standards require that we plan and perform the audit to obtain reasonable assurance about whether the financial statements are free of material misstatement, whether due to error or fraud. The Company is not required to have, nor were we engaged to perform, an audit of its internal control over financial reporting. As part of our audits, we are required to obtain an understanding of internal control over financial reporting but not for the purpose of expressing an opinion on the effectiveness of the Company’s internal control over financial reporting. Accordingly, we express no such opinion.
Our audits included performing procedures to assess the risks of material misstatement of the financial statements, whether due to error or fraud, and performing procedures that respond to those risks. Such procedures included examining, on a test basis, evidence regarding the amounts and disclosures in the financial statements. Our audits also included evaluating the accounting principles used and significant estimates made by management, as well as evaluating the overall presentation of the financial statements. We believe that our audits provide a reasonable basis for our opinion.
/s/ Deloitte & Touche LLP
Kansas City, Missouri
November 26, 2019 (March 4, 2020 as to the effects on the financial statements of the forward stock split as described in Note 1)
We have served as the Company’s auditor since 2018.
F-22
Table of Contents
SELECTQUOTE, INC. AND SUBSIDIARIES
AS OF JUNE 30, 2019 AND 2018
(In thousands, except share and per share amounts)
| 2019 | 2018(1) | |||||||
| ASSETS |
||||||||
| CURRENT ASSETS: |
||||||||
| Cash |
$ | 570 | $ | 958 | ||||
| Accounts receivable |
59,829 | 51,153 | ||||||
| Commissions receivable—current |
36,108 | 27,863 | ||||||
| Other current assets |
6,450 | 3,593 | ||||||
|
|
|
|
|
|||||
| Total current assets |
102,957 | 83,567 | ||||||
| COMMISSIONS RECEIVABLE—Net |
279,489 | 196,095 | ||||||
| PROPERTY AND EQUIPMENT—Net |
13,759 | 11,082 | ||||||
| SOFTWARE—Net |
4,895 | 929 | ||||||
| GOODWILL |
5,364 | 5,364 | ||||||
| OTHER ASSETS |
476 | 520 | ||||||
|
|
|
|
|
|||||
| TOTAL ASSETS |
$ | 406,940 | $ | 297,557 | ||||
|
|
|
|
|
|||||
| LIABILITIES, TEMPORARY EQUITY, AND SHAREHOLDERS’ EQUITY |
||||||||
| CURRENT LIABILITIES: |
||||||||
| Accounts payable and accrued expenses |
$ | 13,648 | $ | 10,588 | ||||
| Accrued compensation and benefits |
12,566 | 9,045 | ||||||
| Commission advances |
2,025 | 3,302 | ||||||
| Capital lease obligations—current |
33 | 33 | ||||||
| Deferred rent and lease incentives—current |
1,030 | 1,315 | ||||||
| Non-recourse debt—current |
3,920 | — | ||||||
|
|
|
|
|
|||||
| Total current liabilities |
33,222 | 24,283 | ||||||
| DEBT |
11,032 | 19,752 | ||||||
| CAPITAL LEASE OBLIGATIONS—Net |
79 | 44 | ||||||
| DEFERRED RENT AND LEASE INCENTIVES—Net |
7,488 | 5,938 | ||||||
| NON-RECOURSE DEBT—Net |
10,615 | — | ||||||
| DEFERRED INCOME TAXES |
81,252 | 59,614 | ||||||
|
|
|
|
|
|||||
| Total liabilities |
143,688 | 109,631 | ||||||
|
|
|
|
|
|||||
| COMMITMENTS AND CONTINGENCIES (Note 9) |
||||||||
| TEMPORARY EQUITY: |
||||||||
| Series A redeemable convertible preferred stock, $0.01 par value—1,137,235 shares authorized and issued; 847,776 shares outstanding (aggregate liquidation preference, $127) |
171 | 171 | ||||||
| Series B convertible preferred stock, $0.01 par value—821,690 shares authorized and issued; 609,774 shares outstanding (aggregate liquidation preference, $372) |
501 | 501 | ||||||
| Series C convertible preferred stock, $0.01 par value—69,925 shares authorized and issued; 51,369 shares outstanding (aggregate liquidation preference, $63) |
85 | 85 | ||||||
| Series D convertible preferred stock, $0.01 par value—4,000,000 shares authorized, issued, and outstanding (aggregate liquidation preference, $127,244) |
40 | 40 | ||||||
|
|
|
|
|
|||||
| Total temporary equity |
797 | 797 | ||||||
|
|
|
|
|
|||||
| SHAREHOLDERS’ EQUITY: |
||||||||
| Common stock, $0.01 par value—184,000,000 shares authorized; 115,268,248 and 109,626,000 shares issued as of June 30, 2019 and 2018, respectively; 87,097,912 and 81,478,064 outstanding as of June 30, 2019 and 2018, respectively |
1,153 | 1,096 | ||||||
| Additional paid-in capital |
138,131 | 133,802 | ||||||
| Treasury stock—4,041,223 and 4,038,423 shares at cost as of June 30, 2019 and 2018, respectively |
(77,275 | ) | (77,241 | ) | ||||
| Retained earnings |
200,446 | 129,472 | ||||||
|
|
|
|
|
|||||
| Total shareholders’ equity |
262,455 | 187,129 | ||||||
|
|
|
|
|
|||||
| TOTAL LIABILITIES, TEMPORARY EQUITY, AND SHAREHOLDERS’ EQUITY |
$ | 406,940 | $ | 297,557 | ||||
|
|
|
|
|
|||||
| (1) | As adjusted for the adoption of ASC 606 using the full retrospective method |
See accompanying notes to consolidated financial statements.
F-23
Table of Contents
SELECTQUOTE, INC. AND SUBSIDIARIES
CONSOLIDATED STATEMENTS OF OPERATIONS
FOR THE YEARS ENDED JUNE 30, 2019 AND 2018
(In thousands, except per share amounts)
| 2019 | 2018(1) | |||||||
| REVENUE: |
||||||||
| Commission |
$ | 296,000 | $ | 206,611 | ||||
| Production bonus and other |
41,469 | 27,077 | ||||||
|
|
|
|
|
|||||
| Total revenue |
337,469 | 233,688 | ||||||
|
|
|
|
|
|||||
| OPERATING COSTS AND EXPENSES: |
||||||||
| Cost of revenue |
104,421 | 83,340 | ||||||
| Marketing and advertising |
110,265 | 82,122 | ||||||
| Technical development |
8,326 | 9,913 | ||||||
| General and administrative |
15,864 | 12,349 | ||||||
| Restructuring |
2,305 | 2,808 | ||||||
|
|
|
|
|
|||||
| Total operating costs and expenses |
241,181 | 190,532 | ||||||
|
|
|
|
|
|||||
| INCOME FROM OPERATIONS |
96,288 | 43,156 | ||||||
| INTEREST EXPENSE |
(1,660 | ) | (929 | ) | ||||
| OTHER EXPENSES |
(15 | ) | (709 | ) | ||||
|
|
|
|
|
|||||
| INCOME BEFORE INCOME TAX EXPENSE |
94,613 | 41,518 | ||||||
| INCOME TAX EXPENSE |
22,034 | 6,619 | ||||||
|
|
|
|
|
|||||
| NET INCOME |
$ | 72,579 | $ | 34,899 | ||||
|
|
|
|
|
|||||
| NET INCOME PER SHARE: |
||||||||
| Basic |
$ | 0.70 | $ | 0.27 | ||||
| Diluted |
$ | 0.55 | $ | 0.23 | ||||
| WEIGHTED-AVERAGE COMMON STOCK OUTSTANDING USED IN PER SHARE AMOUNTS: |
||||||||
| Basic |
85,378 | 81,314 | ||||||
| Diluted |
132,491 | 96,421 | ||||||
| PRO FORMA NET INCOME PER SHARE (UNAUDITED): |
||||||||
| Basic |
$ | 0.56 | ||||||
| Diluted |
$ | 0.55 | ||||||
| PRO FORMA WEIGHTED-AVERAGE COMMON STOCK OUTSTANDING USED IN PER SHARE AMOUNTS (UNAUDITED): |
||||||||
| Basic |
129,449 | |||||||
| Diluted |
132,491 | |||||||
| (1) | As adjusted for the adoption of ASC 606 using the full retrospective method. |
See accompanying notes to consolidated financial statements.
F-24
Table of Contents
SELECTQUOTE, INC. AND SUBSIDIARIES
CONSOLIDATED STATEMENTS OF CHANGES IN SHAREHOLDERS’ EQUITY
FOR THE YEARS ENDED JUNE 30, 2019 AND 2018
(In thousands)
| Common Stock | Additional Capital |
Retained Earnings(1) |
Treasury Stock |
Total Equity |
||||||||||||||||||||
| Shares | Amount | |||||||||||||||||||||||
| BALANCES—June 30, 2017 |
109,130 | $ | 1,088 | $ | 133,178 | $ | 96,455 | $ | (76,800 | ) | $ | 153,921 | ||||||||||||
| Stock options exercised |
496 | 8 | 557 | — | — | 565 | ||||||||||||||||||
| Compensation expense for options granted |
— | — | 67 | — | — | 67 | ||||||||||||||||||
| Dividends declared |
— | — | — | (1,882 | ) | — | (1,882 | ) | ||||||||||||||||
| Common stock repurchased |
— | — | — | — | (441 | ) | (441 | ) | ||||||||||||||||
| Net income |
— | — | — | 34,899 | — | 34,899 | ||||||||||||||||||
|
|
|
|
|
|
|
|
|
|
|
|
|
|||||||||||||
| BALANCES—June 30, 2018 |
109,626 | 1,096 | 133,802 | 129,472 | (77,241 | ) | 187,129 | |||||||||||||||||
| Cumulative effect of adoption of ASU 2016-09 |
— | — | — | 353 | — | 353 | ||||||||||||||||||
| Stock options exercised |
5,642 | 57 | 4,243 | — | — | 4,300 | ||||||||||||||||||
| Compensation expense for options granted |
— | — | 86 | — | — | 86 | ||||||||||||||||||
| Dividends declared |
— | — | — | (1,958 | ) | — | (1,958 | ) | ||||||||||||||||
| Common stock repurchased |
— | — | — | — | (34 | ) | (34 | ) | ||||||||||||||||
| Net income |
— | — | — | 72,579 | — | 72,579 | ||||||||||||||||||
|
|
|
|
|
|
|
|
|
|
|
|
|
|||||||||||||
| BALANCES—June 30, 2019 |
115,268 | $ | 1,153 | $ | 138,131 | $ | 200,446 | $ | (77,275 | ) | $ | 262,455 | ||||||||||||
|
|
|
|
|
|
|
|
|
|
|
|
|
|||||||||||||
| (1) | As adjusted for the adoption of ASC 606 using the full retrospective method. |
Reflects the retrospective application of the eight-for-one stock split effective February 28, 2020, whereby each share of common stock issued and outstanding immediately prior to the effective date was split and converted into eight shares of common stock. The par value per share remained unchanged. The Company’s capital accounts have been retroactively restated to reflect the stock split.
See accompanying notes to consolidated financial statements.
F-25
Table of Contents
SELECTQUOTE, INC. AND SUBSIDIARIES
CONSOLIDATED STATEMENTS OF CASH FLOWS
FOR THE YEARS ENDED JUNE 30, 2019 AND 2018
(In thousands)
| 2019 | 2018(1) | |||||||
| CASH FLOWS FROM OPERATING ACTIVITIES: |
||||||||
| Net income |
$ | 72,579 | $ | 34,899 | ||||
| Adjustments to reconcile net income to net cash provided by operating activities: |
||||||||
| Depreciation and amortization |
4,702 | 3,468 | ||||||
| Loss on disposal of property, equipment and software |
221 | 700 | ||||||
| Stock compensation expense |
86 | 67 | ||||||
| Deferred income taxes |
21,991 | 6,584 | ||||||
| Amortization of debt issuance costs |
123 | 70 | ||||||
| Changes in operating assets and liabilities: |
||||||||
| Accounts receivable |
(8,676 | ) | (6,300 | ) | ||||
| Commissions receivable |
(91,639 | ) | (46,370 | ) | ||||
| Other assets |
(3,031 | ) | 389 | |||||
| Accounts payable and accrued expenses |
2,810 | 3,117 | ||||||
| Commission advances |
(1,277 | ) | 774 | |||||
| Accrued compensation and benefits |
3,521 | (291 | ) | |||||
| Deferred rent and lease incentives |
(1,297 | ) | (1,953 | ) | ||||
|
|
|
|
|
|||||
| Net cash provided by (used in) operating activities |
113 | (4,846 | ) | |||||
|
|
|
|
|
|||||
| CASH FLOWS FROM INVESTING ACTIVITIES: |
||||||||
| Purchases of property and equipment |
(3,921 | ) | (5,396 | ) | ||||
| Purchases of software and capitalized software development costs |
(4,715 | ) | (624 | ) | ||||
|
|
|
|
|
|||||
| Net cash used in investing activities |
(8,636 | ) | (6,020 | ) | ||||
|
|
|
|
|
|||||
| CASH FLOWS FROM FINANCING ACTIVITIES: |
||||||||
| Proceeds from revolving line of credit |
135,621 | 91,319 | ||||||
| Payments on revolving line of credit |
(144,341 | ) | (75,952 | ) | ||||
| Proceeds from non-recourse debt |
16,200 | — | ||||||
| Payments on non-recourse debt |
(1,364 | ) | — | |||||
| Payments on subordinated debt |
— | (2,000 | ) | |||||
| Payments on capital lease obligations |
(31 | ) | (24 | ) | ||||
| Proceeds from common stock options exercised |
4,300 | 565 | ||||||
| Purchase of treasury stock |
(34 | ) | (441 | ) | ||||
| Cash dividends paid |
(1,958 | ) | (1,882 | ) | ||||
| Debt issuance costs |
(258 | ) | (103 | ) | ||||
|
|
|
|
|
|||||
| Net cash provided by financing activities |
8,135 | 11,482 | ||||||
|
|
|
|
|
|||||
| NET (DECREASE) INCREASE IN CASH |
(388 | ) | 616 | |||||
| CASH—Beginning of year |
958 | 342 | ||||||
|
|
|
|
|
|||||
| CASH—End of year |
$ | 570 | $ | 958 | ||||
|
|
|
|
|
|||||
| SUPPLEMENTAL CASH FLOW INFORMATION: |
||||||||
| Interest paid |
$ | 1,467 | $ | 786 | ||||
| Income taxes paid, net of refunds |
40 | 35 | ||||||
| SUPPLEMENTAL DISCLOSURES OF NONCASH INVESTING ACTIVITIES: |
||||||||
| Landlord funded allowance for tenant improvements |
$ | 2,562 | $ | 5,393 | ||||
| Capital expenditures in accounts payable and accrued expenses |
250 | 373 | ||||||
| SUPPLEMENTAL DISCLOSURES OF NONCASH FINANCING ACTIVITIES: |
||||||||
| Payoff of the Revolver |
$ | — | $ | (17,175 | ) | |||
| Opening outstanding borrowings under the Credit Agreement |
— | 17,361 | ||||||
| Debt issuance costs incurred for the Credit Agreement |
— | 186 | ||||||
| Property acquired under capital lease |
66 | 101 | ||||||
| (1) | As adjusted for the adoption of ASC 606 using the full retrospective method. |
See accompanying notes to consolidated financial statements.
F-26
Table of Contents
SELECTQUOTE, INC. AND SUBSIDIARIES
NOTES TO CONSOLIDATED FINANCIAL STATEMENTS
AS OF AND FOR THE YEARS ENDED JUNE 30, 2019 AND 2018
| 1. | SUMMARY OF BUSINESS AND SIGNIFICANT ACCOUNTING POLICIES |
Description of Business—SelectQuote, Inc. and its subsidiaries (the “Company” or “SelectQuote”) contract with numerous insurance carriers to sell senior health (“Senior”), life (“Life”), and auto and home insurance (“Auto & Home”) policies by telephone to individuals throughout the United States through the use of multi-channel marketing and advertising campaigns. Senior sells Medicare Advantage, Medicare Supplement, Medicare Part D, and other ancillary senior health insurance related policies. Life sells primarily term life insurance policies. Auto & Home primarily sells non-commercial auto & home property and casualty insurance policies. SelectQuote’s licensed insurance agents provide comparative rates from a variety of insurance carriers relying on a combination of proprietary and commercially available software to perform its quote service and sell insurance policies on behalf of the insurance carriers. The Company earns revenue in the form of commission payments from the insurance carriers. Commission payments are received both when the initial policy is sold (“first year”) and also when the underlying policyholder renews their policy in subsequent years (“renewal”), as well as production bonuses based on metrics for first year policies sold.
Basis of Presentation—The accompanying consolidated financial statements include the accounts of SelectQuote, Inc., and its wholly owned subsidiaries: SelectQuote Insurance Services, SelectQuote Auto & Home Insurance Services, LLC (“SQAH”), ChoiceMark Insurance Services, Inc., and Tiburon Insurance Services. All intercompany accounts and transactions have been eliminated in consolidation. The consolidated financial statements have been prepared in accordance with U.S. generally accepted accounting principles.
Stock Split—On February 28, 2020, the Company effected an eight-for-one forward stock split of its issued and outstanding shares of common stock and a proportional adjustment to the existing conversion ratios for each series of its preferred stock. The par value of the Company’s common stock was not adjusted as a result of the stock split. All references to common stock, options to purchase common stock, share data, per share data and related information contained in the condensed consolidated financial statements and related footnotes have been retrospectively adjusted, where applicable, to reflect the effect of the stock split and the adjustment of the preferred stock conversion ratios. Accordingly, an adjustment was made between common stock and additional paid-in-capital in the consolidated balance sheet to reflect the new values after the stock split. In connection with the stock split, the number of authorized shares of the Company’s common stock was increased to 700,000,000. Our shares of treasury stock were not affected by the stock split and were subsequently retired on March 30, 2020.
Use of Estimates—The preparation of consolidated financial statements in conformity with accounting principles generally accepted in the United States of America requires management to make estimates and assumptions that affect the reported amounts of revenues, expenses, assets, and liabilities and disclosure of contingent assets and liabilities as of and for the years ended June 30, 2019 and 2018. SelectQuote regularly assesses these estimates; however, actual amounts could differ from those estimates. The most significant items involving management’s estimates include estimates of revenue recognition, commissions receivable, and the provision for income taxes. The impact of changes in estimates is recorded in the period in which they become known.
Pro Forma Financial Information (Unaudited)—Pro forma basic and diluted net income per share has been computed to reflect the automatic conversion of all outstanding shares of the Company’s preferred stock, Series A-D, into an aggregate of 44,071,352 shares of common stock. The pro forma net income per share does not include the shares expected to be sold and related proceeds to be received from this offering. The pro forma net income per share for the year ended June 30, 2019, was computed using the weighted-average number of shares of common stock outstanding, including the pro forma effect of the conversion of all outstanding shares of preferred stock as if such conversion had occurred on July 1, 2018, or when the securities were issued, whichever is later.
F-27
Table of Contents
Concentrations of Credit Risk—Financial instruments that potentially subject the Company to concentrations of credit risk consist primarily of accounts and commissions receivable. The Company believes the potential for collection issues with any of its customers is minimal as of June 30, 2019, based on the lack of collection issues in the past and the high financial standards the Company requires of its customers. As of June 30, 2019, two insurance carrier customers accounted for 20% and 17% of total commissions receivable. As of June 30, 2018, two insurance carrier customers accounted for 16% and 14% of total commissions receivable.
For the year ended June 30, 2019, three insurance carrier customers accounted for 23%, 14%, and 12% of total revenue. For the year ended June 30, 2018, three insurance carrier customers accounted for 14%, 13%, and 13% of total revenue.
Seasonality—Medicare-eligible individuals are permitted to change their Medicare Advantage and Medicare Part D prescription drug coverage for the following year during the Medicare annual enrollment period (“AEP”) in October through December and are allowed to switch plans from an existing plan during the open enrollment period (“OEP”) in January through March each year. As a result, the Company’s Senior segment’s commission revenue is highest in the second quarter and to a lesser extent, the third quarter during OEP.
Accounts Receivable—Accounts receivable represents either first year or renewal commissions expected to be received on policies that have already been sold or renewed and for production bonus revenue that has been earned but not received from the insurance carrier. Typically, the Company receives commission payments as the insurance carriers receive payments from the underlying policyholders. As these can be on various payment terms such as monthly or quarterly, a receivable is recorded to account for the commission payments yet to be received from the insurance carriers, but that the Company has an unconditional right to receive as the Company’s performance obligation has been satisfied.
Commissions Receivable—Commissions receivable are contract assets that represent estimated variable consideration for performance obligations that have been satisfied but payment is not due as the underlying policy has not renewed yet. The current portion of commissions receivable are future renewal commissions expected to be received within one year, while the non-current portion of commissions receivable are expected to be received beyond one year. Contract assets are reclassified as accounts receivable when the rights to the renewal commissions become unconditional, which is primarily upon renewal of the underlying policy, typically on an annual basis.
The Company does not receive consideration prior to the satisfaction of performance obligations, and as a result, does not have contract liabilities with its customers. Refer to the Revenue Recognition section below and Note 7 of the consolidated financial statements for further information.
The Company assesses impairment for uncollectible consideration amounts when information available indicates it is probable that an asset has been impaired. There were no impairments recorded during the years ended June 30, 2019 or 2018, respectively.
Other Current Assets—Other current assets consist of prepaid rent, prepaid advertising, other prepaid services, and miscellaneous accounts receivable that will be expensed or received during the year ending June 30, 2020.
Property and Equipment—Net—Property and equipment are stated at cost less accumulated depreciation. Depreciation is computed using the straight-line method based on the date the asset is placed in service using the following estimated useful lives:
| Computer hardware |
3 years | |||
| Equipment |
3–4 years | |||
| Leasehold improvements |
Shorter of lease period or useful life | |||
| Furniture and fixtures |
7 years |
Maintenance and minor replacements are expensed as incurred.
F-28
Table of Contents
Software—Net—In accordance with Financial Accounting Standards Board (“FASB”) Accounting Standards Codification (“ASC”) 350, Intangibles—Goodwill and Other (“ASC 350”), the Company capitalizes certain costs incurred in connection with acquiring or developing internal-use software. Amortization is computed using the straight-line method over the three-year estimated useful life of the software. Subsequent modifications or upgrades to internal-use software are capitalized only to the extent that additional functionality is provided.
Goodwill—Goodwill represents the excess of the purchase price over the estimated fair values of identifiable assets and liabilities acquired in a business combination as of the acquisition date. ASC 350 requires that the Company test goodwill for impairment on an annual basis and whenever events or circumstances indicate that the asset may be impaired. The Company considers significant unfavorable industry or economic trends as factors in deciding when to perform an impairment test. Goodwill is allocated among, and evaluated for impairment, at the reporting unit level, which is defined as an operating segment or one level below an operating segment. The Company has historically performed the annual goodwill impairment test as of June 30. During the year ended June 30, 2019, and going forward, the Company changed the annual impairment testing date to April 1. The change in impairment testing date is not viewed to have a material effect on the financial statements. There were no goodwill impairment charges recorded during the years ended June 30, 2019 or 2018.
Impairment and Disposal of Long-Lived Assets—The Company reviews its long-lived assets, other than goodwill, for impairment whenever events or changes in circumstances indicate that the carrying amount of such assets may not be recoverable. Recoverability of an asset to be held and used is measured by a comparison of the carrying amount of an asset to future undiscounted net cash flows expected to be generated by the asset. If such asset is considered to be impaired, a loss is recognized for the amount by which the carrying amount of the asset exceeds the fair value of the asset. Assets to be disposed of are reported at the lower of the carrying amount or fair value, less costs to sell.
Financial Instruments—The Company’s financial instruments including cash, accounts and commissions receivable, and accounts payable and accrued expenses are carried at cost, which approximate their fair value because of their short-term maturities. Based on the borrowing rate currently available to the Company for debt with similar terms, the carrying value of the Company’s debt approximates fair value.
Commission Advances—Commission advances represent a refund liability primarily for upfront future renewal commission payments received from certain insurance carriers at the time an insurance policy is first sold. The Company is required to return commission advances to customers in the event the underlying policyholder does not renew the policy. When the Company has an unconditional right to the consideration, the Company recognizes a reduction to the corresponding contract asset and refund liability.
Revenue Recognition—The Company recognizes revenue when a customer obtains control of promised goods or services and recognizes an amount that reflects the consideration that an entity expects to receive in exchange for those goods or services. The Company applies the following five-step model in order to determine this amount: (i) identification of the contract with a customer; (ii) identification of the performance obligations in the contract, including whether they are distinct in the context of the contract; (iii) measurement of the transaction price, including the constraint on variable consideration; (iv) allocation of the transaction price to the performance obligations; and (v) recognition of revenue when (or as) the Company satisfies each performance obligation.
Contracts with Customers—The Company’s customers are the insurance carriers that it contracts with to sell insurance policies on their behalf. The Company only applies the five-step model to contracts when it is probable that it will collect the consideration it is entitled to in exchange for the goods or services it transfers to the customer. The Company earns commissions for first year and renewal policies from the insurance carriers, as presented in the consolidated statements of operations as commission revenue. Additionally, the Company earns production bonuses on first year policies from the insurance carriers based on attaining predetermined target sales levels or other agreed upon objectives and marketing development funds received from certain insurance carriers based on
F-29
Table of Contents
historical experience to drive incremental policy sales, as presented in the consolidated statements of operations as production bonus and other revenue. The contracts with the insurance carriers are non-exclusive and can typically be terminated unilaterally by either party. We review individual contracts to determine the Company’s legal and enforceable rights to renewal commissions upon contract termination when determining variable consideration. Additionally, the insurance carriers often have the ability to amend provisions in the contracts relating to the prospective commission rates paid to the Company for new policies sold. The Company’s contracts with customers contain a single performance obligation satisfied at a point in time to which it allocates the total transaction price.
Significant Judgments—The accounting estimates and judgments related to the recognition of revenue require the Company to make assumptions about numerous factors such as the determination of performance obligations and determination of the transaction price. In determining the amounts of revenue to recognize, the Company uses the following methods, inputs, and assumptions:
| • | Determination of Performance Obligations—The Company reviews each contract with customers to determine what promises the Company must deliver and which of these promises are capable of being distinct and are distinct in the context of the contract. The delivery of new policyholders to the insurance carriers is the only material promise specified within the contracts. After a policy is sold, the Company has no material additional or recurring obligations to the policyholder or the insurance carrier. The Company’s contracts do not include downstream policyholder activities such as claims support or payment collection services. While the primary promise is the sale of policies, some contracts include the promise to provide administrative services to policyholders on behalf of the insurance carrier such as responding to policyholder inquiries regarding coverage or providing proof of insurance. The Company has concluded that while these administrative services may be distinct, they are immaterial in the context of the contract. |
| • | Determination of the Transaction Price—The transaction price is identified as the first year commission due upon the initial sale of a policy as well as an estimate of renewal commissions or production bonuses when applicable. The estimates of renewal commissions and production bonuses are considered variable consideration and require significant judgment including determining the number of periods in which a renewal will occur and the value of those renewal commissions to be received if renewed. |
For renewal commissions, the Company utilizes the expected value approach. This approach incorporates a combination of historical lapse and premium increase data along with available industry and insurance carrier experience data to estimate forecasted renewal consideration and constrain revenue recognized to the extent that it is probable that a significant reversal in the amount of cumulative revenue recognized will not occur. The uncertainty associated with the variable consideration is subsequently resolved when the policy renews.
The Company utilizes a practical expedient to estimate commission revenue by applying the use of a portfolio approach to policies grouped together by the segment, insurance carrier, product type, and quarter the policy was initially sold (referred to as a “cohort”). This provides a practical approach to estimating the renewal commissions expected to be collected for each cohort by evaluating various factors, including but not limited to, contracted commission rates, insurance carrier mix, premium increases, and persistency rates.
For production bonuses, the Company utilizes the expected value approach that incorporates a combination of historical payment data by segment and insurance carrier as well as current forecast data that is used to estimate the amount of production bonus expected to be received from the insurance carriers.
F-30
Table of Contents
Timing of Recognition—The Company recognizes revenue when it has completed its performance obligation, which is at different milestones for each segment based on the contractual enforceable rights, the Company’s historical experience, and established customer business practices:
| • | For Senior, revenue is recognized at the earliest of when the insurance carrier has approved the policy sold, when a commission payment is received from the insurance carrier, or when the policy sold becomes effective. |
| • | For Life, revenue is recognized when the insurance carrier has approved the policy sold and payment information has been obtained from the policyholder. |
| • | For Auto & Home, revenue is recognized when the policy sold becomes effective. |
Cost of Revenue—Cost of revenue represents the direct costs associated with fulfilling the Company’s obligations to the insurance carriers for the sale of insurance policies. Such costs primarily consist of compensation and related benefit costs for sales agents, fulfillment specialists, and others directly engaged in serving policy holders. The Company does not have any incremental costs of obtaining its contracts with its customers, the insurance carriers.
Marketing and Advertising Expenses—Direct costs related to marketing and advertising the Company’s services are expensed in the period incurred. Advertising expense was $99.9 million and $74.6 million for the years ended June 30, 2019 and 2018, respectively.
Restructuring Expenses—The Company accounts for employee-related costs, including severance and other termination benefits, included in restructuring expense based on long-standing benefit practices and local statutory requirements, and contract termination costs. Restructuring liabilities are recognized at fair value in the period the liability is incurred. In some jurisdictions, the Company has ongoing benefit arrangements under which the Company records the estimated severance and other termination benefits when such costs are deemed probable and estimable, approved by the appropriate corporate management, and if actions required to complete the termination plan indicate that it is unlikely that significant changes to the plan will be made or the plan will be withdrawn. In jurisdictions where there is not an ongoing benefit arrangement, the Company records estimated severance and other termination benefits when appropriate corporate management has committed to the plan and the benefit arrangement is communicated to the affected employees. A liability for costs to terminate a contract before the end of its term is recognized at fair value when the Company terminates the contract in accordance with its terms. Estimates are evaluated periodically to determine whether an adjustment is required.
Income Taxes—The Company accounts for income taxes using an asset and liability method. Deferred income tax assets and liabilities result from temporary differences between the tax basis of assets and liabilities and their reported amounts in the consolidated financial statements that will result in taxable or deductible amounts in future years. Valuation allowances are provided when necessary to reduce deferred tax assets to the amount expected to be realized.
The Company applies ASC 740, Income Taxes (“ASC 740”), in accounting for uncertainty in income taxes recognized in the Company’s consolidated financial statements. ASC 740 requires a more-likely-than-not threshold for financial statement recognition and measurement of tax positions taken or expected to be taken in a tax return. The Company records a liability for the difference between the benefit recognized and measured pursuant to ASC 740 and the tax position taken or expected to be taken on the Company’s tax return. To the extent that the assessment of such tax positions changes, the change in estimate is recorded in the period in which the determination is made.
Share-Based Compensation—The Company applies the fair value method under ASC 718, Compensation—Stock Compensation (“ASC 718”), in accounting for share-based compensation to employees. Under ASC 718, compensation cost is measured at the grant date based on the fair value of the equity instruments awarded and is recognized over the period during which an employee is required to provide service in exchange for the award, or the requisite service period, which is usually the vesting period. The fair value of the equity award granted is estimated on the date of the grant.
F-31
Table of Contents
Operating Leases—The Company recognizes rent expense on a straight-line basis over the lease term in accordance with authoritative accounting guidance. Any lease incentives or scheduled rent adjustments are recognized as reductions of rental expense on a straight-line basis over the term of the lease. As of June 30, 2019 and 2018, deferred rent was $8.1 million and $7.2 million, respectively. The lease term begins on the date the Company becomes legally obligated for the rent payments or when the Company takes possession of the office space, whichever is earlier.
Comprehensive Income—There are no differences between comprehensive income and net income as reported in the Company’s consolidated statements of operations.
Recent Accounting Pronouncements Adopted—Effective July 1, 2018, the Company adopted the requirements of Accounting Standards Update (“ASU”) No. 2014-09, Revenue from Contracts with Customers (Topic 606) (“ASC 606” or the “new revenue standard”). The core principle of ASC 606 is that an entity shall recognize revenue to depict the transfer of promised goods or services to customers in an amount that reflects the consideration to which the entity expects to be entitled in exchange for those goods or services. The standard also contains significant new disclosure requirements regarding the nature, amount, timing and uncertainty of revenue and cash flows arising from contracts with customers. The Company early adopted the new revenue standard, as permitted, applying it to all contracts using the full retrospective method, which requires adjusting prior periods as if ASC 606 had been in effect as of the beginning of the earliest period presented. The Company recorded a cumulative adjustment of $136.5 million as an increase to retained earnings in the June 30, 2017, opening balance sheet. Thus, the accompanying consolidated balance sheet as of June 30, 2018, as well as the accompanying consolidated statements of operations, changes in shareholders’ equity, and cash flows for the year ended June 30, 2018, have been adjusted to reflect the adoption of ASC 606, as have all related disclosures.
The adoption had a material impact on the Company’s consolidated financial statements, primarily on the timing of recognition of renewal commissions. Previously, the Company recognized commission revenue when the initial policy was sold and revenue related to renewal commissions was recognized when the underlying policyholder renewal contingency was resolved. Under ASC 606, the Company estimates the total transaction price at contract inception and recognizes revenue upon transfer of control which corresponds with the timing of the sale of the initial policy. See further discussion of the Company’s revenue recognition policy above as well as in Note 7 to the consolidated financial statements and discussion of the tax effects of the adoption of ASC 606 in Note 8 to the consolidated financial statements.
F-32
Table of Contents
The following tables present the impact of the adoption of ASC 606 on the Company’s previously reported historical results for the period presented:
CONSOLIDATED BALANCE SHEET
AS OF JUNE 30, 2018
(In thousands)
| As Reported |
ASC 606 Adoption Adjustment |
As Adjusted |
||||||||||
| Assets |
||||||||||||
| Current assets: |
||||||||||||
| Cash |
$ | 958 | $ | — | $ | 958 | ||||||
| Accounts receivable |
49,282 | 1,871 | 51,153 | |||||||||
| Commissions receivable—current |
— | 27,863 | 27,863 | |||||||||
| Other current assets |
3,593 | — | 3,593 | |||||||||
|
|
|
|
|
|
|
|||||||
| Total current assets |
53,833 | 29,734 | 83,567 | |||||||||
| Commissions receivable—net |
— | 196,095 | 196,095 | |||||||||
| Property and equipment—net |
11,082 | — | 11,082 | |||||||||
| Software—net |
929 | — | 929 | |||||||||
| Goodwill |
5,364 | — | 5,364 | |||||||||
| Other assets |
520 | — | 520 | |||||||||
|
|
|
|
|
|
|
|||||||
| Total assets |
$ | 71,728 | $ | 225,829 | $ | 297,557 | ||||||
|
|
|
|
|
|
|
|||||||
| Liabilities, Temporary Equity, and Shareholders’ Equity |
||||||||||||
| Current liabilities: |
||||||||||||
| Accounts payable and accrued expenses |
$ | 10,588 | $ | — | $ | 10,588 | ||||||
| Accrued compensation and benefits |
9,045 | — | 9,045 | |||||||||
| Commission advances |
4,670 | (1,368 | ) | 3,302 | ||||||||
| Capital lease obligations—current |
33 | — | 33 | |||||||||
| Deferred rent and lease incentives—current |
1,315 | — | 1,315 | |||||||||
|
|
|
|
|
|
|
|||||||
| Total current liabilities |
25,651 | (1,368 | ) | 24,283 | ||||||||
| Debt |
19,752 | — | 19,752 | |||||||||
| Capital lease obligations—net |
44 | — | 44 | |||||||||
| Deferred rent and lease incentives—net |
5,938 | — | 5,938 | |||||||||
| Deferred income taxes |
4,008 | 55,606 | 59,614 | |||||||||
|
|
|
|
|
|
|
|||||||
| Total liabilities |
55,393 | 54,238 | 109,631 | |||||||||
| Commitments and contingencies (Note 9) |
||||||||||||
| Total temporary equity |
797 | — | 797 | |||||||||
| Total shareholders’ equity |
15,538 | 171,591 | 187,129 | |||||||||
|
|
|
|
|
|
|
|||||||
| Total liabilities, temporary equity, and shareholders’ equity |
$ | 71,728 | $ | 225,829 | $ | 297,557 | ||||||
|
|
|
|
|
|
|
|||||||
F-33
Table of Contents
CONSOLIDATED STATEMENT OF OPERATIONS
FOR THE YEAR ENDED JUNE 30, 2018
(In thousands)
| As Reported |
ASC 606 Adoption Adjustment |
As Adjusted |
||||||||||
| Revenue: |
||||||||||||
| Commission |
$ | 159,511 | $ | 47,100 | $ | 206,611 | ||||||
| Production bonus and other |
27,077 | — | 27,077 | |||||||||
|
|
|
|
|
|
|
|||||||
| Total revenue |
186,588 | 47,100 | 233,688 | |||||||||
|
|
|
|
|
|
|
|||||||
| Operating costs and expenses: |
||||||||||||
| Cost of revenue |
83,340 | — | 83,340 | |||||||||
| Marketing and advertising |
82,122 | — | 82,122 | |||||||||
| Technical development |
9,913 | — | 9,913 | |||||||||
| General and administrative |
12,349 | — | 12,349 | |||||||||
| Restructuring |
2,808 | — | 2,808 | |||||||||
|
|
|
|
|
|
|
|||||||
| Total operating costs and expenses |
190,532 | — | 190,532 | |||||||||
|
|
|
|
|
|
|
|||||||
| (Loss) income from operations |
(3,944 | ) | 47,100 | 43,156 | ||||||||
| Interest expense |
(929 | ) | — | (929 | ) | |||||||
| Other expenses |
(709 | ) | — | (709 | ) | |||||||
|
|
|
|
|
|
|
|||||||
| (Loss) income before income tax (benefit) expense |
(5,582 | ) | 47,100 | 41,518 | ||||||||
| Income tax (benefit) expense |
(5,378 | ) | 11,997 | 6,619 | ||||||||
|
|
|
|
|
|
|
|||||||
| Net (loss) income |
$ | (204 | ) | $ | 35,103 | $ | 34,899 | |||||
|
|
|
|
|
|
|
|||||||
F-34
Table of Contents
CONSOLIDATED STATEMENT OF CASH FLOWS
FOR THE YEAR ENDED JUNE 30, 2018
(In thousands)
| As Reported |
ASC 606 Adoption Adjustment |
As Adjusted |
||||||||||
| Cash flows from operating activities: |
||||||||||||
| Net (loss) income |
$ | (204 | ) | $ | 35,103 | $ | 34,899 | |||||
| Adjustments to reconcile net (loss) income to net cash provided by operating activities: |
||||||||||||
| Depreciation and amortization |
3,468 | — | 3,468 | |||||||||
| Loss on disposal of property, equipment and software |
700 | — | 700 | |||||||||
| Stock compensation expense |
67 | — | 67 | |||||||||
| Deferred income taxes |
(5,413 | ) | 11,997 | 6,584 | ||||||||
| Amortization of debt issuance costs |
70 | — | 70 | |||||||||
| Changes in operating assets and liabilities: |
||||||||||||
| Accounts receivable |
(5,570 | ) | (730 | ) | (6,300 | ) | ||||||
| Commissions receivable |
— | (46,370 | ) | (46,370 | ) | |||||||
| Other assets |
389 | — | 389 | |||||||||
| Accounts payable and accrued expenses |
3,117 | — | 3,117 | |||||||||
| Commission advances |
774 | — | 774 | |||||||||
| Accrued compensation and benefits |
(291 | ) | — | (291 | ) | |||||||
| Deferred rent and lease incentives |
(1,953 | ) | — | (1,953 | ) | |||||||
|
|
|
|
|
|
|
|||||||
| Net cash used in operating activities |
$ | (4,846 | ) | $ | — | $ | (4,846 | ) | ||||
|
|
|
|
|
|
|
|||||||
F-35
Table of Contents
In March 2016, the FASB issued ASU No. 2016-09, Improvements on Employee Share-Based Payment Accounting (Topic 718). The ASU simplifies several aspects of the accounting for employee share-based payment transactions for both public and nonpublic entities, including the accounting for income taxes, forfeitures, and statutory tax withholding requirements, as well as classification in the statement of cash flows. The Company adopted this standard effective beginning July 1, 2018, as the new standard was effective for nonpublic entities in annual periods beginning after December 15, 2017. The cumulative effect of the adoption of ASU 2016-09 of $0.4 million was made during the year ended June 30, 2019, to recognize the excess income tax benefits from prior year share-based compensation arrangements in deferred income taxes and retained earnings in the consolidated balance sheet.
In May 2017, the FASB issued ASU No. 2017-09, Compensation—Stock Compensation (Topic 718): Scope of Modification Accounting, which clarifies when changes to the terms or conditions of a share-based payment award require an entity to apply modification accounting. Under the new guidance, modification accounting is only required if the fair value, vesting conditions or classification (equity or liability) of the new award are different from the original award immediately before the original award is modified. The new standard was effective for nonpublic entities in annual periods beginning after December 15, 2017. The guidance must be applied prospectively to awards modified on or after the adoption date. The Company adopted this standard effective beginning July 1, 2018, with no modifications to a share-based payment award taking place through June 30, 2019.
Recent Accounting Pronouncements Not Yet Adopted—In February 2016, the Financial Accounting Standards Board “FASB” issued Accounting Standards Update “ASU” No. 2016-02, Leases (Topic 842), and has subsequently modified several areas of the standard in order to provide additional clarity and improvements. The new standard will supersede much of the existing authoritative literature for leases. This guidance requires lessees, among other things, to recognize right-of-use assets and liabilities on their balance sheet for all leases with lease terms longer than 12 months. Entities are required to use modified retrospective application for leases that exist or are entered into after the beginning of the earliest comparative period in the financial statements with the option to elect certain transition reliefs. According to the superseding standard ASU No. 2019-10, Financial Instruments—Credit Losses (Topic 326), Derivatives and Hedging (Topic 815), and Leases (Topic 842), that deferred the effective date of Topic 842, this standard becomes effective for the Company on July 1, 2021. The Company is currently evaluating the impact to its consolidated financial statements and related disclosures.
In August 2018, the FASB issued ASU No. 2018-15, Intangibles—Goodwill and Other—Internal-Use Software (Subtopic 350-40): Customer’s Accounting for Implementation Costs Incurred in a Cloud Computing Arrangement That Is a Service Contract. ASU No. 2018-15 aligns the requirements for capitalizing implementation costs incurred in a hosting arrangement that is a service contract with the requirements for capitalizing implementation costs incurred to develop or obtain internal-use software (and hosting arrangements that include an internal-use software license). This standard becomes effective for the Company July 1, 2020. The Company is currently evaluating the impact to its consolidated financial statements.
F-36
Table of Contents
| 2. | PROPERTY AND EQUIPMENT—NET |
Property and equipment—net at June 30, 2019 and 2018, consisted of the following (in thousands):
| 2019 | 2018 | |||||||
| Computer hardware |
$ | 5,674 | $ | 4,375 | ||||
| Equipment |
1,769 | 3,638 | ||||||
| Leasehold improvements |
11,504 | 9,825 | ||||||
| Furniture and fixtures |
3,646 | 2,914 | ||||||
| Work in progress |
392 | 588 | ||||||
|
|
|
|
|
|||||
| Total |
22,985 | 21,340 | ||||||
| Less accumulated depreciation |
(9,226 | ) | (10,258 | ) | ||||
|
|
|
|
|
|||||
| Property and equipment—net |
$ | 13,759 | $ | 11,082 | ||||
|
|
|
|
|
|||||
Work in progress primarily represents costs incurred during the year ended June 30, 2019 for tenant improvements not yet put into service as of June 30, 2019 and not yet being depreciated. The Company expects to put these assets into service during the year June 30, 2020. Depreciation expense for the years ended June 30, 2019 and 2018, was $3.7 million and $3.4 million, respectively.
| 3. | SOFTWARE—NET |
Software—net at June 30, 2019 and 2018, consisted of the following (in thousands):
| 2019 | 2018 | |||||||
| Software |
$ | 7,067 | $ | 4,380 | ||||
| Work in progress |
1,876 | — | ||||||
|
|
|
|
|
|||||
| Total |
8,943 | 4,380 | ||||||
| Less accumulated amortization |
(4,048 | ) | (3,451 | ) | ||||
|
|
|
|
|
|||||
| Software—net |
$ | 4,895 | $ | 929 | ||||
|
|
|
|
|
|||||
Work in progress primarily represents costs incurred during the year ended June 30, 2019, for software not yet put into service as of June 30, 2019 and not yet being depreciated. The Company expects to put these assets into service during the year June 30, 2020. Amortization expense for the years ended June 30, 2019 and 2018, was $0.9 million and $0.6 million, respectively.
| 4. | RESTRUCTURING EXPENSES |
In each of the years ended June 30, 2019 and 2018, the Company implemented initiatives to reduce costs and consolidate leadership and back office functions. As a result of these initiatives, the Company recorded restructuring expenses during the years ended June 30, 2019 and 2018, of $2.3 million and $2.8 million, respectively, consisting primarily of employee severance, which are recorded in restructuring expense in the consolidated statements of operations.
The Company’s liability related to unpaid employee severance was $0.8 million and $0.5 million as of June 30, 2019 and 2018, respectively, which is recorded in accrued compensation and benefits in the consolidated balance sheets. The following table provides a summary of the activity in the liability account related to unpaid employee severance for the years ended June 30, 2019 and 2018 (in thousands):
| June 30, 2017 | Charges | Payments | June 30, 2018 | |||||||||||||
| Severance |
$ | — | $ | 2,772 | $ | (2,229 | ) | $ | 543 | |||||||
|
|
|
|
|
|
|
|
|
|||||||||
| June 30, 2018 | Charges | Payments | June 30, 2019 | |||||||||||||
| Severance |
$ | 543 | $ | 2,240 | $ | (2,013 | ) | $ | 770 | |||||||
|
|
|
|
|
|
|
|
|
|||||||||
F-37
Table of Contents
| 5. | EMPLOYEE BENEFIT PLAN |
The Company has a pretax savings plan covering nearly all of its employees that is intended to qualify under Section 401(k) of the Internal Revenue Code. The Company matches each employee’s contributions up to 2% per plan year. Additionally, the Company makes a discretionary profit-sharing contribution based on achieving certain financial metrics to individuals who’ve participated in the plan during the year. The Company’s contributions were $1.5 million and $0.9 million during the fiscal years ended June 30, 2019 and 2018, respectively.
| 6. | DEBT |
Prior to November 6, 2017, the Company maintained a $17.5 million revolving credit facility (the “Revolver”) with MUFG Union Bank. On November 6, 2017, in conjunction with entering into a new two-year Loan and Security Agreement (the “Credit Agreement”) with UMB Bank N.A. (“UMB”), the Company terminated the Revolver. In accordance with the relevant accounting guidance the termination was treated as a debt extinguishment. There were no unamortized debt issuance costs related to the Revolver at the time of termination. The outstanding borrowings under the Revolver of $17.2 million as of November 6, 2017, were fully paid from the proceeds of the borrowings under the Credit Agreement. The Company incurred $0.2 million in debt issuance costs for the Credit Agreement for origination and legal fees that were recorded in other assets in the consolidated balance sheet as of June 30, 2018. These debt issuance costs were being amortized through interest expense on a straight-line basis over the two-year life of the Credit Agreement.
The Credit Agreement provides the Company the ability to borrow up to $50.0 million on a revolving basis, allowing for 80% advance rate against accounts receivable and 10% advance rate against commissions receivable. The Credit Agreement contains customary events of default and a tangible net worth covenant. As of June 30, 2019, the Company was in compliance with all debt covenants. Interest on borrowings is computed based on a margin of 0.25%, plus the prime rate for corporate loans at UMB. Based on currently prevailing interest rates, the applicable interest rate as of June 30, 2019, is 5.75% per annum. The Company has granted a security interest in all of the Company’s assets as collateral (excluding the collateral designated for the Receivables Financing Agreement, as defined below). As of June 30, 2019, the Company had unused borrowing availability of $39.0 million.
On March 18, 2019, the Company entered into the Second Amendment to Loan and Security Agreement (the “Second Amendment to Credit Agreement”) which extended the maturity date of the Credit Agreement to March 19, 2021. There were no new debt issuance costs incurred, and the remaining unamortized debt issuance costs from the original Credit Agreement are being amortized over the new extended life of the facility. As of June 30, 2019, the unamortized debt issuance costs recorded in other current assets in the consolidated balance sheet was $0.1 million.
On September 23, 2019, the Company entered into the Third Amendment to Loan and Security Agreement (the “Third Amendment to Credit Agreement”) which increased the revolving loan commitment amount from $50.0 million to $75.0 million beginning October 1, 2019, and ending January 31, 2020, to account for the seasonality in the Senior segment due to AEP. During this period, the Company will pay a non-utilization fee equal to 0.15% of the lesser of (I) $25.0 million or (II) the unused borrowing availability and is payable monthly in arrears on the last day of each calendar month, commencing October 31, 2019. The debt issuance costs incurred by the Company were not material.
Subsequently, on November 5, 2019, the Credit Agreement was terminated when the Company entered into a new Credit Agreement with UMB as a lender and revolving agent and Morgan Stanley Capital Administrators, Inc. (“Morgan Stanley”) as a lender and the administrative agent for a syndicate of lenders party to the agreement (the “Senior Secured Credit Facility”). The Senior Secured Credit Facility provides for (1) a secured revolving loan facility with UMB in an aggregate principal amount of up to $75.0 million (the “Revolving Credit Facility”) and (2) a senior secured term loan facility in an aggregate principal
F-38
Table of Contents
amount of $425.0 million with a syndicate of lenders led by Morgan Stanley as the administrator for the lending group (the “Term Loan”). The outstanding balance under the prior Credit Agreement with UMB was rolled into the Revolving Credit Facility and will continue to be used for general working capital purposes. The proceeds of the Term Loan will be used (i) to finance a distribution to all holders of the Company’s common and preferred stock as well as holders of stock options in an aggregate amount of $275.0 million, (ii) to fund cash to the balance sheet in an aggregate amount of $68.0 million, equal to at least two years of interest payments in respect of the Term Loan, (iii) to pay the debt issuance costs incurred for the Senior Secured Credit Facility, and (iv) for general corporate purposes. The Senior Secured Credit Facility contains customary events of default and an asset coverage ratio covenant. The Company has granted a security interest in all of the Company’s assets as collateral (excluding the collateral designated for the Receivables Financing Agreement, as defined below).
The Revolving Credit Facility accrues interest on amounts drawn at a rate per annum equal to either (a) LIBOR plus 4.0% or (b) a base rate plus 3.0%, at the Company’s option. The Term Loan bears interest on the outstanding principal amount thereof at a rate per annum equal to either (a) LIBOR plus 6.0% or (b) a base rate plus 5.0%, at the Company’s option.
The Term Loan will be mandatorily repayable beginning from March 31, 2022, in equal quarterly installments in an aggregate annual amount equal to 1% of the original principal amount of the Term Loan, with the balance payable on the maturity date of November 5, 2024. In addition to paying interest on outstanding principal amounts under the Senior Secured Credit Facilities, the Company is required to pay a commitment fee, in respect of the unutilized commitments under the Revolving Credit Facility. The Revolving Credit Facility also has a maturity date of November 5, 2024.
On November 15, 2019, the Company declared a distribution of $188.7 million on all outstanding common stock and stock options (regardless of vesting status) ($1.96 per share) and $86.3 million on all classes of outstanding preferred stock ($15.66 per share), which was paid on November 20, 2019 (the “Distribution”). $265.8 million of the Distribution was paid to existing shareholders and $9.2 million was paid to stock option holders. The Distribution to shareholders is expected to be characterized as ordinary dividends up to current and accumulated earnings with the excess over earnings at time of the Distribution of $64.7 million treated as a return of capital and recorded in additional paid-in capital in the consolidated balance sheet. The Distribution to stock option holders is expected to be characterized as an equity restructuring where a one-time large cash payment is made in lieu of modifying the option award as the Plans (as defined below) do not allow for dividends to be distributed to holders of stock options and do not provide any dividend protections. Although no other terms of the option awards are being modified, the Distribution results in a modification to the outstanding awards and incremental share-based compensation costs will be recorded for the increase in fair value over the original awards.
Non-Recourse Debt—At June 30, 2019 and 2018, non-recourse debt consisted of the following (in thousands):
| 2019 | 2018 | |||||||
| Delayed draw credit facility |
$ | 14,835 | $ | — | ||||
| Unamortized debt issuance costs |
(300 | ) | — | |||||
|
|
|
|
|
|||||
| Total non-recourse debt |
14,535 | — | ||||||
| Less non-recourse debt—current |
3,920 | — | ||||||
|
|
|
|
|
|||||
| Non-recourse debt—net |
$ | 10,615 | $ | — | ||||
|
|
|
|
|
|||||
On December 14, 2018, the Company entered into a senior secured delayed draw credit facility (the “Receivables Financing Agreement”). Pursuant to the Receivables Financing Agreement, the Company has access to a senior secured delayed draw credit facility consisting of up to $30 million aggregate principal amount of commitments (the “Commitment”), with no more than quarterly draws in an aggregate original
F-39
Table of Contents
principal amount not to exceed the Commitment, with the commissions receivable from the Auto & Home insurance policies sold by SQAH as collateral. As the underlying policyholders renew their policies, the renewal commissions received from the insurance carriers are transferred to the lender as repayment of the draw, with any accrued interest being paid first. Each loan accrues interest at 11.5% that is computed on a daily basis on the unpaid principal and interest amounts. If the amount of renewal commissions received is not enough to pay off the loan balances, there is no recourse to the Company. If the Company continues to receive renewal commissions on the underlying policies after the time at which the loan balances are paid off, the right to those renewal commissions reverts back to the Company. The Receivables Financing Agreement contains customary events of default and a tangible net worth covenant. As of June 30, 2019, the Company was in compliance with all of the covenants.
As of June 30, 2019, the Company has received $16.2 million in proceeds from three draws on the facility and has repaid $1.4 million in principal balance with the remaining balance due included in non-recourse debt in the consolidated balance sheet. The proceeds from the loans are being used for general working capital purposes. As of June 30, 2019, the Company had unused borrowing availability of $13.8 million.
In its capacity as servicer under the Receivables Financing Agreement, SQAH performs administrative duties such as transferring principal and interest payments between the two parties, tracking loan balances, weekly and monthly reporting, and receives a monthly de minimus servicing fee as payment. The Company incurred $0.3 million of debt issuance costs for the three draws on the facility during the year ended June 30, 2019. Debt issuance costs are amortized through interest expense over the estimated time to pay off the individual note balances of five years for each draw. As of June 30, 2019, the unamortized debt issuance costs recorded as a discount to non-recourse debt—net in the consolidated balance sheet was $0.3 million. Accrued interest related to the Receivables Financing Agreement was $0.1 million as of June 30, 2019, recorded in accounts payable and accrued expenses in the consolidated balance sheet.
On July 31, 2019 and October 31, 2019, the Company made its fourth and fifth draws on the facility in the amounts of $4.6 million and $3.8 million, respectively, which were recorded in non-recourse debt in the consolidated balance sheet.
The loans drawn on the Receivables Financing Agreement are recorded on the consolidated balance sheet at amortized cost. The fair value of the loans is measured as a level 3 liability and is based on the incremental borrowing rate for similar debt. However, as the underlying assets securing the loans are of high credit quality and turn over quickly, the Company has determined that the fair value approximates carrying value.
F-40
Table of Contents
| 7. | REVENUES FROM CONTRACTS WITH CUSTOMERS |
Disaggregation of Revenue from Contracts with Customers—The table below depicts the disaggregation of revenue by segment and product for the years ended June 30, 2019 and 2018, and is consistent with how the Company evaluates its financial performance (in thousands):
| Year Ended June 30, | ||||||||
| 2019 | 2018(1) | |||||||
| Senior: |
||||||||
| Commission revenue: |
||||||||
| Medicare advantage |
$ | 138,526 | $ | 62,537 | ||||
| Medicare supplement |
25,118 | 26,189 | ||||||
| Prescription drug plan |
3,209 | 2,985 | ||||||
| Dental, vision, and health |
4,470 | 2,932 | ||||||
| Other commission revenue |
2,526 | 2,345 | ||||||
|
|
|
|
|
|||||
| Total commission revenue |
173,849 | 96,988 | ||||||
| Production bonus and other revenue |
18,408 | 5,420 | ||||||
|
|
|
|
|
|||||
| Total Senior revenue |
192,257 | 102,408 | ||||||
|
|
|
|
|
|||||
| Life: |
||||||||
| Commission revenue: |
||||||||
| Term |
76,135 | 71,951 | ||||||
| Other commission revenue |
13,111 | 5,850 | ||||||
|
|
|
|
|
|||||
| Total commission revenue |
89,246 | 77,801 | ||||||
| Production bonus and other revenue |
21,247 | 20,417 | ||||||
|
|
|
|
|
|||||
| Total Life revenue |
110,493 | 98,218 | ||||||
|
|
|
|
|
|||||
| Auto & Home: |
||||||||
| Total commission revenue |
33,240 | 32,108 | ||||||
| Production bonus and other revenue |
1,814 | 1,240 | ||||||
|
|
|
|
|
|||||
| Total Auto & Home revenue |
35,054 | 33,348 | ||||||
|
|
|
|
|
|||||
| Eliminations: |
||||||||
| Total commission revenue |
(335 | ) | (286 | ) | ||||
|
|
|
|
|
|||||
| Total commission revenue |
296,000 | 206,611 | ||||||
| Total production bonus and other revenue |
41,469 | 27,077 | ||||||
|
|
|
|
|
|||||
| Total revenue |
$ | 337,469 | $ | 233,688 | ||||
|
|
|
|
|
|||||
Contract Balances—The Company recorded an opening balance sheet adjustment to recognize contract assets of $177.6 million in the consolidated balance sheet as of June 30, 2017. As there was no activity in the contract balances other than movement between the contract balance accounts for the years ended June 30, 2019 and 2018, a separate roll forward other than what’s shown on the consolidated balance sheets is not relevant.
F-41
Table of Contents
| 8. | INCOME TAXES |
Income tax expense for the years ended June 30, 2019 and 2018, consists of the following:
| 2019 | 2018(1) | |||||||
| Current income taxes: |
||||||||
| Federal |
$ | (64 | ) | $ | — | |||
| State |
107 | 35 | ||||||
|
|
|
|
|
|||||
| Total |
43 | 35 | ||||||
|
|
|
|
|
|||||
| Deferred income taxes: |
||||||||
| Federal |
19,748 | 5,320 | ||||||
| State |
2,243 | 1,264 | ||||||
|
|
|
|
|
|||||
| Total |
21,991 | 6,584 | ||||||
|
|
|
|
|
|||||
| Income tax expense |
$ | 22,034 | $ | 6,619 | ||||
|
|
|
|
|
|||||
| (1) | As adjusted for the adoption of ASC 606 using the full retrospective method |
The Tax Cuts and Jobs Act (the “Act”), signed into law on December 22, 2017, reduced the tax rate for corporations effective for tax years beginning after January 1, 2018. In addition to the reduction in the corporate tax rate, the Act also (1) changed the rules related to utilization of net operating loss (NOL) carryforwards generated in tax years beginning after December 31, 2017; (2) eliminated the corporate alternative minimum tax (AMT) and changed how existing AMT credits can be realized; (3) expanded bonus depreciation that will allow for full expensing of qualifying property; and (4) created a new limitation on deductible interest expense.
The Company’s statutory federal tax rate is 21% and its current state tax rate (net of federal benefit) is 3.83% for the year ended June 30, 2019. Pursuant to the Act, as a fiscal year-end taxpayer, the Company used a blended federal statutory rate of 27.55% for the year ended June 30, 2018.
The difference from the Company’s statutory tax rates to the effective tax rates shown below for the years ended June 30, 2019 and 2018, were primarily due to Kansas High Performance Incentive Program (“HPIP”) tax credits offset by non-deductible expenses and the reduction in corporate tax rate under the Act, respectively. The following reconciles the statutory federal income tax rate to the effective income tax rate for the years ended June 30, 2019 and 2018:
| 2019 | 2018(1) | |||||||
| Federal statutory rate |
21.0 | % | 27.6 | % | ||||
| Increase in income tax benefit and decrease in income tax expense resulting from: |
||||||||
| State income taxes |
3.8 | 2.9 | ||||||
| Kansas HPIP credit |
(1.5 | ) | (1.2 | ) | ||||
| Remeasurement of deferred income tax liabilities |
— | (12.9 | ) | |||||
| Other |
— | (0.5 | ) | |||||
|
|
|
|
|
|||||
| Effective income tax rate |
23.3 | % | 15.9 | % | ||||
|
|
|
|
|
|||||
| (1) | As adjusted for the adoption of ASC 606 using the full retrospective method |
F-42
Table of Contents
Significant components of the deferred tax assets and liabilities at June 30, 2019 and 2018, were as follows:
| 2019 | 2018(1) | |||||||
| Deferred tax assets: |
||||||||
| Accruals and other |
$ | 3,085 | $ | 2,004 | ||||
| Deferred rent |
2,202 | 1,815 | ||||||
| Interest expense limitation |
420 | — | ||||||
| Net operating losses |
6,336 | 3,568 | ||||||
| Credit carryforward |
4,273 | 1,953 | ||||||
|
|
|
|
|
|||||
| Total deferred tax assets |
16,316 | 9,340 | ||||||
|
|
|
|
|
|||||
| Deferred tax liabilities: |
||||||||
| Commissions receivable |
(96,064 | ) | (68,653 | ) | ||||
| Basis difference in fixed and amortizable assets |
(1,504 | ) | (301 | ) | ||||
|
|
|
|
|
|||||
| Total deferred tax liabilities |
(97,568 | ) | (68,954 | ) | ||||
|
|
|
|
|
|||||
| Net long-term deferred tax liabilities |
$ | (81,252 | ) | $ | (59,614 | ) | ||
|
|
|
|
|
|||||
| (1) | As adjusted for the adoption of ASC 606 using the full retrospective method |
As discussed in Note 1 to the consolidated financial statements, the Company adopted ASC 606 effective July 1, 2018. For tax purposes, pursuant to proposed Treasury Regulations §1.451-3(c)(6)(ii), the Company defers revenue relating to certain commissions receivables into following years until it is collected, which gives rise to a deferred tax liability. Upon adoption, the Company recorded a $55.6 million adoption adjustment increasing the deferred tax liability recorded in long-term liabilities in the consolidated balance sheet as of June 30, 2018. This deferred tax liability is a source of future taxable income that can be used to support the realizability of deferred tax assets. The Company continues to recognize all of its deferred tax assets as of June 30, 2019, as it believes it is more likely than not that the deferred tax assets will be fully realized.
In accordance with the provisions of ASU 2016-09, the Company now classifies the excess income tax benefits from share-based compensation arrangements as a discrete item within income tax expense rather than recognizing such excess income tax benefits in additional paid-in capital. The Company recognized an income tax benefit of $0.2 million in the consolidated statement of operations related to excess tax benefits resulting from the exercise of non-qualified stock options during the year ended June 30, 2019. The cumulative effect of the adoption of ASU 2016-09 of $0.4 million was made during the year ended June 30, 2019, to recognize the excess income tax benefits from prior year share-based compensation arrangements in deferred income taxes and retained earnings in the consolidated balance sheet.
As discussed in Note 6 to the consolidated financial statements, the Company distributed $275.0 million to shareholders and option holders on November 20, 2019. Because the Company does not expect to have current or accumulated earnings and profits, for income tax purposes, the dividend distribution is expected to be treated and reported to shareholders as a non-dividend distribution.
As of June 30, 2019, the Company has NOL carryforwards for federal and state income tax purposes of $25.7 million and $19.4 million, respectively. Other than the federal NOL generated for the tax year ended June 30, 2019, which has an indefinite carryforward period, the federal carryforwards will expire in 2034 through 2038. The state carryforwards will expire in 2024 through 2039.
The Company is subject to income taxes in the US federal and various state jurisdictions. Tax regulations within each jurisdiction are subject to interpretation of the related tax laws and regulations and require the application of significant judgment. The federal tax returns from tax years 2015 through 2017 and state tax returns from tax years 2014 through 2017 remain open to examination by the major domestic taxing jurisdictions to which the Company is subject. NOLs generated on a tax return basis by the Company for tax years 2014 to 2017 will remain open to examination by the major domestic taxing jurisdictions until the statute of limitations expires for the year in which the loss carry overs are utilized.
F-43
Table of Contents
| 9. | COMMITMENTS AND CONTINGENCIES |
Lease Obligations—The Company leases office facilities in the United States in San Francisco, California; San Diego, California; Centennial, Colorado; Jacksonville, Florida; Overland Park, Kansas; Wilmington, North Carolina; and Des Moines, Iowa under noncancelable operating leases that expire at various dates through July 2029.
At June 30, 2019, future minimum lease obligations under noncancelable operating leases are as follows (in thousands):
| Year Ending June 30, |
Operating Leases |
|||
| 2020 |
$ | 5,874 | ||
| 2021 |
5,815 | |||
| 2022 |
5,112 | |||
| 2023 |
4,577 | |||
| 2024 |
4,859 | |||
| Thereafter |
17,820 | |||
|
|
|
|||
| Total minimum lease payments |
$ | 44,057 | ||
|
|
|
|||
The Company has entered into noncancelable agreements to sublease portions of its office facilities to unrelated third parties. Sublease rental income is recorded as a reduction of rent expense in the accompanying consolidated financial statements. Sublease rental income totaled $0.4 million and $0.2 million during the years ended June 30, 2019 and 2018, respectively. Minimum sublease rental income is anticipated to be $0.3 million and $0.2 million for the years ending June 30, 2020 and 2021, respectively. Future minimum lease payments for operating leases have not been reduced by the future minimum sublease income in the schedule above.
The Company recognizes rent expense on a straight-line basis over the lease period and has accrued for rent expense incurred but not paid. Rent expense for operating leases, net of sublease income, lease incentives, and rent recorded as restructuring expenses (refer to Note 4 of the consolidated financial statements) was $4.4 million and $3.7 million for the years ended June 30, 2019 and 2018, respectively, recorded in general and administrative operating costs and expenses in the consolidated statements of operations.
Legal Contingencies and Obligations—From time to time, the Company is subject to legal proceedings and claims in the ordinary course of business. The Company currently is not aware of any legal proceedings or claims that it believes will have, individually or in the aggregate, a material adverse effect on its business, financial condition, operating results, or cash flows.
| 10. | NET INCOME PER SHARE AND UNAUDITED PRO FORMA NET INCOME PER SHARE |
The Company calculates net income per share as defined by ASC Topic 260, “Earnings per Share”. Basic net income per share (“Basic EPS”) is computed by dividing net income attributable to common shareholders by the weighted-average common stock outstanding during the respective period. Net income attributable to common shareholders is computed by deducting both the dividends declared in the period on preferred stock and the dividends accumulated for the period on cumulative preferred stock from net income. Diluted net income per share (“Diluted EPS”) is computed by dividing net income attributable to common and common equivalent shareholders by the total of the weighted-average common stock outstanding and common equivalent shares outstanding during the respective period. For the purpose of calculating the Company’s Diluted EPS, common equivalent shares outstanding include the conversion of the preferred stock on an 8:1 ratio, as the rights and privileges dictate as such (refer to Note 11 to the consolidated financial statements) and common shares issuable upon the exercise of outstanding employee stock options. The number of common equivalent shares outstanding has been determined in accordance with the if-converted method for the preferred stock and the treasury stock method for employee stock options to the extent they are dilutive. Under the treasury stock method, the exercise price paid by the option holder and future
F-44
Table of Contents
share-based compensation expense that the Company has not yet recognized are assumed to be used to repurchase shares.
The following table sets forth the computation of Basic and Diluted EPS for the years ended June 30, 2019 and 2018 (in thousands, except per share amounts):
| 2019 | 2018 | |||||||
| Basic: |
||||||||
| Numerator: |
||||||||
| Net income |
$ | 72,579 | $ | 34,899 | ||||
| Less: dividends declared on Series A, B, C & D preferred stock |
(661 | ) | (661 | ) | ||||
| Less: cumulative dividends on Series D preferred stock |
(12,000 | ) | (12,000 | ) | ||||
|
|
|
|
|
|||||
| Net income attributable to common shareholders |
59,918 | 22,238 | ||||||
| Denominator: |
||||||||
| Weighted-average common stock outstanding |
85,378 | 81,314 | ||||||
|
|
|
|
|
|||||
| Net income per share—basic: |
$ | 0.70 | $ | 0.27 | ||||
|
|
|
|
|
|||||
| Diluted: |
||||||||
| Numerator: |
||||||||
| Net income attributable to common shareholders |
$ | 59,918 | $ | 22,238 | ||||
| Add: dividends declared on Series A, B & C preferred stock |
181 | 181 | ||||||
| Add: dividends declared on Series D preferred stock(1) |
480 | — | ||||||
| Add: cumulative dividends on Series D preferred stock(1) |
12,000 | — | ||||||
|
|
|
|
|
|||||
| Net income |
72,579 | 22,419 | ||||||
| Denominator: |
||||||||
| Weighted-average common stock outstanding |
85,378 | 81,314 | ||||||
| Series A, B & C preferred stock outstanding |
12,071 | 12,071 | ||||||
| Series D preferred stock outstanding(1) |
32,000 | — | ||||||
| Stock options outstanding to purchase shares of common stock |
3,042 | 3,036 | ||||||
|
|
|
|
|
|||||
| Total common and common equivalent shares outstanding |
132,491 | 96,421 | ||||||
|
|
|
|
|
|||||
| Net income per share—diluted: |
$ | 0.55 | $ | 0.23 | ||||
|
|
|
|
|
|||||
| (1) | Excluded from the computation of net income per share-diluted for the year ended June 30, 2018, because the effect would have been anti-dilutive. |
F-45
Table of Contents
The following table sets forth the computation of the Company’s unaudited pro forma basic and diluted net income per share for the period presented (in thousands, except per share amounts):
| Year Ended (Unaudited) |
||||
| Basic: |
||||
| Numerator: |
||||
| Net income |
$ | 72,579 | ||
| Denominator: |
||||
| Weighted-average common stock outstanding |
129,449 | |||
|
|
|
|||
| Pro forma net income per share—basic: |
$ | 0.56 | ||
|
|
|
|||
| Diluted: |
||||
| Numerator: |
||||
| Net income attributable to common and common equivalent shareholders |
$ | 72,579 | ||
| Denominator: |
||||
| Weighted-average common stock outstanding |
129,449 | |||
| Stock options outstanding to purchase shares of common stock |
3,042 | |||
|
|
|
|||
| Total common and common equivalent shares outstanding |
132,491 | |||
|
|
|
|||
| Pro forma net income per share—diluted: |
$ | 0.55 | ||
|
|
|
|||
| 11. | SHAREHOLDERS’ EQUITY |
Common and preferred shares issued include shares outstanding and shares held in the treasury stock.
Common Stock—As of June 30, 2019, the Company has reserved the following authorized, but unissued, shares of common stock:
| Series A redeemable convertible preferred stock |
6,782,208 | |||
| Series B convertible preferred stock |
4,878,192 | |||
| Series C convertible preferred stock |
410,952 | |||
| Series D convertible preferred stock |
32,000,000 | |||
| Options issued and outstanding under stock option plans |
9,156,080 | |||
| Options available for issuance under stock option plans |
607,448 | |||
|
|
|
|||
| Total |
53,834,880 | |||
|
|
|
Preferred Stock—The Company’s preferred stock is all classified as temporary equity. As per guidance under ASC 480-10-S99-3A(4), ASR 268 requires equity instruments with redemption features that are not solely within the control of the issuer to be classified outside of permanent equity, in temporary equity.
As per the terms of the preferred stock agreements for Series A-C, preferred stock is redeemable for cash and other assets on the occurrence of a deemed liquidation event. A deemed liquidation event includes a change of control which is outside of the Company’s control, since a purchaser could acquire a majority of the voting power of the Company without the approval of the Board. As such, since Series A-C preferred stock is redeemable upon the occurrence of an event that is not solely within the Company’s control, the preferred stock is classified as temporary equity.
As per the terms of the preferred stock agreement for Series D, preferred stock is redeemable for cash or other assets upon occurrence of a change of control (including deemed liquidation events), trigger events
F-46
Table of Contents
and passage of time. Specifically, in case of passage of time, the Series D investors may require the Company to redeem all shares of Series D for cash, at their option, on or after July 23, 2021. The Company cannot avoid such redemption, if elected by the Major Series D investors. Accordingly, the Series D preferred stock is required to be classified outside of permanent equity as it is redeemable outside the control of the Company.
Significant terms of the outstanding Series A, B, C, and D preferred stock are as follows:
Conversion—Each share of Series A, B, C, and D preferred stock may be converted into eight shares of common stock. Conversion is (i) at the option of the preferred shareholders and (ii) automatic upon the closing of an initial public offering of the Company’s common stock, meeting, in the case of the Series D, certain minimum requirements with respect to aggregate cash proceeds, pre-offering valuation of the Company and listing of such shares of common stock on the New York Stock Exchange or the NASDAQ Stock Market (the “Qualified IPO”), and upon the consent of a majority of the outstanding Series D shares.
Dividends—The holders of Series A, B, and C preferred stock are entitled to receive in any fiscal year noncumulative dividends at the rate of $0.00913 per share, $0.0365 per share, and $0.073 per share, respectively, when and if declared by the Company’s board of directors and at its discretion, before any dividends are paid on common or other preferred shares. Such dividends, whether undeclared or unpaid, shall not bear or accrue interest. During the year ended June 30, 2019, the Company declared and paid dividends to all classes of stock totaling $2 million. The holders of Series D preferred stock are entitled to receive cumulative dividends accrued at the rate of $3.00 per year, computed on the basis of a 365-day year from July 23, 2014, until July 23, 2021. Such dividends are payable only when and if declared by the board of directors. As of June 30, 2019, the aggregate cumulative preferred dividends and per-share amount were $59.2 million and $14.81, respectively.
Liquidation—In the event of any liquidation, dissolution or winding-up of the Company, either voluntarily or involuntarily, the holders of Series D preferred stock are entitled to receive the assets of the Company available for distribution, before any payment shall be made to the holders of any other class or series of capital stock of the Company, an amount equal to $20 per share, plus any unpaid cumulative dividends. The holders of Series A, B, and C preferred stock are, respectively, entitled to receive the remaining assets of the Company available for distribution, before any payment shall be made in respect of the common stock, an amount equal to $0.15 per share of Series A preferred stock, $0.61 per share of Series B preferred stock, and $1.22 per share of Series C preferred stock, plus any dividends thereon declared but unpaid. If the assets of the Company available for distribution are not sufficient to pay the full amount of distribution, plus any dividends thereon declared but unpaid, such assets will be distributed to Series D preferred stock holders based on its preferential amounts per share, and then ratably among the holders of the Series A, B, and C preferred stock based on the full preferential amount per share of the respective preferred stock that each such holder is entitled to receive.
Redemption—The Company may at any time, at the election of the board of directors and upon 60 days’ written notice, redeem all or part of the outstanding shares of Series A preferred stock at $0.15 per share. Shares of Series B and C preferred stock are not subject to mandatory redemption.
Series D preferred stock is also not subject to mandatory redemption; however, such shall be redeemed by the Company upon the delivery of a written notice (the “Put Notice”) requesting redemption of all of such Put Shares and delivered by the holders of at least a majority of the then outstanding Put Shares held by all of the Major Series D Investors.
The price per share of the Put Shares that are series D preferred stock, payable by the Company in connection with a Put Notice, shall be equal to the greater of (i) Original Issue Price, plus all Accruing Dividend accrued but unpaid thereon, whether or not declared, together with any other dividends declared but unpaid thereon; (ii) the amount that would be paid with respect to such Put Share,
F-47
Table of Contents
assuming the conversion of all shares of series D preferred stock into shares of Common Stock, in connection with a sale of all of the issued and outstanding capital stock as of the date of such Redemption Event for an aggregate purchase price equal to the product of (A) ten multiplied by (B) the Consolidated GAAP EBITDA (as defined in the Stockholders Agreement) for the trailing twenty month period ending on the last day of the most recent completed fiscal quarter prior to the date of such Redemption Event, divided by two and (iii) the amount that would be paid with respect to such share in connection with a sale of all of the issued and outstanding capital stock of the Company as of the date of such Redemption Event for the fair market value of such capital stock as determined by the mutual consent of the Board and the holders of the majority of Put Shares.
Voting Rights—Each share of Series A, B, C, and D preferred stock has voting rights equal to the number of common shares into which the shares of preferred stock are convertible. Additionally, the holders of the Series D preferred were given the right to appoint two members to a six-member board of directors and of approval from those two members for certain actions by the Company.
Other Rights—On July 23, 2021, or upon the occurrence of certain material triggering events (that primarily includes, any breach, default or event of default with respect to any indebtedness for borrowed money of the Company and/or its subsidiaries, and occurrence of any material breach by the Company of its duties and obligations under the COI or the Stockholders Agreement), the holders of Series D preferred stock are entitled to either force the sale of the Company or require the repurchase of the shares at the greater of i) the original issue price plus accrued but unpaid dividends, ii) the price per share obtained in a sale for the common stock, or iii) lacking a sale, then either the appraised value or a formulaic value based on profitability during the preceding 24 months (the “put right option”). The holders of Series D preferred stock are also entitled to drag along and preemptive rights.
On November 4, 2019, the Company revised the Series D preferred stock agreement to, among other items, extend the put right option date to January 31, 2025, subject to various terms and conditions and, upon completion of a Qualified IPO, eliminate the put right option.
| 12. | STOCK OPTION PLANS |
The Company has share-based compensation plans (the “Plans”) that allow for the grant of stock option awards to employees, nonemployee directors, and consultants. Stock options granted generally vest one-third at the end of the first year and then monthly on a pro rata basis over the next two years. Stock options expire 10 years from the date of grant. As of June 30, 2019, the Company has 607,448 in total shares remaining available for issuance under the Plans. A summary of activity under the Plans is set forth below:
| Number of Options |
Weighted- Average Exercise Price |
Weighted- Average Remaining Contractual Term |
Aggregate Intrinsic Value (in Thousands) |
|||||||||||||
| Outstanding—June 30, 2018 |
14,524,856 | $ | 0.88 | |||||||||||||
| Options granted |
689,200 | 1.88 | ||||||||||||||
| Options exercised |
(5,642,248 | ) | 0.76 | |||||||||||||
| Options forfeited/expired |
(415,728 | ) | 1.26 | |||||||||||||
|
|
|
|||||||||||||||
| Outstanding—June 30, 2019 |
9,156,080 | 1.01 | 6.01 | $ | 5,382 | |||||||||||
|
|
|
|||||||||||||||
| Vested and exercisable—June 30, 2019 |
7,307,352 | 0.88 | 5.40 | 5,144 | ||||||||||||
|
|
|
|||||||||||||||
The Company recognized share-based compensation expense of $0.1 million for each of the years ended June 30, 2019 and 2018. As of June 30, 2019, there was $0.1 million in nonvested unamortized share-based compensation to be recorded over 1.45 years. The Company received cash of $4.3 million and $0.6 million in connection with stock options exercised in the years ended June 30, 2019 and 2018, respectively.
F-48
Table of Contents
The fair value of stock options granted to employees is calculated on the grant date and requires subjective assumptions, including future stock price volatility and expected time to exercise, which greatly affect the fair values.
The following table provides the fair value of stock options granted under the Plans during the years ended June 30, 2019 and 2018, and the assumptions used to calculate the fair value using the Black-Scholes-Merton option-pricing model:
| 2019 | 2018 | |||||||
| Volatility |
24.8 | % | 24.8 | % | ||||
| Risk-free interest rate—weighted average |
2.7 | % | 2.1 | % | ||||
| Dividend yield |
1.9% to 2.3 | % | 1.9% to 2.3 | % | ||||
| Assumed forfeitures |
— | % | — | % | ||||
| Expected lives |
5.95 years | 5.89 years | ||||||
| Weighted-average fair value (per share) |
$0.15 | $0.05 | ||||||
The Company is unable to compute the volatility of its stock because it has no trading history to properly make this calculation. Therefore, the Company uses volatility data obtained from a peer group of publicly traded companies in the insurance agent and broker industry. The Company does not make an estimate of option forfeitures in its calculation of fair value, instead reflecting actual forfeitures as they occur.
| 13. | SEGMENT INFORMATION |
The Company’s reportable segments have been determined in accordance with ASC 280, Segment Reporting. The Company currently has three reportable segments: i) Senior ii) Life and iii) Auto & Home which represent the three main different types of insurance products sold by the Company. The Senior segment primarily sells senior Medicare-related health insurance, the Life segment primarily sells term life insurance, and the Auto & Home segment primarily sells individual automobile and homeowners’ insurance. In addition, the Company accounts for non-operating activity, share-based compensation expense, certain intersegment eliminations, and the costs of providing corporate and other administrative services in its administrative division, Corporate & Eliminations. These services are not directly identifiable with the Company’s reportable segments and are shown in the tables below to reconcile the reportable segments to the consolidated financial statements. The Company has not aggregated any operating segments together to represent a reportable segment.
The Company reports segment information based on how its chief executive officer, who is the chief operating decision maker (“CODM”), regularly reviews its operating results, allocates resources, and makes decisions regarding business operations. The performance measures of the segments include total revenue and Adjusted EBITDA because management believes that such information is the most relevant in evaluating the results of the respective segments relative to other entities that operate in the same industries.
Costs of revenue, marketing and advertising, and technical development operating expenses that are directly attributable to a segment are reported within the applicable segment. Indirect costs of revenue, marketing and advertising, and technical development operating expenses are allocated to each segment based on varying metrics such as headcount. Adjusted EBITDA is calculated as total revenue for the applicable segment less direct and allocated costs of revenue, marketing and advertising, technical development, and general and administrative operating costs and expenses, excluding depreciation and amortization expense; loss on disposal of property, equipment and software; share-based compensation expense; restructuring expenses; and non-recurring expenses such as severance payments and transaction costs. Our CODM does not separately evaluate assets by segment; therefore, assets by segment are not presented.
F-49
Table of Contents
The following table presents information about the reportable segments for the year ended June 30, 2019 (in thousands):
| Senior | Life | Auto & Home | Corp & Elims | Consolidated | ||||||||||||||||
| Revenue |
$ | 192,257 | $ | 110,493 | $ | 35,054 | $ | (335 | ) | $ | 337,469 | |||||||||
| Operating expenses |
(102,083 | ) | (84,672 | ) | (27,237 | ) | (18,184 | )(1) | (232,176 | ) | ||||||||||
| Other expenses |
— | — | — | (15 | ) | (15 | ) | |||||||||||||
|
|
|
|
|
|
|
|
|
|
|
|||||||||||
| Adjusted EBITDA |
90,174 | 25,821 | 7,817 | (18,534 | ) | 105,278 | ||||||||||||||
| Loss on disposal of property, equipment and software |
(221 | ) | ||||||||||||||||||
| Share-based compensation expense |
(86 | ) | ||||||||||||||||||
| Restructuring expenses |
(2,305 | ) | ||||||||||||||||||
| Non-recurring expenses |
(1,691 | ) | ||||||||||||||||||
| Depreciation and amortization |
(4,702 | ) | ||||||||||||||||||
| Income tax expense |
(22,034 | ) | ||||||||||||||||||
| Interest expense |
(1,660 | ) | ||||||||||||||||||
|
|
|
|||||||||||||||||||
| Net income |
$ | 72,579 | ||||||||||||||||||
|
|
|
|||||||||||||||||||
| (1) | Operating expenses in the Corp & Elims division primarily include $12.2 million in salaries and benefits for certain general, administrative, and IT related departments and $4.2 million in professional services fees. |
The following table presents information about the reportable segments for the year ended June 30, 2018 (in thousands):
| Senior | Life | Auto & Home | Corp & Elims | Consolidated | ||||||||||||||||
| Revenue |
$ | 102,408 | $ | 98,218 | $ | 33,348 | $ | (286 | ) | $ | 233,688 | |||||||||
| Operating expenses |
(65,720 | ) | (75,249 | ) | (24,127 | ) | (18,657 | )(1) | (183,753 | ) | ||||||||||
| Other expenses |
— | — | — | (9 | ) | (9 | ) | |||||||||||||
|
|
|
|
|
|
|
|
|
|
|
|||||||||||
| Adjusted EBITDA |
36,688 | 22,969 | 9,221 | (18,952 | ) | 49,926 | ||||||||||||||
| Loss on disposal of property, equipment and software |
(700 | ) | ||||||||||||||||||
| Share-based compensation expense |
(67 | ) | ||||||||||||||||||
| Restructuring expenses |
(2,808 | ) | ||||||||||||||||||
| Non-recurring expenses |
(436 | ) | ||||||||||||||||||
| Depreciation and amortization |
(3,468 | ) | ||||||||||||||||||
| Income tax expense |
(6,619 | ) | ||||||||||||||||||
| Interest expense |
(929 | ) | ||||||||||||||||||
|
|
|
|||||||||||||||||||
| Net income |
$ | 34,899 | ||||||||||||||||||
|
|
|
|||||||||||||||||||
| (1) | Operating expenses in the Corp & Elims division primarily include $12.7 million in salaries and benefits for certain general, administrative, and IT related departments and $4.2 million in professional services fees. |
Revenues from each of the reportable segments are earned from transactions in the United States and follow the same accounting policies used for the Company’s consolidated financial statements that are described in the summary of significant accounting policies in Note 1 to the consolidated financial statements. All of the Company’s long-lived assets are located in the United States. For the year ended June 30, 2019, three insurance carrier customers, all from Senior, accounted for 23%, 14%, and 12% of total revenue. For the year ended June 30, 2018, three insurance carrier customers, two from Senior and one from Life, accounted for 14%, 13%, and 13% of total revenue.
F-50
Table of Contents
| 14. | RELATED-PARTY TRANSACTIONS |
The Company purchases leads from an online marketing consulting firm owned in part by individuals related to one of the Company’s shareholders or are members of management. The Company incurred $10.1 million and $10.0 million in lead costs with this firm for the years ended June 30, 2019 and 2018, that were recorded in marketing expense in the consolidated statements of operations. The Company owed $0.2 million and $0.5 million to this firm as of June 30, 2019 and 2018, respectively, that were recorded in accounts payable and accrued expenses in the consolidated balance sheets. At June 30, 2019 and 2018, the shareholder, related affiliates, and the related members of management owned 21.36% and 19.54% of the Company, respectively.
The Company purchases leads from a firm that sells direct-to-consumer Medicare Supplement plans and is owned in part by individuals related to one of the Company’s shareholders or are members of the Company’s management. The Company incurred $1.6 million and $0.7 million in lead costs with this firm for the years ended June 30, 2019 and 2018, respectively, that were recorded in marketing expense in the consolidated statements of operations. The Company did not have any outstanding payables due to this firm as of June 30, 2019, and owed $0.1 million as of June 30, 2018, that was recorded in accounts payable and accrued expenses in the consolidated balance sheet. In addition, the Company acts as the Field Marketing Organization on behalf of this firm. The net financial impact of this relationship to the Company was not material for each of the years ended June 30, 2019 and June 30, 2018. At June 30, 2019 and 2018, the shareholder, related affiliates, and the related members of management owned 21.36% and 19.54% of the Company, respectively.
The Company entered into a consulting agreement with another shareholder and former employee in January 2011 effective until canceled by either party. During the years ended June 30, 2019 and 2018, the Company incurred consulting expenses of less than $0.1 million and $0.1 million, respectively, that were recorded in general and administrative expense in the consolidated statements of operations. The Company did not have any outstanding payables due to this consultant as of June 30, 2019, and owed $0.1 million as of June 30, 2018, that was recorded in accounts payable and accrued expenses in the consolidated balance sheet. At June 30, 2019 and 2018, the shareholder owned 3.61% and 3.77% of the Company, respectively.
As of June 30, 2019, the Company had a related party receivable outstanding from a current board member that arose from a stock option exercise that was initiated before June 30, 2019, but the payment was not received by the Company until after June 30, 2019, thus causing a $0.4 million receivable recorded in other current assets in the consolidated balance sheet as of June 30, 2019. As of June 30, 2018, there were no related party receivables outstanding.
On January 1, 2016, the Company issued $2.0 million of subordinated promissory notes to seven shareholders as a condition of obtaining the Revolver. The subordinated promissory notes were paid off in January 2018, and the Company recorded interest expense for the year ended June 30, 2018, of $0.1 million.
| 15. | SUBSEQUENT EVENTS |
Refer to Notes 1, 6, 8, and 11 of the consolidated financial statements for subsequent events related to the stock split, debt, and equity. The Company evaluated subsequent events through November 26, 2019, the date the consolidated financial statements were available to be issued, and through March 4, 2020, as to the effects of the stock split.
* * * * * *
F-51
Table of Contents
Until and including , 2020, all dealers effecting transactions in these securities, whether or not participating in this offering, may be required to deliver a prospectus. This is in addition to a dealer’s obligation to deliver a prospectus when acting as an underwriter and with respect to an unsold allotment or subscription.
25,000,000 Shares
SelectQuote, Inc.
Common Stock
PRELIMINARY PROSPECTUS
Credit Suisse
Morgan Stanley
Evercore ISI
RBC Capital Markets
Barclays
Citigroup
Jefferies
Cantor
Keefe Bruyette & Woods
A Stifel Company
Piper Sandler
Drexel Hamilton
, 2020
Table of Contents
PART II
INFORMATION NOT REQUIRED IN PROSPECTUS
Item 13. Other Expenses of Issuance.
The following table sets forth the various expenses, other than the underwriting discount, payable in connection with the offering contemplated by this registration statement. All of the fees set forth below are estimates except for the SEC registration fee, the FINRA fee and the stock exchange listing fee.
| Payable by the registrant |
||||
| SEC registration fee |
$ | 70,903 | ||
| FINRA fee |
$ | 82,440 | ||
| Stock exchange listing fee |
$ | 295,000 | ||
| Printing expenses |
$ | 300,000 | ||
| Legal fees and expenses |
$ | 3,000,000 | ||
| Accounting fees and expenses |
$ | 2,000,000 | ||
| Transfer agent and registrar fees |
$ | 5,000 | ||
| Miscellaneous fees and expenses |
$ | 410,000 | ||
| Total |
$ | 6,163,343 | ||
Item 14. Indemnification of Directors and Officers.
Limitation of personal liability of directors and indemnification
Section 102(b)(7) of the DGCL permits a corporation to provide in its certificate of incorporation that a director of the corporation shall not be personally liable to the corporation or its stockholders for monetary damages for breach of fiduciary duty as a director, except for liability (1) for any breach of the director’s duty of loyalty to the corporation or its stockholders, (2) for acts or omissions not in good faith or which involve intentional misconduct or a knowing violation of law, (3) under Section 174 of the DGCL (regarding, among other things, the payment of unlawful dividends or unlawful stock purchases or redemptions), or (4) for any transaction from which the director derived an improper personal benefit. Our certificate of incorporation will provide for such limitation of liability.
Section 145(a) of the DGCL empowers a corporation to indemnify any director, officer, employee or agent, or former director, officer, employee or agent, who was or is a party or is threatened to be made a party to any threatened, pending or completed action, suit or proceeding, whether civil, criminal, administrative or investigative (other than an action by or in the right of the corporation), by reason of such person’s service as a director, officer, employee or agent of the corporation, or such person’s service, at the corporation’s request, as a director, officer, employee or agent of another corporation or enterprise, against expenses (including attorneys’ fees), judgments, fines and amounts paid in settlement actually and reasonably incurred by such person in connection with such action, suit or proceeding; provided that such director or officer acted in good faith and in a manner reasonably believed to be in or not opposed to the best interests of the corporation; and, with respect to any criminal action or proceeding, provided that such director or officer had no reasonable cause to believe his conduct was unlawful.
Section 145(b) of the DGCL empowers a corporation to indemnify any person who was or is a party or is threatened to be made a party to any threatened, pending or completed action or suit by or in the right of the corporation to procure a judgment in its favor by reason of the fact that such person is or was a director, officer, employee or agent of the corporation, or is or was serving at the request of the corporation as a director, officer, employee or agent of another enterprise, against expenses (including attorneys’ fees) actually and reasonably incurred in connection with the defense or settlement of such action or suit; provided that such director or officer
II-1
Table of Contents
acted in good faith and in a manner he or she reasonably believed to be in or not opposed to the best interests of the corporation, except that no indemnification may be made in respect of any claim, issue or matter as to which such director or officer shall have been adjudged to be liable to the corporation unless and only to the extent that the Delaware Court of Chancery or the court in which such action or suit was brought shall determine upon application that, despite the adjudication of liability but in view of all the circumstances of the case, such director or officer is fairly and reasonably entitled to indemnity for such expenses that the court shall deem proper. Notwithstanding the preceding sentence, except as otherwise provided in our bylaws, we shall be required to indemnify any such person in connection with a proceeding (or part thereof) commenced by such person only if the commencement of such proceeding (or part thereof) by any such person was authorized by the Board of Directors.
Our sixth amended and restated certificate of incorporation and our amended and restated bylaws will require us to indemnify any person who was or is a party or is threatened to be made a party to or is otherwise involved in any threatened, pending or completed action, suit or proceeding by reason of the fact that he or she is or was a director or officer of SelectQuote, or is or was serving at the request of SelectQuote as a director, officer, trustee, employee or agent of another corporation or of a partnership, joint venture, trust or other enterprise, including service with respect to employee benefit plans maintained or sponsored by SelectQuote, against all expense, liability and loss (including attorneys’ fees, judgments, fines, ERISA excise taxes or penalties and amounts paid or to be paid in settlement) incurred or suffered by such person in connection with such proceeding if the person acted in good faith and in a manner reasonably believed to be in or not opposed to the best interests of SelectQuote, and, with respect to any criminal action or proceeding, had no reasonable cause to believe his or her conduct was unlawful.
We will be authorized under our sixth amended and restated certificate of incorporation and our amended and restated bylaws to purchase and maintain insurance to protect SelectQuote and any current or former director, officer, employee or agent of SelectQuote or another corporation, partnership, joint venture, trust or other enterprise against any expense, liability or loss, whether or not SelectQuote would have the power to indemnify such person against such expense, liability or loss under the DGCL. We believe that these indemnification provisions and the directors’ and officers’ insurance are useful to attract and retain qualified directors and executive officers.
We expect that the underwriting agreement will provide for indemnification of directors and officers of SelectQuote by the underwriters against certain liabilities.
Item 15. Recent Sales of Unregistered Securities.
Within the past three years, we have engaged in the following transactions that were not registered under the Securities Act:
On April 17, 2020 and May 6, 2020, we issued and sold an aggregate of 100,000 shares and 35,000 shares, respectively, of our Series E preferred stock to certain “accredited investors” (as defined in Regulation D promulgated under the Securities Act), at a purchase price of $1,000 per share, for aggregate proceeds of approximately $135.0 million in cash and net proceeds to the Company of approximately $129.0 million, after deducting commissions and expenses. The offer, sale and issuance of these securities was exempt from registration under the Securities Act under Section 4(a)(2) of the Securities Act as a transaction by an issuer not involving a public offering. The recipients of these securities acquired them for investment only and not with a view to or for sale in connection with any distribution thereof and appropriate legends were affixed to the securities issued in this transaction. Each of the recipients of securities in this transaction was an accredited person and had adequate access, through employment, business or other relationships, to information about the registrant.
II-2
Table of Contents
From May 15, 2017 through the filing date of this registration statement, we granted to our directors, officers, employees, consultants and other service providers options to purchase an aggregate of 4,091,192 shares of our common stock under the 2003 Stock Plan with per share exercise prices ranging from $1.38 to $3.13 per share.
From May 15, 2017 through the date of this prospectus, we issued to our directors, officers, employees, consultants and other service providers an aggregate of 11,284,936 shares of our common stock pursuant to the exercise of stock options for aggregate consideration of $10,229,510.
The stock options and shares of common stock issued upon the exercise of such options described in this Item 15 were issued under the 2003 Stock Plan in reliance on either the exemption provided by Rule 701 promulgated under the Securities Act or the exemption provided under Regulation D under the Securities Act. Each of the recipients of securities in these transactions had adequate access, through employment, business or other relationships, to information about us.
Item 16. Exhibits and Financial Statement Schedules.
(a) Exhibits: The list of exhibits set forth under “Exhibit Index” at the end of this Registration Statement is incorporated herein by reference.
Item 17. Undertakings.
The undersigned registrant hereby undertakes to provide to the underwriters at the closing specified in the underwriting agreement certificates in such denominations and registered in such names as required by the underwriters to permit prompt delivery to each purchaser.
Insofar as indemnification for liabilities arising under the Securities Act may be permitted to directors, officers and controlling persons of the registrant pursuant to the foregoing provisions, or otherwise, the registrant has been advised that, in the opinion of the Securities and Exchange Commission, such indemnification is against public policy as expressed in the Securities Act and is, therefore, unenforceable. In the event that a claim for indemnification against such liabilities (other than the payment by the registrant of expenses incurred or paid by a director, officer or controlling person of the registrant in the successful defense of any action, suit or proceeding) is asserted by such director, officer or controlling person in connection with the securities being registered, the registrant will, unless in the opinion of its counsel the matter has been settled by controlling precedent, submit to a court of appropriate jurisdiction the question whether such indemnification by it is against public policy as expressed in the Securities Act and will be governed by the final adjudication of such issue.
The registrant hereby further undertakes that:
(1) For purposes of determining any liability under the Securities Act, the information omitted from the form of prospectus filed as part of this registration statement in reliance upon Rule 430A and contained in a form of prospectus filed by the registrant pursuant to Rule 424(b)(1) or (4) or 497(h) under the Securities Act shall be deemed to be part of this registration statement as of the time it was declared effective; and
(2) For purposes of determining any liability under the Securities Act, each post-effective amendment that contains a form of prospectus shall be deemed to be a new registration statement relating to the securities offered therein, and the offering of such securities at that time shall be deemed to be the initial bona fide offering thereof.
II-3
Table of Contents
EXHIBIT INDEX
| * | To be filed by amendment. |
| + | Previously filed. |
| † | Indicates management contract or compensatory plan. |
II-4
Table of Contents
Pursuant to the requirements of the Securities Act of 1933, the registrant has duly caused this Registration Statement to be signed on its behalf by the undersigned, thereunto duly authorized, in the City of Kansas City, State of Kansas, on May 15, 2020.
| SELECTQUOTE, INC. | ||
| By: | /s/ Tim Danker | |
| Name: | Tim Danker | |
| Title: | Chief Executive Officer | |
Pursuant to the requirements of the Securities Act of 1933, this registration statement has been signed by the following persons in the capacities and on the dates indicated.
| Signature |
Title |
Date | ||||
| By: | /s/ Tim Danker Tim Danker |
Chief Executive Officer and Director (Principal Executive Officer) |
May 15, 2020 | |||
| By: | /s/ Raffaele Sadun Raffaele Sadun |
Chief Financial Officer (Principal Financial and Accounting Officer) |
May 15, 2020 | |||
| By: | * Donald Hawks III |
Chairman of the Board of Directors | May 15, 2020 | |||
| By: | * Tom Grant |
Vice Chairman of the Board of Directors | May 15, 2020 | |||
| By: | * Donald Britton |
Director | May 15, 2020 | |||
| By: | * Earl Devanny III |
Director | May 15, 2020 | |||
| By: | * Denise Devine |
Director | May 15, 2020 | |||
| By: | * Raymond Weldon |
Director | May 15, 2020 | |||
| *By: | /s/ Raffaele Sadun Attorney-in-Fact |
|||||
II-5