Attached files
| file | filename |
|---|---|
| EX-99.2 - EXHIBIT 99.2 - ARCH RESOURCES, INC. | tm2019876d1_ex99-2.htm |
| EX-3.3 - EXHIBIT 3.3 - ARCH RESOURCES, INC. | tm2019876d1_ex3-3.htm |
| EX-3.2 - EXHIBIT 3.2 - ARCH RESOURCES, INC. | tm2019876d1_ex3-2.htm |
| EX-3.1 - EXHIBIT 3.1 - ARCH RESOURCES, INC. | tm2019876d1_ex3-1.htm |
| 8-K - FORM 8-K - ARCH RESOURCES, INC. | tm2019876-1_8k.htm |
Exhibit 99.1
Investor Presentation MAY 15, 2020

Investor Presentation Forward - Looking Information This presentation contains “forward - looking statements” – that is, statements related to future, not past, events . In this context, forward - looking statements often address our expected future business and financial performance, and often contain words such as “expects,” “anticipates,” “intends,” “plans,” “believes,” “seeks,” or “will . ” Forward - looking statements by their nature address matters that are, to different degrees, uncertain . For us, particular uncertainties arise from the COVID - 19 pandemic, including its adverse effects on businesses, economies, and financial markets worldwide ; from changes in the demand for our coal by the global electric generation and steel industries ; from legislation and regulations relating to the Clean Air Act and other environmental initiatives ; from competition within our industry and with producers of competing energy sources ; from our ability to successfully acquire or develop coal reserves ; from operational, geological, permit, labor and weather - related factors ; from the Tax Cuts and Jobs Act and other tax reforms ; from the effects of foreign and domestic trade policies, actions or disputes ; from fluctuations in the amount of cash we generate from operations, which could impact, among other things, our ability to pay dividends or repurchase shares in accordance with our announced capital allocation plan ; from our ability to successfully integrate the operations that we acquire ; from our ability to complete the joint venture transaction with Peabody Energy in a timely manner, including obtaining regulatory approvals and satisfying other closing conditions ; from our ability to achieve expected synergies from the joint venture ; from our ability to successfully integrate the operations of certain mines in the joint venture ; and from numerous other matters of national, regional and global scale, including those of a political, economic, business, competitive or regulatory nature . These uncertainties may cause our actual future results to be materially different than those expressed in our forward - looking statements . We do not undertake to update our forward - looking statements, whether as a result of new information, future events or otherwise, except as may be required by law . For a description of some of the risks and uncertainties that may affect our future results, you should see the risk factors described from time to time in the reports we file with the Securities and Exchange Commission . This presentation includes certain non - GAAP financial measures, including, Free Cash Flow, Adjusted EBITDA, Adjusted EBITDA and cash costs per ton . These non - GAAP financial measures are not measures of financial performance in accordance with generally accepted accounting principles and may exclude items that are significant in understanding and assessing our financial results . Therefore, these measures should not be considered in isolation or as an alternative to net income from operations, cash flows from operations, earnings per fully - diluted share or other measures of profitability, liquidity or performance under generally accepted accounting principles . You should be aware that our presentation of these measures may not be comparable to similarly - titled measures used by other companies . A reconciliation of these financial measures to the most comparable measures presented in accordance with generally accepted accounting principles has been included at the end of this presentation . 2

Investor Presentation Arch Resources In Brief Arch is a large and growing U.S. producer of high - quality metallurgical coals, and the leading global supplier of premium, High - Vol A coking coal ▪ We operate large, modern coking coal mines at the low end of the U.S. cost curve ▪ Our product slate is dominated by High - Vol A coals that typically earn a market premium ▪ Our Leer South growth project will solidify our position as the leading global supplier of High - Vol A coal ▪ We have exceptional, long - lived reserves that provide significant and valuable optionality for long - term growth Arch’s strong coking coal position is supplemented by a top - tier thermal franchise ▪ We operate competitive mines in the Powder River Basin and other key supply regions ▪ Our mines have modest capital needs and historically have generated significant free cash ▪ The completion of the JV with Peabody would facilitate greater optimization of our thermal asset base Arch has deep expertise in mining, marketing and logistics – and, critically, in mine safety and environmental stewardship – and levers those competencies in both steel and power markets Arch has one of the industry’s strongest balance sheets and the potential to generate high levels of free cash in a wide range of market conditions – particularly once longwall mining commences at Leer South 3

Investor Presentation Arch’s Premier Metallurgical Franchise 4 ARCH RESOURCES

Investor Presentation 5 Arch’s Coking Coal Franchise 0.0 2.0 4.0 6.0 8.0 10.0 12.0 Peer 1 Arch Peer 2 Peer 3 Peer 4 ESTIMATED U.S. COKING COAL OUTPUT BY PRODUCER, 2019 (in millions of tons, excluding estimated PCI volumes) ARCH’S COKING COAL PRODUCT SUITE (percentage of expected 2020 sales) High - Vol A High - Vol B Low - Vol With the startup of Leer South, the percentage of High - Vol A coal in Arch’s mix will approach 80 percent and its High - Vol A output will climb to ~8 million tons, or nearly one third of total global supply Source: Arch and MSHA Peer group includes Blackhawk, Contura , Coronado, Warrior (listed here alphabetically) Arch is a large, low - cost, growing metallurgical producer with the world’s most valuable High - Vol A coking coal franchise Pro Forma Capacity w/Leer South

Investor Presentation Arch’s Market Reach Arch is penetrating new markets and expanding the global reach of its high - quality metallurgical product suite 6 ARCH’S 2019 METALLURGICAL SHIPMENTS (by geographic region) Arch has a highly strategic, 35 - percent equity interest in Dominion Terminal Associates (DTA) in Newport News, Va. Map reflects Arch’s historical global customer base 0% 10% 20% 30% 40% 50% U.S. Brazil Canada Asia Europe 48% 21% 10% 5% 16%
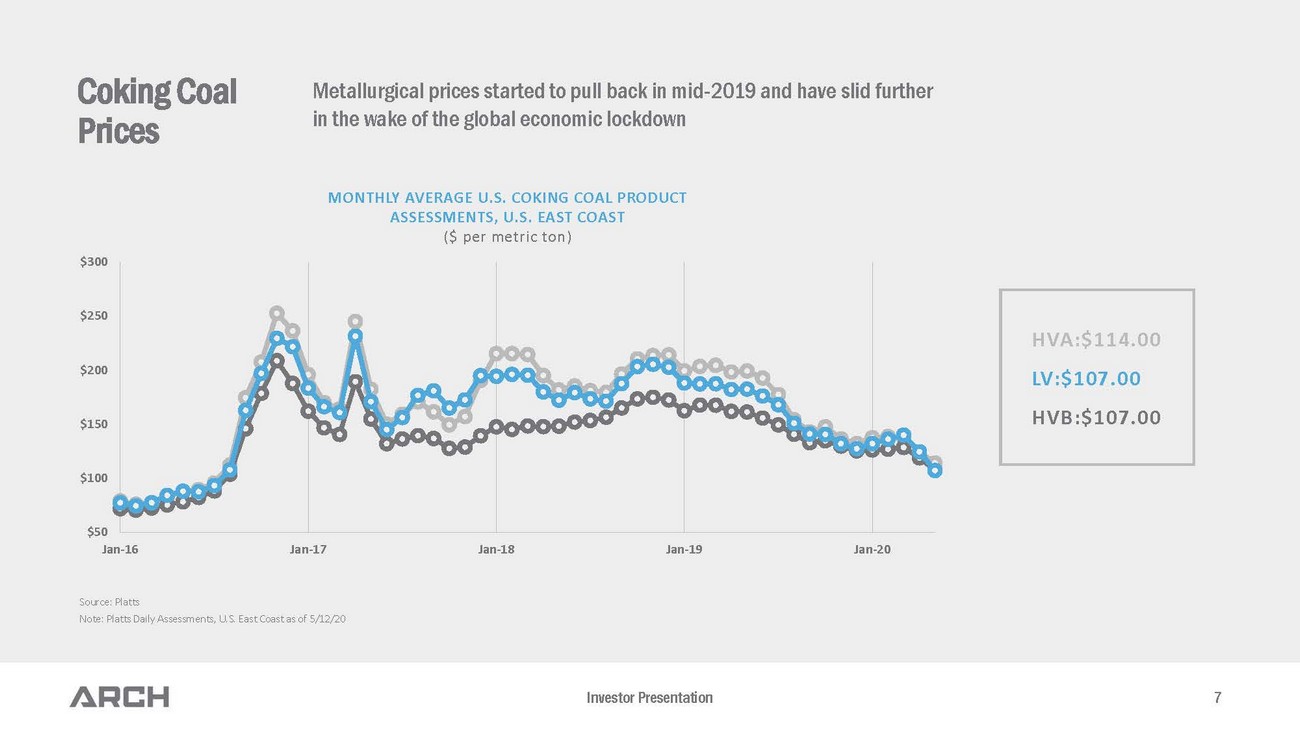
Investor Presentation 7 Coking Coal Prices $50 $100 $150 $200 $250 $300 Jan-16 Jan-17 Jan-18 Jan-19 Jan-20 Source: Platts Note: Platts Daily Assessments, U.S. East Coast as of 5/12/20 HVA:$114.00 LV:$107.00 HVB:$107.00 MONTHLY AVERAGE U.S. COKING COAL PRODUCT ASSESSMENTS, U.S. EAST COAST ($ per metric ton) Metallurgical prices started to pull back in mid - 2019 and have slid further in the wake of the global economic lockdown

Investor Presentation Arch’s Next World - Class High - Vol A Longwall Mine 8 LEER SOUTH

Investor Presentation Leer South Leer South will be nearly identical to Arch’s world - class Leer mine 20 Years Longwall Lower Kittanning ~ 74 inches ~ 6,700 feet Up to 4 million tons High - Vol A Sub - $50 Baltimore / DTA Leer Leer South 20 Years Longwall Lower Kittanning ~ 65 inches ~ 9,000 feet Up to 4 million tons High - Vol A Low - $50s Baltimore / DTA Note: Excluding the reserves in the mine plans for Leer and Leer South, Arch will still have ~ 150 million tons of undeveloped reserves in the Tygart Valley reserve block. Mine life Mining technique Seam Seam thickness Average panel length Annual met output Product quality Projected cash cost Export facilities Tygart Valley Reserve Block Leer Leer South

Investor Presentation 10 Leer South Leer South will lower the average cost, increase the average quality, and expand the average operating margin of Arch’s metallurgical portfolio ~ $60 ~ $57 2020 2020 Pro Forma PROJECTED 2020 COKING COAL COSTS 201 9 2022 65 % ~ 80% 6.8 million tons ~ 10 million tons High - Vol A PROJECTED PAYBACK FOR LEER SOUTH AT VARIOUS MARKET PRICES Price * $225 $200 $175 $150 $125 Payback 15 months 18 months 24 months 30 months 48 months * High - Vol A price per metric ton, FOB vessel, U.S. East Coast Note: Reflects February 2020 guidance

Investor Presentation 11 Source: Internal 2 0 68 22 100 110 20 40 60 80 120 76 74 48 56 60 40 4 50 30 14 28 38 58 26 62 20 64 18 24 10 32 12 0 44 16 6 66 46 72 42 8 10 30 50 70 90 130 150 54 140 70 36 52 34 FOB MINE CASH COST ($/T0N) Leer Leer South (projected) ANNUAL ESTIMATED PRODUCTION (MM TONS) COAL PRODUCTION FROM IDENTIFIED METALLURGICAL MINES IN THE U.S. Coking Coal Cash Costs We expect U.S. metallurgical mine costs to continue to shift higher

Investor Presentation ACTUAL 2019 EBITDA VERSUS PRO FORMA 2019 EBITDA WITH LEER SOUTH, AT VARIOUS HIGH - VOL A PRICES* (in millions of dollars) 12 Leer South The addition of Leer South should greatly boost Arch’s cash generation across a wide range of pricing scenarios ▪ The start - up of the longwall at Leer South would have boosted Arch’s EBITDA by more than 50 percent on a pro forma basis in 2019, based on a near - $175 average High - Vol A price last year and holding all else equal $363 $550 $375 2019 EBITDA $175/Ton $150/Ton Actual Pro Forma (with Leer South) $200 $125/Ton * High - Vol A price, FOB the vessel, with corresponding prices for Low - Vol and High - Vol B products based on actual, 2019 differentials for those products

Investor Presentation Arch’s Competitive Thermal Franchise 13 THERMAL

Investor Presentation Viper is an efficient Illinois deep mine and longstanding supplier to a neighboring municipal generator and to industrial facilities. Knight Hawk , in which Arch holds a 48 - percent equity interest, has one of the lowest net cost structures in the region. West Elk is a low - cost Colorado longwall mine that produces high - heat, low - sulfur coal that is well - suited to the needs of domestic generators and industrial facilities as well as the export market when conditions permit. 14 ILB WBIT PRB Arch’s thermal portfolio is anchored by the Black Thunder mine, which is one of the world’s largest mines and which boasts the highest - Btu coal in the basin.

Investor Presentation 15 Arch’s thermal franchise historically has been a powerful free cash generator EBITDA VERSUS CAPEX FOR THERMAL SEGMENTS SINCE EMERGENCE (in millions) EBITDA CAPEX $693* $100 PROJECTED THERMAL SEGMENT MAINTENANCE CAPEX IN 2020 (in millions) Leer South Growth ~80% Metallurgical Maintenance ~15% Thermal Maintenance ~5% * Represents segment - level EBITDA, which does not include corporate or other unallocated costs Arch is using cash generated by the thermal segments to fund metallurgical growth and enhance its financial position 7x Thermal segment - level EBITDA has exceeded CapEx nearly seven - fold since emergence

Investor Presentation Arch’s Deep Commitment to ESG Principles 16 GLOBAL

Investor Presentation 17 Iron ore and metallurgical coal are essential companions in the production of new steel That new steel is critical to the construction of a new economy ▪ Such steel is required for mass transit systems, wind turbines and electric vehicles, as well as continued urbanization Metallurgical coal will be needed for the production of new steel through at least mid - century, according to most forecasts Arch’s metallurgical products are essential to the production of new steel, which — in turn — is essential to the construction of a new economy
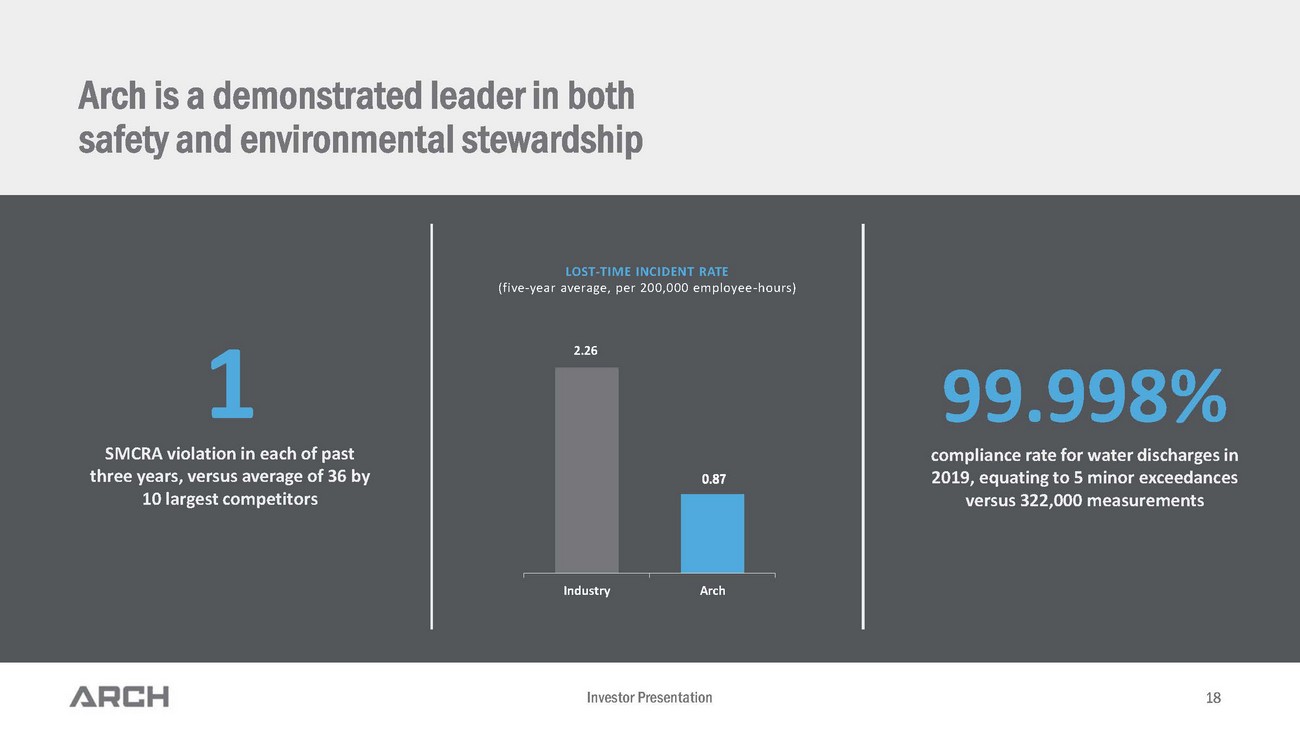
Investor Presentation 18 Arch is a demonstrated leader in both safety and environmental stewardship LOST - TIME INCIDENT RATE (five - year average, per 200,000 employee - hours) 99.998% compliance rate for water discharges in 2019, equating to 5 minor exceedances versus 322,000 measurements SMCRA violation in each of past three years, versus average of 36 by 10 largest competitors 1 2.26 0.87 Industry Arch

Investor Presentation Strong Financial Position and Capital Allocation Priorities 19 FINANCE

Investor Presentation $234 $ 87 $323 $234 $360 Cash Debt 20 EBITDA CONTRIBUTION BY SEGMENT (in millions $, for full year 2019) ARCH CASH AND DEBT POSITION (in millions $, at 3/31/20) LIQUIDITY (in millions $, at 3/31/20) 69% Metallurgica l 22% PRB 9% Other Thermal $457 million in operational EBITDA $129 million net debt Cash Availability Other Source: Internal Arch has a competitive operating portfolio anchored by its metallurgical segment, a strong balance sheet and ample liquidity to weather the current global downturn

Investor Presentation 21 NET DEBT (at 3/31/20 for ARCH and all peers except at 12/31/19 for Peer 3, in millions of dollars) Debt and liquidity Arch has the industry’s strongest balance sheet, and is sharply focused on maintaining its advantaged financial position ▪ Arch’s approximately $300 million term loan has a coupon of L+275 — a level significantly lower than its industry peers ▪ Arch recently added $54 million in equipment financing — at an average rate of 6.3 percent — to facilitate the buildout of Leer South during the global economic slowdown ▪ Arch expects to augment 2020 cash flows with around $100 million in land settlement and insurance proceeds, as well as AMT - related recoveries and the CARES - driven deferral of certain payroll taxes ▪ The startup of Leer South in the third quarter of 2021 should boost Arch’s cash - generating capabilities significantly, across a wide range of market conditions $1 … $148 $452 $606 $634 $786 Arch Peer 1 Peer 2 Peer 3 Peer 4 Peer 5 Source: Arch and company filings Peer group includes Alliance, Consol , Contura , Peabody and Warrior (listed here alphabetically)

Investor Presentation Projected Free Cash Growth Capital Capital Returns EBITDA Arch continuously evaluates which avenues provide the best risk - adjusted returns 22 CapEx / Interest Expense / Taxes Special Dividends Organic Growth M&A Share Buybacks Recurring Dividends ▪ Attractive mechanism while stock is deemed a good value ▪ Currently suspended in light of market uncertainty ▪ View as important component of long - run value proposition ▪ Leer South is a world - class growth opportunity with a compelling payback profile ▪ With ~ 150 million tons of undeveloped reserves post Leer South, Tygart reserve base will continue to provide an attractive long - term growth story ▪ Limited availability to “average up” existing coking coal portfolio ▪ “Diamonds in rough” few and far between ▪ Prospects screened against organic opportunities ▪ The more systematic “share buyback” approach has been favored in recent years minus equals

Investor Presentation 23 CHANGE IN SHARES OUTSTANDING (in millions) $ 302 $ 282 $245 $ … $ 31 $30 $8 2017 2018 2019 2020 $32 7 $31 3 $27 5 Buybacks Dividends million shares outstanding at 3/31/20 15.1 10.1 million shares repurchased since May 2017 Arch bought back 40% of its shares outstanding over a period of less than three years million returned to shareholders (at 3/31/20) before suspending capital return program in April 2020 $92 1 CAPITAL RETURNED TO SHAREHOLDERS (in millions) Arch returned $913 million of capital to shareholders in less than three years before suspending its return program in the wake of the global health crisis

Investor Presentation Overview of Global Metallurgical Markets 24 GLOBAL

Investor Presentation 25 1,650 1,786 1,848 1,930 2017 2018 2019 2025F TOTAL GLOBAL STEEL PRODUCTION (in millions) PROJECTED GLOBAL GDP CONTRACTION IN 2020, PER IMF (3% - 6 %) 65 60 75 62 China India COKING COAL IMPORTS 2018 2019 Prior to the current health crisis, the consensus view was that global steel demand would grow by ~ 1 percent annually throug h 2 025 The projected decline in global GDP is likely to take a significant toll on steel production and consumption in 2020 We expect relatively stable Chinese metallurgical imports and a resumption of growth in Indian imports by 2021 Supply rationalization should serve to counterbalance some of the recent demand destruction Source: World Steel Association, Wood Mackenzie, China Customs Data The global lockdown has injected significant uncertainty into global steel markets

Investor Presentation China We expect China to resume importing significant volumes of seaborne coking coal as the global economy recovers and even after Chinese hot metal production reaches a peak ▪ Roughly two thirds of Chinese steel production is located in coastal provinces , where seaborne moves may have a logistical advantage ▪ Nearly 100 million tons of steel output is in southern coastal provinces, where that advantage is even more pronounced ▪ As China emphasizes producing more steel from fewer mills, high - quality coking coal imports should become increasingly valued ▪ The cost curve for Chinese coking coal continues to shift up and to the right 26 Source: Internal

Investor Presentation 27 While the global health crisis is expected to delay its plans, India is still expected to become the world’s largest importer of coking coal in the near future ▪ Indian coking coal imports are up nearly 70 percent since 2013 ▪ Indian steel producers plan to add 42 million metric tons of hot metal capacity by 2023 — increasing the installed base by 50 percent ▪ The Indian government is targeting 300 million metric tons of steel mill capacity by 2030, which — while aspirational — suggests strong growth nonetheless ▪ Given poor quality of indigenous coals, nearly all of the increase in coking coal demand will need to be imported India INDIAN COKING COAL IMPORTS (in millions of metric tons) 2013 2014 2015 2016 2017 2018 2019 45 50 53 48 37 60 Source: CRU, IHS, Internal 62
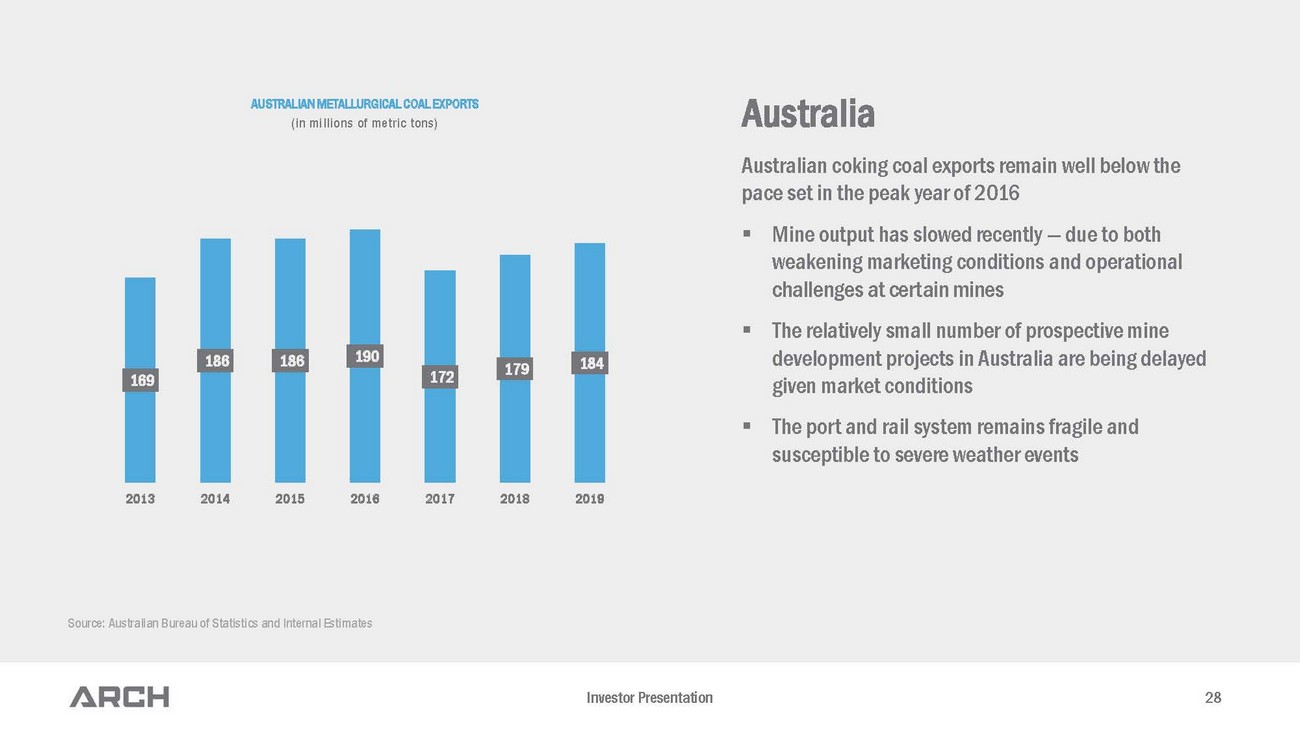
Investor Presentation 28 Australian coking coal exports remain well below the pace set in the peak year of 2016 ▪ Mine output has slowed recently — due to both weakening marketing conditions and operational challenges at certain mines ▪ The relatively small number of prospective mine development projects in Australia are being delayed given market conditions ▪ The port and rail system remains fragile and susceptible to severe weather events AUSTRALIAN METALLURGICAL COAL EXPORTS (in millions of metric tons) Source: Australian Bureau of Statistics and Internal Estimates 169 186 186 190 172 179 184 2013 2014 2015 2016 2017 2018 2019 Australia

Investor Presentation 2018 2019 2020 ESTIMATED AND PROJECTED U.S. METALLURGICAL PRODUCTION (in millions of tons) 29 Supply Rationalization While global metallurgical markets are oversupplied at present, high - cost production is exiting the market, particularly in North America ▪ In mid - April, more than 50 percent of U.S. metallurgical supply was idle ▪ Some mines have restarted, but other closures are likely to prove permanent ▪ While rationalization is most pronounced in North America, supply is under pressure in other regions as well ▪ In Australia, expansion projects are being re - evaluated and pushed out, which could help support a healthy supply/demand balance in out years 80 74 Mid - 60s 2018 2019 2020
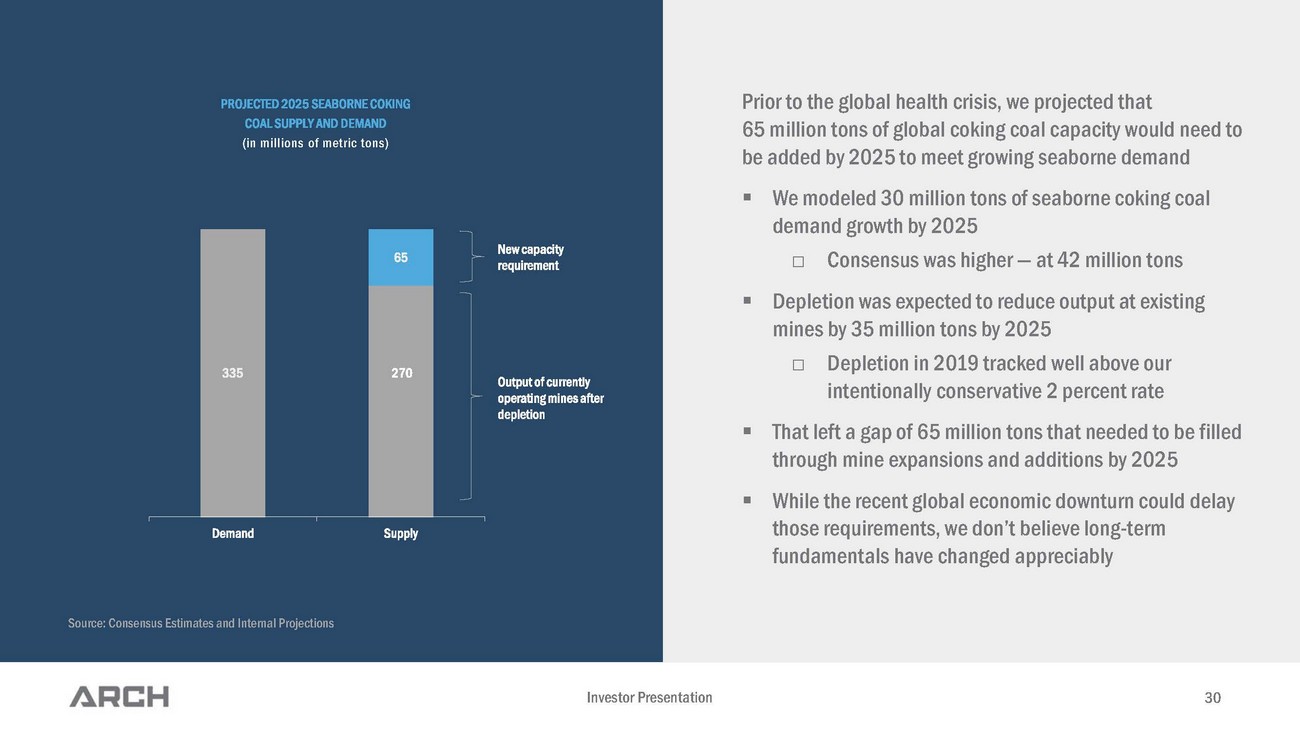
Investor Presentation 30 Prior to the global health crisis, we projected that 65 million tons of global coking coal capacity would need to be added by 2025 to meet growing seaborne demand ▪ We modeled 30 million tons of seaborne coking coal demand growth by 2025 □ Consensus was higher — at 42 million tons ▪ Depletion was expected to reduce output at existing mines by 35 million tons by 2025 □ Depletion in 2019 tracked well above our intentionally conservative 2 percent rate ▪ That left a gap of 65 million tons that needed to be filled through mine expansions and additions by 2025 ▪ While the recent global economic downturn could delay those requirements, we don’t believe long - term fundamentals have changed appreciably PROJECTED 2025 SEABORNE COKING COAL SUPPLY AND DEMAND (in millions of metric tons) Source: Consensus Estimates and Internal Projections Demand Supply Output of currently operating mines after depletion New capacity requirement 335 270 65

Investor Presentation 31 Long - run pricing While prices have pulled back significantly in recent months, the past 17 years suggest that higher pricing levels will be required to keep the global metallurgical market balanced ▪ The Queensland Premium HCC price has averaged $175 per metric ton on an inflation - adjusted basis since 2003 ▪ Since 2010, the average price has been $193 per metric ton ▪ We expect volatility to continue, but with an upward bias as mining costs increase over time due to reserve degradation and depletion ANNUAL AVERAGE HARD COKING COAL PRICE ($ per metric ton) Source: Bloomberg, Public Information, BLS, Internal $0 $50 $100 $150 $200 $250 $300 $350 2003 2004 2005 2006 2007 2008 2009 2010 2011 2012 2013 2014 2015 2016 2017 2018 2019 2018 USD$ Mean Price 2010-2019 Mean Price 2003-2019

Investor Presentation Highlights Premier U.S. metallurgical producer with low - cost, high - quality, long - lived asset base Large - scale, first - quartile metallurgical franchise anchored by world - class Leer longwall mine Leading global producer of High - Vol A products that earn a premium in the marketplace Metallurgical segment serves a diverse, highly - rated customer base across the globe Startup of the world - class Leer South mine will enhance cash - generating capabilities throughout cycle Competitive thermal franchise — anchored by large - scale Black Thunder mine — contributes robust free cash flow Strong balance sheet with low leverage, no near - term debt maturities, and significant liquidity Experienced management team with focus on safety, environmental stewardship, operational excellence and fiscal prudence 32
Investor Presentation Investor Presentation 33 MAY 15, 2020

Investor Presentation Reconciliation of Non - GAAP measures Included in this presentation, we have disclosed certain non - GAAP measures as defined by Regulation G . The following reconciles these items to net income and cash flows as reported under GAAP . Adjusted EBITDA is defined as net income attributable to the Company before the effect of net interest expense, income taxes, depreciation, depletion and amortization, accretion on asset retirement obligations, amortization of sales contracts and non - operating expenses . Adjusted EBITDA may also be adjusted for items that may not reflect the trend of future results by excluding transactions that are not indicative of the Company's core operating performance . Adjusted EBITDA is not a measure of financial performance in accordance with generally accepted accounting principles, and items excluded from Adjusted EBITDA are significant in understanding and assessing our financial condition . Therefore, Adjusted EBITDA should not be considered in isolation, nor as an alternative to net income, income from operations, cash flows from operations or as a measure of our profitability, liquidity or performance under generally accepted accounting principles . The Company uses adjusted EBITDA to measure the operating performance of its segments and allocate resources to the segments . Furthermore, analogous measures are used by industry analysts and investors to evaluate our operating performance . Investors should be aware that our presentation of Adjusted EBITDA may not be comparable to similarly titled measures used by other companies . The table below shows how we calculate Adjusted EBITDA . 34 Quarter Ended March 31, 2020 Year Ended December 31, 2019 Year Ended December 31, 2018 Year Ended December 31, 2017 Period from October 2 through December 31, 2016 (In thousands) Net income (loss) (25,299)$ 233,799$ 312,577$ 238,450$ 33,449$ Income tax (benefit) provision (1,791) 248 (52,476) (35,255) 1,156 Interest expense, net 2,129 6,794 13,689 24,256 10,754 Depreciation, depletion and amortization 31,308 112,055 119,563 122,464 32,605 Accretion on asset retirement obligations 5,006 20,548 27,970 30,209 7,633 Amortization of sales contracts, net - (434) 11,107 53,985 796 Loss on sale of Coal-Mac LLC - 9,008 - - - Loss (gain) on sale of Lone Mountain Processing, Inc. - 4,304 - (21,297) - Net loss resulting from early retirement of debt and debt restructuring - - 485 2,547 - Non-service related postretirement benefit costs 1,096 2,053 3,202 1,940 (32) Reorganization items, net (26) (24) 1,661 2,398 759 Costs associated with proposed joint venture with Peabody Energy 3,664 13,816 - - - Preference Rights Lease Application settlement income - (39,000) - - - Severance costs related to voluntary separation plan 5,828 - - - - Gain on property insurance recovery related to longwall equipment (9,000) - - - - Fresh start coal inventory fair value adjustment - - - - 7,345 Adjusted EBITDA 12,915 363,167 437,778 419,697 94,465 EBITDA from idled or otherwise disposed operations 5,099 12,926 2,492 3,253 1,596 Selling, general and administrative expenses 22,745 95,781 100,300 87,952 23,193 Other 59 (14,488) 4,099 (6,398) (1,511) Reported segment Adjusted EBITDA from coal operations 40,818$ 457,386$ 544,669$ 504,504$ 117,743$ Segment Adjusted EBITDA PRB MET Other Thermal Corporate and Other Consolidated (In Thousands) Quarter Ended March 31, 2020 (582)$ 42,720$ (1,320)$ (27,903)$ 12,915$ Year Ended December 31, 2019 110,528 305,363 41,495 (94,219) 363,167 Year Ended December 31, 2018 126,525 349,524 68,620 (106,891) 437,778 Year Ended December 31, 2017 158,882 243,616 102,006 (84,807) 419,697 October 2 through December 31, 2016 55,765 30,819 31,159 (23,278) 94,465 Since Emergence 451,118$ 972,042$ 241,960$ (337,098)$ 1,328,022$

Investor Presentation Reconciliation of Non - GAAP measures 35 The Company is unable to present a quantitative reconciliation of its forward - looking non - GAAP Segment cash cost per ton sold financial measures to the most directly comparable GAAP measures without unreasonable efforts due to the inherent difficulty in forecasting and quantifying with reasonable accuracy significant items required for the reconciliation . The most directly comparable GAAP measure, GAAP cost of sales, is not accessible without unreasonable efforts on a forward - looking basis . The reconciling items for this non - GAAP measure are transportation costs, which are a component of GAAP revenues and cost of sales ; the impact of hedging activity related to commodity purchases that do not receive hedge accounting ; and idle and administrative costs that are not included in a reportable segment . Management is unable to predict without unreasonable efforts transportation costs due to uncertainty as to the end market and FOB point for uncommitted sales volumes and the final shipping point for export shipments . Management is unable to predict without unreasonable efforts the impact of hedging activity related to commodity purchases that do not receive hedge accounting due to fluctuations in commodity prices, which are difficult to forecast due to their inherent volatility . These amounts have historically and may continue to vary significantly from quarter to quarter and material changes to these items could have a significant effect on our future GAAP results . Idle and administrative costs that are not included in a reportable segment are expected to be between $ 15 million and $ 20 million in 2019 .