Attached files
| file | filename |
|---|---|
| EX-99.1 - EX-99.1 - Stonemor Inc. | ston-ex991_6.htm |
| 8-K - 8-K - Stonemor Inc. | ston-8k_20200514.htm |

1Q’20 Earnings May 14, 2020 EXHIBIT 99.2
Cautionary Note Regarding Forward-Looking Statements Certain statements contained in this press release, including, but not limited to, information regarding continued implementation of the Company’s performance and cost structure improvement efforts and the anticipated financial impact thereof, are forward-looking statements. Generally, the words “believe,” “may,” “will,” “estimate,” “continue,” “anticipate,” “intend,” “project,” “expect,” “predict” and similar expressions identify these forward-looking statements. These statements are made pursuant to the safe harbor provisions of the Private Securities Litigation Reform Act of 1995. Forward-looking statements are based on management’s current expectations and estimates. These statements are neither promises nor guarantees and are made subject to certain risks and uncertainties that could cause actual results to differ materially from the results stated or implied in this press release. StoneMor’s major risks are related to uncertainties associated with current business and economic disruptions resulting from the recent coronavirus pandemic, including the effect of government regulations issued in connection therewith, its ability to identify, and negotiate acceptable agreements with, purchasers of additional properties, uncertainties associated with the cash flow from pre-need and at-need sales, trusts and financings, which may impact StoneMor’s ability to meet its financial projections and service its debt, as well as with StoneMor’s ability to maintain an effective system of internal control over financial reporting and disclosure controls and procedures. When considering forward-looking statements, you should keep in mind the risk factors and other cautionary statements set forth in StoneMor’s Annual Report on Form 10-K and Quarterly Reports on Form 10-Q and the other reports that StoneMor files with the Securities and Exchange Commission, from time to time. Except as required under applicable law, StoneMor assumes no obligation to update or revise any forward-looking statements made herein or any other forward-looking statements made by it, whether as a result of new information, future events or otherwise. This release includes certain non-GAAP financial measures, including adjusted operating income, adjusted EBITDA and adjusted cash from operations, which are intended as supplemental measures of the Company’s performance that are not required by or presented in accordance with GAAP. All business results presented in this release are not prepared in accordance with Article 11 of Regulation S-X. Management uses these non-GAAP measures internally to evaluate and manage the Company’s operations and to better understand its business because they facilitate a comparative assessment of the Company's operating performance relative to its performance based on results calculated under GAAP. These non-GAAP measures also isolate the effects of some items that vary from period to period without any correlation to core operating performance and eliminate certain charges that management believes do not reflect the Company's operations and underlying operational performance. The compensation committee of the Company’s board of directors also uses certain of these measures to evaluate management's performance and set its compensation. The Company believes that these non-GAAP measures also provide useful information to investors regarding certain financial and business trends relating to the Company’s financial condition and operating results facilitates an evaluation of the financial performance of the Company and its operations on a consistent basis. Providing this information therefore allows investors to make independent assessments of the Company’s financial performance, results of operation and trends while viewing the information through the eyes of management. These non-GAAP measures are subject to limitations. The non-GAAP measures presented in this release may not be comparable to similarly titled measures used by other companies because other companies may not calculate one or more in the same manner. Additionally, the non-GAAP performance measures exclude significant expenses and income that are required by GAAP to be recorded in the Company’s financial statements; do not reflect changes in, or cash requirements for, working capital needs; and do not reflect interest expense, or the requirements necessary to service interest or principal payments on debt. Further, our historical adjusted results are not intended to project our adjusted results of operations or financial position for any future period. To compensate for these limitations, management presents and considers these non-GAAP measures in conjunction with the Company’s GAAP results; no non-GAAP measure should be considered in isolation from or as alternatives to net income, earnings per share or any other measure determined in accordance with GAAP. Readers should review the reconciliations included below, and should not rely on any single financial measure to evaluate the Company’s business. A reconciliation of each non-GAAP measure to the most directly comparable GAAP measure is set forth in the Appendix. Non-GAAP Financial Measures
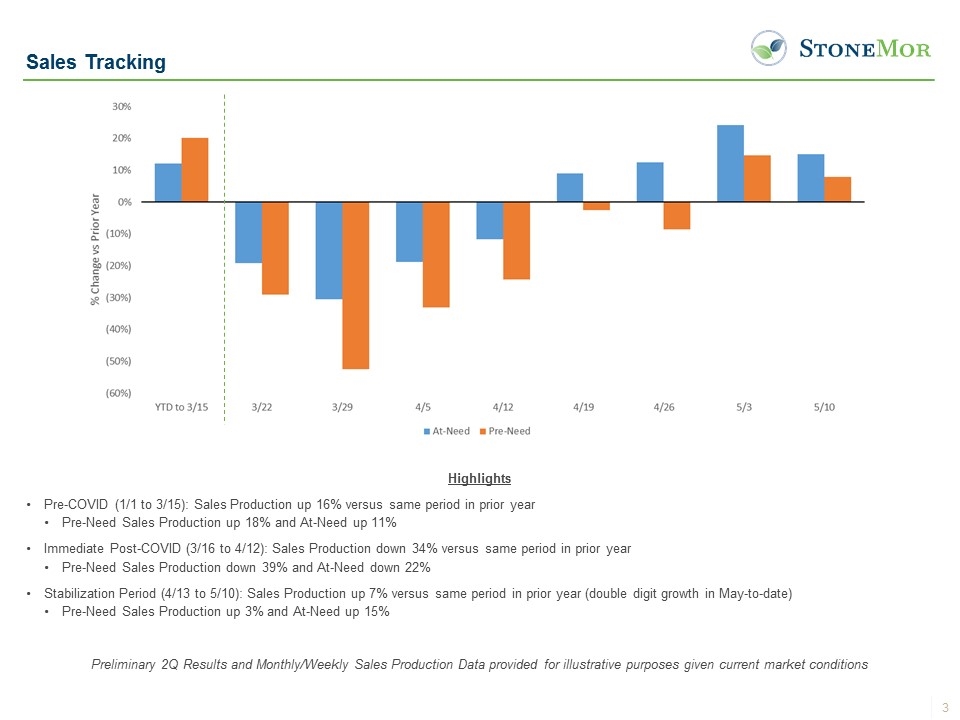
Sales Tracking Highlights Pre-COVID (1/1 to 3/15): Sales Production up 16% versus same period in prior year Pre-Need Sales Production up 18% and At-Need up 11% Immediate Post-COVID (3/16 to 4/12): Sales Production down 34% versus same period in prior year Pre-Need Sales Production down 39% and At-Need down 22% Stabilization Period (4/13 to 5/10): Sales Production up 7% versus same period in prior year (double digit growth in May-to-date) Pre-Need Sales Production up 3% and At-Need up 15% Preliminary 2Q Results and Monthly/Weekly Sales Production Data provided for illustrative purposes given current market conditions
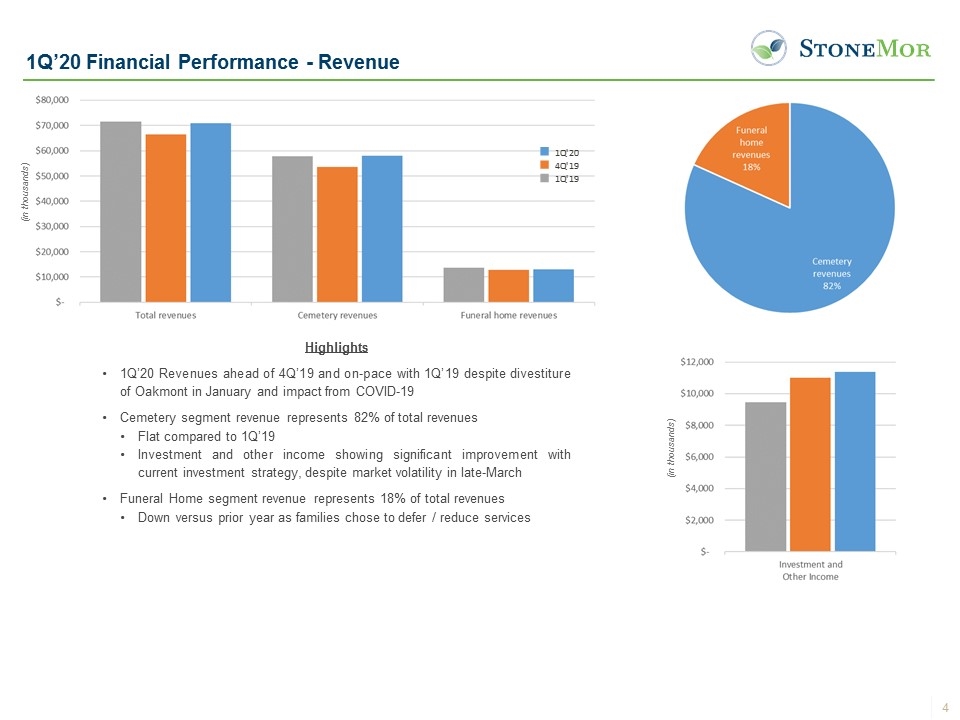
1Q’20 Financial Performance - Revenue Highlights 1Q’20 Revenues ahead of 4Q’19 and on-pace with 1Q’19 despite divestiture of Oakmont in January and impact from COVID-19 Cemetery segment revenue represents 82% of total revenues Flat compared to 1Q’19 Investment and other income showing significant improvement with current investment strategy, despite market volatility in late-March Funeral Home segment revenue represents 18% of total revenues Down versus prior year as families chose to defer / reduce services (in thousands) (in thousands)
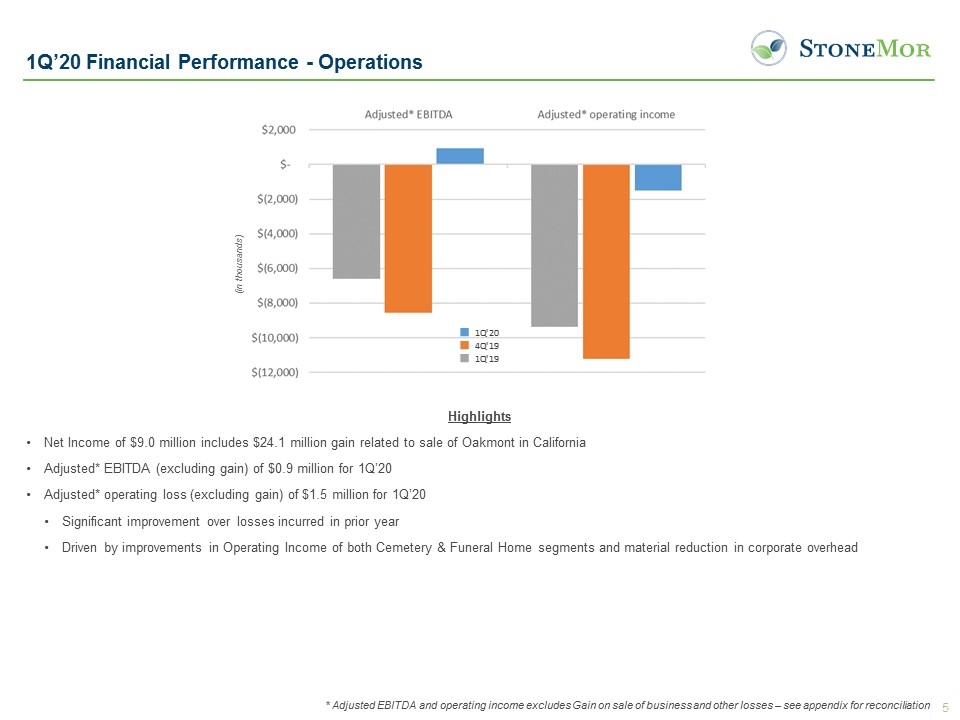
1Q’20 Financial Performance - Operations Highlights Net Income of $9.0 million includes $24.1 million gain related to sale of Oakmont in California Adjusted* EBITDA (excluding gain) of $0.9 million for 1Q’20 Adjusted* operating loss (excluding gain) of $1.5 million for 1Q’20 Significant improvement over losses incurred in prior year Driven by improvements in Operating Income of both Cemetery & Funeral Home segments and material reduction in corporate overhead * Adjusted EBITDA and operating income excludes Gain on sale of business and other losses – see appendix for reconciliation (in thousands)
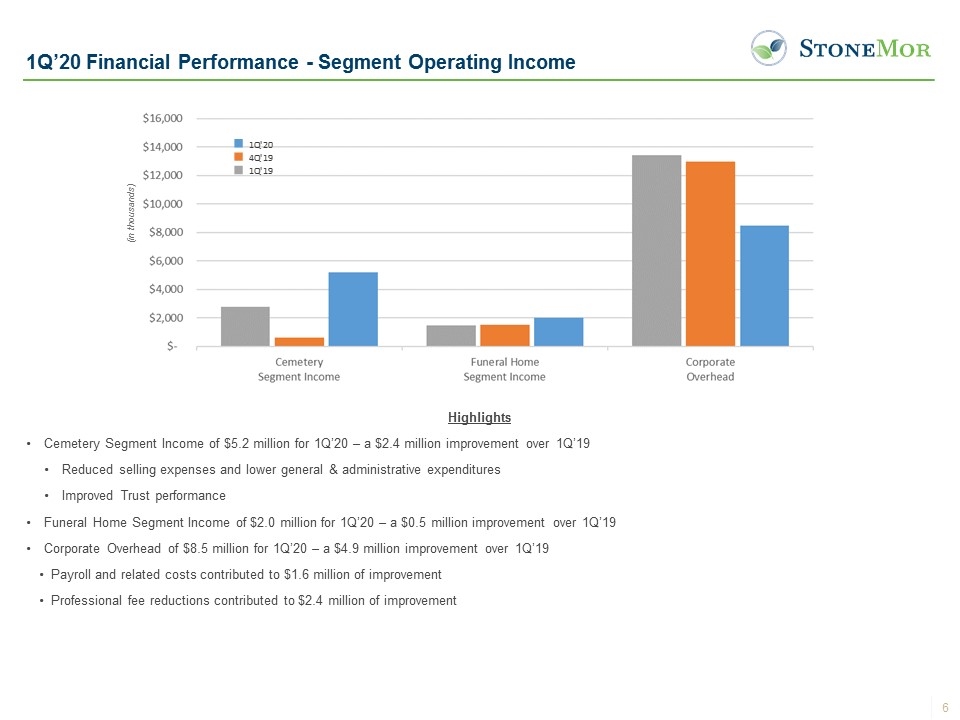
1Q’20 Financial Performance - Segment Operating Income Highlights Cemetery Segment Income of $5.2 million for 1Q’20 – a $2.4 million improvement over 1Q’19 Reduced selling expenses and lower general & administrative expenditures Improved Trust performance Funeral Home Segment Income of $2.0 million for 1Q’20 – a $0.5 million improvement over 1Q’19 Corporate Overhead of $8.5 million for 1Q’20 – a $4.9 million improvement over 1Q’19 Payroll and related costs contributed to $1.6 million of improvement Professional fee reductions contributed to $2.4 million of improvement (in thousands)
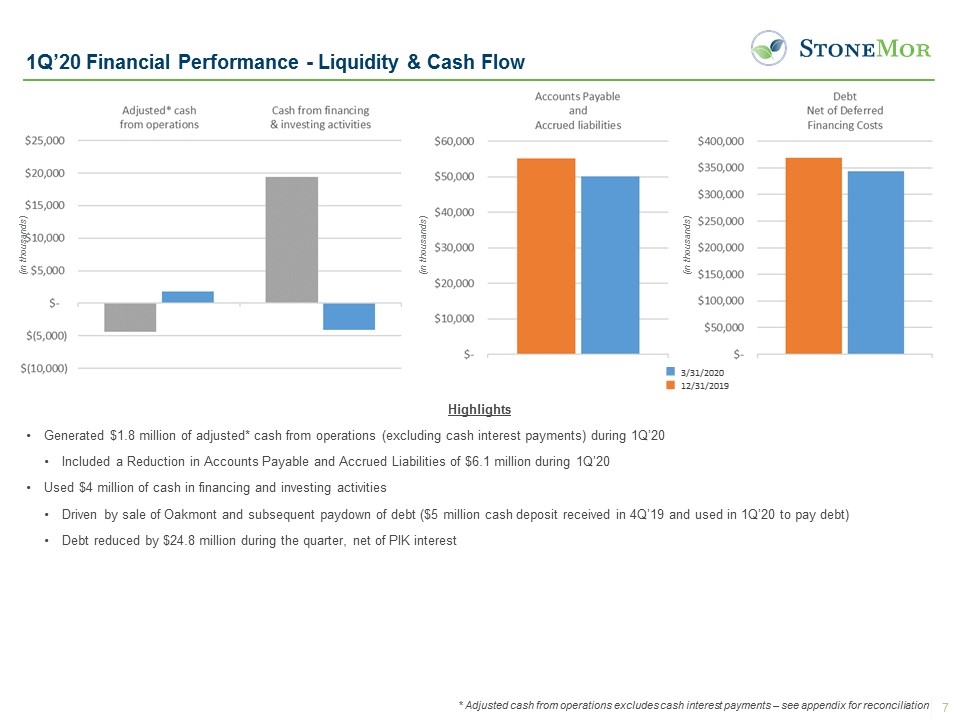
1Q’20 Financial Performance - Liquidity & Cash Flow Highlights Generated $1.8 million of adjusted* cash from operations (excluding cash interest payments) during 1Q’20 Included a Reduction in Accounts Payable and Accrued Liabilities of $6.1 million during 1Q’20 Used $4 million of cash in financing and investing activities Driven by sale of Oakmont and subsequent paydown of debt ($5 million cash deposit received in 4Q’19 and used in 1Q’20 to pay debt) Debt reduced by $24.8 million during the quarter, net of PIK interest * Adjusted cash from operations excludes cash interest payments – see appendix for reconciliation (in thousands) (in thousands) (in thousands)
Appendix: Non-GAAP Financial Measures
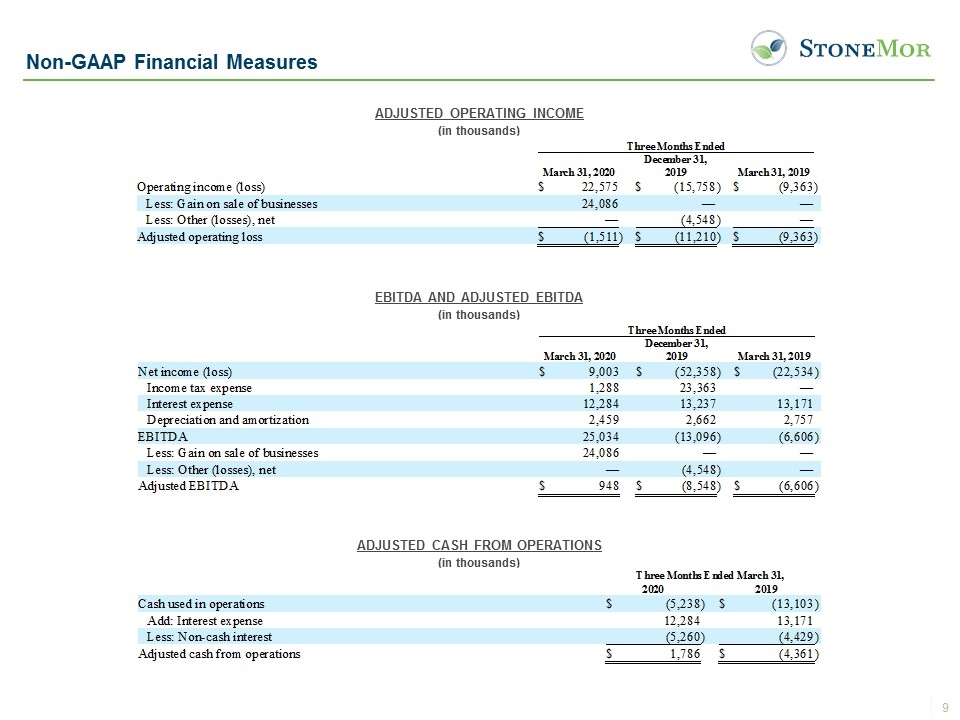
Non-GAAP Financial Measures ADJUSTED OPERATING INCOME (in thousands) EBITDA AND ADJUSTED EBITDA (in thousands) ADJUSTED CASH FROM OPERATIONS (in thousands)

