Attached files
| file | filename |
|---|---|
| 8-K - 8-K - IZEA Worldwide, Inc. | a8-k20200514.htm |
EXHIBIT 99.1
IZEA Reports Q1 2020 Financial Results
ORLANDO, FL (May 14, 2020) - IZEA Worldwide, Inc. (NASDAQ: IZEA), the premier provider of influencer marketing technology, data, and services for the world’s leading brands, reported its financial and operational results for the first quarter ended March 31, 2020.
Q1 2020 Financial Summary Compared to Q1 2019
• | Total revenue was the same at $4.8 million in each quarter. |
• | Managed Services revenue increased 7% to $4.1 million, compared to $3.9 million. |
• | SaaS Services revenue decreased 36% to $583,000, compared to $913,000. |
• | Total Gross Billings* decreased 22% to $6.1 million, compared to $7.8 million. |
• | Total costs and expenses were $10.9 million, compared to $6.5 million. Increase driven by a $4.3 million impairment of goodwill in Q1 2020. |
• | Net loss was $6.2 million, compared to a net loss of $1.8 million. |
• | Adjusted EBITDA* was $(1.2) million, compared to ($874,000). |
Q1 2020 Operational Highlights
• | Completed TapInfluence platform integration |
• | Launched BrandGraphÆ social intelligence platform |
• | Executed managerial and departmental restructuring along with other cost cutting initiatives |
* Total Gross Billings and Adjusted EBITDA are non-GAAP financial measures. Refer to the definitions and reconciliations of these measures under “Use of Non-GAAP Financial Measures”.
Management Commentary
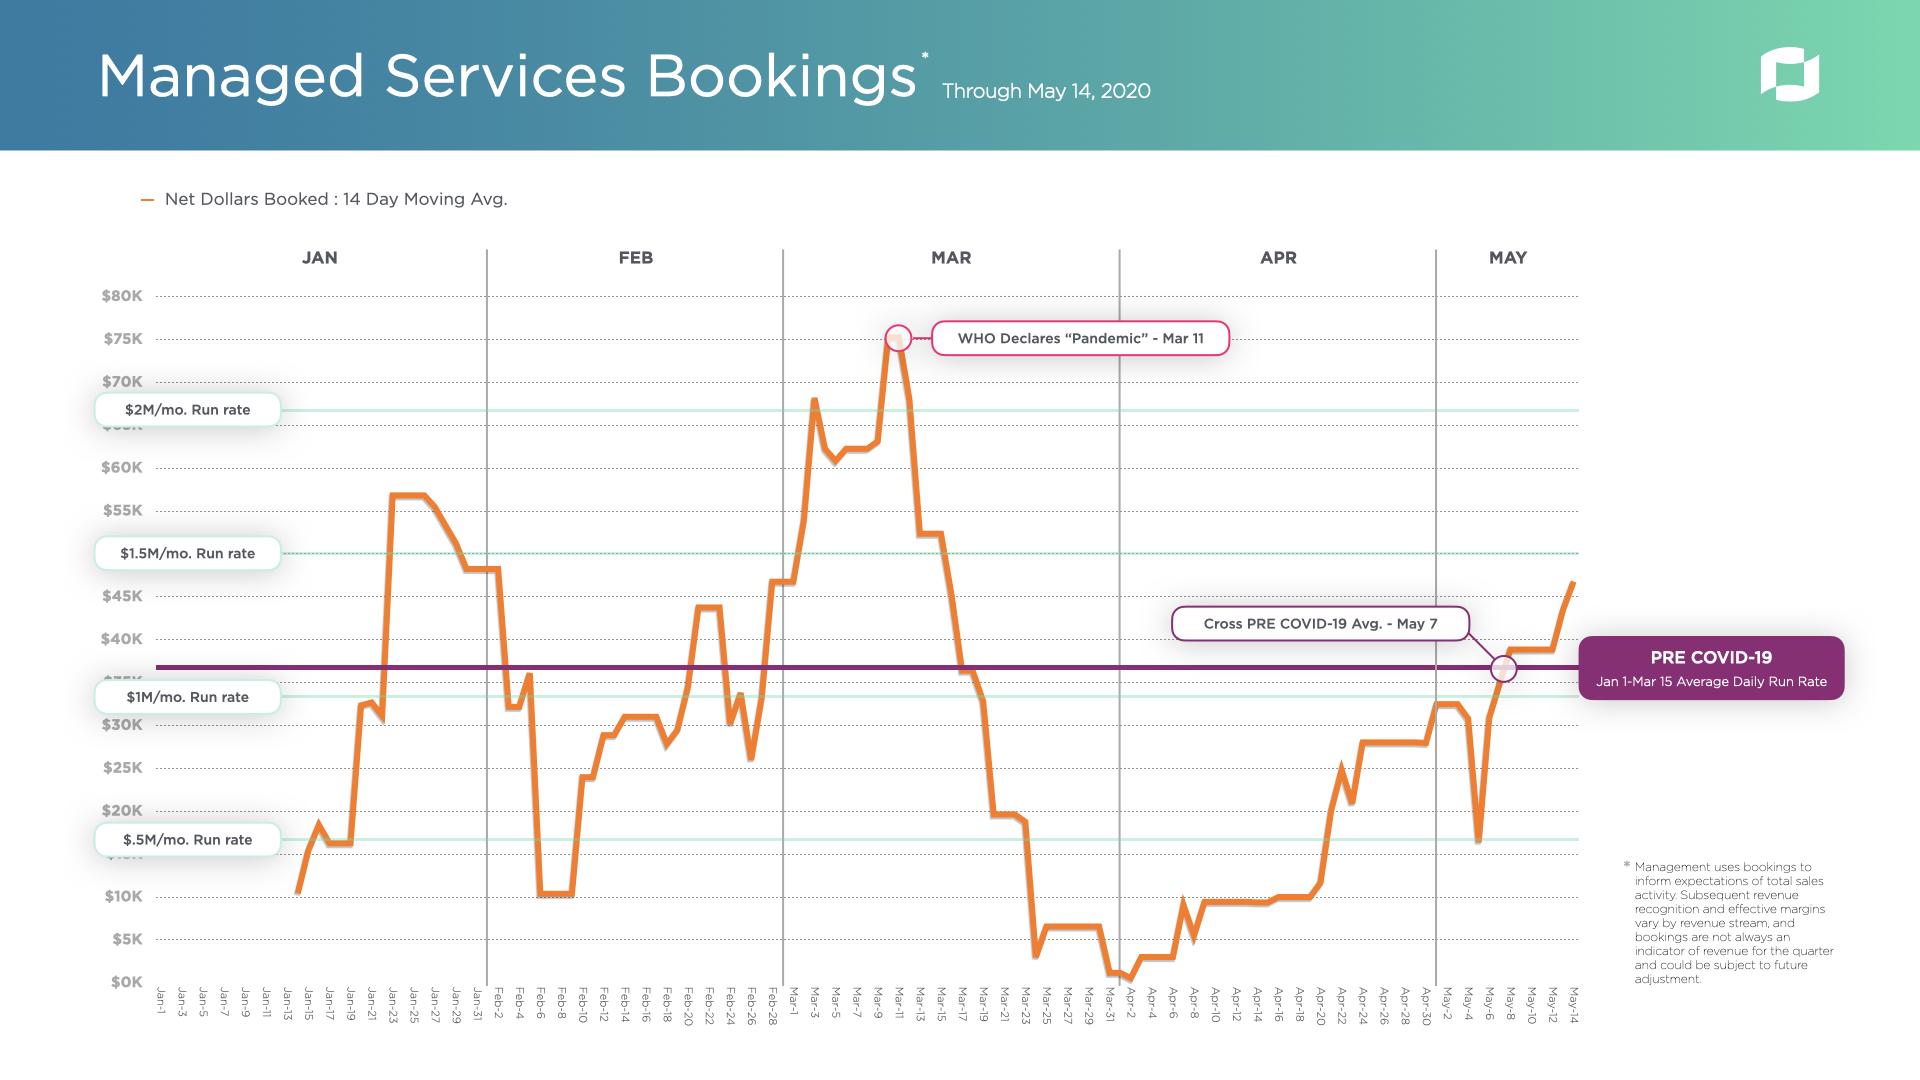
“In the weeks leading up to the issuance of stay-at-home orders being issued across the country due to COVID-19, our team had really hit its stride on both sides of the business,” said Ted Murphy, IZEA’s Chairman and CEO. “We saw strong bookings in Managed Services and had record new SaaS customer starts on IZEAx Unity Suite in Q1. For the six weeks following March 13th, we noted declines in new business sales, with the 14-day average run rate trendline for Managed Services bookings bottoming out at the end of March.”
“In mid-April, we began to see a remarkable resurgence of bookings due to the hard work and perseverance of our team. I have never been prouder of this organization and what we have been able to accomplish in one of the most challenging business environments imaginable. As of today, the 14-day average bookings trendline is now above our 14-day Pre COVID-19 average and we are gaining momentum.”
“We are still digging out from the overall decline in SaaS licensing and marketplace revenue related to TapInfluence customer churn and lower marketplace spend levels from remaining customers, but our software customer foundation built upon IZEAx appears to be strong,” continued Murphy. “Monthly recurring revenue from IZEAx hit a new all-time high in March 2020, with renewals from many key customer accounts. However, SaaS sales attributable to new customers post March 13th have been much slower to rebound than Managed Services, primarily due to a high concentration of opportunities related to negatively-impacted sectors that were in the pipeline prior to stay-at-home orders going into effect. Many of those customers will remain on hold until such time that those sectors begin to recover. We have been diligently rebuilding the pipeline with customers less impacted by COVID-19 and our 14-day average trendline for daily software demos hit an all-time record last week.”
“This is a rapidly evolving macro environment and we cannot assure that this momentum will continue. Our team must remain focused and continue to make adjustments in order to dig out from the setback related to the COVID-19 crisis. I believe that IZEA’s products and services are well-aligned for the current consumer environment and I am cautiously optimistic for the months ahead.”
COVID-19 Adjustments to Operations
IZEA was already in a process of optimizing our operating expenses prior to the COVID-19 outbreak. We have seen a material decrease in costs as a result of these measures and expect to reflect those costs savings in Q2.
Some of the immediate measures we have already taken include:
• | Reduction of employee salaries by 19-21% at all levels of the organization |
• | Reduction or elimination of certain employee fringe benefits |
• | New employee hiring freeze and part-time employee furloughs |
• | Reduction or elimination of contractors and vendors |
• | Freeze on all travel and entertainment expenses |
• | Reduction and shift in marketing spend |
• | Non-renewal of expiring leases for office locations in Florida, California and Canada |
In addition to cost control measures, we have proactively bolstered our available cash by tapping a portion of our credit line using qualified receivables. IZEA also received a loan of $1.9 million from Western Alliance Bank under the Paycheck Protection Program to help sustain its payroll during this time.
Q1 2020 Financial Results
Total revenue in the first quarter was flat year over year at $4.8 million, with revenue from Managed Services increasing 7% to $4.1 million in the first quarter of 2020 from $3.9 million in the first quarter of 2019. Revenue from SaaS Services decreased to $583,000 in the first quarter of 2020 compared to $913,000 compared to the same period in 2019. Revenue from Managed Services increased as a result of increased bookings in the second half of 2019 that led to increased revenues in Q1 2020. Revenue from SaaS Services decreased primarily as a result of lower spend levels from our SaaS marketers and as a result of competitive pricing efforts which reduced our margins on those spends. Our SaaS marketers decreased their spend levels as they transitioned from the TapInfluence platform to IZEAx and curtailed spending in March 2020 as a result of COVID-19.
Total costs and expenses in the first quarter of 2020 were $10.9 million compared to $6.5 million in the corresponding quarter of 2019. This increase was primarily due to a $4.3 million impairment of goodwill recorded in the first quarter of 2020, reduced by a loss of $191,000, associated with our first quarter 2019 settlement on a portion of our accrued acquisition costs.
Net loss in the first quarter of 2020 was $6.2 million or $(0.18) per share, as compared to a net loss of $1.8 million or $(0.15) per share in the first quarter of 2019, based on 34.7 million and 12.6 million shares outstanding, respectively.
Adjusted EBITDA (a non-GAAP measure management uses as a proxy for operating cash flow, as defined below) in the first quarter of 2020 was $(1.2) million compared to ($874,000) in the first quarter of 2019. Adjusted EBITDA as a percentage of revenue in the first quarter of 2020 was negative twenty-five percent (25%) compared to negative eighteen percent (18%) in the first quarter of 2019. The increase in Adjusted EBITDA loss was primarily due to $250,000 less in capitalized expenses related to our internal software build of IZEAx 3.0 and a $73,000 increase in advertising and marketing efforts in the first quarter of 2020 compared to the same period in 2019.
Cash and cash equivalents at March 31, 2020 totaled $5.6 million after we received $1.2 million from our credit facility using our qualifying trade receivables as collateral.
Conference Call
IZEA will hold a conference call to discuss its first quarter 2020 results on Thursday, May 14th at 5:00 p.m. Eastern time. Management will host the call, followed by a question and answer period.
Date: Thursday, May 14, 2020
Time: 5:00 p.m. Eastern time
Toll-free dial-in number: 1-877-300-8521
International dial-in number: 1-412-317-6026
The conference call will be webcast live and available for replay via the investors section of the company’s website at https://izea.com/. Please call the conference telephone number five minutes prior to the start time. An operator
will register your name and organization. A replay of the call will be available after 8:00 p.m. Eastern time on the same day through May 21, 2020.
Toll-free replay number: 1-844-512-2921
International replay number: 1-412-317-6671
Replay ID: 10143761
About IZEA Worldwide, Inc.
IZEA Worldwide, Inc. (“IZEA”) operates online platforms that connect marketers with content creators. IZEA platforms automate influencer marketing and custom content development, allowing brands and agencies to identify social trends, scale their marketing programs and measure their results. IZEA influencers include everyday creators, as well as celebrities and accredited journalists. Creators are compensated for producing unique content such as long and short form text, videos, photos, status updates and illustrations for marketers or distributing such content on behalf of marketers through their personal websites, blogs and social media channels. Marketers receive influential content and engaging, shareable stories that drive awareness. For more information about IZEA, visit https://izea.com/.
Use of Non-GAAP Financial Measures
We define gross billings, a non-GAAP financial measure, as the total dollar value of the amounts earned from our customers for the services we performed, or the amounts charged to our customers for their self-service purchase of goods and services on our platforms. Gross billings for Legacy Workflow and Marketplace Spend (which are included in SaaS Services) differs from revenue for these services reported in our consolidated statements of operations, which is presented net of the amounts we pay to the third-party creators providing the content or sponsorship services. Gross billings for all other revenue equals the revenue reported in our consolidated statements of operations.
We consider this metric to be an important indicator of our performance as it measures the total dollar volume of transactions generated through our marketplaces. Tracking gross billings allows us to monitor the percentage of gross billings that we are able to retain after payments to our creators. Because we invoice our customers on a gross basis, tracking gross billings is critical as it pertains to our credit risk and cash flow.
"EBITDA" is a non-GAAP financial measure under the rules of the Securities and Exchange Commission. EBITDA is commonly defined as "earnings before interest, taxes, depreciation and amortization." IZEA defines “Adjusted EBITDA,” also a non-GAAP financial measure, as earnings or loss before interest, taxes, depreciation and amortization, non-cash stock related compensation, gain or loss on asset disposals or impairment, changes in acquisition cost estimates, and certain other non-cash income and expense items such as gains or losses on settlement of liabilities and exchanges, and changes in fair value of derivatives, if applicable.
We believe that Adjusted EBITDA provides useful information to investors as they exclude transactions not related to the core cash operating business activities including non-cash transactions. We believe that excluding these transactions allows investors to meaningfully trend and analyze the performance of our core cash operations.
All companies do not calculate gross billings and Adjusted EBITDA in the same manner. These metrics as presented by IZEA may not be comparable to those presented by other companies. Moreover, these metrics have limitations as analytical tools, and you should not consider them in isolation or as a substitute for an analysis of our results of operations as reported under GAAP. A reconciliation of GAAP to non-GAAP results is included in the financial tables included in this press release.
Safe Harbor Statement
All statements in this release that are not based on historical fact are “forward-looking statements” intended to qualify for the safe harbor from liability established by the Private Securities Litigation Reform Act of 1995. Forward-looking statements, which are based on certain assumptions and describe our future plans, strategies and expectations, can generally be identified by the use of forward-looking terms such as “may,” “will,” “would,” “could,” “should,” “expects,” “anticipates,” “estimates,” “believes,” “intends,” “likely,” “projects,” “plans,” “pursue," “strategy” or “future,” or the negative of these words or other words or expressions of similar meaning. Examples of forward-
looking statements include, among others, statements we make regarding expectations concerning IZEA’s ability to increase revenue and improve Adjusted EBITDA, expectations with respect to operational efficiency, and expectations concerning IZEA’s business strategy. Forward-looking statements involve inherent risks and uncertainties which could cause actual results to differ materially from those in the forward-looking statements, as a result of various factors including, among others, the following: our ability to raise additional funding needed to fund our business operation in the future, uncertainty relating to the effects of COVID-19, competitive conditions in the content and social sponsorship segment in which IZEA operates; failure to popularize the IZEAx marketplace platform; inability to finance growth initiatives in a timely manner; our ability to satisfy the requirements for continued listing of our common stock on the Nasdaq Capital Market; changing economic conditions that are less favorable than expected; and other risks and uncertainties described in IZEA’s periodic reports filed with the Securities and Exchange Commission. The forward-looking statements made in this release speak only as of the date of this release, and IZEA assumes no obligation to update any such forward-looking statements to reflect actual results or changes in expectations, except as otherwise required by law.
Press Contact
Martin Smith
IZEA Worldwide, Inc.
Phone: 407-674-6911
Email: ir@izea.com
IZEA Worldwide, Inc.
Unaudited Consolidated Balance Sheets
March 31, 2020 | December 31, 2019 | ||||||
Assets | |||||||
Current assets: | |||||||
Cash and cash equivalents | $ | 5,634,441 | $ | 5,884,629 | |||
Accounts receivable, net | 3,977,571 | 5,596,719 | |||||
Prepaid expenses | 423,419 | 400,181 | |||||
Other current assets | 37,097 | 153,031 | |||||
Total current assets | 10,072,528 | 12,034,560 | |||||
Property and equipment, net | 317,154 | 309,780 | |||||
Goodwill | 4,016,722 | 8,316,722 | |||||
Intangible assets, net | 1,246,526 | 1,611,516 | |||||
Software development costs, net | 1,470,334 | 1,519,980 | |||||
Security deposits | 151,184 | 151,803 | |||||
Total assets | $ | 17,274,448 | $ | 23,944,361 | |||
Liabilities and Stockholders’ Equity | |||||||
Current liabilities: | |||||||
Accounts payable | $ | 1,130,791 | $ | 2,252,536 | |||
Accrued expenses | 1,604,588 | 1,377,556 | |||||
Contract liabilities | 5,597,479 | 6,466,766 | |||||
Line of credit | 1,162,924 | — | |||||
Right-of-use liability | — | 83,807 | |||||
Total current liabilities | 9,495,782 | 10,180,665 | |||||
Finance obligation, less current portion | 65,609 | 45,673 | |||||
Total liabilities | 9,561,391 | 10,226,338 | |||||
Commitments and Contingencies | — | — | |||||
Stockholders’ equity: | |||||||
Preferred stock; $.0001 par value; 10,000,000 shares authorized; no shares issued and outstanding | — | — | |||||
Common stock; $.0001 par value; 200,000,000 shares authorized; 34,773,051 and 34,634,172, respectively, issued and outstanding | 3,477 | 3,464 | |||||
Additional paid-in capital | 74,257,810 | 74,099,328 | |||||
Accumulated deficit | (66,548,230 | ) | (60,384,769 | ) | |||
Total stockholders’ equity | 7,713,057 | 13,718,023 | |||||
Total liabilities and stockholders’ equity | $ | 17,274,448 | $ | 23,944,361 | |||
IZEA Worldwide, Inc.
Unaudited Consolidated Statements of Operations
Three Months Ended March 31, | |||||||
2020 | 2019 | ||||||
Revenue | $ | 4,763,668 | $ | 4,793,756 | |||
Costs and expenses: | |||||||
Cost of revenue (exclusive of amortization) | 2,140,517 | 2,099,291 | |||||
Sales and marketing | 1,523,143 | 1,357,667 | |||||
General and administrative | 2,417,838 | 2,612,054 | |||||
Impairment of goodwill | 4,300,000 | — | |||||
Depreciation and amortization | 501,269 | 436,224 | |||||
Total costs and expenses | 10,882,767 | 6,505,236 | |||||
Loss from operations | (6,119,099 | ) | (1,711,480 | ) | |||
Other income (expense): | |||||||
Interest expense | (6,618 | ) | (128,464 | ) | |||
Other income (expense), net | (37,744 | ) | 9,364 | ||||
Total other income (expense), net | (44,362 | ) | (119,100 | ) | |||
Net loss | $ | (6,163,461 | ) | $ | (1,830,580 | ) | |
Weighted average common shares outstanding – basic and diluted | 34,681,198 | 12,575,458 | |||||
Basic and diluted loss per common share | $ | (0.18 | ) | $ | (0.15 | ) | |
Revenue Details:
Three Months Ended March 31, | |||||||||||||||||
2020 | 2019 | $ Change | % Change | ||||||||||||||
Managed Services Revenue | $ | 4,125,061 | 87 | % | $ | 3,867,232 | 81 | % | $ | 257,829 | 7 | % | |||||
Legacy Workflow Fees | — | — | % | 47,330 | 1 | % | (47,330 | ) | (100 | )% | |||||||
Marketplace Spend Fees | 166,293 | 3 | % | 374,653 | 8 | % | (208,360 | ) | (56 | )% | |||||||
License Fees | 416,816 | 9 | % | 491,094 | 10 | % | (74,278 | ) | (15 | )% | |||||||
SaaS Services Revenue | 583,109 | 12 | % | 913,077 | 19 | % | (329,968 | ) | (36 | )% | |||||||
Other Revenue | 55,498 | 1 | % | 13,447 | — | % | 42,051 | 313 | % | ||||||||
Total Revenue | $ | 4,763,668 | 100 | % | $ | 4,793,756 | 100 | % | $ | (30,088 | ) | (1 | )% | ||||
IZEA Worldwide, Inc.
Reconciliation of GAAP Net loss to Non-GAAP Adjusted EBITDA
(Unaudited)
Three Months Ended March 31, | |||||||
2020 | 2019 | ||||||
Net loss | $ | (6,163,461 | ) | $ | (1,830,580 | ) | |
Non-cash stock-based compensation | 129,571 | 160,877 | |||||
Non-cash stock issued for payment of services | 31,250 | 37,498 | |||||
Gain on settlement of acquisition costs payable | — | 191,439 | |||||
Increase (decrease) in value of acquisition costs payable | — | 2,664 | |||||
Interest expense | 6,618 | 128,464 | |||||
Depreciation and amortization | 501,269 | 436,224 | |||||
Impairment on intangible assets | 4,300,000 | — | |||||
Other non-cash items | — | (515 | ) | ||||
Adjusted EBITDA | $ | (1,194,753 | ) | $ | (873,929 | ) | |
Revenue | $ | 4,763,668 | $ | 4,793,856 | |||
Adjusted EBITDA as a % of Revenue | (25)% | (18)% | |||||
IZEA Worldwide, Inc.
Non-GAAP Reconciliations
Reconciliation of GAAP revenue to Non-GAAP gross billings:
Three Months Ended March 31, | |||||||
2020 | 2019 | ||||||
Revenue | $ | 4,763,668 | $ | 4,793,756 | |||
Plus payments made to third-party creators (1) | 1,333,481 | 3,035,463 | |||||
Gross billings | $ | 6,097,149 | $ | 7,829,219 | |||
(1) | Payments made to third-party creators for the Legacy Workflow and Marketplace Spend components of our revenue reported on a net basis for GAAP. |
Gross billings by revenue type as a percentage of revenue and change between the periods:
Three Months Ended March 31, | |||||||||||||||||
2020 | 2019 | $ Change | % Change | ||||||||||||||
Managed Services Gross Billings | $ | 4,125,061 | 68 | % | $ | 3,867,232 | 50 | % | $ | 257,829 | 7 | % | |||||
Legacy Workflow Fees | — | — | % | 654,925 | 8 | % | (654,925 | ) | (100 | )% | |||||||
Marketplace Spend Fees | 1,499,774 | 24 | % | 2,802,521 | 36 | % | (1,302,747 | ) | (46 | )% | |||||||
License Fees | 416,816 | 7 | % | 491,094 | 6 | % | (74,278 | ) | (15 | )% | |||||||
SaaS Services Gross Billings | 1,916,590 | 31 | % | 3,948,540 | 50 | % | (2,031,950 | ) | (51 | )% | |||||||
Other Revenue | 55,498 | 1 | % | 13,447 | — | % | 42,051 | 313 | % | ||||||||
Total Gross Billings | $ | 6,097,149 | 100 | % | $ | 7,829,219 | 100 | % | $ | (1,732,070 | ) | (22 | )% | ||||