Attached files
| file | filename |
|---|---|
| 8-K - 8-K - AMERICOLD REALTY TRUST | d930741d8k.htm |
Exhibit 99.1

INVESTOR PRESENTATION Summer 2020
Disclaimer This presentation contains statements about future events and expectations that constitute forward-looking statements. Forward-looking statements are based on our beliefs, assumptions and expectations of our future financial and operating performance and growth plans, taking into account the information currently available to us. These statements are not statements of historical fact. Forward-looking statements involve risks and uncertainties that may cause our actual results to differ materially from the expectations of future results we express or imply in any forward-looking statements, and you should not place undue reliance on such statements. Factors that could contribute to these differences include adverse economic or real estate developments in our geographic markets or the temperature-controlled warehouse industry; general economic conditions; uncertainties and risks related to natural disasters, global climate change and public health crises, including the recent and ongoing COVID-19 pandemic; risks associated with the ownership of real estate and temperature-controlled warehouses in particular; defaults or non-renewals of contracts with customers; potential bankruptcy or insolvency of our customers; or the inability of our customers to otherwise perform under their contracts, including as a result of the recent and ongoing COVID-19 pandemic; uncertainty of revenues, given the nature of our customer contracts; increased interest rates and operating costs, including as a result of the recent and ongoing COVID-19 pandemic; our failure to obtain necessary outside financing; risks related to, or restrictions contained in, our debt financings; decreased storage rates or increased vacancy rates; risks related to current and potential international operations and properties; our failure to realize the intended benefits from our recent acquisitions, including synergies, or disruptions to our plans and operations or unknown or contingent liabilities related to our recent acquisitions; our failure to successfully integrate and operate acquired or developed properties or businesses, including but not limited to: Cloverleaf Cold Storage, Lanier Cold Storage, MHW Group Inc., Nova Cold Logistics, Newport Cold Storage and PortFresh Holdings, LLC; acquisition risks, including the failure of such acquisitions to perform in accordance with projections; risks related to expansions of existing properties and developments of new properties, including failure to meet budgeted or stabilized returns within expected time frames, or at all, in respect thereof; difficulties in expanding our operations into new markets, including international markets; risks related to the partial ownership of properties, including as a result of our lack of control over such investments and the failure of such entities to perform in accordance with projections; our failure to maintain our status as a REIT; our operating partnership’s failure to qualify as a partnership for federal income tax purposes; possible environmental liabilities, including costs, fines or penalties that may be incurred due to necessary remediation of contamination of properties presently or previously owned by us; financial market fluctuations; actions by our competitors and their increasing ability to compete with us; labor and power costs; changes in real estate and zoning laws and increases in real property tax rates; the competitive environment in which we operate; our relationship with our employees, including the occurrence of any work stoppages or any disputes under our collective bargaining agreements and employee related litigation; liabilities as a result of our participation in multi-employer pension plans; losses in excess of our insurance coverage; the cost and time requirements as a result of our operation as a publicly traded REIT; changes in foreign currency exchange rates; the impact of anti-takeover provisions in our constituent documents and under Maryland law, which could make an acquisition of us more difficult, limit attempts by our shareholders to replace our trustees and affect the price of our common shares of beneficial interest, $0.01 par value per share, or our common shares; the potential dilutive effect of our common share offerings; and risks related to any forward sale agreement, including the forward sale agreement we entered into with an affiliate of BofA Securities, Inc. in September 2018, as amended, or the 2018 forward sale agreement, including substantial dilution to our earnings per share or substantial cash payment obligations. Words such as “anticipates,” “believes,” “continues,” “estimates,” “expects,” “goal,” “objectives,” “intends,” “may,” “opportunity,” “plans,” “potential,” “near-term,” “long-term,” “projections,” “assumptions,” “projects,” “guidance,” “forecasts,” “outlook,” “target,” “trends,” “should,” “could,” “would,” “will” and similar expressions are intended to identify such forward-looking statements. Examples of forward-looking statements included in this presentation include, among others, statements about our expected expansion and development pipeline and our targeted return on invested capital on expansion and development opportunities. We qualify any forward-looking statements entirely by these cautionary factors. Other risks, uncertainties and factors, including those discussed under “Risk Factors” in our Annual Report on Form 10-K for the year ended December 31, 2019 and our other reports filed with the Securities and Exchange Commission, could cause our actual results to differ materially from those projected in any forward-looking statements we make. We assume no obligation to update or revise these forward-looking statements for any reason, or to update the reasons actual results could differ materially from those anticipated in these forward-looking statements, even if new information becomes available in the future.
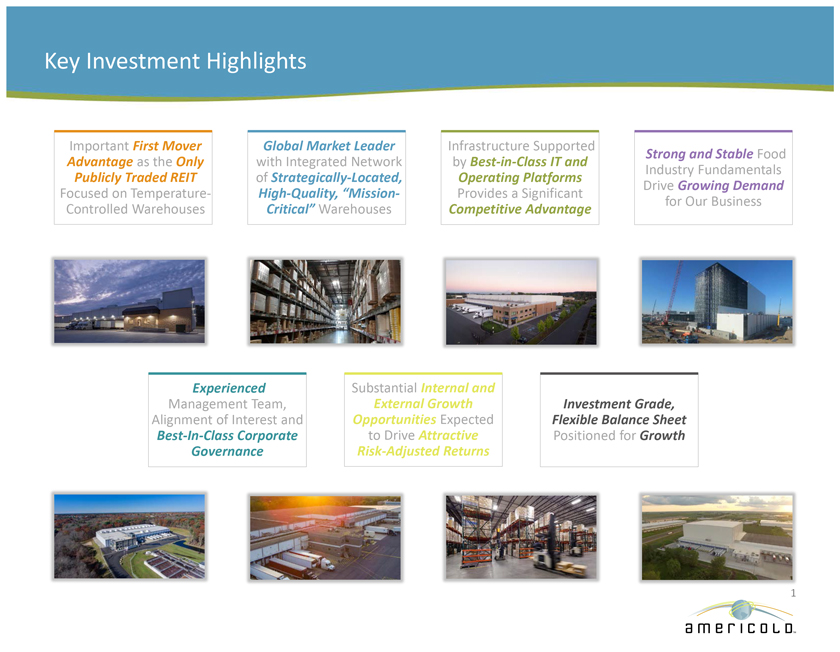
Key Investment Highlights Important First Mover Global Market Leader Infrastructure Supported Strong and Stable Food Advantage as the Only with Integrated Network by Best-in-Class IT and Industry Fundamentals Publicly Traded REIT of Strategically-Located, Operating Platforms Drive Growing Demand Focused on Temperature- High-Quality, “Mission- Provides a Significant for Our Business Controlled Warehouses Critical” Warehouses Competitive Advantage Experienced Substantial Internal and Management Team, External Growth Investment Grade, Alignment of Interest and Opportunities Expected Flexible Balance Sheet Best-In-Class Corporate to Drive Attractive Positioned for Growth Governance Risk-Adjusted Returns
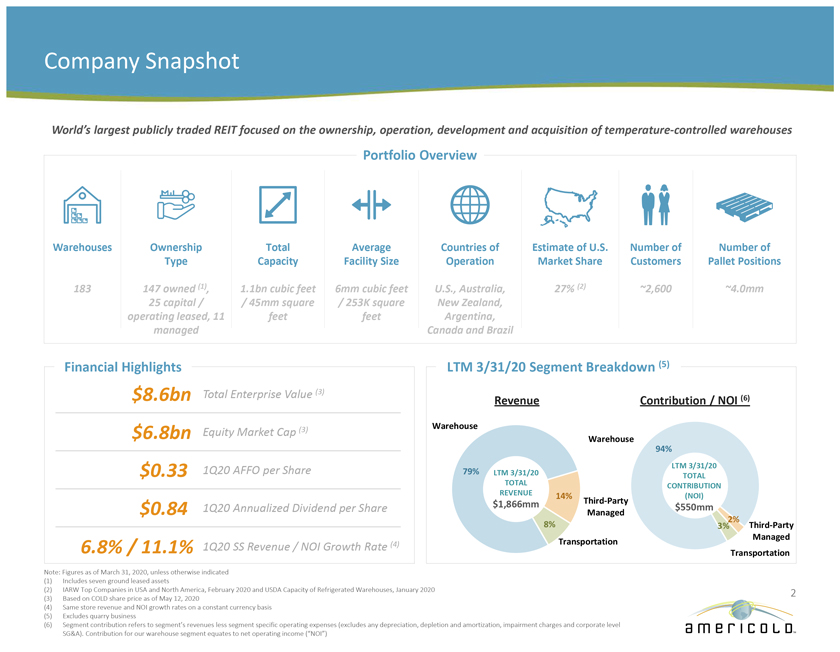
Company Snapshot World’s largest publicly traded REIT focused on the ownership, operation, development and acquisition of temperature-controlled warehouses Portfolio Overview Warehouses Ownership Total Average Countries of Estimate of U.S. Number of Number of Type Capacity Facility Size Operation Market Share Customers Pallet Positions 183 147 owned (1), 1.1bn cubic feet 6mm cubic feet U.S., Australia, 27% (2) ~2,600 ~4.0mm 25 capital / / 45mm square / 253K square New Zealand, operating leased, 11 feet feet Argentina, managed Canada and Brazil Financial Highlights LTM 3/31/20 Segment Breakdown (5) Total Enterprise Value (3) $8.6bn Revenue Contribution / NOI (6) $6.8bn Equity Market Cap (3) Warehouse Warehouse 94% 1Q20 AFFO per Share LTM 3/31/20 $0.33 79% LTM 3/31/20 TOTAL TOTAL CONTRIBUTION REVENUE 14% (NOI) $1,866mm Third-Party $0.84 1Q20 Annualized Dividend per Share $550mm Managed 2% 8% 3% Third-Party Transportation Managed 6.8% / 11.1% 1Q20 SS Revenue / NOI Growth Rate (4) Transportation Note: Figures as of March 31, 2020, unless otherwise indicated (1) Includes seven ground leased assets (2) IARW Top Companies in USA and North America, February 2020 and USDA Capacity of Refrigerated Warehouses, January 2020 2 (3) Based on COLD share price as of May 12, 2020 (4) Same store revenue and NOI growth rates on a constant currency basis (5) Excludes quarry business (6) Segment contribution refers to segment’s revenues less segment specific operating expenses (excludes any depreciation, depletion and amortization, impairment charges and corporate level SG&A). Contribution for our warehouse segment equates to net operating income (“NOI”)
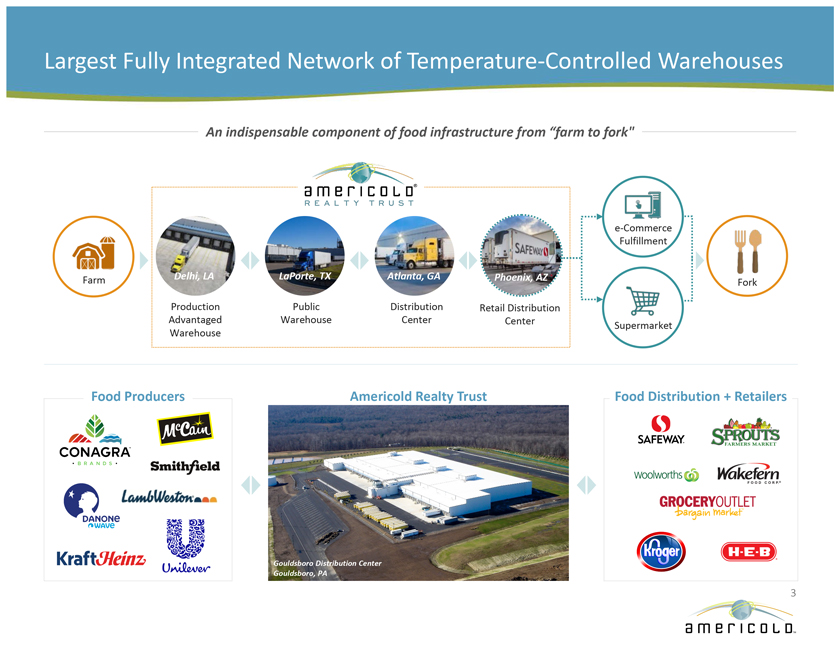
Largest Fully Integrated Network of Temperature-Controlled Warehouses An indispensable component of food infrastructure from “farm to fork” e-Commerce Fulfillment Farm Delhi, LA LaPorte, TX Atlanta, GA Phoenix, AZ Fork Production Public Distribution Retail Distribution Advantaged Warehouse Center Center Supermarket Warehouse Food Producers Americold Realty Trust Food Distribution + Retailers Gouldsboro Distribution Center Gouldsboro, PA 3
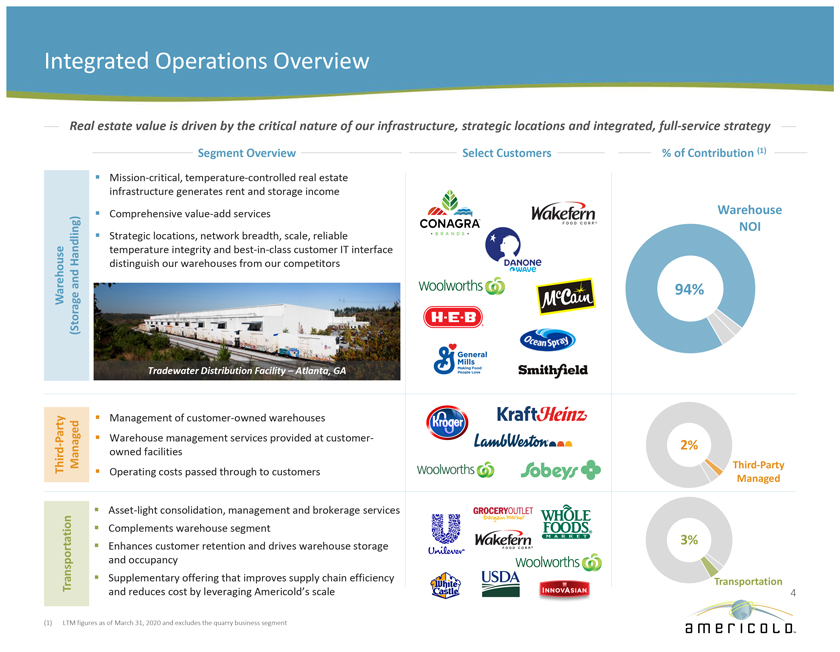
Integrated Operations Overview Real estate value is driven by the critical nature of our infrastructure, strategic locations and integrated, full-service strategy Segment Overview Select Customers % of Contribution (1) Mission-critical, temperature-controlled real estate infrastructure generates rent and storage income Comprehensive value-add services Warehouse NOI Strategic locations, network breadth, scale, reliable Handling) temperature integrity and best-in-class customer IT interface distinguish our warehouses from our competitors Warehouseand 94% Third-Party (Storage Managed Transportation Tradewater Distribution Facility – Atlanta, GA Warehouse Management of customer-owned warehouses Party Warehouse management services provided at customer- - owned facilities 2% Third Managed Third-Party Operating costs passed through to customers Managed Asset-light consolidation, management and brokerage services Complements warehouse segment Enhances customer retention and drives warehouse storage 3% and occupancy Transportation Supplementary offering that improves supply chain efficiency Transportation and reduces cost by leveraging Americold’s scale 4 (1) LTM figures as of March 31, 2020 and excludes the quarry business segment
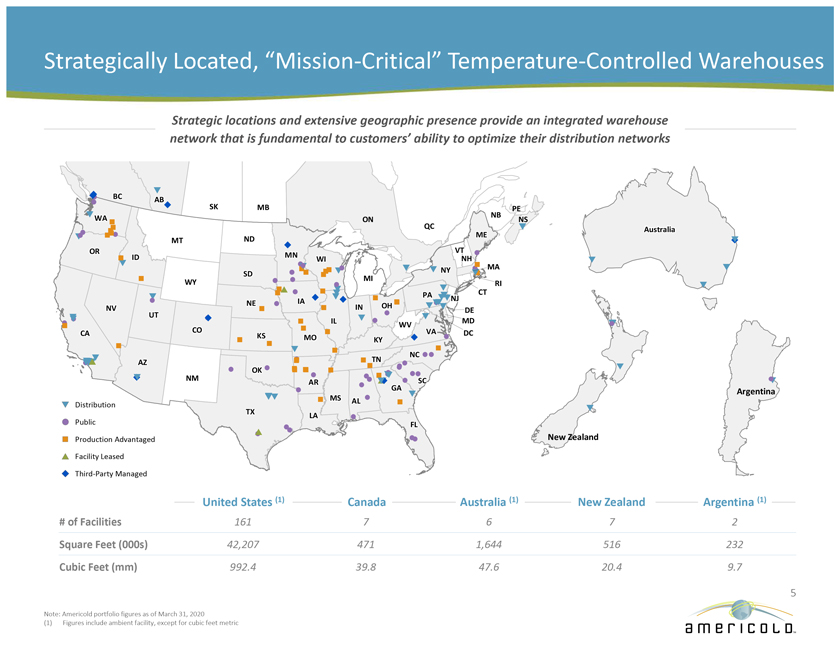
Strategically Located, “Mission-Critical” Temperature-Controlled Warehouses Strategic locations and extensive geographic presence provide an integrated warehouse network that is fundamental to customers’ ability to optimize their distribution networks BC AB SK MB PE WA ON NB NS QC Australia ME ND MT OR VT ID MN WI NH MA NY SD WY MI RI CT PA IA NJ NE OH NV IN DE UT IL MD WV CA CO VA DC KS MO KY NC TN AZ OK NM AR SC GA Argentina MS AL Distribution TX LA Public FL New Zealand Production Advantaged Facility Leased Third-Party Managed United States (1) Canada Australia str (1) ( New w Zealand Zeal d Argentina (1) # of Facilities 161 7 6 7 2 Square Feet (000s) 42,207 471 1,644 516 232 Cubic Feet (mm) 992.4 39.8 47.6 20.4 9.7 5 Note: Americold portfolio figures as of March 31, 2020 (1) Figures include ambient facility, except for cubic feet metric
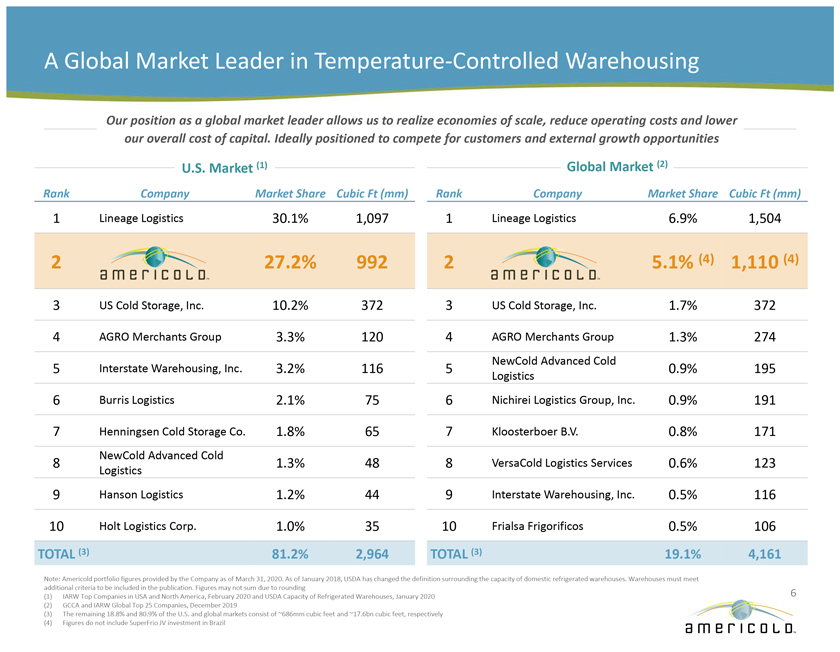
A Global Market Leader in Temperature-Controlled Warehousing Our position as a global market leader allows us to realize economies of scale, reduce operating costs and lower our overall cost of capital. Ideally positioned to compete for customers and external growth opportunities U.S. Market (1) Global Market (2) Rank Company Market Share Cubic Ft (mm) Rank Company Market Share Cubic Ft (mm) 1 Lineage Logistics 30.1% 1,097 1 Lineage Logistics 6.9% 1,504 2 27.2% 992 2 5.1% (4) 1,110 (4) 3 US Cold Storage, Inc. 10.2% 372 3 US Cold Storage, Inc. 1.7% 372 4 AGRO Merchants Group 3.3% 120 4 AGRO Merchants Group 1.3% 274 NewCold Advanced Cold 5 Interstate Warehousing, Inc. 3.2% 116 5 0.9% 195 Logistics 6 Burris Logistics 2.1% 75 6 Nichirei Logistics Group, Inc. 0.9% 191 7 Henningsen Cold Storage Co. 1.8% 65 7 Kloosterboer B.V. 0.8% 171 NewCold Advanced Cold 8 1.3% 48 8 VersaCold Logistics Services 0.6% 123 Logistics 9 Hanson Logistics 1.2% 44 9 Interstate Warehousing, Inc. 0.5% 116 10 Holt Logistics Corp. 1.0% 35 10 Frialsa Frigorificos 0.5% 106 TOTAL (3) 81.2% 2,964 TOTAL (3) 19.1% 4,161 Note: Americold portfolio figures provided by the Company as of March 31, 2020. As of January 2018, USDA has changed the definition surrounding the capacity of domestic refrigerated warehouses. Warehouses must meet additional criteria to be included in the publication. Figures may not sum due to rounding 6 (1) IARW Top Companies in USA and North America, February 2020 and USDA Capacity of Refrigerated Warehouses, January 2020 (2) GCCA and IARW Global Top 25 Companies, December 2019 (3) The remaining 18.8% and 80.9% of the U.S. and global markets consist of ~686mm cubic feet and ~17.6bn cubic feet, respectively (4) Figures do not include SuperFrio JV investment in Brazil
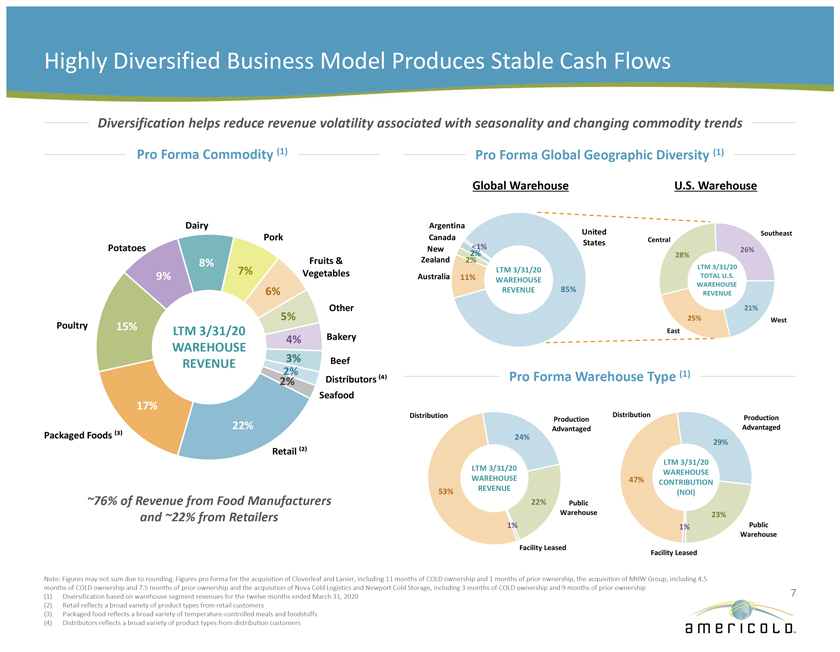
Highly Diversified Business Model Produces Stable Cash Flows Diversification helps reduce revenue volatility associated with seasonality and changing commodity trends Pro Forma Commodity (1) Pro Forma Global Geographic Diversity (1) Global Warehouse U.S. Warehouse Dairy Argentina United Southeast Pork Canada Central Potatoes <1% States New 2% 26% 28% 8% Fruits & Zealand 2% 7% LTM 3/31/20 LTM 3/31/20 9% Vegetables Australia 11% TOTAL U.S. WAREHOUSE 85% WAREHOUSE 6% REVENUE REVENUE Other 21% 5% 25% West Poultry 15% LTM 3/31/20 Bakery East 4% WAREHOUSE REVENUE 2% 3% Beef Pro Forma Warehouse Type (1) 2% Distributors â½â´â¾ Seafood 17% Distribution Distribution Production Production 22% Advantaged Advantaged Packaged Foods ⽳⾠24% 29% Retail ⽲⾠LTM 3/31/20 LTM 3/31/20 WAREHOUSE WAREHOUSE 47% CONTRIBUTION 53% REVENUE (NOI) ~76% of Revenue from Food Manufacturers 22% Public and ~22% from Retailers Warehouse 23% 1% 1% Public Warehouse Facility Leased Facility Leased Note: Figures may not sum due to rounding. Figures pro forma for the acquisition of Cloverleaf and Lanier, including 11 months of COLD ownership and 1 months of prior ownership, the acquisition of MHW Group, including 4.5 months of COLD ownership and 7.5 months of prior ownership and the acquisition of Nova Cold Logistics and Newport Cold Storage, including 3 months of COLD ownership and 9 months of prior ownership 7 (1) Diversification based on warehouse segment revenues for the twelve months ended March 31, 2020 (2) Retail reflects a broad variety of product types from retail customers (3) Packaged food reflects a broad variety of temperature-controlled meals and foodstuffs (4) Distributors reflects a broad variety of product types from distribution customers
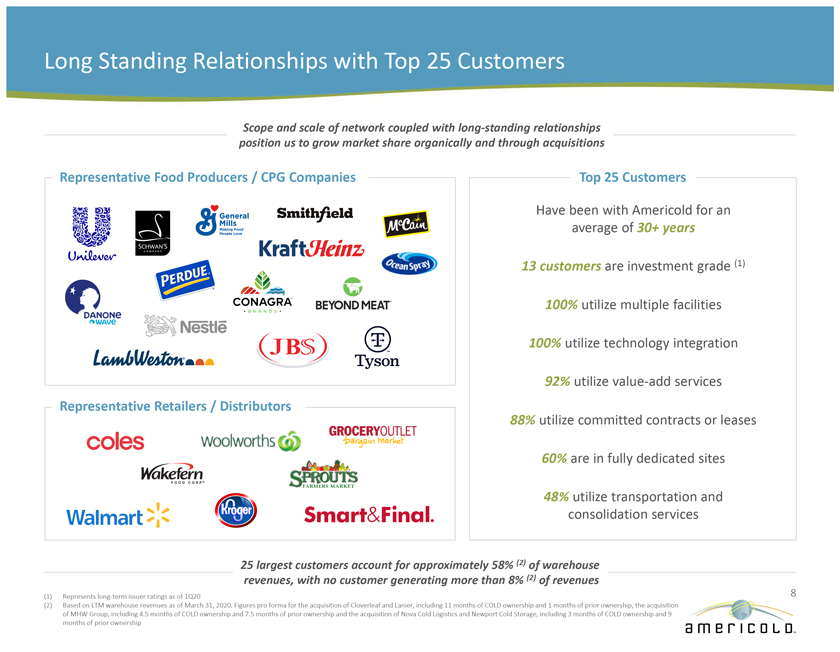
Long Standing Relationships with Top 25 Customers Scope and scale of network coupled with long-standing relationships position us to grow market share organically and through acquisitions Representative Food Producers / CPG Companies Top 25 Customers Have been with Americold for an average of 30+ years 13 customers are investment grade (1) 100% utilize multiple facilities 100% utilize technology integration 92% utilize value-add services Representative Retailers / Distributors 88% utilize committed contracts or leases 60% are in fully dedicated sites 48% utilize transportation and consolidation services 25 largest customers account for approximately 58% (2) of warehouse revenues, with no customer generating more than 8% (2) of revenues (1) Represents long-term issuer ratings as of 1Q20 8 (2) Based on LTM warehouse revenues as of March 31, 2020. Figures pro forma for the acquisition of Cloverleaf and Lanier, including 11 months of COLD ownership and 1 months of prior ownership, the acquisition of MHW Group, including 4.5 months of COLD ownership and 7.5 months of prior ownership and the acquisition of Nova Cold Logistics and Newport Cold Storage, including 3 months of COLD ownership and 9 months of prior ownership
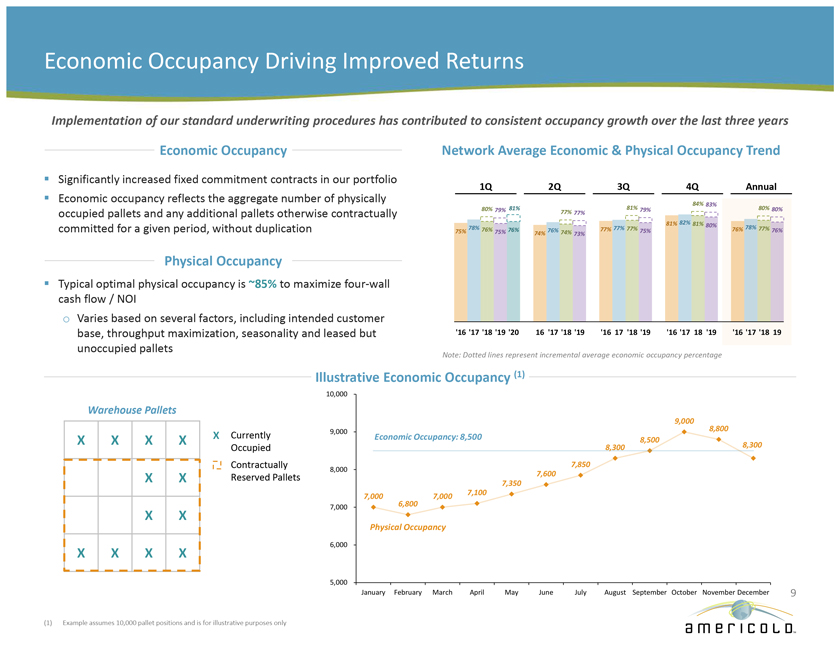
Economic Occupancy Driving Improved Returns Implementation of our standard underwriting procedures has contributed to consistent occupancy growth over the last three years Economic Occupancy Network Average Economic & Physical Occupancy Trend Significantly increased fixed commitment contracts in our portfolio aggregate 1Q 2Q 3Q 4Q Annual Economic occupancy reflects the number of physically 84% 81% 83% 80% 79% 81% 79% 80% 80% occupied pallets and any additional pallets otherwise contractually 77% 77% 81% 82% 81% 80% committed for a given period, without duplication 78% 76% 76% 76% 77% 77% 77% 76% 78% 77% 76% 75% 75% 74% 74% 73% 75% Physical Occupancy Typical optimal physical occupancy is ~85% to maximize four-wall cash flow / NOI o Varies based on several factors, including intended customer base, throughput maximization, seasonality and leased but ‘16 ‘17 ‘18 ‘19 ‘20 16 ‘17 ‘18 ‘19 ‘16 17 ‘18 ‘19 ‘16 ‘17 18 ‘19 ‘16 ‘17 ‘18 19 unoccupied pallets Note: Dotted lines represent incremental average economic occupancy percentage Illustrative Economic Occupancy (1) 10,000 Warehouse Pallets 9,000 9,000 8,800 X X X X X Currently Economic Occupancy: 8,500 8,500 8,300 Occupied 8,300 Contractually 7,850 8,000 7,600 X X Reserved Pallets 7,350 7,000 7,000 7,100 7,000 6,800 X X Physical Occupancy X X X X 6,000 5,000 January February March April May June July August September October November December 9 (1) Example assumes 10,000 pallet positions and is for illustrative purposes only
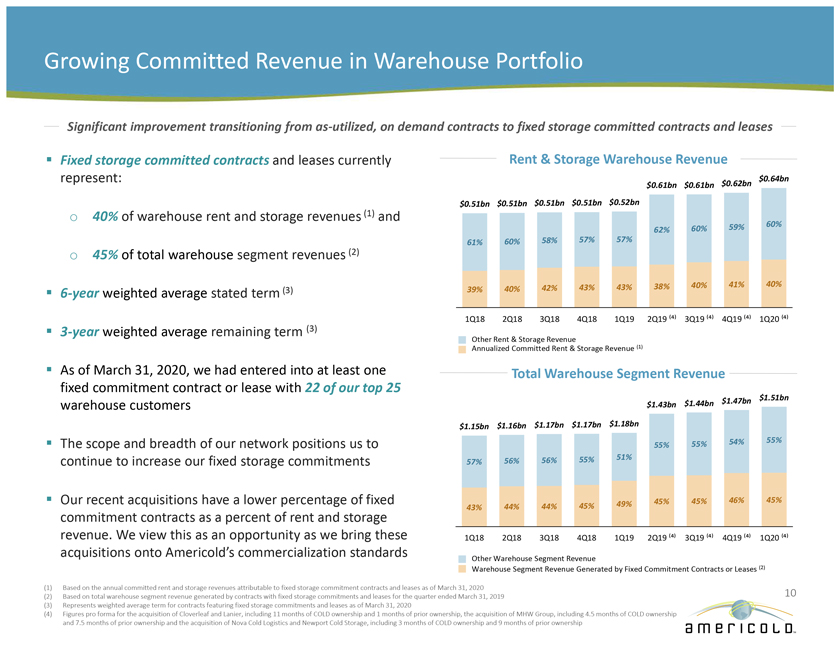
Growing Committed Revenue in Warehouse Portfolio Significant improvement transitioning from as-utilized, on demand contracts to fixed storage committed contracts and leases Fixed storage committed contracts and leases currently Rent & Storage Warehouse Revenue represent: $0.64bn $0.61bn $0.61bn $0.62bn $0.51bn $0.51bn $0.51bn $0.51bn $0.52bn o 40% of warehouse rent and storage revenues (1) and 60% 59% 60% 57% 62% 61% 60% 58% 57% o 45% of total warehouse segment revenues (2) 42% 43% 43% 38% 40% 41% 40% 6-year weighted average stated term (3) 39% 40% (3) 1Q18 2Q18 3Q18 4Q18 1Q19 2Q19 â½â´â¾ 3Q19 â½â´â¾ 4Q19 â½â´â¾ 1Q20 â½â´â¾ 3-year weighted average remaining term Other Rent & Storage Revenue Annualized Committed Rent & Storage Revenue (1) As of March 31, 2020, we had entered into at least one Total Warehouse Segment Revenue fixed commitment contract or lease with 22 of our top 25 $1.47bn $1.51bn warehouse customers $1.43bn $1.44bn $1.15bn $1.16bn $1.17bn $1.17bn $1.18bn 55% 54% 55% The scope and breadth of our network positions us to 55% 56% 56% 55% 51% continue to increase our fixed storage commitments 57% Our recent acquisitions have a lower percentage of fixed 49% 45% 45% 46% 45% 43% 44% 44% 45% commitment contracts as a percent of rent and storage revenue. We view this as an opportunity as we bring these 1Q18 2Q18 3Q18 4Q18 1Q19 2Q19 â½â´â¾ 3Q19 â½â´â¾ 4Q19 â½â´â¾ 1Q20 â½â´â¾ acquisitions onto Americold’s commercialization standards Other Warehouse Segment Revenue Warehouse Segment Revenue Generated by Fixed Commitment Contracts or Leases (2) (1) Based on the annual committed rent and storage revenues attributable to fixed storage commitment contracts and leases as of March 31, 2020 10 (2) Based on total warehouse segment revenue generated by contracts with fixed storage commitments and leases for the quarter ended March 31, 2019 (3) Represents weighted average term for contracts featuring fixed storage commitments and leases as of March 31, 2020 (4) Figures pro forma for the acquisition of Cloverleaf and Lanier, including 11 months of COLD ownership and 1 months of prior ownership, the acquisition of MHW Group, including 4.5 months of COLD ownership and 7.5 months of prior ownership and the acquisition of Nova Cold Logistics and Newport Cold Storage, including 3 months of COLD ownership and 9 months of prior ownership
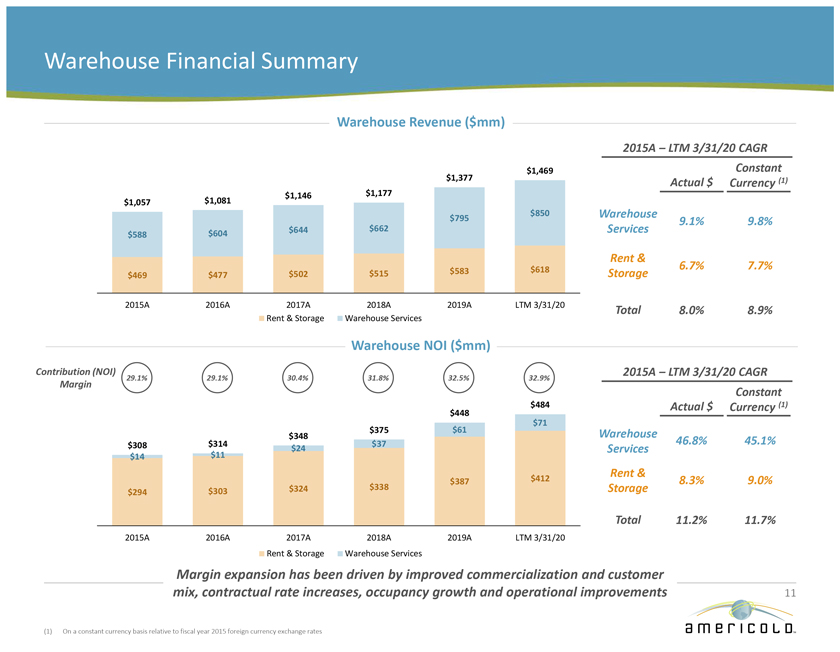
Warehouse Financial Summary Warehouse Revenue ($mm) 2015A – LTM 3/31/20 CAGR $1,469 Constant $1,377 Actual $ Currency (1) $1,146 $1,177 $1,057 $1,081 $795 $850 Warehouse 9.1% 9.8% $644 $662 Services $588 $604 Rent & $583 $618 6.7% 7.7% $469 $477 $502 $515 Storage 2015A 2016A 2017A 2018A 2019A LTM 3/31/20 Total 8.0% 8.9% Rent & Storage Warehouse Services Warehouse NOI ($mm) Contribution (NOI) 2015A – LTM 3/31/20 CAGR 29.1% 29.1% 30.4% 31.8% 32.5% 32.9% Margin Constant $484 Actual $ Currency (1) $448 $71 $375 $61 Warehouse $348 46.8% 45.1% $308 $314 $24 $37 Services $14 $11 $412 Rent & $387 8.3% 9.0% $303 $324 $338 Storage $294 Total 11.2% 11.7% 2015A 2016A 2017A 2018A 2019A LTM 3/31/20 Rent & Storage Warehouse Services Margin expansion has been driven by improved commercialization and customer mix, contractual rate increases, occupancy growth and operational improvements 11 (1) On a constant currency basis relative to fiscal year 2015 foreign currency exchange rates
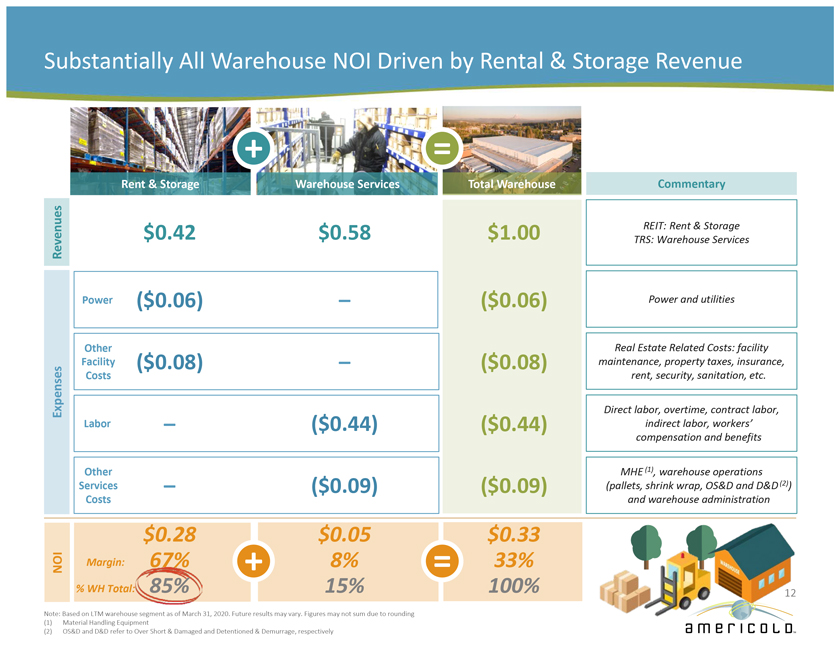
Substantially All Warehouse NOI Driven by Rental & Storage Revenue + = Rent & Storage Warehouse Services Total Warehouse Commentary $0.42 $0.58 $1.00 REIT: Rent & Storage Revenues TRS: Warehouse Services Power ($0.06) – ($0.06) Power and utilities Other Real Estate Related Costs: facility Facility ($0.08) – ($0.08) maintenance, property taxes, insurance, Costs rent, security, sanitation, etc. Expenses Direct labor, overtime, contract labor, Labor – ($0.44) ($0.44) indirect labor, workers’ compensation and benefits Other MHE (1), warehouse operations Services – ($0.09) ($0.09) (pallets, shrink wrap, OS&D and D&D (2)) Costs and warehouse administration $0.28 $0.05 $0.33 NOI Margin: 67% + 8% = 33% % WH Total: 85% 15% 100% 12 Note: Based on LTM warehouse segment as of March 31, 2020. Future results may vary. Figures may not sum due to rounding (1) Material Handling Equipment (2) OS&D and D&D refer to Over Short & Damaged and Detentioned & Demurrage, respectively
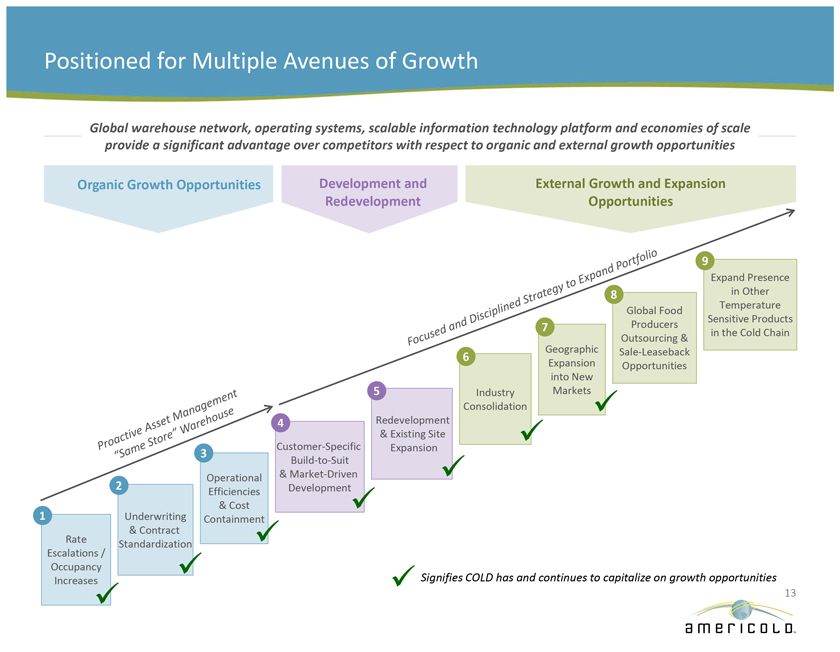
Positioned for Multiple Avenues of Growth Global warehouse network, operating systems, scalable information technology platform and economies of scale provide a significant advantage over competitors with respect to organic and external growth opportunities Organic Growth Opportunities Development and External Growth and Expansion Redevelopment Opportunities 9 Expand Presence 8 in Other Global Food Temperature Producers Sensitive Products 7 in the Cold Chain Outsourcing & Geographic Sale-Leaseback 6 Expansion Opportunities into New 5 Industry Markets Consolidation 4 Redevelopment & Existing Site Customer-Specific Expansion 3 Build-to-Suit Operational & Market-Driven 2 Efficiencies Development & Cost 1 Underwriting Containment & Contract Rate Standardization Escalations / Occupancy Increases Signifies COLD has and continues to capitalize on growth opportunities 13
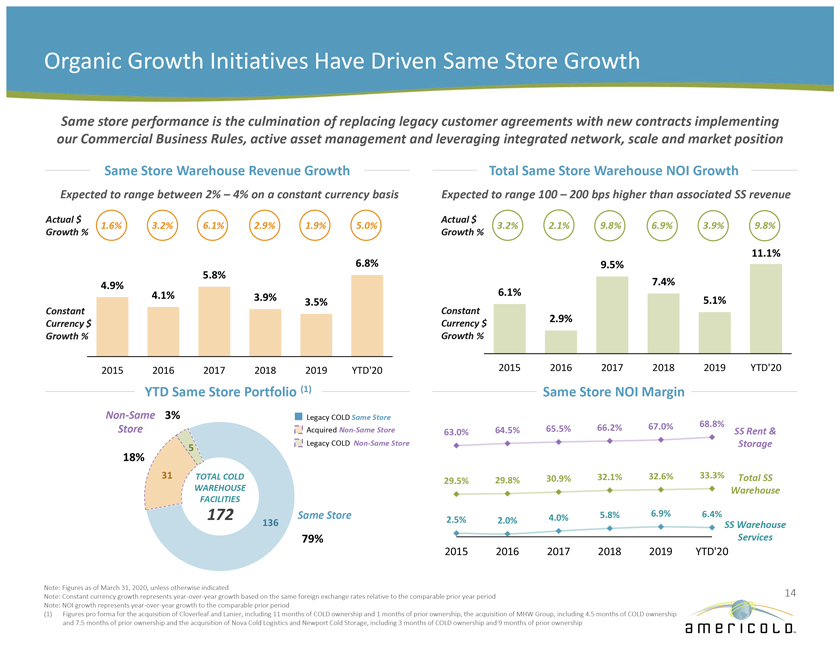
Organic Growth Initiatives Have Driven Same Store Growth Same store performance is the culmination of replacing legacy customer agreements with new contracts implementing our Commercial Business Rules, active asset management and leveraging integrated network, scale and market position Same Store Warehouse Revenue Growth Total Same Store Warehouse NOI Growth Expected to range between 2% – 4% on a constant currency basis Expected to range 100 – 200 bps higher than associated SS revenue Actual $ Actual $ 1.6% 3.2% 6.1% 2.9% 1.9% 5.0% 3.2% 2.1% 9.8% 6.9% 3.9% 9.8% Growth % Growth % 11.1% 5.8% 6.8% 9.5% 4.9% 7.4% 4.1% 3.9% 6.1% Constant 3.5% Constant 5.1% Currency $ Currency $ 2.9% Growth % Growth % 2015 2016 2017 2018 2019 YTD’20 2015 2016 2017 2018 2019 YTD’20 YTD Same Store Portfolio (1) Same Store NOI Margin Non-Same 3% Legacy COLD Same Store 65.5% 66.2% 67.0% 68.8% Store Acquired Non-Same Store 63.0% 64.5% SS Rent & 5 Legacy COLD Non-Same Store Storage 18% 31 TOTAL COLD 29.8% 30.9% 32.1% 32.6% 33.3% Total SS 29.5% WAREHOUSE Warehouse FACILITIES 172 Same Store 4.0% 5.8% 6.9% 6.4% 136 2.5% 2.0% SS Warehouse 79% Services 2015 2016 2017 2018 2019 YTD’20 Note: Figures as of March 31, 2020, unless otherwise indicated 14 Note: Constant currency growth represents year-over-year growth based on the same foreign exchange rates relative to the comparable prior year period Note: NOI growth represents year-over-year growth to the comparable prior period (1) Figures pro forma for the acquisition of Cloverleaf and Lanier, including 11 months of COLD ownership and 1 months of prior ownership, the acquisition of MHW Group, including 4.5 months of COLD ownership and 7.5 months of prior ownership and the acquisition of Nova Cold Logistics and Newport Cold Storage, including 3 months of COLD ownership and 9 months of prior ownership
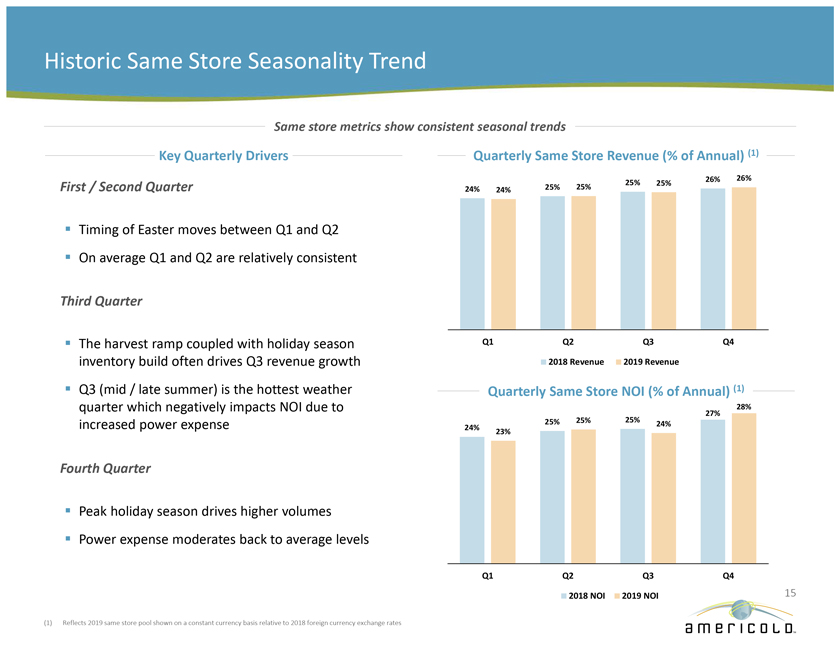
Historic Same Store Seasonality Trend Same store metrics show consistent seasonal trends Key Quarterly Drivers Quarterly Same Store Revenue (% of Annual) (1) 26% 26% First / Second Quarter 25% 25% 25% 25% 24% 24% Timing of Easter moves between Q1 and Q2 On average Q1 and Q2 are relatively consistent Third Quarter The harvest ramp coupled with holiday season Q1 Q2 Q3 Q4 inventory build often drives Q3 revenue growth 2018 Revenue 2019 Revenue Q3 (mid / late summer) is the hottest weather Quarterly Same Store NOI (% of Annual) (1) quarter which negatively impacts NOI due to 28% 27% increased power expense 25% 25% 25% 24% 24% 23% Fourth Quarter Peak holiday season drives higher volumes Power expense moderates back to average levels Q1 Q2 Q3 Q4 2018 NOI 2019 NOI 15 (1) Reflects 2019 same store pool shown on a constant currency basis relative to 2018 foreign currency exchange rates
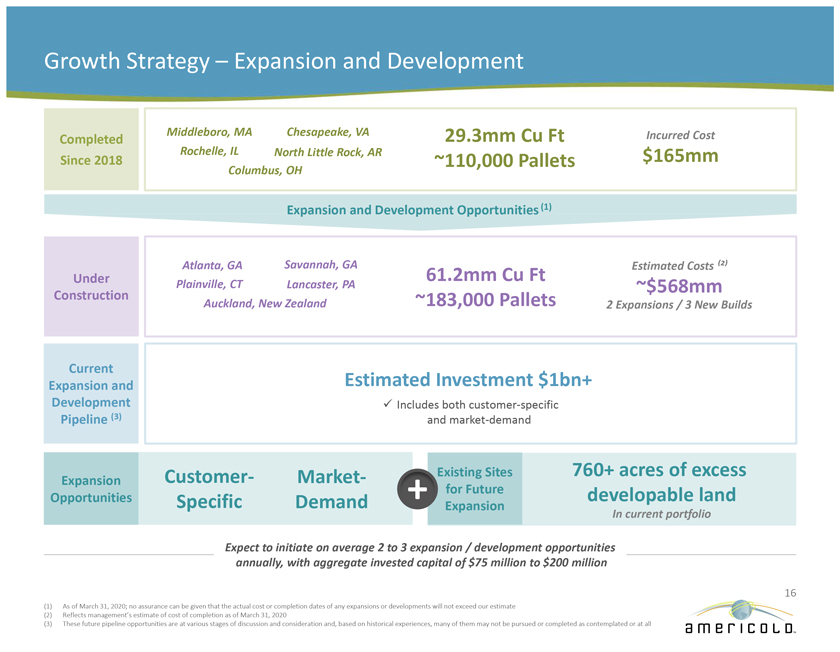
Growth Strategy – Expansion and Development Completed Middleboro, MA Chesapeake, VA 29.3mm Cu Ft Incurred Cost Rochelle, IL North Little Rock, AR $165mm Since 2018 ~110,000 Pallets Columbus, OH Expansion and Development Opportunities (1) Under Atlanta, GA Savannah, GA 61.2mm Cu Ft Estimated Costs ⽲⾠Plainville, CT Lancaster, PA ~$568mm Construction ~183,000 Pallets Auckland, New Zealand 2 Expansions / 3 New Builds Current Estimated Investment $1bn+ Expansion and Development Includes both customer-specific Pipeline (3) and market-demand Customer- Market- Existing Sites 760+ acres of excess Expansion + for Future developable land Opportunities Specific Demand Expansion In current portfolio Expect to initiate on average 2 to 3 expansion / development opportunities annually, with aggregate invested capital of $75 million to $200 million 16 (1) As of March 31, 2020; no assurance can be given that the actual cost or completion dates of any expansions or developments will not exceed our estimate (2) Reflects management’s estimate of cost of completion as of March 31, 2020 (3) These future pipeline opportunities are at various stages of discussion and consideration and, based on historical experiences, many of them may not be pursued or completed as contemplated or at all
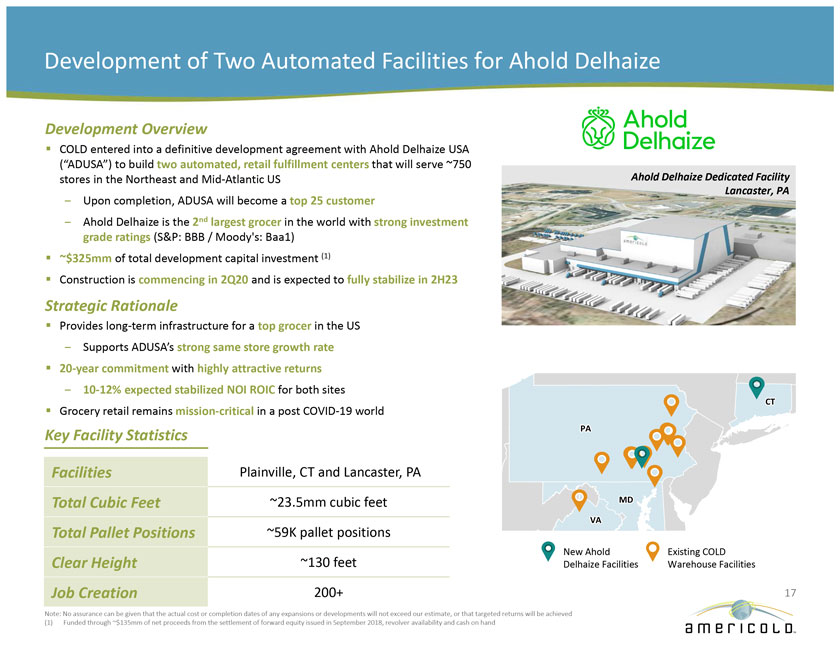
Development of Two Automated Facilities for Ahold Delhaize Development Overview COLD entered into a definitive development agreement with Ahold Delhaize USA (ADUSA) to build two automated, retail fulfillment centers that will serve ~750 Ahold Delhaize Dedicated Facility stores in the Northeast and Mid-Atlantic US Lancaster, PA Upon completion, ADUSA will become a top 25 customer Ahold Delhaize is the 2nd largest grocer in the world with strong investment grade ratings (S&P: BBB / Moody’s: Baa1) $325mm of total development capital investment (1) Construction is commencing in 2Q20 and is expected to fully stabilize in 2H23 Strategic Rationale Provides long-term infrastructure for a top grocer in the US Supports ADUSA’s strong same store growth rate 20-year commitment with highly attractive returns 10-12% expected stabilized NOI ROIC for both sites CT Grocery retail remains mission-critical in a post COVID-19 world Key Facility Statistics PA Facilities Plainville, CT and Lancaster, PA Total Cubic Feet 23.5mm cubic feet MD VA Total Pallet Positions 59K pallet positions New Ahold Existing COLD Clear Height 130 feet Delhaize Facilities Warehouse Facilities Job Creation 200+ 17 Note: No assurance can be given that the actual cost or completion dates of any expansions or developments will not exceed our estimate, or that targeted returns will be achieved (1) Funded through $135mm of net proceeds from the settlement of forward equity issued in September 2018, revolver availability and cash on hand
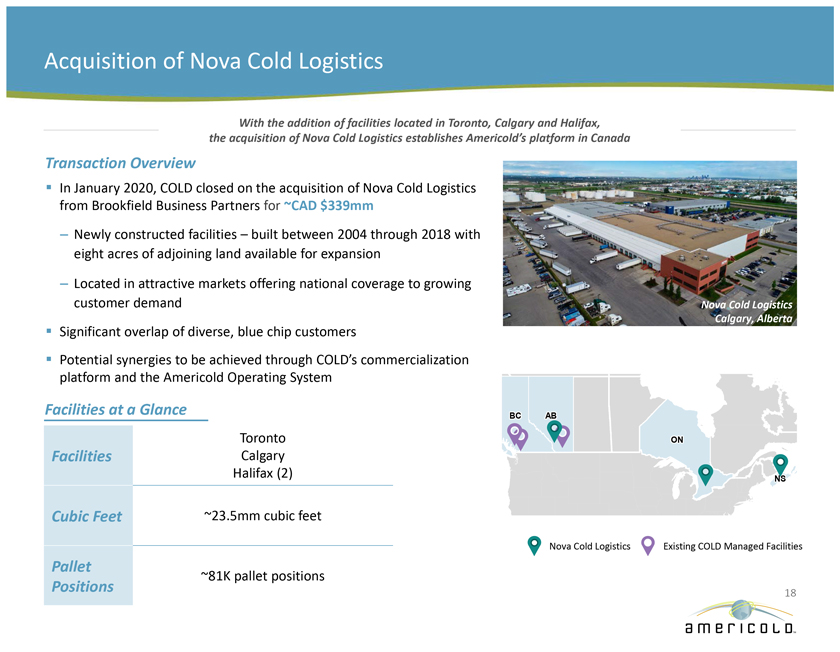
Acquisition of Nova Cold Logistics With the addition of facilities located in Toronto, Calgary and Halifax, the acquisition of Nova Cold Logistics establishes Americold’s platform in Canada Transaction Overview In January 2020, COLD closed on the acquisition of Nova Cold Logistics from Brookfield Business Partners for ~CAD $339mm – Newly constructed facilities – built between 2004 through 2018 with eight acres of adjoining land available for expansion – Located in attractive markets offering national coverage to growing customer demand Nova Cold Logistics Calgary, Alberta Significant overlap of diverse, blue chip customers Potential synergies to be achieved through COLD’s commercialization platform and the Americold Operating System Facilities at a Glance BC AB Toronto ON Facilities Calgary Halifax (2) NS Cubic Feet ~23.5mm cubic feet Nova Cold Logistics Existing COLD Managed Facilities Pallet ~81K pallet positions Positions 18
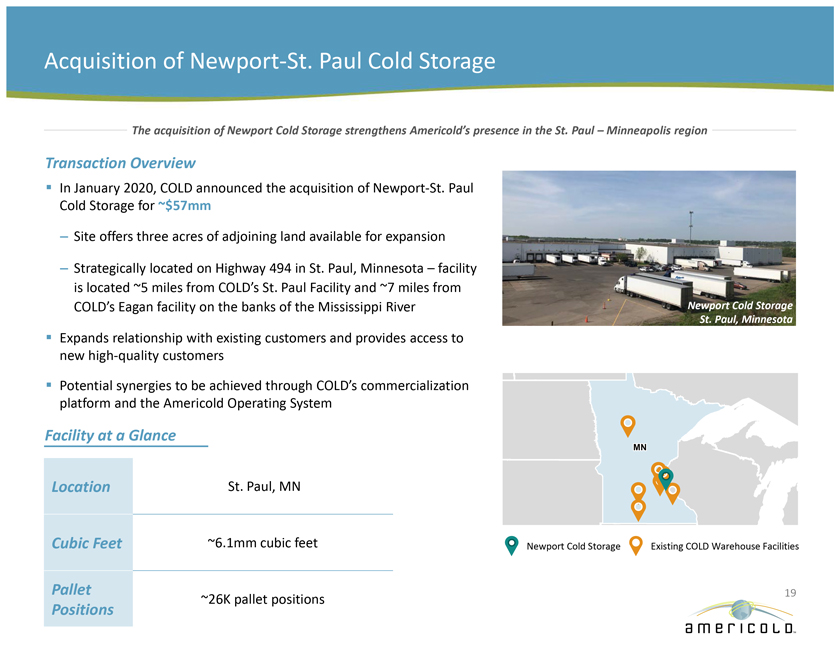
Acquisition of Newport-St. Paul Cold Storage The acquisition of Newport Cold Storage strengthens Americold’s presence in the St. Paul – Minneapolis region Transaction Overview In January 2020, COLD announced the acquisition of Newport-St. Paul Cold Storage for ~$57mm – Site offers three acres of adjoining land available for expansion – Strategically located on Highway 494 in St. Paul, Minnesota – facility is located ~5 miles from COLD’s St. Paul Facility and ~7 miles from COLD’s Eagan facility on the banks of the Mississippi River Newport Cold Storage St. Paul, Minnesota Expands relationship with existing customers and provides access to new high-quality customers Potential synergies to be achieved through COLD’s commercialization platform and the Americold Operating System Facility at a Glance MN Location St. Paul, MN Cubic Feet ~6.1mm cubic feet Newport Cold Storage Existing COLD Warehouse Facilities Pallet 19 ~26K pallet positions Positions
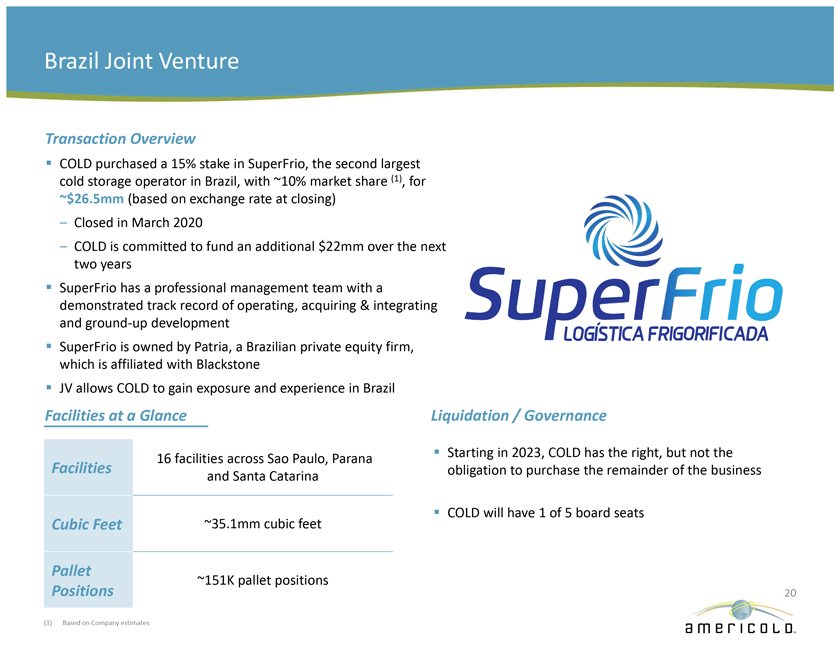
Brazil Joint Venture Transaction Overview COLD purchased a 15% stake in SuperFrio, the second largest cold storage operator in Brazil, with ~10% market share (1), for ~$26.5mm (based on exchange rate at closing) – Closed in March 2020 – COLD is committed to fund an additional $22mm over the next two years SuperFrio has a professional management team with a demonstrated track record of operating, acquiring & integrating and ground-up development SuperFrio is owned by Patria, a Brazilian private equity firm, which is affiliated with Blackstone JV allows COLD to gain exposure and experience in Brazil Facilities at a Glance Liquidation / Governance 16 facilities across Sao Paulo, Parana Starting in 2023, COLD has the right, but not the Facilities obligation to purchase the remainder of the business and Santa Catarina COLD will have 1 of 5 board seats Cubic Feet ~35.1mm cubic feet Pallet ~151K pallet positions Positions 20 (1) Based on Company estimates
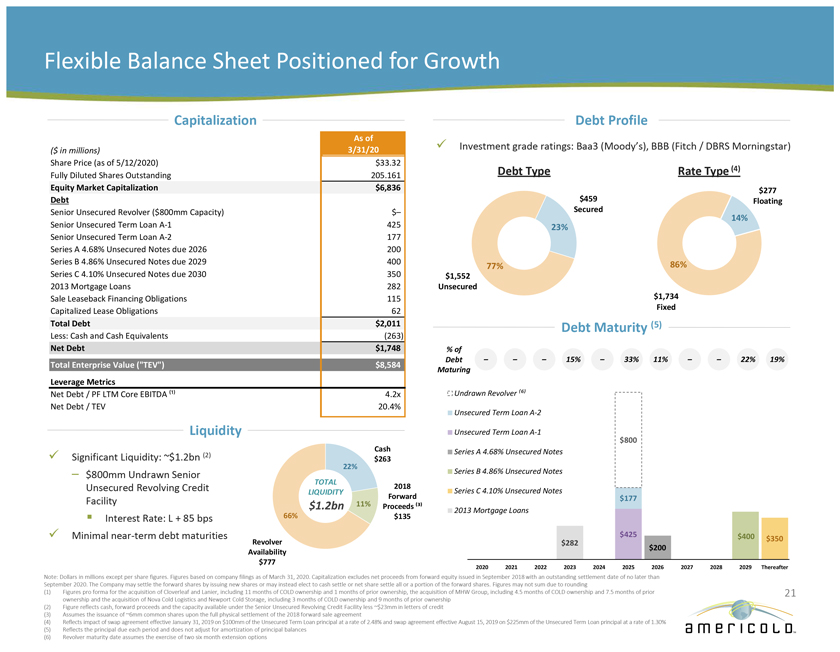
Flexible Balance Sheet Positioned for Growth Capitalization Debt Profile As of ($ in millions) 3/31/20 Investment grade ratings: Baa3 (Moody’s), BBB (Fitch / DBRS Morningstar) Share Price (as of 5/12/2020) $33.32 Debt Type Rate Type (4) Fully Diluted Shares Outstanding 205.161 Equity Market Capitalization $6,836 $277 Debt $459 Floating Senior Unsecured Revolver ($800mm Capacity) $– Secured 14% Senior Unsecured Term Loan A-1 425 23% Senior Unsecured Term Loan A-2 177 Series A 4.68% Unsecured Notes due 2026 200 Series B 4.86% Unsecured Notes due 2029 400 77% 86% Series C 4.10% Unsecured Notes due 2030 350 $1,552 2013 Mortgage Loans 282 Unsecured Sale Leaseback Financing Obligations 115 $1,734 Capitalized Lease Obligations 62 Fixed Total Debt $2,011 Debt Maturity (5) Less: Cash and Cash Equivalents (263) Net Debt $1,748 % of Debt – – – 15% – 33% 11% – – 22% 19% Total Enterprise Value (“TEV”) $8,584 Maturing Leverage Metrics Net Debt / PF LTM Core EBITDA ⽹⾠4.2x Undrawn Revolver â½â¶â¾ Net Debt / TEV 20.4% Unsecured Term Loan A-2 Liquidity Unsecured Term Loan A-1 Cash $800 Significant Liquidity: ~$1.2bn (2) Series A 4.68% Unsecured Notes $263 22% – $800mm Undrawn Senior Series B 4.86% Unsecured Notes TOTAL Unsecured Revolving Credit 2018 LIQUIDITY Series C 4.10% Unsecured Notes Facility Forward $177 $1.2bn 11% Proceeds ⽳⾠2013 Mortgage Loans Interest Rate: L + 85 bps 66% $135 Minimal near-term debt maturities $425 $400 Revolver $282 $200 $350 Availability $777 2020 2021 2022 2023 2024 2025 2026 2027 2028 2029 Thereafter Note: Dollars in millions except per share figures. Figures based on company filings as of March 31, 2020. Capitalization excludes net proceeds from forward equity issued in September 2018 with an outstanding settlement date of no later than September 2020. The Company may settle the forward shares by issuing new shares or may instead elect to cash settle or net share settle all or a portion of the forward shares. Figures may not sum due to rounding (1) Figures pro forma for the acquisition of Cloverleaf and Lanier, including 11 months of COLD ownership and 1 months of prior ownership, the acquisition of MHW Group, including 4.5 months of COLD ownership and 7.5 months of prior 21 ownership and the acquisition of Nova Cold Logistics and Newport Cold Storage, including 3 months of COLD ownership and 9 months of prior ownership (2) Figure reflects cash, forward proceeds and the capacity available under the Senior Unsecured Revolving Credit Facility less ~$23mm in letters of credit (3) Assumes the issuance of ~6mm common shares upon the full physical settlement of the 2018 forward sale agreement (4) Reflects impact of swap agreement effective January 31, 2019 on $100mm of the Unsecured Term Loan principal at a rate of 2.48% and swap agreement effective August 15, 2019 on $225mm of the Unsecured Term Loan principal at a rate of 1.30% (5) Reflects the principal due each period and does not adjust for amortization of principal balances (6) Revolver maturity date assumes the exercise of two six month extension options
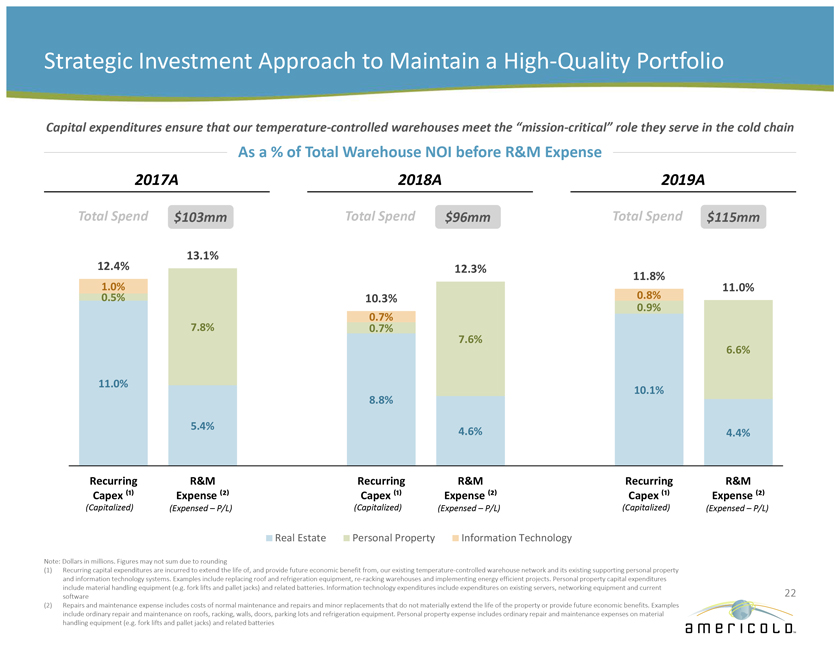
Strategic Investment Approach to Maintain a High-Quality Portfolio Capital expenditures ensure that our temperature-controlled warehouses meet the “mission-critical” role they serve in the cold chain As a % of Total Warehouse NOI before R&M Expense 2017A 2018A 2019A Total Spend $103mm Total Spend $96mm Total Spend $115mm 13.1% 12.4% 12.3% 11.8% 1.0% 11.0% 0.5% 10.3% 0.8% 0.9% 0.7% 7.8% 0.7% 7.6% 6.6% 11.0% 10.1% 8.8% 5.4% 4.6% 4.4% Recurring R&M Recurring R&M Recurring R&M Capex ⽹⾠Expense ⽲⾠Capex ⽹⾠Expense ⽲⾠Capex ⽹⾠Expense ⽲⾠(Capitalized) (Expensed – P/L) (Capitalized) (Expensed – P/L) (Capitalized) (Expensed – P/L) Real Estate Personal Property Information Technology Note: Dollars in millions. Figures may not sum due to rounding (1) Recurring capital expenditures are incurred to extend the life of, and provide future economic benefit from, our existing temperature-controlled warehouse network and its existing supporting personal property and information technology systems. Examples include replacing roof and refrigeration equipment, re-racking warehouses and implementing energy efficient projects. Personal property capital expenditures include material handling equipment (e.g. fork lifts and pallet jacks) and related batteries. Information technology expenditures include expenditures on existing servers, networking equipment and current 22 software (2) Repairs and maintenance expense includes costs of normal maintenance and repairs and minor replacements that do not materially extend the life of the property or provide future economic benefits. Examples include ordinary repair and maintenance on roofs, racking, walls, doors, parking lots and refrigeration equipment. Personal property expense includes ordinary repair and maintenance expenses on material handling equipment (e.g. fork lifts and pallet jacks) and related batteries
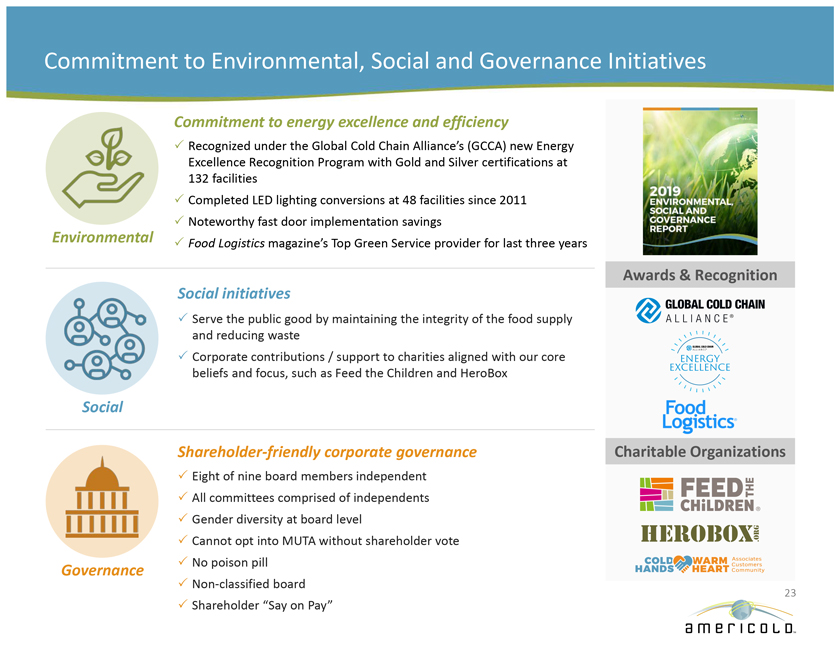
Commitment to Environmental, Social and Governance Initiatives Commitment to energy excellence and efficiency Recognized under the Global Cold Chain Alliance’s (GCCA) new Energy Excellence Recognition Program with Gold and Silver certifications at 132 facilities Completed LED lighting conversions at 48 facilities since 2011 Noteworthy fast door implementation savings Environmental Food Logistics magazine’s Top Green Service provider for last three years Awards & Recognition Social initiatives Serve the public good by maintaining the integrity of the food supply and reducing waste Corporate contributions / support to charities aligned with our core beliefs and focus, such as Feed the Children and HeroBox Social Shareholder-friendly corporate governance Charitable Organizations Eight of nine board members independent All committees comprised of independents Gender diversity at board level Cannot opt into MUTA without shareholder vote Governance No poison pill Non-classified board 23 Shareholder “Say on Pay”
Conclusion Important First Mover Global Market Leader Infrastructure Supported Strong and Stable Food Advantage as the Only with Integrated Network by Best-in-Class IT and Industry Fundamentals Publicly Traded REIT of Strategically-Located, Operating Platforms Drive Growing Demand Focused on Temperature- High-Quality, “Mission- Provides a Significant for Our Business Controlled Warehouses Critical” Warehouses Competitive Advantage Experienced Substantial Internal and Management Team, External Growth Investment Grade, Alignment of Interest and Opportunities Expected Flexible Balance Sheet Best-In-Class Corporate to Drive Attractive Positioned for Growth Governance Risk-Adjusted Returns 24