Attached files
| file | filename |
|---|---|
| 8-K - 8-K - MICRON TECHNOLOGY INC | mu-20200512.htm |
Exhibit 99.1 Investor Update Manish Bhatia EVP, Global Operations May 12, 2020 ©2020 Micron Technology, Inc. All rights reserved. Information, products, and/or specifications are subject to change without notice. All information is provided on an “AS IS” basis without warranties of any kind. Statements regarding products, including statements regarding product features, availability, functionality, or compatibility, are provided for informational purposes only and do not modify the warranty, if any, applicable to any product. Drawings may not be to scale. Micron, the Micron orbit logo, the M orbit logo, Intelligence Accelerated™, and other Micron trademarks are the property of Micron Technology, Inc. All other trademarks are the property of their respective owners. 1
Safe Harbor Statement During the course of this meeting, we may make projections or other forward-looking statements regarding future events or the future financial performance of the Company and the industry. We wish to caution you that such statements are predictions and that actual events or results may differ materially. We refer you to the documents the Company files from time to time with the Securities and Exchange Commission, specifically the Company’s most recent Form 10-K and Form 10-Q. These documents contain and identify important factors that could cause the actual results for the Company to differ materially from those contained in our projections or forward- looking statements. These certain factors can be found at http://www.micron.com/certainfactors. Although we believe that the expectations reflected in the forward-looking statements are reasonable, we cannot guarantee future results, levels of activity, performance, or achievements. We are under no duty to update any of the forward-looking statements after the date of the presentation to conform these statements to actual results. 2 May 12, 2020
Manish Bhatia Executive Vice President Global Operations 3
Agenda Market strategy Operational excellence Results 4

Market Strategy 5
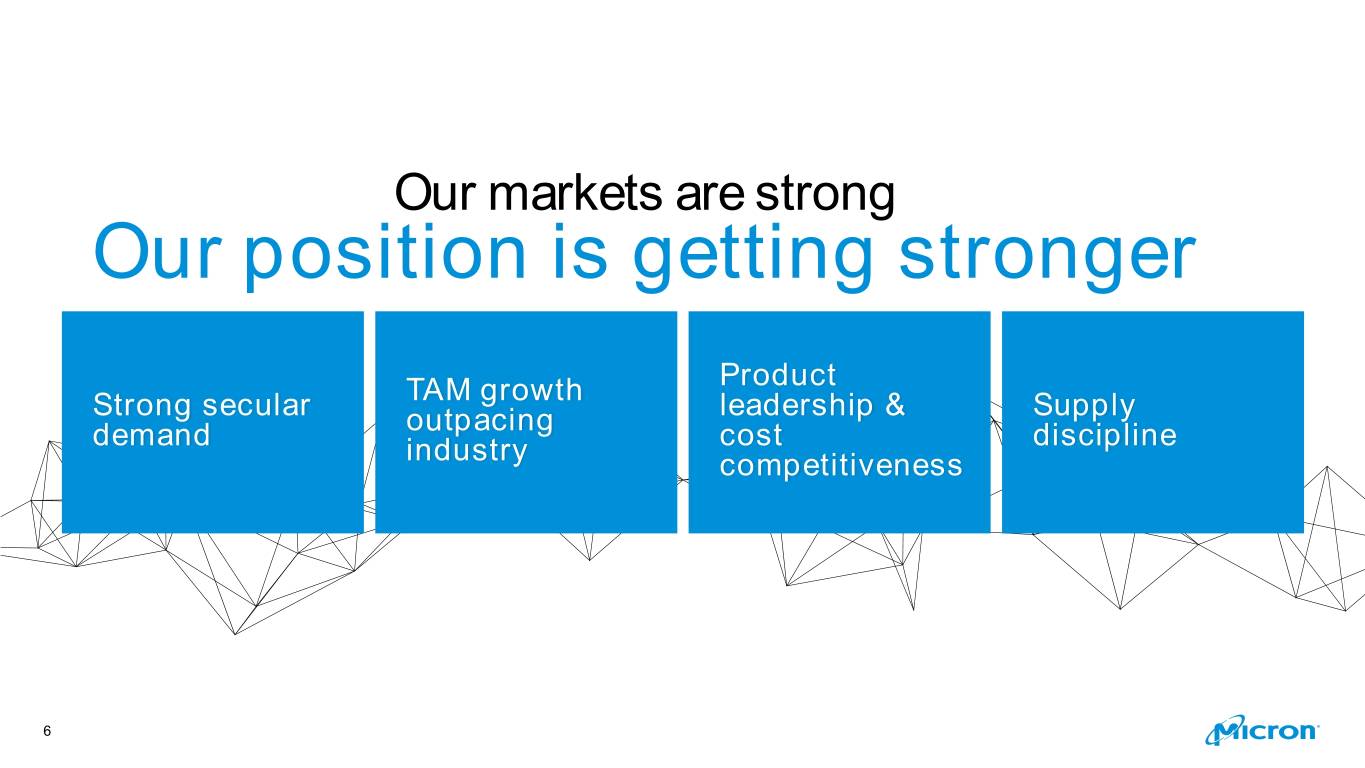
Our markets are strong Our position is getting stronger Product Strong secular TAM growth leadership & Supply demand outpacing cost discipline industry competitiveness 6
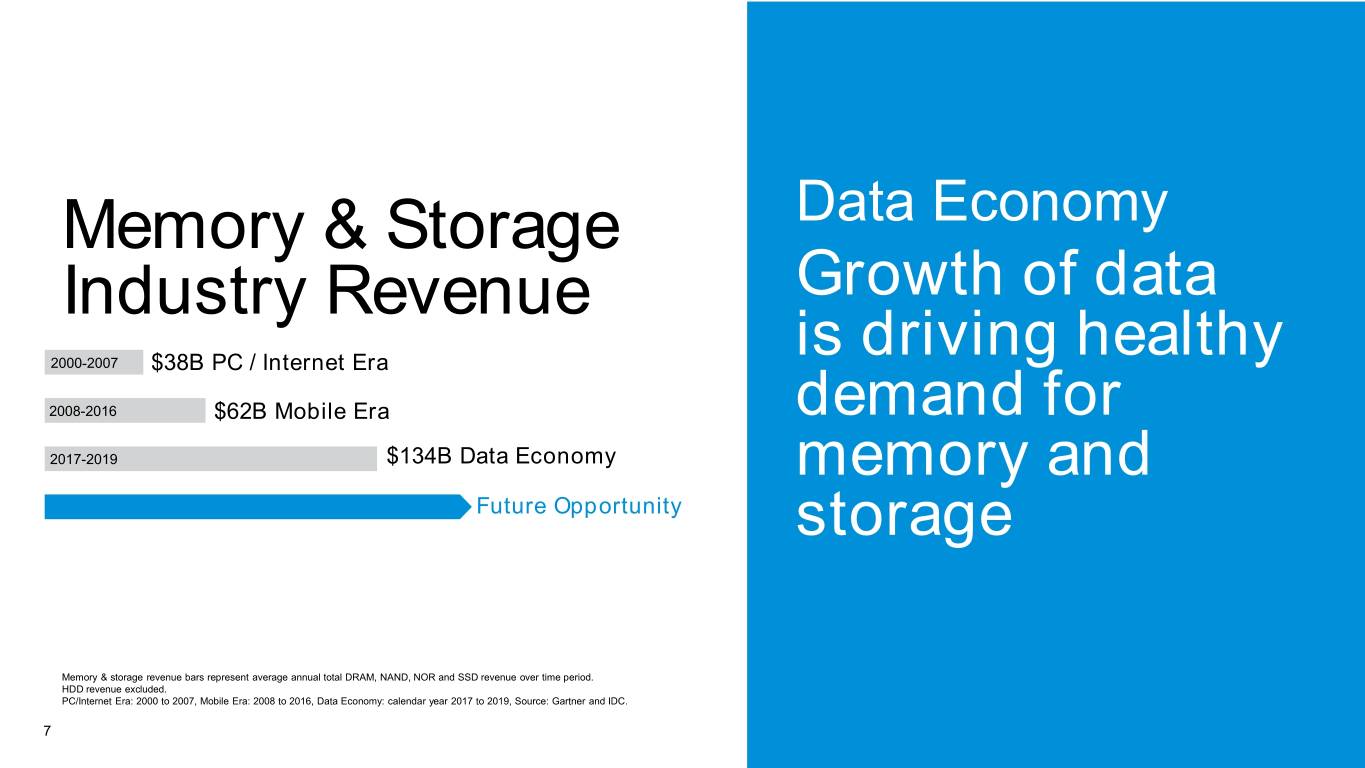
Memory & Storage Data Economy Industry Revenue Growth of data is driving healthy 2000-2007 $38B PC / Internet Era 2008-2016 $62B Mobile Era demand for 2017-2019 $134B Data Economy memory and Future Opportunity storage Memory & storage revenue bars represent average annual total DRAM, NAND, NOR and SSD revenue over time period. HDD revenue excluded. PC/Internet Era: 2000 to 2007, Mobile Era: 2008 to 2016, Data Economy: calendar year 2017 to 2019, Source: Gartner and IDC. 7
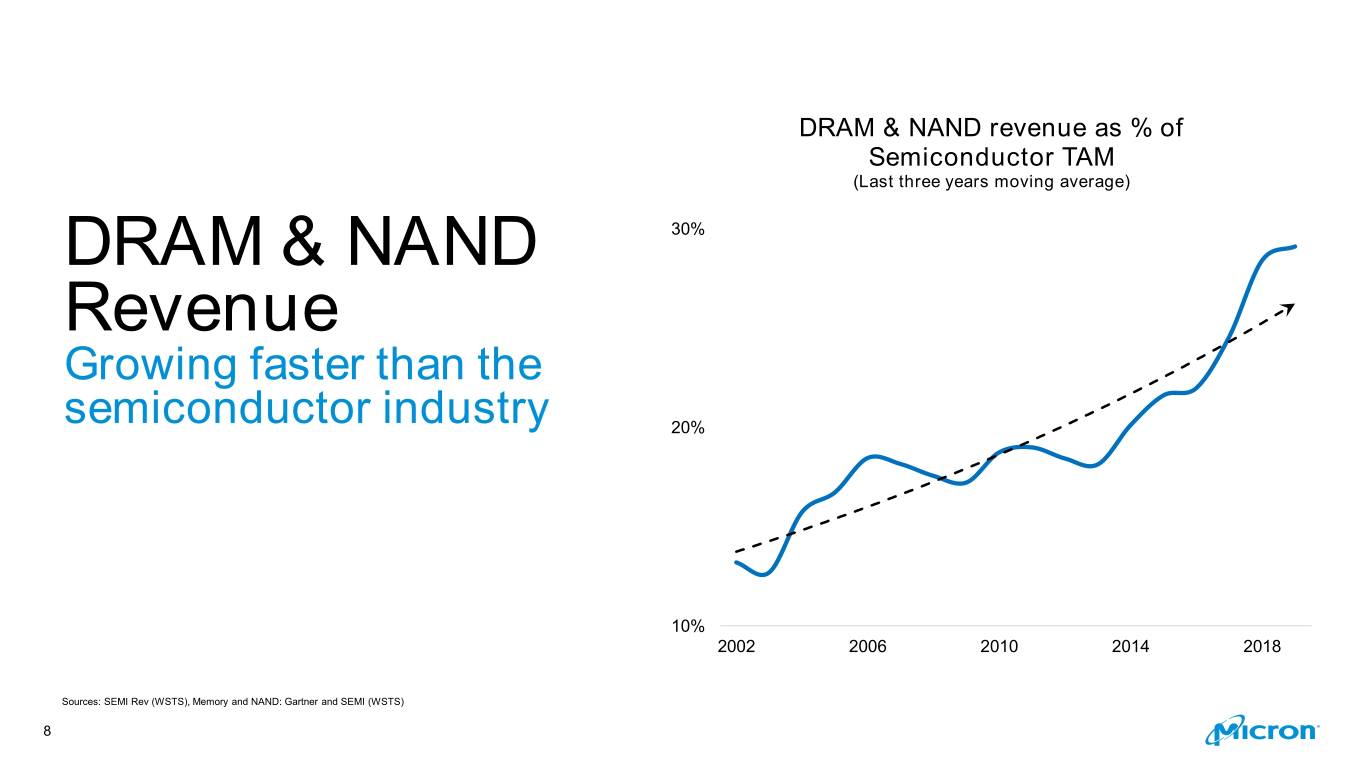
DRAM & NAND revenue as % of Semiconductor TAM (Last three years moving average) DRAM & NAND 30% Revenue Growing faster than the semiconductor industry 20% 10% 2002 2006 2010 2014 2018 Sources: SEMI Rev (WSTS), Memory and NAND: Gartner and SEMI (WSTS) 8
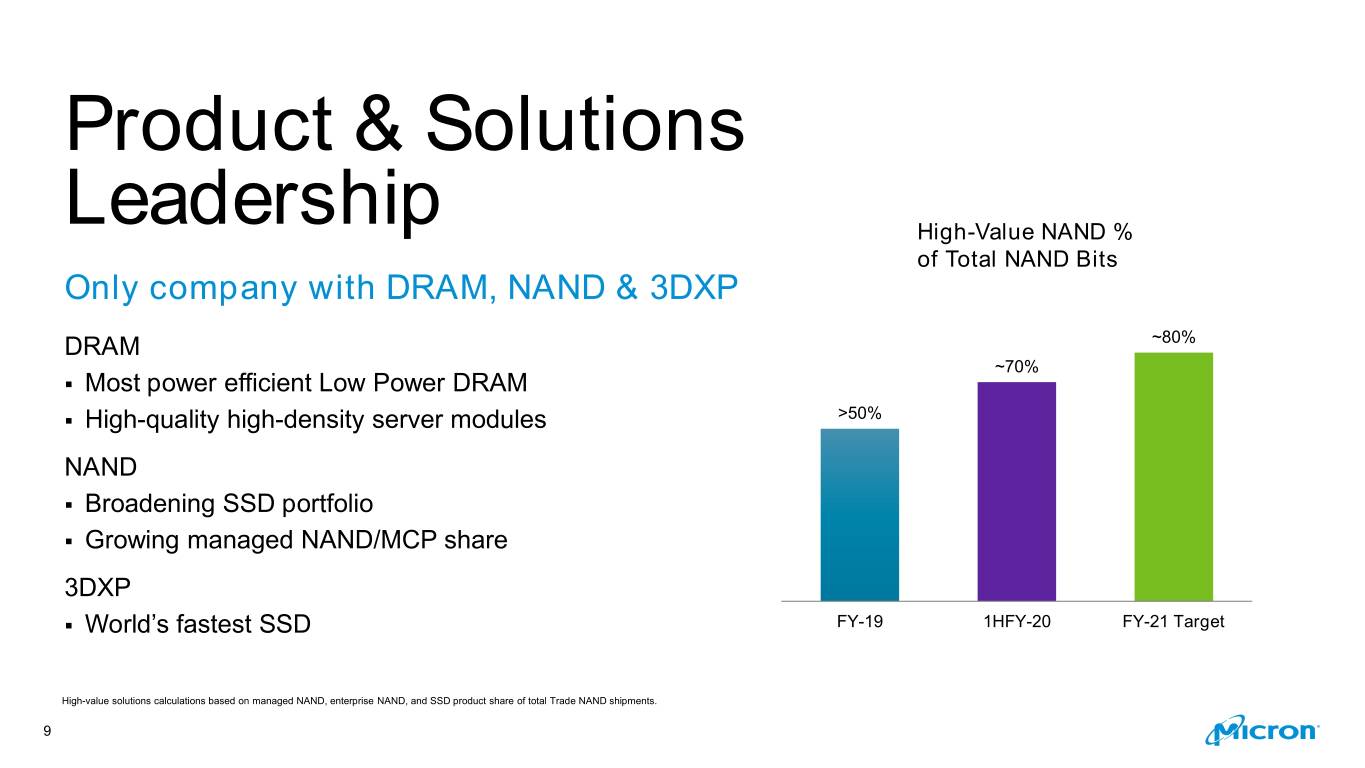
Product & Solutions Leadership High-Value NAND % of Total NAND Bits Only company with DRAM, NAND & 3DXP DRAM ~80% ~70% ▪ Most power efficient Low Power DRAM ▪ High-quality high-density server modules >50% NAND ▪ Broadening SSD portfolio ▪ Growing managed NAND/MCP share 3DXP ▪ World’s fastest SSD FY-19 1HFY-20 FY-21 Target High-value solutions calculations based on managed NAND, enterprise NAND, and SSD product share of total Trade NAND shipments. 9
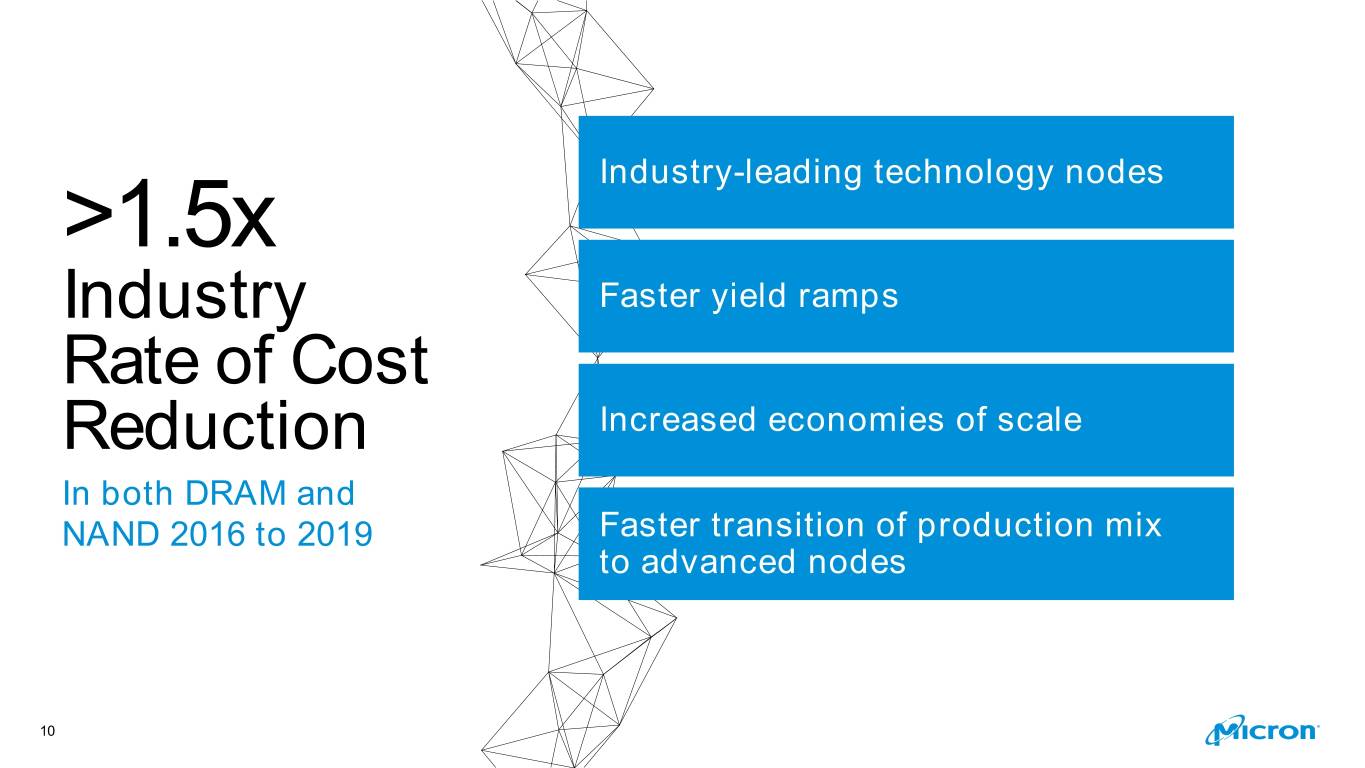
>1.5x Industry-leading technology nodes Industry Faster yield ramps Rate of Cost Reduction Increased economies of scale In both DRAM and NAND 2016 to 2019 Faster transition of production mix to advanced nodes 10
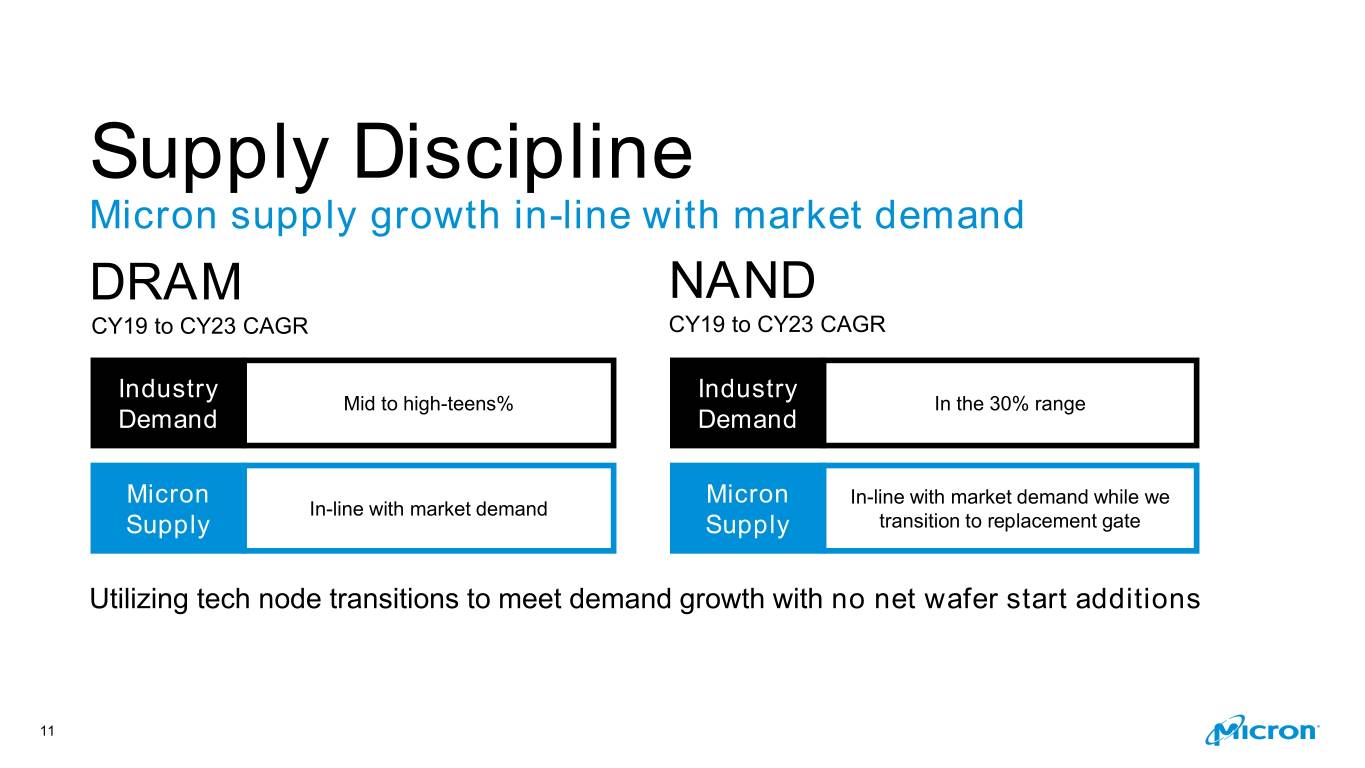
Supply Discipline Micron supply growth in-line with market demand DRAM NAND CY19 to CY23 CAGR CY19 to CY23 CAGR Industry Industry Mid to high-teens% In the 30% range Demand Demand Micron Micron In-line with market demand while we In-line with market demand Supply Supply transition to replacement gate Utilizing tech node transitions to meet demand growth with no net wafer start additions 11
Operational Excellence 12
Best-in-Class Manufacturing Practices for Competitive and Sustainable Operations Scaling up our Flexibility and Smart Environmental sites agility manufacturing responsibility 13
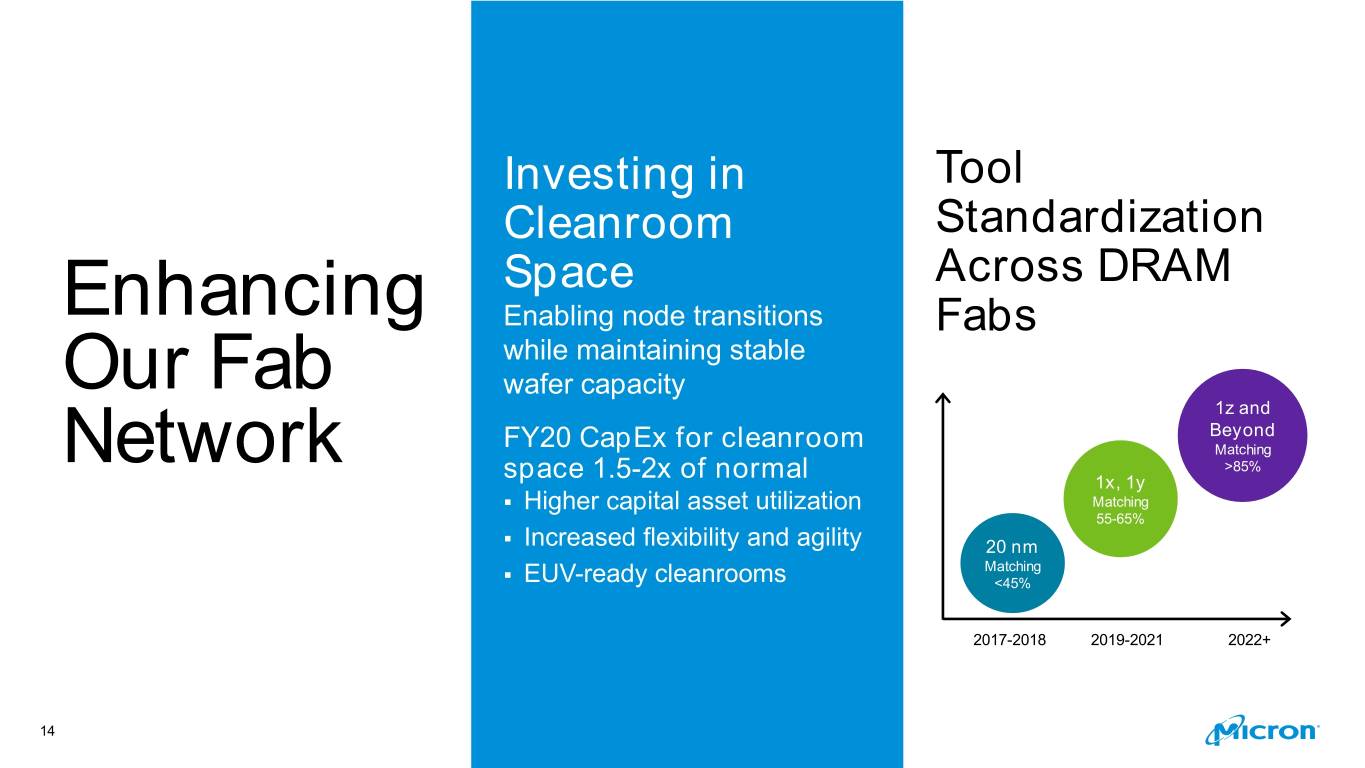
Investing in Tool Cleanroom Standardization Space Across DRAM Enhancing Enabling node transitions Fabs while maintaining stable Our Fab wafer capacity 1z and Beyond FY20 CapEx for cleanroom Matching Network >85% space 1.5-2x of normal 1x, 1y ▪ Higher capital asset utilization Matching 55-65% ▪ Increased flexibility and agility 20 nm Matching ▪ EUV-ready cleanrooms <45% 2017-2018 2019-2021 2022+ 14
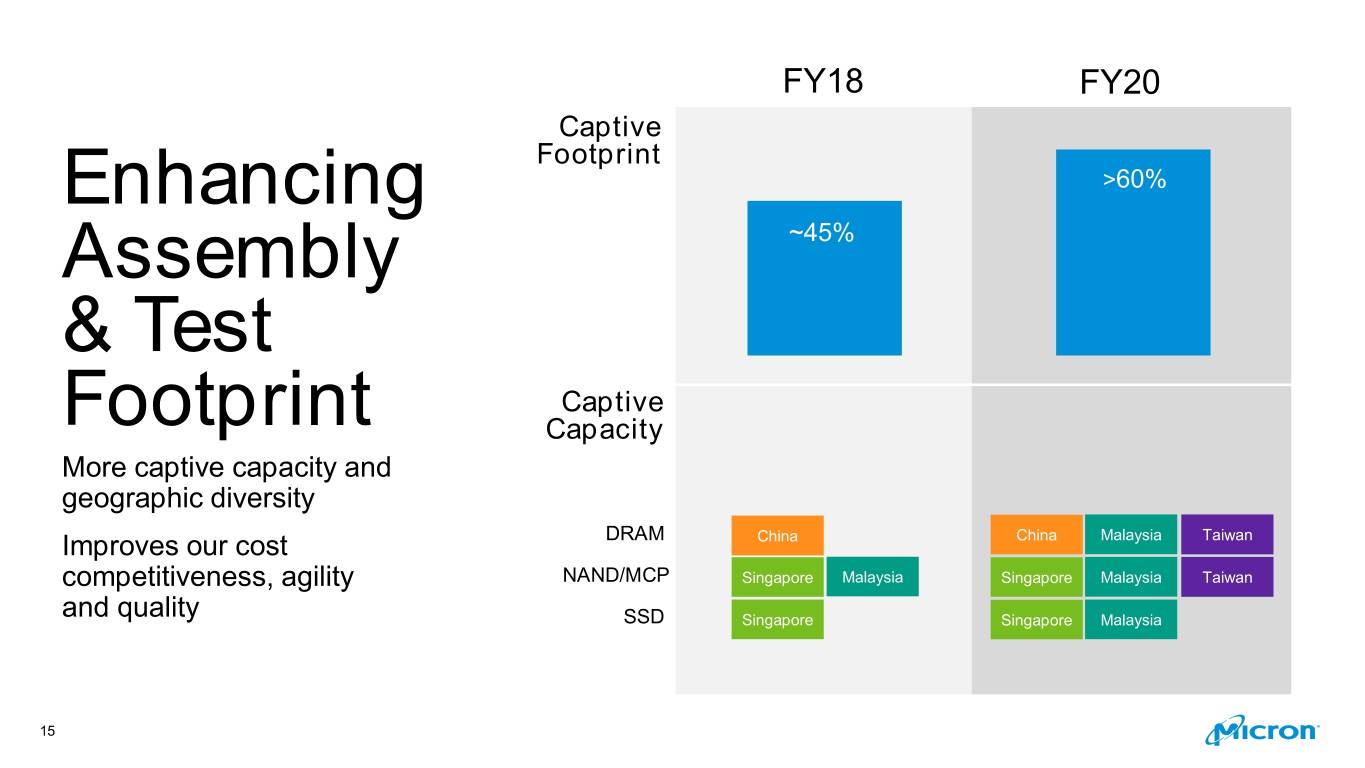
FY18 FY20 Captive Footprint Enhancing >60% Assembly ~45% & Test Captive Footprint Capacity More captive capacity and geographic diversity Improves our cost DRAM China China Malaysia MalaysiaTaiwan competitiveness, agility NAND/MCP Singapore Malaysia Singapore Malaysia MalaysiaTaiwan and quality SSD Singapore Singapore Malaysia 15
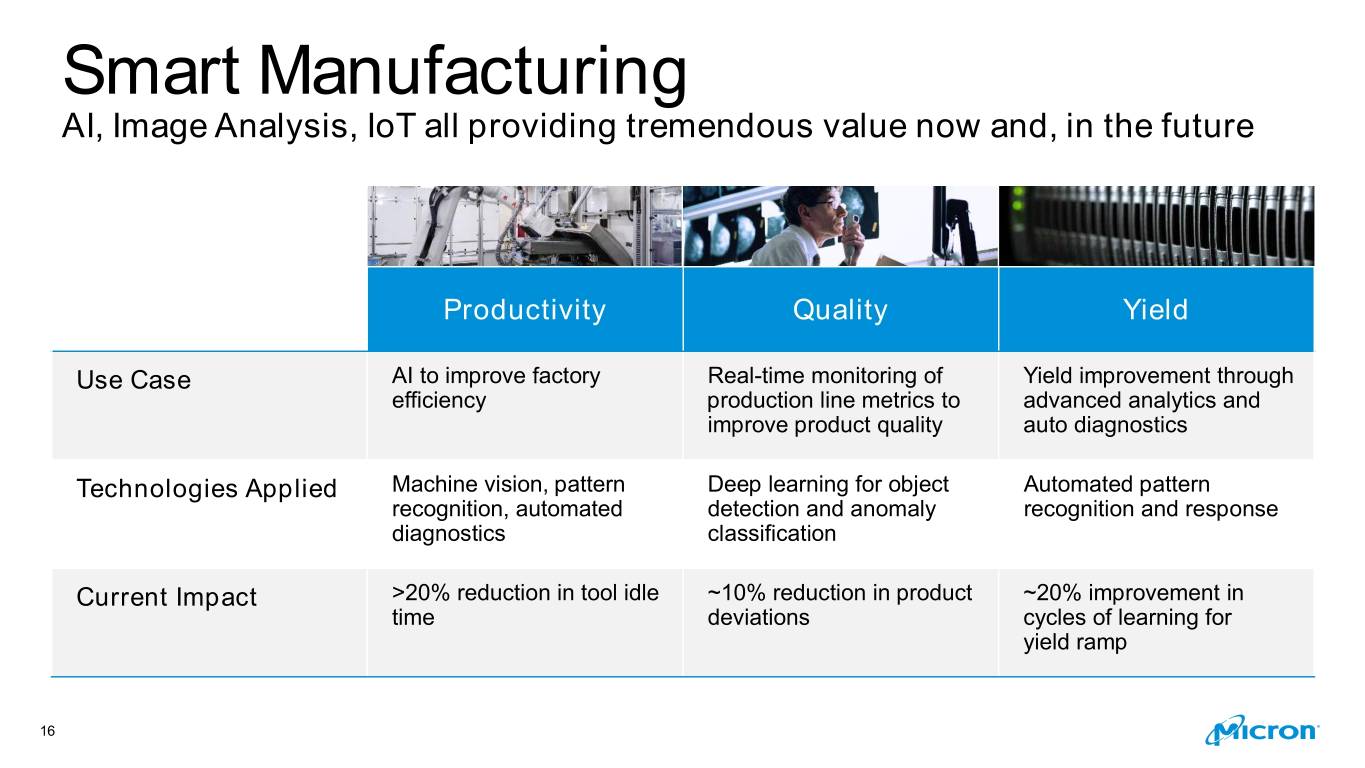
Smart Manufacturing AI, Image Analysis, IoT all providing tremendous value now and, in the future Productivity Quality Yield Use Case AI to improve factory Real-time monitoring of Yield improvement through efficiency production line metrics to advanced analytics and improve product quality auto diagnostics Technologies Applied Machine vision, pattern Deep learning for object Automated pattern recognition, automated detection and anomaly recognition and response diagnostics classification Current Impact >20% reduction in tool idle ~10% reduction in product ~20% improvement in time deviations cycles of learning for yield ramp 16
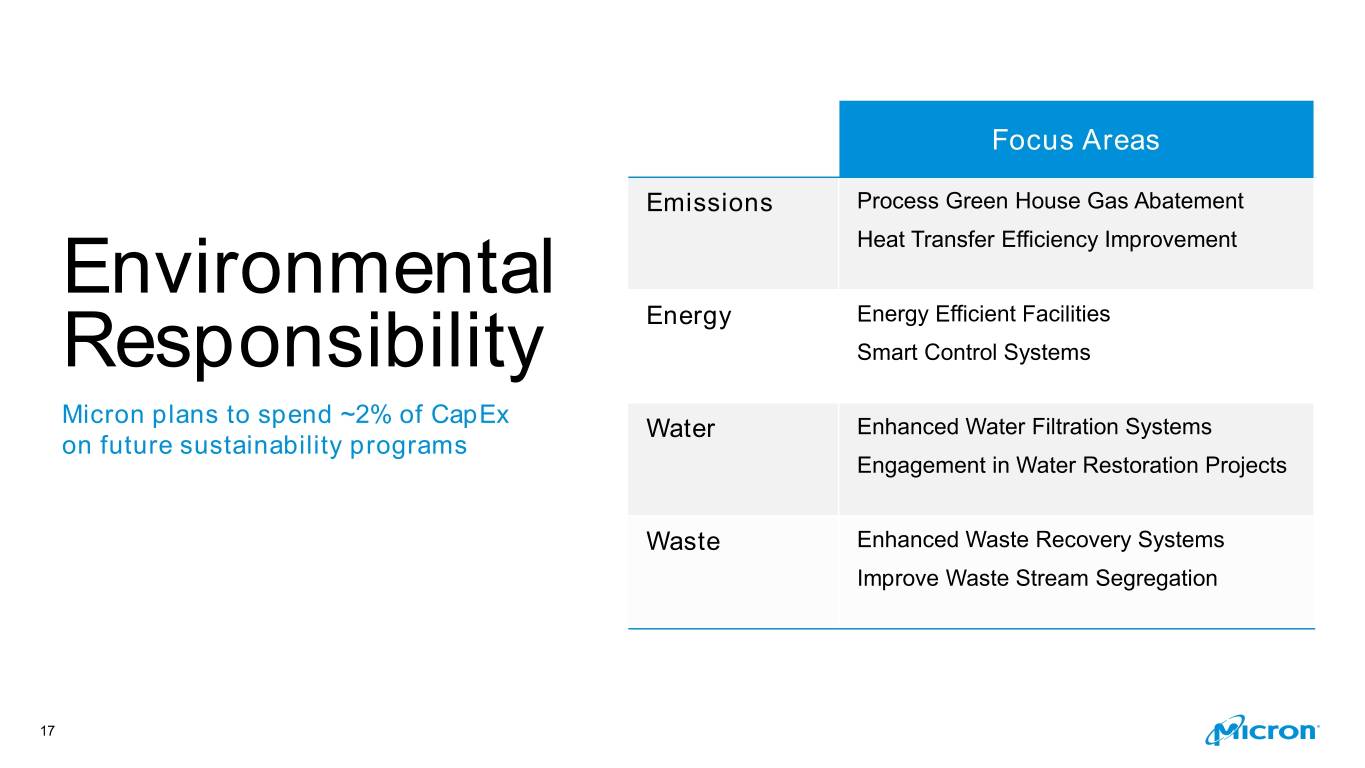
Focus Areas Emissions Process Green House Gas Abatement Environmental Heat Transfer Efficiency Improvement Energy Energy Efficient Facilities Responsibility Smart Control Systems Micron plans to spend ~2% of CapEx Water Enhanced Water Filtration Systems on future sustainability programs Engagement in Water Restoration Projects Waste Enhanced Waste Recovery Systems Improve Waste Stream Segregation 17
Results 18
Our Business Continues to Get Stronger Faster time to Enhanced Rock-solid revenue profitability balance sheet 19
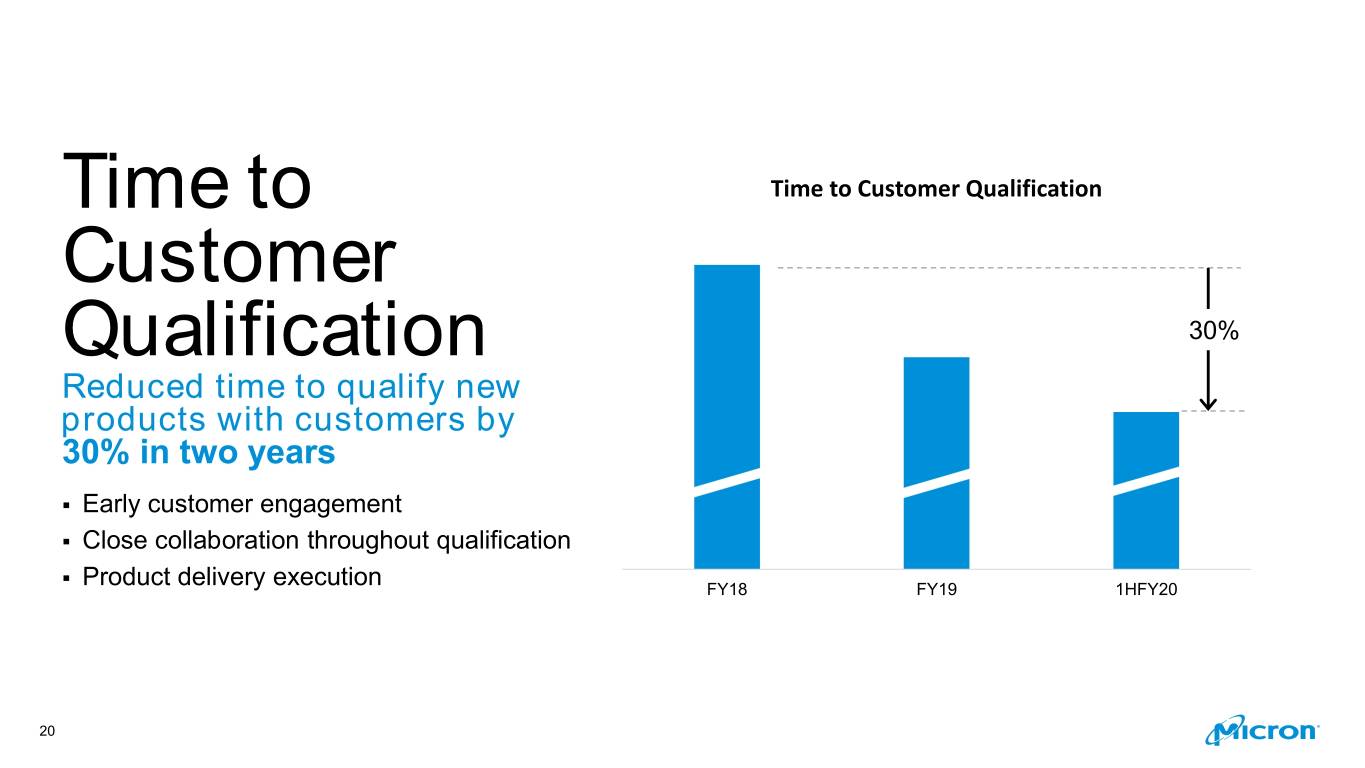
Time to Time to Customer Qualification Customer Qualification 30% Reduced time to qualify new products with customers by 30% in two years ▪ Early customer engagement ▪ Close collaboration throughout qualification ▪ Product delivery execution FY18 FY19 1HFY20 20
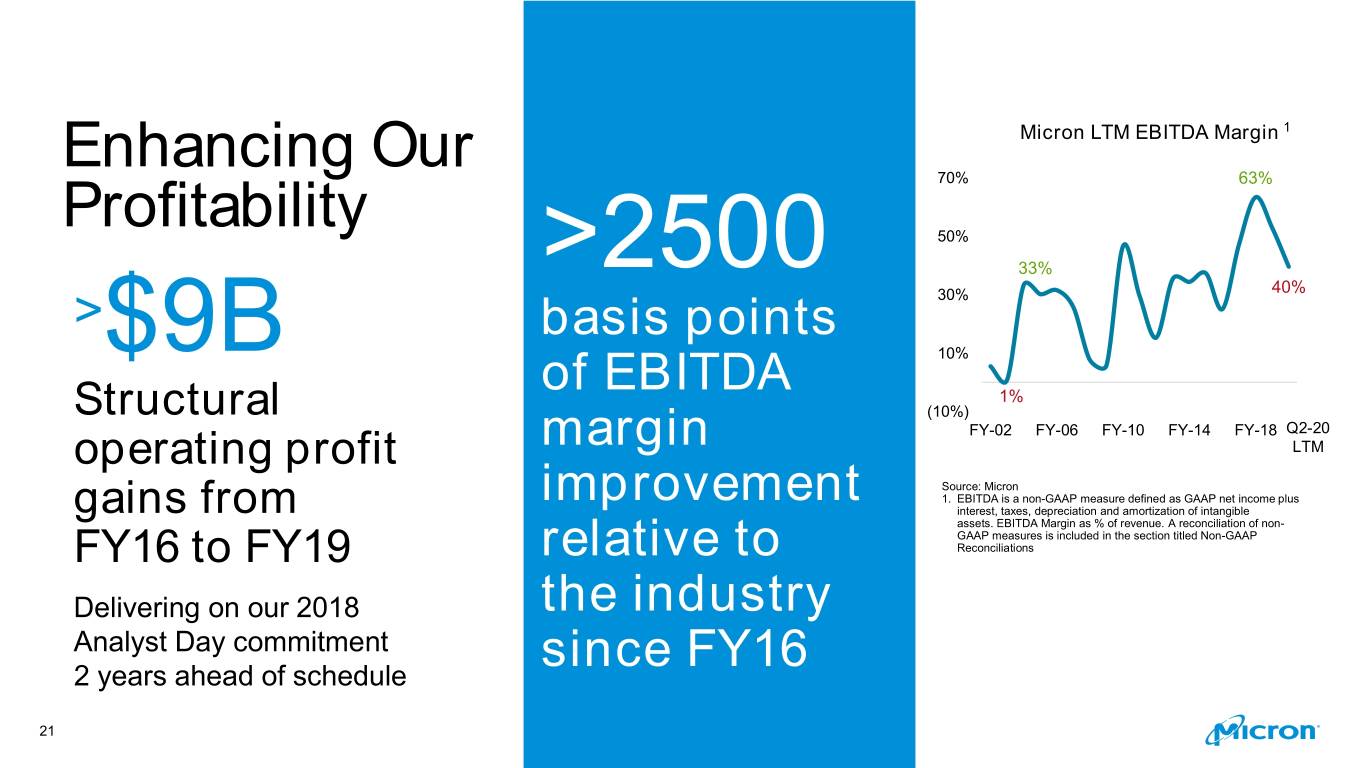
Enhancing Our Micron LTM EBITDA Margin 1 Profitability 70% 63% 50% >2500 33% 40% > basis points 30% $9B 10% of EBITDA 1% Structural (10%) FY-02 FY-06 FY-10 FY-14 FY-18 Q2-20 operating profit margin LTM Source: Micron improvement 1. EBITDA is a non-GAAP measure defined as GAAP net income plus gains from interest, taxes, depreciation and amortization of intangible assets. EBITDA Margin as % of revenue. A reconciliation of non- GAAP measures is included in the section titled Non-GAAP FY16 to FY19 relative to Reconciliations Delivering on our 2018 the industry Analyst Day commitment since FY16 2 years ahead of schedule 21
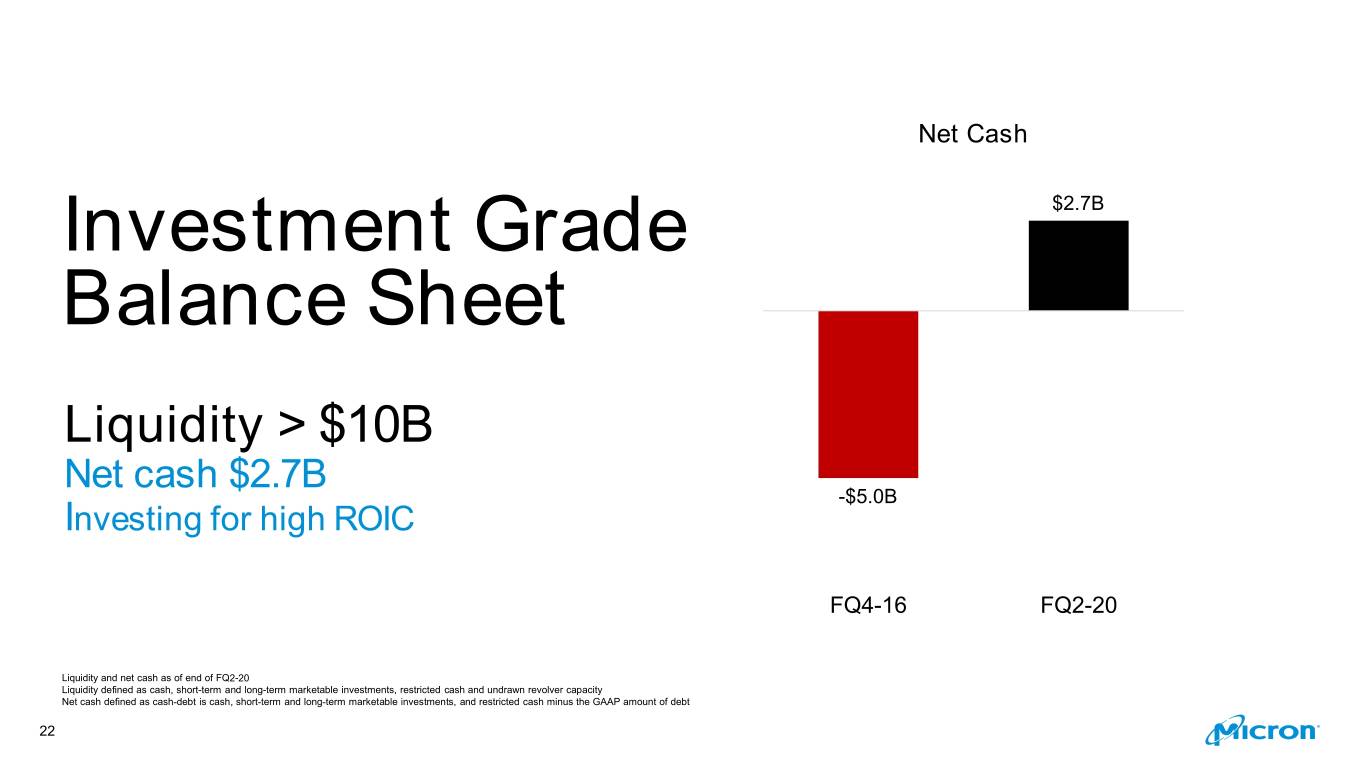
Net Cash Investment Grade $2.7B Balance Sheet Liquidity > $10B Net cash $2.7B -$5.0B Investing for high ROIC FQ4-16 FQ2-20 Liquidity and net cash as of end of FQ2-20 Liquidity defined as cash, short-term and long-term marketable investments, restricted cash and undrawn revolver capacity Net cash defined as cash-debt is cash, short-term and long-term marketable investments, and restricted cash minus the GAAP amount of debt 22
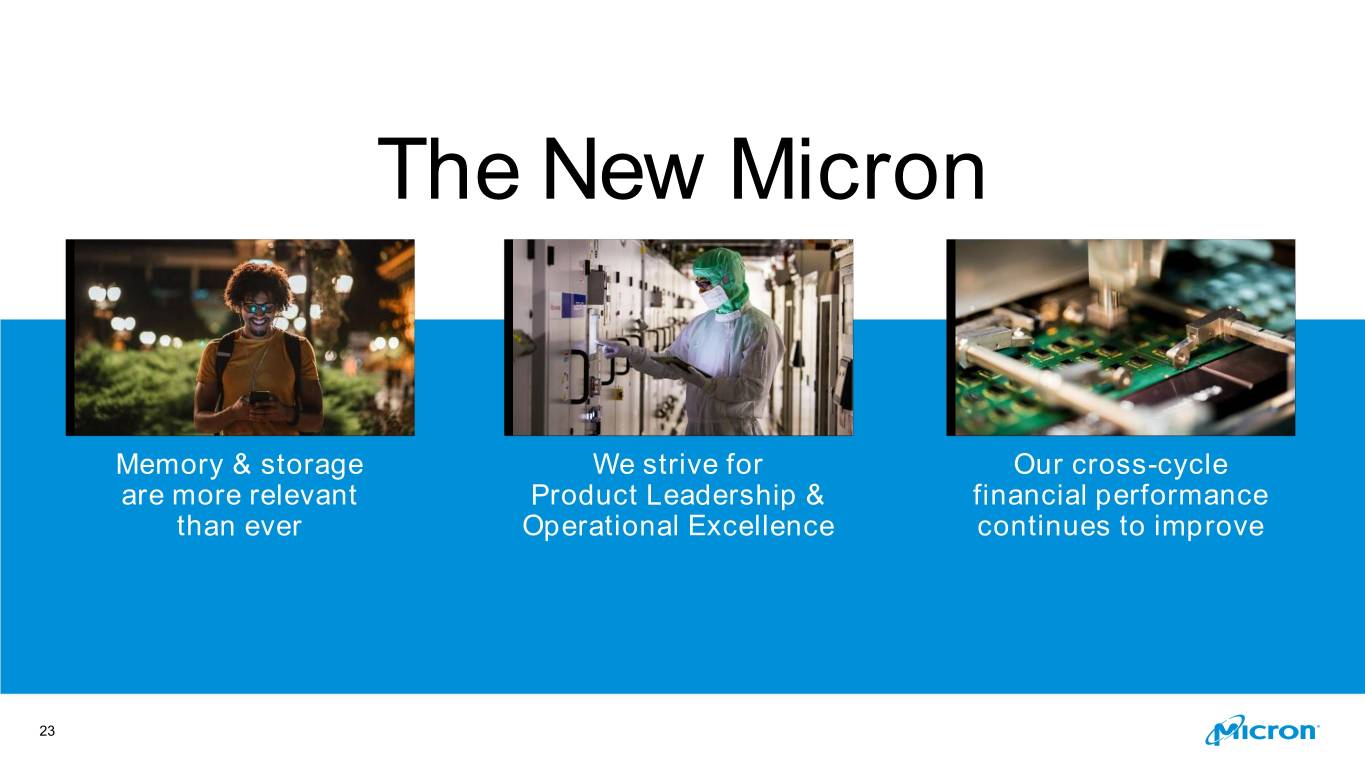
The New Micron Memory & storage We strive for Our cross-cycle are more relevant Product Leadership & financial performance than ever Operational Excellence continues to improve 23

Non-GAAP Reconciliations 24
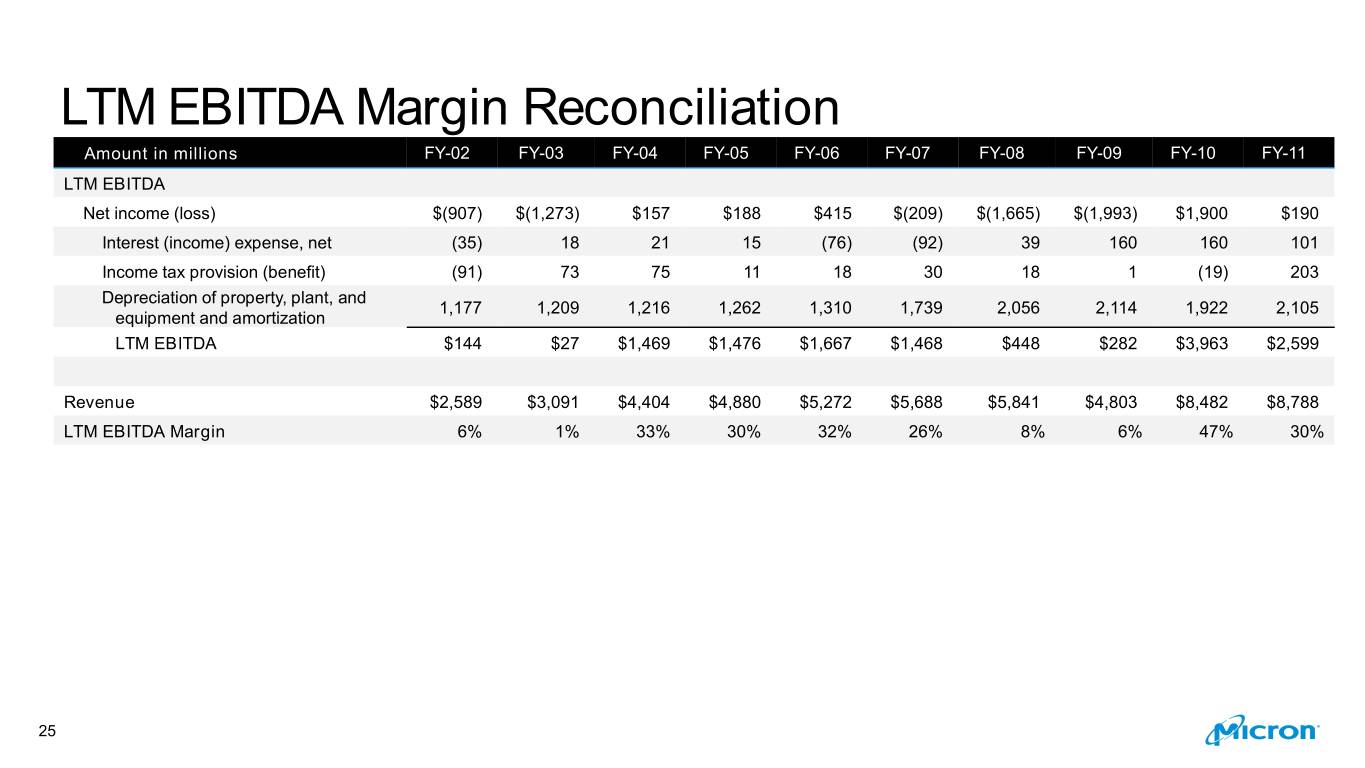
LTM EBITDA Margin Reconciliation Amount in millions FY-02 FY-03 FY-04 FY-05 FY-06 FY-07 FY-08 FY-09 FY-10 FY-11 LTM EBITDA Net income (loss) $(907) $(1,273) $157 $188 $415 $(209) $(1,665) $(1,993) $1,900 $190 Interest (income) expense, net (35) 18 21 15 (76) (92) 39 160 160 101 Income tax provision (benefit) (91) 73 75 11 18 30 18 1 (19) 203 Depreciation of property, plant, and 1,177 1,209 1,216 1,262 1,310 1,739 2,056 2,114 1,922 2,105 equipment and amortization LTM EBITDA $144 $27 $1,469 $1,476 $1,667 $1,468 $448 $282 $3,963 $2,599 Revenue $2,589 $3,091 $4,404 $4,880 $5,272 $5,688 $5,841 $4,803 $8,482 $8,788 LTM EBITDA Margin 6% 1% 33% 30% 32% 26% 8% 6% 47% 30% 25
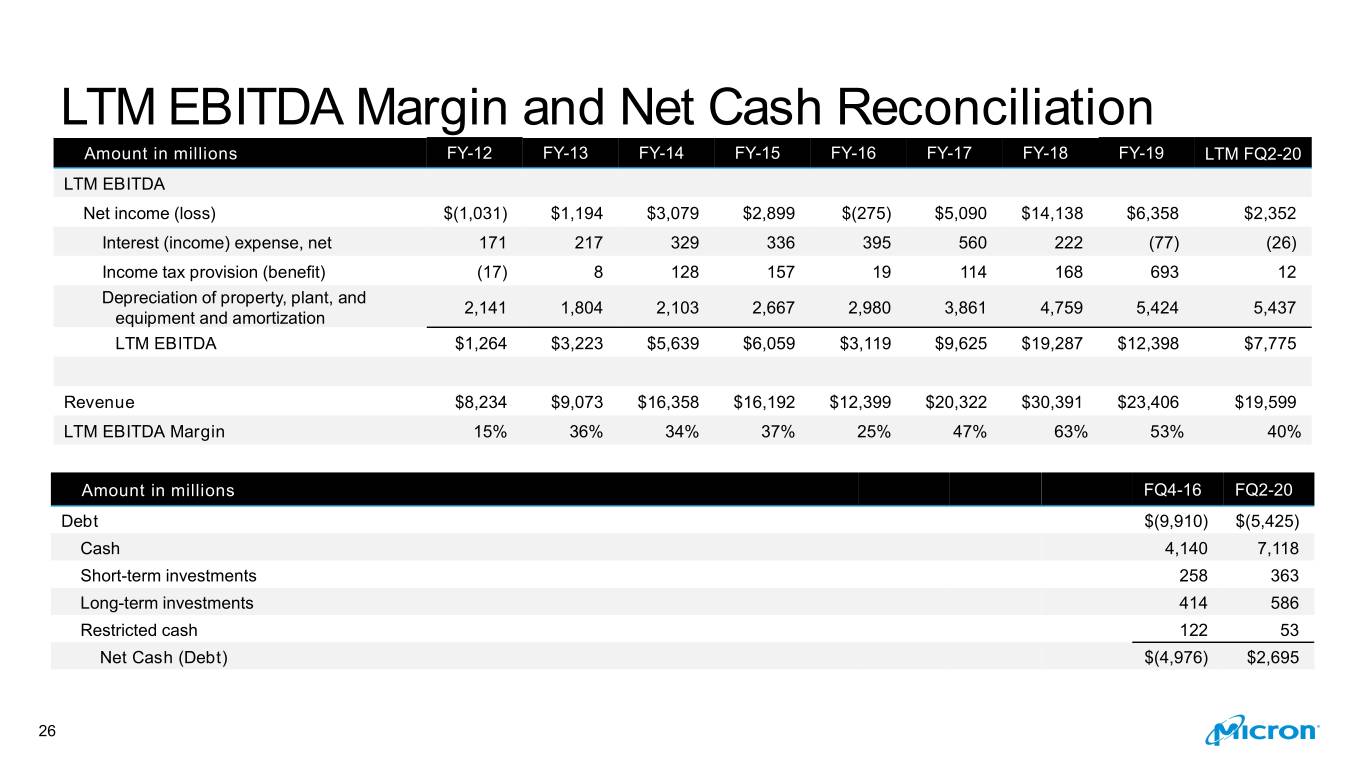
LTM EBITDA Margin and Net Cash Reconciliation Amount in millions FY-12 FY-13 FY-14 FY-15 FY-16 FY-17 FY-18 FY-19 LTM FQ2-20 LTM EBITDA Net income (loss) $(1,031) $1,194 $3,079 $2,899 $(275) $5,090 $14,138 $6,358 $2,352 Interest (income) expense, net 171 217 329 336 395 560 222 (77) (26) Income tax provision (benefit) (17) 8 128 157 19 114 168 693 12 Depreciation of property, plant, and 2,141 1,804 2,103 2,667 2,980 3,861 4,759 5,424 5,437 equipment and amortization LTM EBITDA $1,264 $3,223 $5,639 $6,059 $3,119 $9,625 $19,287 $12,398 $7,775 Revenue $8,234 $9,073 $16,358 $16,192 $12,399 $20,322 $30,391 $23,406 $19,599 LTM EBITDA Margin 15% 36% 34% 37% 25% 47% 63% 53% 40% Amount in millions FQ4-16 FQ2-20 Debt $(9,910) $(5,425) Cash 4,140 7,118 Short-term investments 258 363 Long-term investments 414 586 Restricted cash 122 53 Net Cash (Debt) $(4,976) $2,695 26
27
