Attached files
| file | filename |
|---|---|
| EX-99.1 - EX-99.1 - Great Elm Capital Group, Inc. | gec-ex991_16.htm |
| 8-K - 8-K - Great Elm Capital Group, Inc. | gec-8k_20200331.htm |
Great Elm Capital Group, Inc. Investor Presentation – Quarter Ended March 31, 2020 May 12, 2020 © 2020 Great Elm Capital Group, Inc. Exhibit 99.2
© 2020 Great Elm Capital Group, Inc. Disclaimer Statements in this press release that are “forward-looking” statements, including statements regarding expected growth, profitability and outlook involve risks and uncertainties that may individually or collectively impact the matters described herein. Investors are cautioned not to place undue reliance on any such forward-looking statements, which speak only as of the date they are made and represent Great Elm’s assumptions and expectations in light of currently available information. These statements involve risks, variables and uncertainties, and Great Elm’s actual performance results may differ from those projected, and any such differences may be material. Among the key factors that could cause actual results to differ materially from those projected in the forward-looking statements are risks associated with the economic impact of the COVID-19 pandemic on Great Elm’s businesses, including DME as well as GECC and its portfolio investments. For information on certain factors that could cause actual events or results to differ materially from Great Elm’s expectations, please see Great Elm’s filings with the SEC, including its most recent annual report on Form 10-K and subsequent reports on Forms 10-Q and 8-K. Additional information relating to Great Elm’s financial position and results of operations is also contained in Great Elm’s annual and quarterly reports filed with the SEC and available for download at its website www.greatelmcap.com or at the SEC website www.sec.gov. Non-GAAP Financial Measures The SEC has adopted rules to regulate the use in filings with the SEC, and in public disclosures, of financial measures that are not in accordance with US GAAP, such as adjusted earnings before interest, taxes, depreciation and amortization (“Adjusted EBITDA”) and free cash flow. See the Appendix for important information regarding the use of non-GAAP financial measures and reconciliations of non-GAAP measures to their most directly comparable GAAP measures. This presentation does not constitute an offer of any securities for sale.
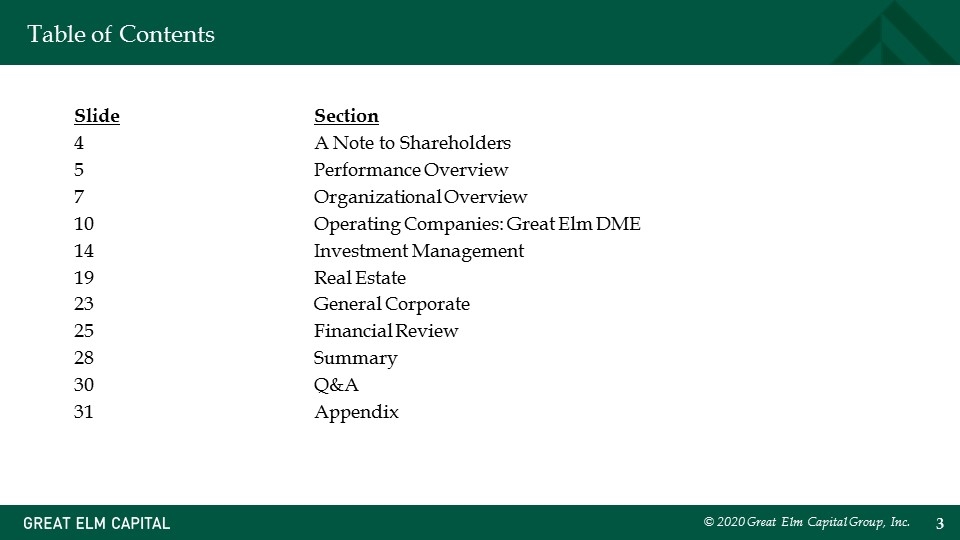
© 2020 Great Elm Capital Group, Inc. SlideSection 4A Note to Shareholders 5Performance Overview 7 Organizational Overview 10Operating Companies: Great Elm DME 14Investment Management 19Real Estate 23General Corporate 25Financial Review 28Summary 30Q&A 31Appendix Table of Contents
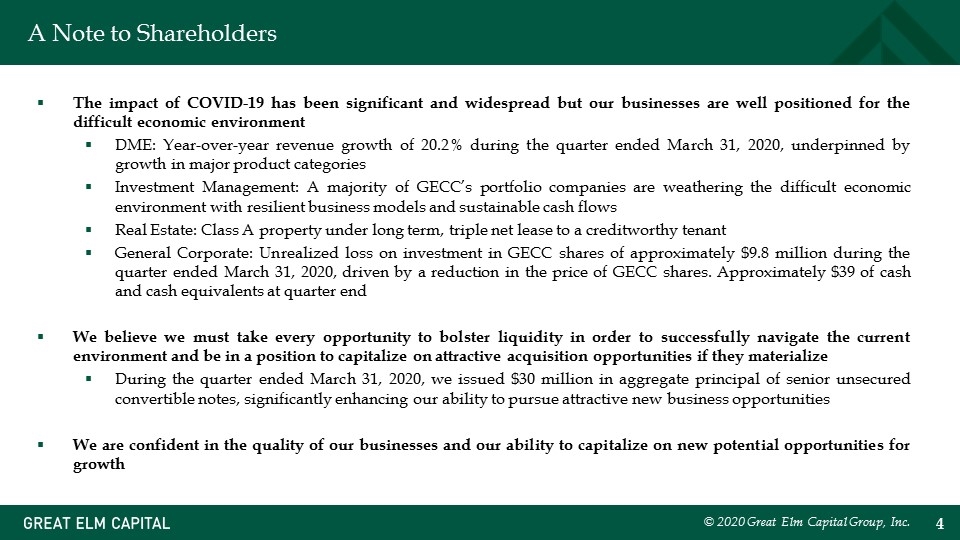
A Note to Shareholders The impact of COVID-19 has been significant and widespread but our businesses are well positioned for the difficult economic environment DME: Year-over-year revenue growth of 20.2% during the quarter ended March 31, 2020, underpinned by growth in major product categories Investment Management: A majority of GECC’s portfolio companies are weathering the difficult economic environment with resilient business models and sustainable cash flows Real Estate: Class A property under long term, triple net lease to a creditworthy tenant General Corporate: Unrealized loss on investment in GECC shares of approximately $9.8 million during the quarter ended March 31, 2020, driven by a reduction in the price of GECC shares. Approximately $39 of cash and cash equivalents at quarter end We believe we must take every opportunity to bolster liquidity in order to successfully navigate the current environment and be in a position to capitalize on attractive acquisition opportunities if they materialize During the quarter ended March 31, 2020, we issued $30 million in aggregate principal of senior unsecured convertible notes, significantly enhancing our ability to pursue attractive new business opportunities We are confident in the quality of our businesses and our ability to capitalize on new potential opportunities for growth © 2020 Great Elm Capital Group, Inc.
Performance Overview © 2020 Great Elm Capital Group, Inc.
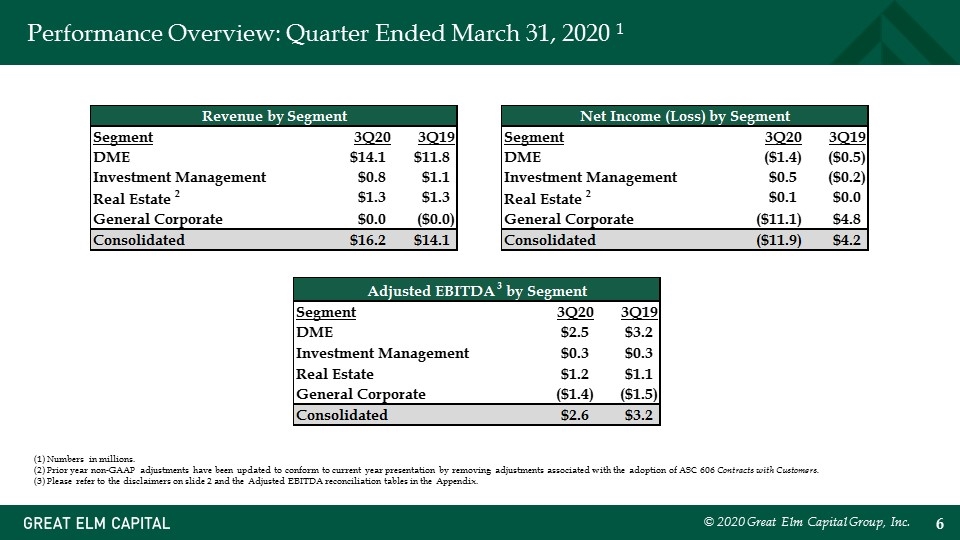
Performance Overview: Quarter Ended March 31, 2020 1 © 2020 Great Elm Capital Group, Inc. (1) Numbers in millions. (2) Prior year non-GAAP adjustments have been updated to conform to current year presentation by removing adjustments associated with the adoption of ASC 606 Contracts with Customers. (3) Please refer to the disclaimers on slide 2 and the Adjusted EBITDA reconciliation tables in the Appendix. Revenue by Segment Segment 3Q20 3Q19 DME $14.131 $11.751999999999999 Investment Management $0.82899999999999996 $1.06 Real Estate 2 $1.276 $1.272 General Corporate $0 $-5.0000000000000001E-3 Consolidated $16.236000000000001 $14.078999999999999 Net Income (Loss) by Segment Segment 3Q20 3Q19 DME $-1.3979999999999999 $-0.51700000000000002 Investment Management $0.49099999999999999 $-0.16300000000000001 Real Estate 2 $6.7000000000000004E-2 $3.7999999999999999E-2 General Corporate $-11.077999999999999 $4.843 Consolidated $-11.917999999999999 $4.2009999999999996 Adjusted EBITDA 3 by Segment Segment 3Q20 3Q19 DME $2.5259999999999998 $3.2170000000000001 Investment Management 4 $0.307 $0.30199999999999999 Real Estate 2 $1.151 $1.141 General Corporate $-1.403 $-1.4790000000000001 Consolidated $2.581 $3.181 Revenue by Segment Segment 3Q20 3Q19 DME $14.131 $11.751999999999999 Investment Management $0.82899999999999996 $1.06 Real Estate 2 $1.276 $1.272 General Corporate $0 $-5.0000000000000001E-3 Consolidated $16.236000000000001 $14.078999999999999 Net Income (Loss) by Segment Segment 3Q20 3Q19 DME $-1.3979999999999999 $-0.51700000000000002 Investment Management $0.49099999999999999 $-0.16300000000000001 Real Estate 2 $6.7000000000000004E-2 $3.7999999999999999E-2 General Corporate $-11.077999999999999 $4.843 Consolidated $-11.917999999999999 $4.2009999999999996 Adjusted EBITDA 3 by Segment Segment 3Q20 3Q19 DME $2.5259999999999998 $3.2170000000000001 Investment Management 4 $0.307 $0.30199999999999999 Real Estate 2 $1.151 $1.141 General Corporate $-1.403 $-1.4790000000000001 Consolidated $2.581 $3.181 Revenue by Segment Segment 3Q20 3Q19 YoY DME $14.131 $11.751999999999999 0.20243362831858414 Investment Management $0.82899999999999996 $1.06 -0.21792452830188691 Real Estate $1.276 $1.272 .3% General Corporate $0 $-5.0000000000000001E-3 -100.0% Consolidated $16.236000000000001 $14.078999999999999 0.15320690389942482 Net Income (Loss) by Segment Segment 3Q20 3Q19 DME $-1.3979999999999999 $-0.51700000000000002 1.704061895551257 Investment Management $0.49099999999999999 $-0.16300000000000001 -4.0122699386503067 Real Estate $6.7000000000000004E-2 $3.7999999999999999E-2 0.76315789473684226 General Corporate $-11.077999999999999 $4.843 -3.2874251497005988 Consolidated $-11.917999999999999 $4.2009999999999996 -3.8369435848607476 Adjusted EBITDA 3 by Segment Segment 3Q20 3Q19 DME $2.5259999999999998 $3.2170000000000001 -0.21479639415604612 Investment Management $0.307 $0.30199999999999999 1.7% Real Estate $1.151 $1.141 .9% General Corporate $-1.403 $-1.4790000000000001 -5.1% Consolidated $2.581 $3.181 -0.18861993083935868
Organizational Overview © 2020 Great Elm Capital Group, Inc.
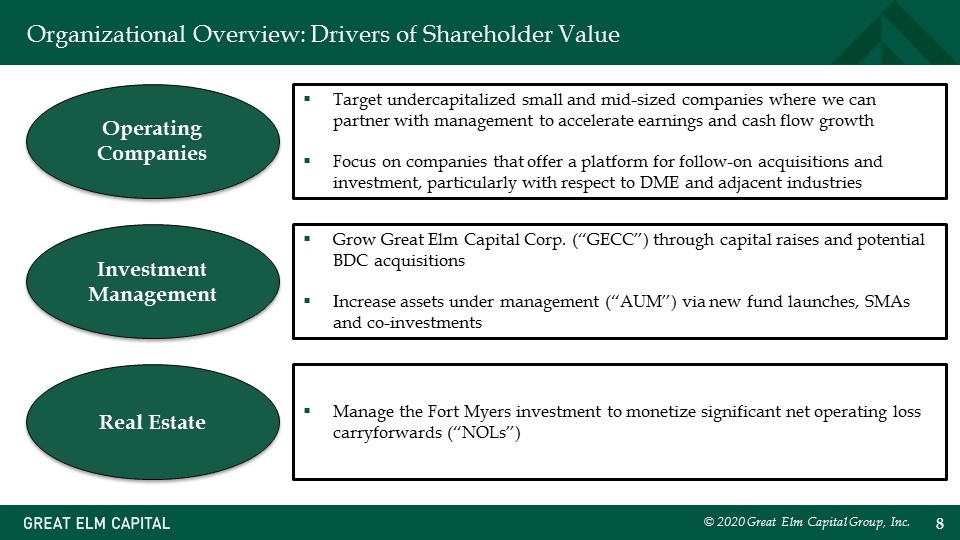
© 2020 Great Elm Capital Group, Inc. Organizational Overview: Drivers of Shareholder Value Operating Companies Real Estate Investment Management Target undercapitalized small and mid-sized companies where we can partner with management to accelerate earnings and cash flow growth Focus on companies that offer a platform for follow-on acquisitions and investment, particularly with respect to DME and adjacent industries Grow Great Elm Capital Corp. (“GECC”) through capital raises and potential BDC acquisitions Increase assets under management (“AUM”) via new fund launches, SMAs and co-investments Manage the Fort Myers investment to monetize significant net operating loss carryforwards (“NOLs”)
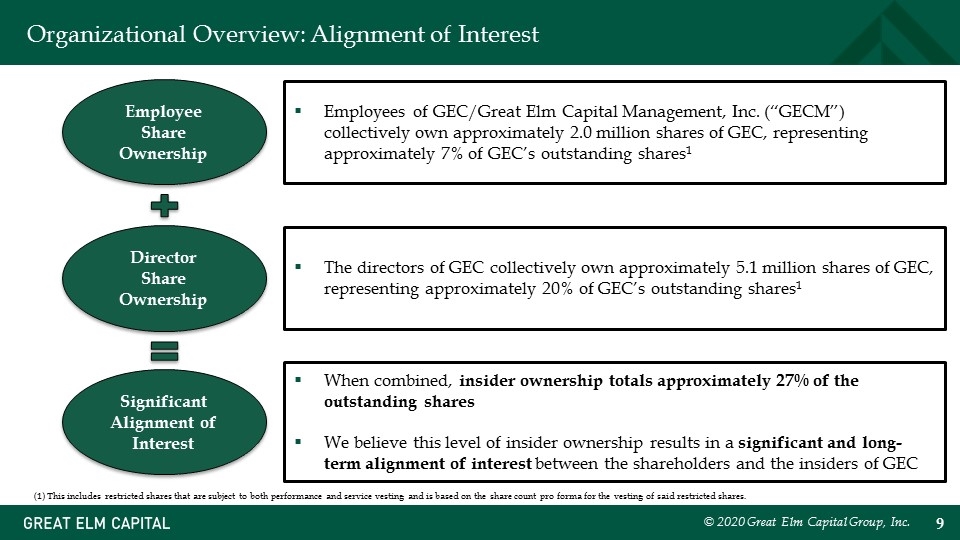
© 2020 Great Elm Capital Group, Inc. Organizational Overview: Alignment of Interest When combined, insider ownership totals approximately 27% of the outstanding shares We believe this level of insider ownership results in a significant and long-term alignment of interest between the shareholders and the insiders of GEC Director Share Ownership Employees of GEC/Great Elm Capital Management, Inc. (“GECM”) collectively own approximately 2.0 million shares of GEC, representing approximately 7% of GEC’s outstanding shares1 The directors of GEC collectively own approximately 5.1 million shares of GEC, representing approximately 20% of GEC’s outstanding shares1 Significant Alignment of Interest Employee Share Ownership (1) This includes restricted shares that are subject to both performance and service vesting and is based on the share count pro forma for the vesting of said restricted shares.

Operating Companies: Great Elm DME © 2020 Great Elm Capital Group, Inc.
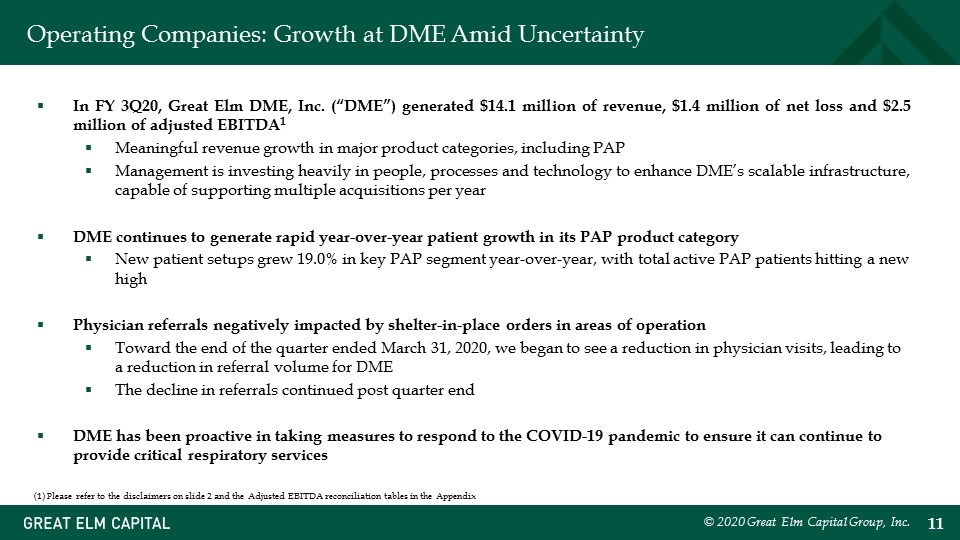
In FY 3Q20, Great Elm DME, Inc. (“DME”) generated $14.1 million of revenue, $1.4 million of net loss and $2.5 million of adjusted EBITDA1 Meaningful revenue growth in major product categories, including PAP Management is investing heavily in people, processes and technology to enhance DME’s scalable infrastructure, capable of supporting multiple acquisitions per year DME continues to generate rapid year-over-year patient growth in its PAP product category New patient setups grew 19.0% in key PAP segment year-over-year, with total active PAP patients hitting a new high Physician referrals negatively impacted by shelter-in-place orders in areas of operation Toward the end of the quarter ended March 31, 2020, we began to see a reduction in physician visits, leading to a reduction in referral volume for DME The decline in referrals continued post quarter end DME has been proactive in taking measures to respond to the COVID-19 pandemic to ensure it can continue to provide critical respiratory services © 2020 Great Elm Capital Group, Inc. (1) Please refer to the disclaimers on slide 2 and the Adjusted EBITDA reconciliation tables in the Appendix Operating Companies: Growth at DME Amid Uncertainty
Acknowledging the many challenges in the current business environment, DME seeks to partner with companies in tangential and overlapping markets Exploring opportunities for corporate development with respiratory-focused, durable medical equipment businesses may result in relationships that provide stabilization in a fragmented industry In addition, these opportunities could help to further diversify DME’s payor and product mix DME also seeks to explore complementary product lines and services that can leverage the company’s valuable contracts, referral sources, customer bases and infrastructure © 2020 Great Elm Capital Group, Inc. Operating Companies: M&A
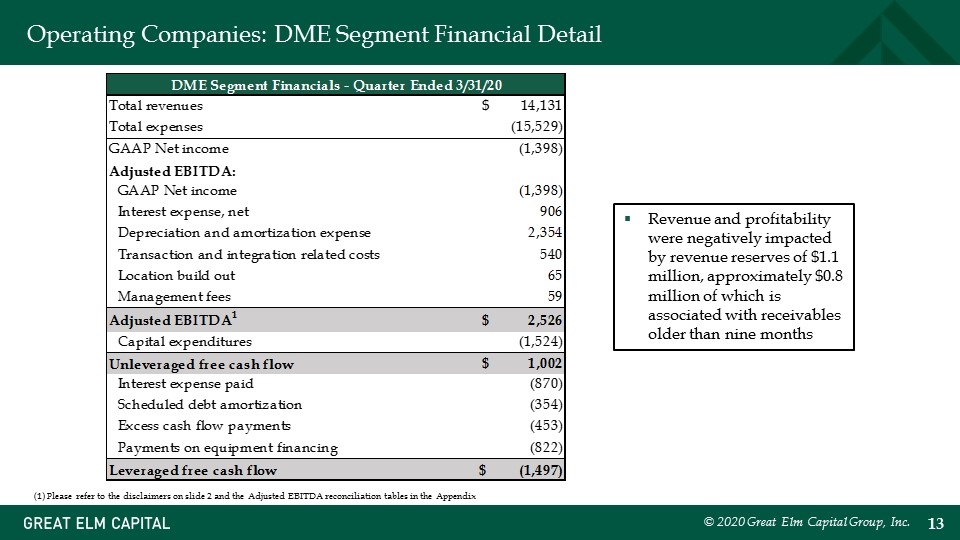
Operating Companies: DME Segment Financial Detail © 2020 Great Elm Capital Group, Inc. (1) Please refer to the disclaimers on slide 2 and the Adjusted EBITDA reconciliation tables in the Appendix Revenue and profitability were negatively impacted by revenue reserves of $1.1 million, approximately $0.8 million of which is associated with receivables older than nine months Great Elm Capital Group, Inc. DME Results DME Segment Financials - Quarter Ended 3/31/20 Total revenues $14,131.33367 MSR Total expenses ,-15,529.108789999995 MSR GAAP Net income -1,397.7751199999948 Adjusted EBITDA: GAAP Net income -1,397.7751199999948 Interest expense, net 906.27076999999997 Depreciation and amortization expense 2,354.1745799999999 MNG note: this includes deprecation on rental equipment included in cost of rentals Transaction and integration related costs 539.97606000000007 C Location build out 65.309840000000008 Management fees 58.981750000000005 MNG Adjusted EBITDA1 $2,525.937880000005 MNG Capital expenditures -1,524 A Unleveraged free cash flow $1,001.937880000005 Interest expense paid -,870 TB - DME Inc. Scheduled debt amortization -,354 Excess cash flow payments -,453 Payments on equipment financing -,822 Leveraged free cash flow $-1,497.62119999995 $0 $-1,750.62119999995
Investment Management © 2020 Great Elm Capital Group, Inc.
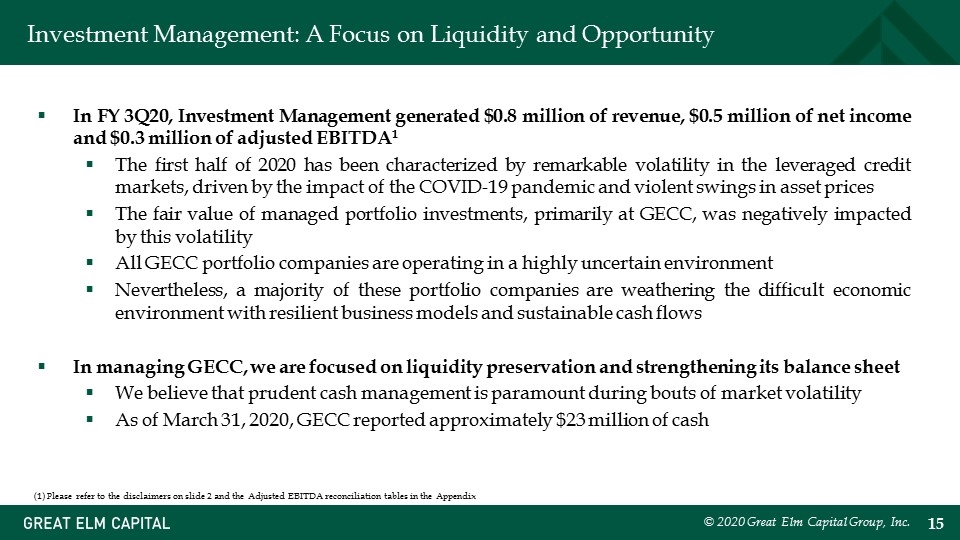
Investment Management: A Focus on Liquidity and Opportunity In FY 3Q20, Investment Management generated $0.8 million of revenue, $0.5 million of net income and $0.3 million of adjusted EBITDA1 The first half of 2020 has been characterized by remarkable volatility in the leveraged credit markets, driven by the impact of the COVID-19 pandemic and violent swings in asset prices The fair value of managed portfolio investments, primarily at GECC, was negatively impacted by this volatility All GECC portfolio companies are operating in a highly uncertain environment Nevertheless, a majority of these portfolio companies are weathering the difficult economic environment with resilient business models and sustainable cash flows In managing GECC, we are focused on liquidity preservation and strengthening its balance sheet We believe that prudent cash management is paramount during bouts of market volatility As of March 31, 2020, GECC reported approximately $23 million of cash © 2020 Great Elm Capital Group, Inc. (1) Please refer to the disclaimers on slide 2 and the Adjusted EBITDA reconciliation tables in the Appendix
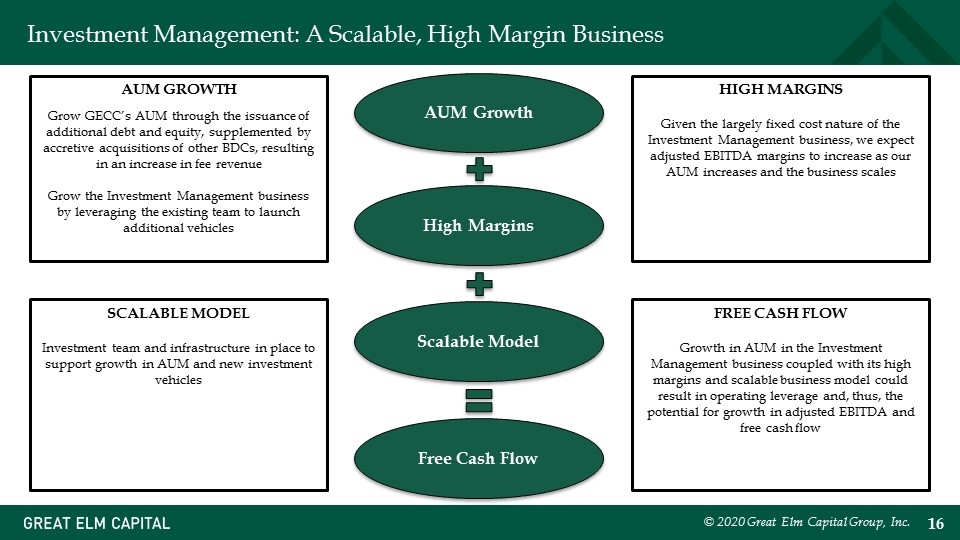
© 2020 Great Elm Capital Group, Inc. Investment Management: A Scalable, High Margin Business AUM Growth High Margins Scalable Model Free Cash Flow AUM GROWTH Grow GECC’s AUM through the issuance of additional debt and equity, supplemented by accretive acquisitions of other BDCs, resulting in an increase in fee revenue Grow the Investment Management business by leveraging the existing team to launch additional vehicles HIGH MARGINS Given the largely fixed cost nature of the Investment Management business, we expect adjusted EBITDA margins to increase as our AUM increases and the business scales SCALABLE MODEL Investment team and infrastructure in place to support growth in AUM and new investment vehicles FREE CASH FLOW Growth in AUM in the Investment Management business coupled with its high margins and scalable business model could result in operating leverage and, thus, the potential for growth in adjusted EBITDA and free cash flow
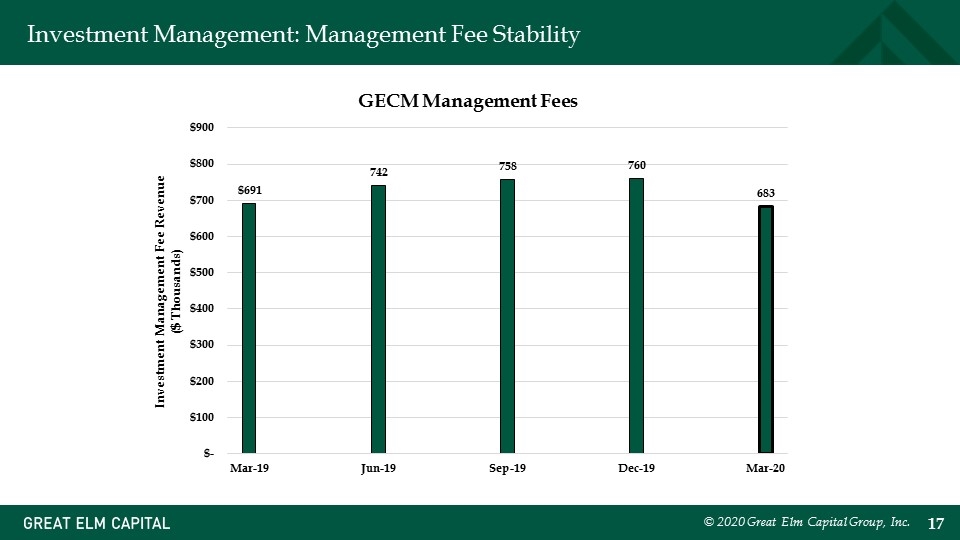
© 2020 Great Elm Capital Group, Inc. Investment Management: Management Fee Stability
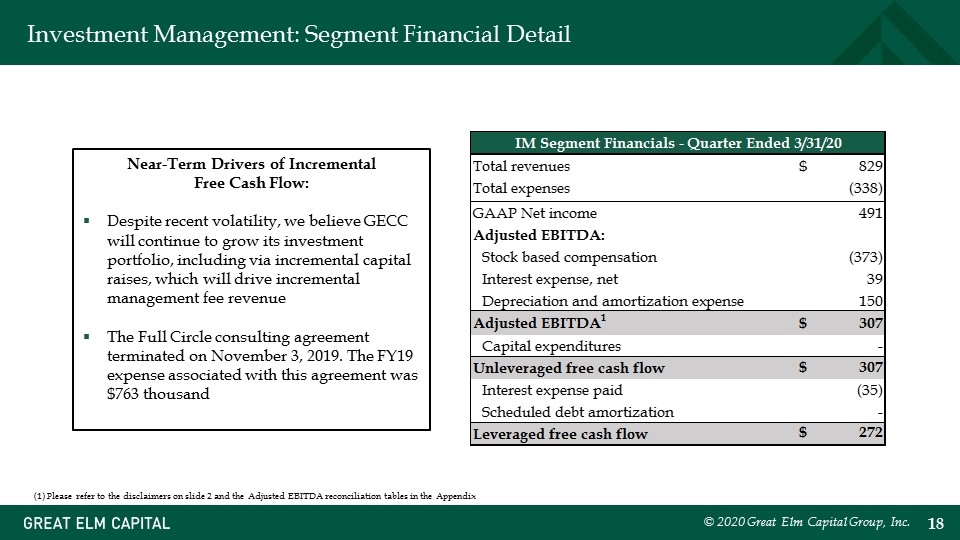
Investment Management: Segment Financial Detail © 2020 Great Elm Capital Group, Inc. Near-Term Drivers of Incremental Free Cash Flow: Despite recent volatility, we believe GECC will continue to grow its investment portfolio, including via incremental capital raises, which will drive incremental management fee revenue The Full Circle consulting agreement terminated on November 3, 2019. The FY19 expense associated with this agreement was $763 thousand (1) Please refer to the disclaimers on slide 2 and the Adjusted EBITDA reconciliation tables in the Appendix Great Elm Capital Group, Inc. IM Results IM Segment Financials - Quarter Ended 3/31/20 Total revenues $829.35563999999999 MSR Total expenses -,337.64188000000001 MSR GAAP Net income 490.71375999999998 Adjusted EBITDA: Stock based compensation -,373.16941000000003 MNG (negative because of PSA adjustment) Interest expense, net 39.084290000000003 Depreciation and amortization expense 150.26635000000002 Adjusted EBITDA1 $306.89499000000001 MNG Capital expenditures 0 Unleveraged free cash flow $306.89499000000001 Interest expense paid -35 Scheduled debt amortization 0 GP Corp payment Leveraged free cash flow $271.89499000000001 272 $-0.10500999999999294 MSR From MD&A/Notes segment results worksheet MNG From MD&A non-GAAP measurements

Real Estate © 2020 Great Elm Capital Group, Inc.
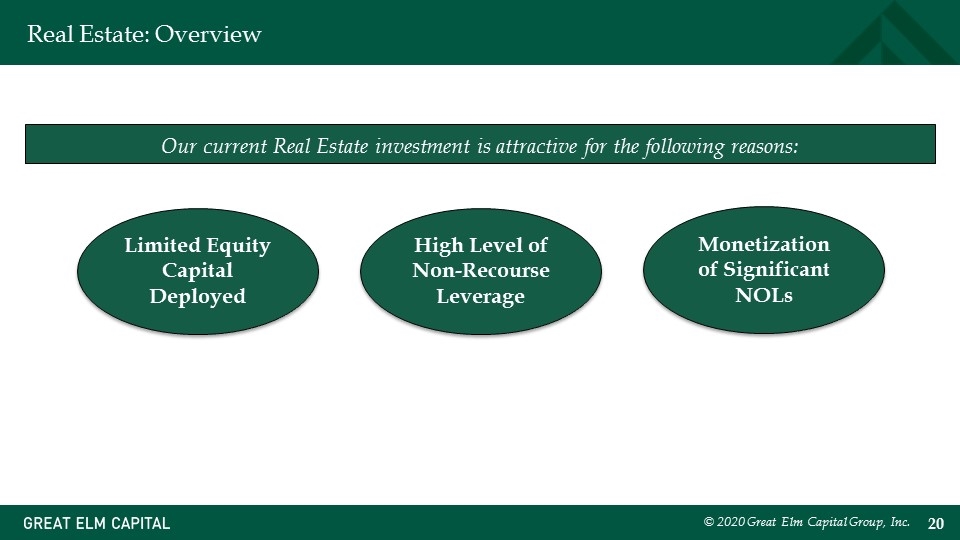
© 2020 Great Elm Capital Group, Inc. Real Estate: Overview Our current Real Estate investment is attractive for the following reasons: Limited Equity Capital Deployed High Level of Non-Recourse Leverage Monetization of Significant NOLs
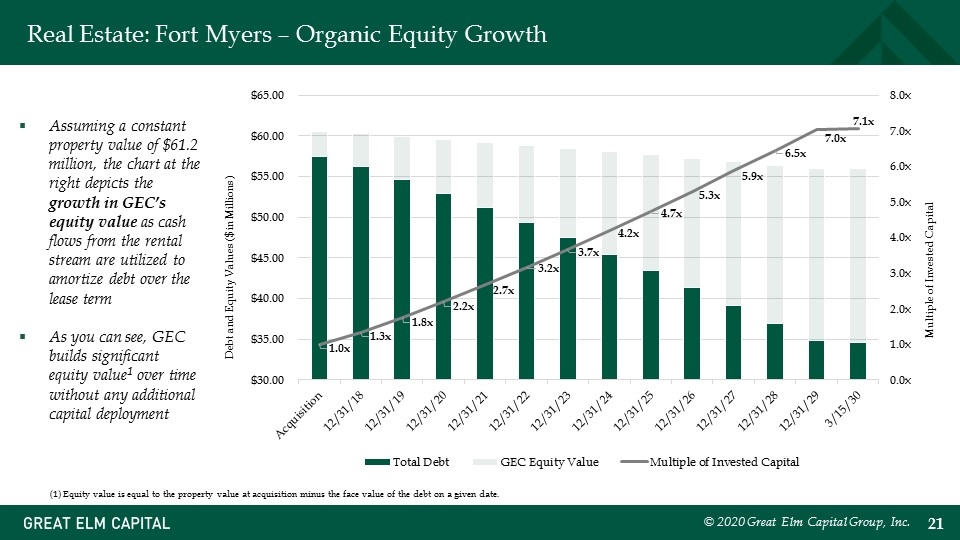
Real Estate: Fort Myers – Organic Equity Growth © 2020 Great Elm Capital Group, Inc. Debt and Equity Values ($ in Millions) Multiple of Invested Capital Assuming a constant property value of $61.2 million, the chart at the right depicts the growth in GEC’s equity value as cash flows from the rental stream are utilized to amortize debt over the lease term As you can see, GEC builds significant equity value1 over time without any additional capital deployment (1) Equity value is equal to the property value at acquisition minus the face value of the debt on a given date.
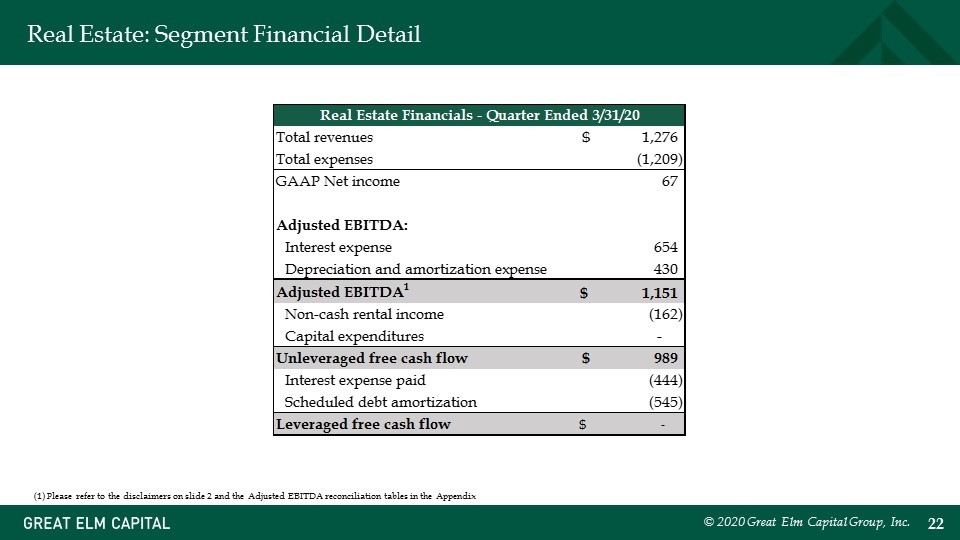
Real Estate: Segment Financial Detail © 2020 Great Elm Capital Group, Inc. (1) Please refer to the disclaimers on slide 2 and the Adjusted EBITDA reconciliation tables in the Appendix Great Elm Capital Group, Inc. RE Results Real Estate Financials - Quarter Ended 3/31/20 Total revenues $1,275.9855999999997 Total expenses -1,208.9721599999998 GAAP Net income 67.013439999999946 Adjusted EBITDA: Interest expense 653.89288999999997 Depreciation and amortization expense 430.47344999999996 Adjusted EBITDA1 $1,151.37978 Non-cash rental income -,162 Capital expenditures 0 Unleveraged free cash flow $989.37977999999998 Interest expense paid -,444 Scheduled debt amortization -,545 Leveraged free cash flow $0 MSR From MD&A segment results MNG From MD&A non-GAAP measurements A Detail of acct 64201 B Reconciled as follows: 0 64615 - Bank / Other fees & charges 0 64630 - Taxes & Licenses 0 C QTD P&L (acct 64200)

General Corporate © 2020 Great Elm Capital Group, Inc.
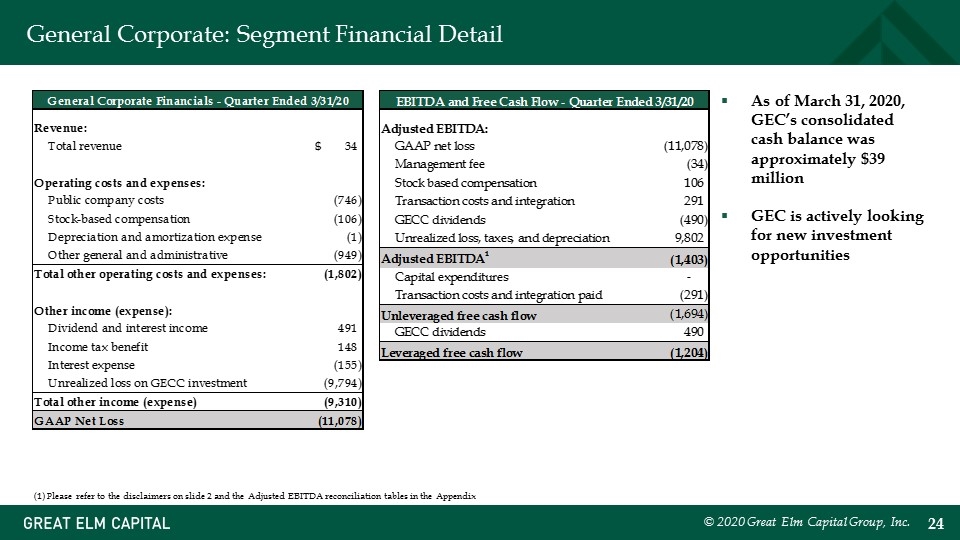
General Corporate: Segment Financial Detail © 2020 Great Elm Capital Group, Inc. (1) Please refer to the disclaimers on slide 2 and the Adjusted EBITDA reconciliation tables in the Appendix As of March 31, 2020, GEC’s consolidated cash balance was approximately $39 million GEC is actively looking for new investment opportunities Great Elm Capital Group, Inc. GC Results General Corporate Financials - Quarter Ended 3/31/20 Revenue: Total revenue $33.641330000000004 MSR Operating costs and expenses: Public company costs -,745.91791999999998 QTD P&L Stock-based compensation -,106.43194 MSR Depreciation and amortization expense -1 Other general and administrative -,949.45907999999986 plug Total other operating costs and expenses: -1,801.8089399999999 MSR A Reconciled as YTD less PQ YTD: SOP YTD PQ YTD Other income (expense): 3,736 3,786 Dividend and interest income 490.98205000000002 QTD P&L 2,182 1,229 Income tax benefit 147.81800000000001 QTD P&L Interest expense -,155 QTD P&L Unrealized loss on GECC investment -9,794.16599999999 QTD P&L Total other income (expense) -9,310.2016100000001 MSR GAAP Net Loss ,-11,078.36922 0 EBITDA and Free Cash Flow - Quarter Ended 3/31/20 Adjusted EBITDA: GAAP net loss ,-11,078.36922 MNG Management fee -33.641330000000004 Above Stock based compensation 106.43194 Transaction costs and integration 290.83960000000002 GECC dividends -,490 Unrealized loss, taxes, and depreciation 9,802.1836600000006 MNG Adjusted EBITDA1 -1,402.5553500000005 0 Capital expenditures 0 Transaction costs and integration paid -,290.83960000000002 A Unleveraged free cash flow -1,694.3949500000006 GECC dividends 490 Leveraged free cash flow -1,204.3949500000006 -1,203 -1.3949500000005628 Great Elm Capital Group, Inc. GC Results General Corporate Financials - Quarter Ended 3/31/20 Revenue: Total revenue $33.641330000000004 MSR Operating costs and expenses: Public company costs -,745.91791999999998 QTD P&L Stock-based compensation -,106.43194 MSR Depreciation and amortization expense -1 Other general and administrative -,949.45907999999986 plug Total other operating costs and expenses: -1,801.8089399999999 MSR A Reconciled as YTD less PQ YTD: SOP YTD PQ YTD Other income (expense): 3,736 3,786 Dividend and interest income 490.98205000000002 QTD P&L 2,182 1,229 Income tax benefit 147.81800000000001 QTD P&L Interest expense -,155 QTD P&L Unrealized loss on GECC investment -9,794.16599999999 QTD P&L Total other income (expense) -9,310.2016100000001 MSR GAAP Net Loss ,-11,078.36922 0 EBITDA and Free Cash Flow - Quarter Ended 3/31/20 Adjusted EBITDA: GAAP net loss ,-11,078.36922 MNG Management fee -33.641330000000004 Above Stock based compensation 106.43194 Transaction costs and integration 290.83960000000002 GECC dividends -,490 Unrealized loss, taxes, and depreciation 9,802.1836600000006 MNG Adjusted EBITDA1 -1,402.5553500000005 0 Capital expenditures 0 Transaction costs and integration paid -,290.83960000000002 A Unleveraged free cash flow -1,694.3949500000006 GECC dividends 490 Leveraged free cash flow -1,204.3949500000006 -1,203 -1.3949500000005628

© 2020 Great Elm Capital Group, Inc. Financial Review
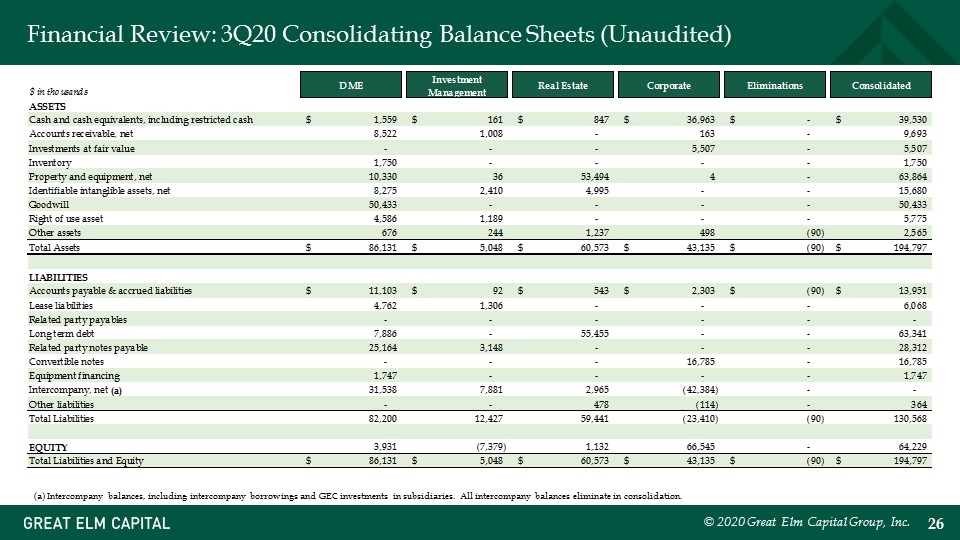
Financial Review: 3Q20 Consolidating Balance Sheets (Unaudited) © 2020 Great Elm Capital Group, Inc. (a) Intercompany balances, including intercompany borrowings and GEC investments in subsidiaries. All intercompany balances eliminate in consolidation.
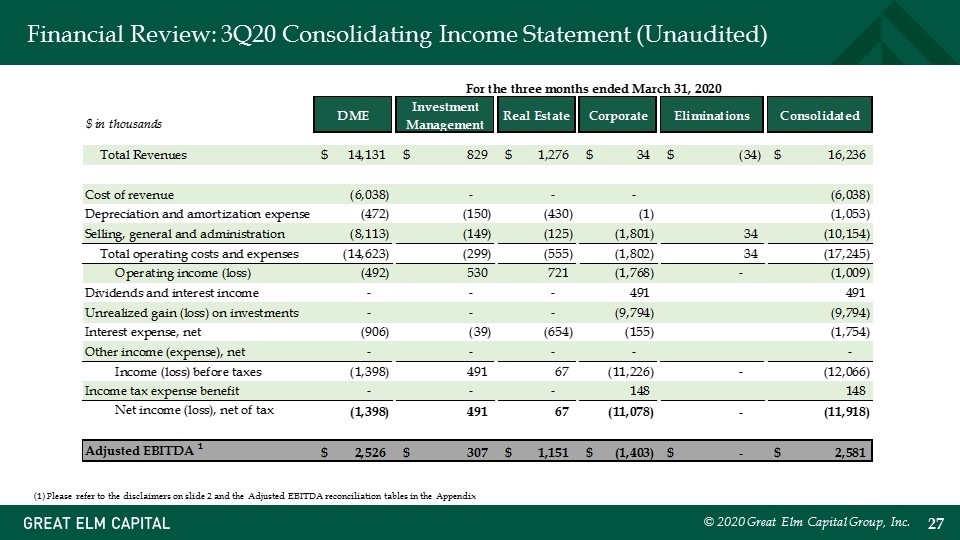
Financial Review: 3Q20 Consolidating Income Statement (Unaudited) © 2020 Great Elm Capital Group, Inc. (1) Please refer to the disclaimers on slide 2 and the Adjusted EBITDA reconciliation tables in the Appendix
Summary © 2020 Great Elm Capital Group, Inc.
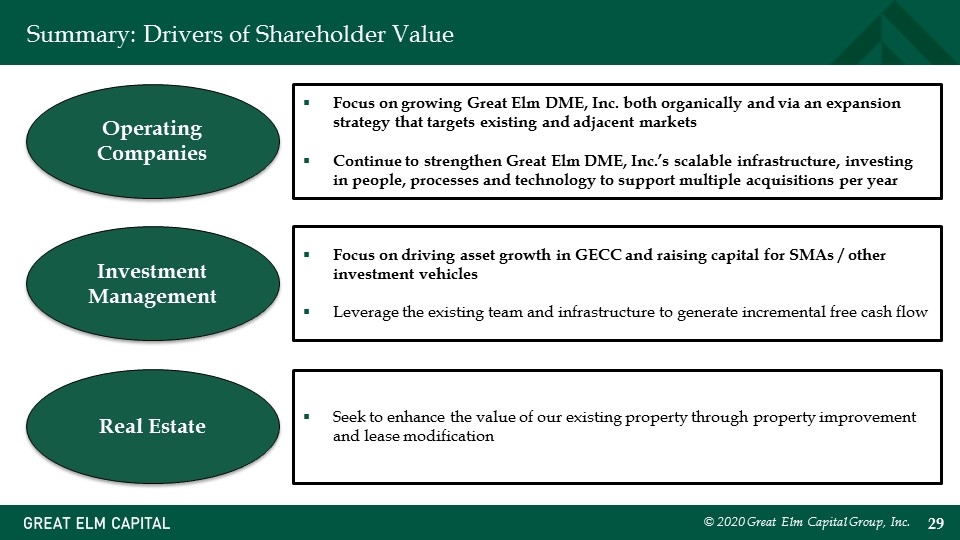
© 2020 Great Elm Capital Group, Inc. Summary: Drivers of Shareholder Value Seek to enhance the value of our existing property through property improvement and lease modification Operating Companies Real Estate Investment Management Focus on growing Great Elm DME, Inc. both organically and via an expansion strategy that targets existing and adjacent markets Continue to strengthen Great Elm DME, Inc.’s scalable infrastructure, investing in people, processes and technology to support multiple acquisitions per year Focus on driving asset growth in GECC and raising capital for SMAs / other investment vehicles Leverage the existing team and infrastructure to generate incremental free cash flow

Q&A © 2020 Great Elm Capital Group, Inc.
Appendix © 2020 Great Elm Capital Group, Inc.
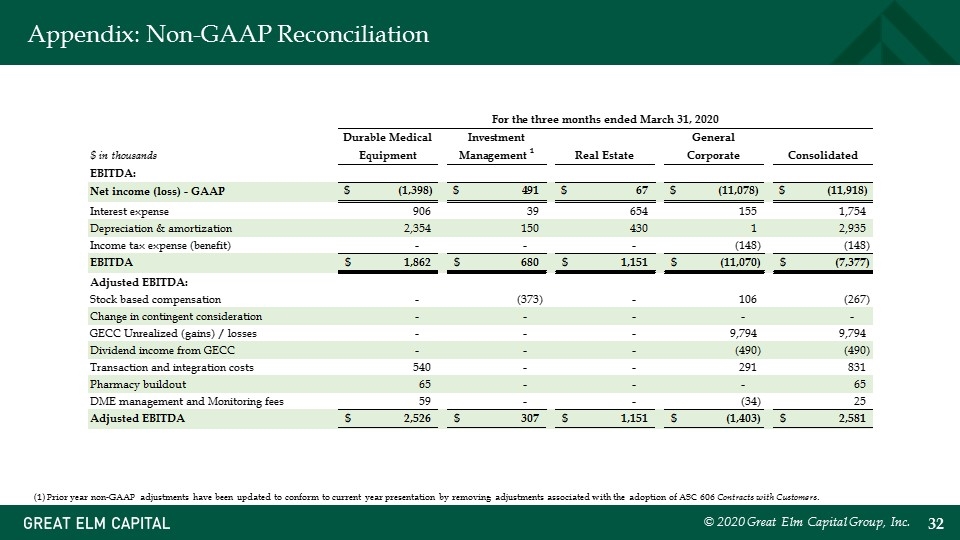
Appendix: Non-GAAP Reconciliation © 2020 Great Elm Capital Group, Inc. (1) Prior year non-GAAP adjustments have been updated to conform to current year presentation by removing adjustments associated with the adoption of ASC 606 Contracts with Customers. . For the three months ended March 31, 2020 $ in thousands Durable Medical Equipment Investment Management 1 Real Estate General Corporate Consolidated EBITDA: Net income (loss) - GAAP $-1,397.7751199999957 $490.71375999999998 $67.013439999999832 $,-11,078.36922 $,-11,918.417139999994 Interest expense 906.27076999999997 39.084290000000003 653.89288999999997 155 1,754.2479499999999 Depreciation & amortization 2,354.1745799999999 150.26635000000002 430.47344999999996 1 2,934.9143799999997 Income tax expense (benefit) 0 0 0 -,147.81800000000001 -,147.81800000000001 EBITDA $1,861.6702300000043 $680.06439999999998 $1,151.3797799999998 $,-11,070.18722 $-7,377.728099999969 Adjusted EBITDA: Stock based compensation 0 -,373.16941000000003 0 106.43194 -,266.73747000000003 Change in contingent consideration 0 0 0 0 0 GECC Unrealized (gains) / losses 0 0 0 9,794.16599999999 9,794.16599999999 Dividend income from GECC 0 0 0 -,490 -,490 Transaction and integration costs 539.97606000000007 0 0 290.83960000000002 830.81566000000009 Pharmacy buildout 65.309840000000008 0 0 0 65.309840000000008 DME management and Monitoring fees 58.981750000000005 0 0 -33.641330000000004 25.340420000000002 Adjusted EBITDA $2,525.937880000004 $306.89498999999995 $1,151.3797799999998 $-1,402.5553499999994 $2,580.657300000003 For the nine months ended March 31, 2020 $ in thousands Durable Medical Equipment Investment Management 1 Real Estate General Corporate Consolidated EBITDA: Net income (loss) - GAAP $-2,893.2413799999981 $451.04985999999985 $186.51143999999977 $,-14,968.17713 $,-17,222.857209999998 Interest expense 2,838.82978 122.36733000000001 1,967.26964 155 5,083.4667499999996 Depreciation & amortization 7,343.9407899999997 508.29567999999995 1,291.4203599999998 2 9,144.6568299999999 Income tax expense (benefit) 0 0 0 -5.217000000000013 -5.217000000000013 EBITDA $7,289.5291900000011 $1,080.7128699999998 $3,445.2014399999998 $,-14,816.394130000001 $-2,999.9506299999994 Adjusted EBITDA: Stock based compensation 0 -,100.49280000000005 0 334.31360999999998 233.82080999999994 Change in contingent consideration 2 0 0 0 -1,135 -1,135 GECC Unrealized (gains) / losses 0 0 0 11,603.33555 11,603.33555 Dividend income from GECC 0 0 0 -1,567 -1,567 Other (income) expense -2.7766999999999999 0 0 0 -2.7766999999999999 Transaction and integration costs 2 1,276.4187400000001 0 0 926.06631000000004 2,201.4850500000002 Pharmacy buildout 319.79162499999995 0 0 0 319.79162499999995 DME management and Monitoring fees 188.90474000000003 0 0 -,113.5643 75.340440000000029 Adjusted EBITDA $9,070.8675949999997 $981.22006999999985 $3,445.2014399999998 $-4,768.2429600000014 $8,729.461450000003 For the three months ended March 31, 2019 $ in thousands Durable Medical Equipment Investment Management 1 Real Estate General Corporate Consolidated EBITDA: Net income (loss) - GAAP $-,517 $-,163 $38 $4,843 $4,201 Net income from discontinued operations 0 0 0 -3,879 -3,879 Interest expense 998 47 667 0 1,712 Depreciation & amortization 2,275 180 436 0 2,891 Income tax expense (benefit) 0 0 0 -1,229 -1,229 EBITDA $2,756 $64 $1,141 $-,265 $3,696 Adjusted EBITDA: Stock based compensation 0 19 0 83 102 GECC Unrealized (gains) / losses 599 0 0 -1,406 -,807 Dividend income from GECC -,198 0 0 -,292 -,490 Transaction and integration costs 2 7 219 0 396 622 Pharmacy buildout 58 0 0 0 58 DME management and monitoring fees -5 0 0 5 0 Adjusted EBITDA $3,217 $302 $1,141 $-1,479 $3,181 For the nine months ended March 31, 2019 $ in thousands Durable Medical Equipment Investment Management 1 Real Estate General Corporate Consolidated EBITDA: Net income (loss) - GAAP $-91 $-,859 $127 $-1,261 $-2,084 Net income from discontinued operations 0 0 0 -3,786 -3,786 Interest expense 2,365 135 1,995 0 4,495 Depreciation & amortization 4,840 453 1,298 0 6,591 Income tax expense (benefit) 0 0 0 -1,229 -1,229 EBITDA $7,114 $-,271 $3,420 $-6,276 $3,987 Adjusted EBITDA: Stock based compensation 0 601 0 343 944 GECC Unrealized (gains) / losses 1,010 0 0 917 1,927 Dividend income from GECC -,629 0 0 -1,312 -1,941 Transaction and integration costs 2 551 219 0 1,855 2,625 Pharmacy buildout 58 0 0 0 58 DME management and Monitoring fees 65 0 0 -65 0 Adjusted EBITDA $8,169 $549 $3,420 $-4,538 $7,600
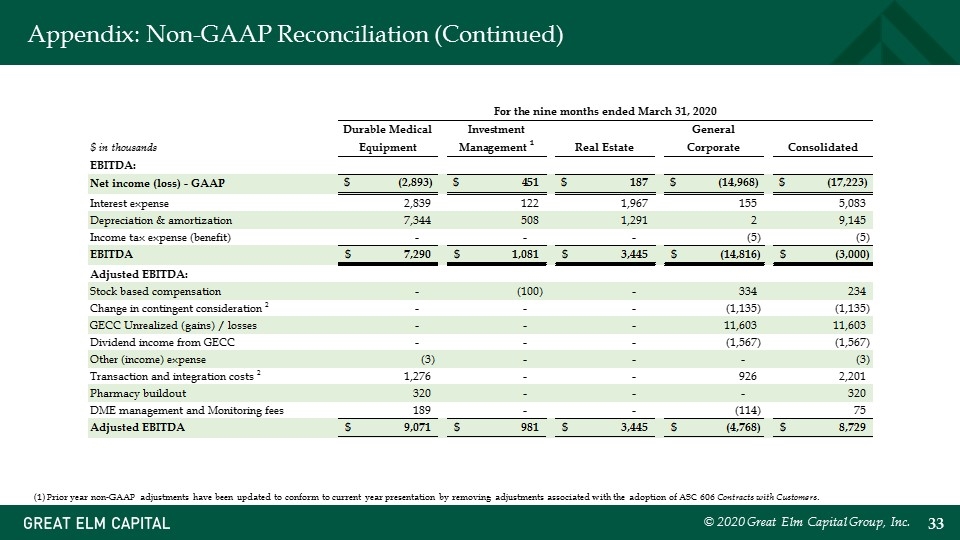
Appendix: Non-GAAP Reconciliation (Continued) © 2020 Great Elm Capital Group, Inc. (1) Prior year non-GAAP adjustments have been updated to conform to current year presentation by removing adjustments associated with the adoption of ASC 606 Contracts with Customers. . For the three months ended March 31, 2020 $ in thousands Durable Medical Equipment Investment Management 1 Real Estate General Corporate Consolidated EBITDA: Net income (loss) - GAAP $-1,397.7751199999957 $490.71375999999998 $67.013439999999832 $,-11,078.36922 $,-11,918.417139999994 Interest expense 906.27076999999997 39.084290000000003 653.89288999999997 155 1,754.2479499999999 Depreciation & amortization 2,354.1745799999999 150.26635000000002 430.47344999999996 1 2,934.9143799999997 Income tax expense (benefit) 0 0 0 -,147.81800000000001 -,147.81800000000001 EBITDA $1,861.6702300000043 $680.06439999999998 $1,151.3797799999998 $,-11,070.18722 $-7,377.728099999969 Adjusted EBITDA: Stock based compensation 0 -,373.16941000000003 0 106.43194 -,266.73747000000003 Change in contingent consideration 0 0 0 0 0 GECC Unrealized (gains) / losses 0 0 0 9,794.16599999999 9,794.16599999999 Dividend income from GECC 0 0 0 -,490 -,490 Transaction and integration costs 539.97606000000007 0 0 290.83960000000002 830.81566000000009 Pharmacy buildout 65.309840000000008 0 0 0 65.309840000000008 DME management and Monitoring fees 58.981750000000005 0 0 -33.641330000000004 25.340420000000002 Adjusted EBITDA $2,525.937880000004 $306.89498999999995 $1,151.3797799999998 $-1,402.5553499999994 $2,580.657300000003 For the nine months ended March 31, 2020 $ in thousands Durable Medical Equipment Investment Management 1 Real Estate General Corporate Consolidated EBITDA: Net income (loss) - GAAP $-2,893.2413799999981 $451.04985999999985 $186.51143999999977 $,-14,968.17713 $,-17,222.857209999998 Interest expense 2,838.82978 122.36733000000001 1,967.26964 155 5,083.4667499999996 Depreciation & amortization 7,343.9407899999997 508.29567999999995 1,291.4203599999998 2 9,144.6568299999999 Income tax expense (benefit) 0 0 0 -5.217000000000013 -5.217000000000013 EBITDA $7,289.5291900000011 $1,080.7128699999998 $3,445.2014399999998 $,-14,816.394130000001 $-2,999.9506299999994 Adjusted EBITDA: Stock based compensation 0 -,100.49280000000005 0 334.31360999999998 233.82080999999994 Change in contingent consideration 2 0 0 0 -1,135 -1,135 GECC Unrealized (gains) / losses 0 0 0 11,603.33555 11,603.33555 Dividend income from GECC 0 0 0 -1,567 -1,567 Other (income) expense -2.7766999999999999 0 0 0 -2.7766999999999999 Transaction and integration costs 2 1,276.4187400000001 0 0 926.06631000000004 2,201.4850500000002 Pharmacy buildout 319.79162499999995 0 0 0 319.79162499999995 DME management and Monitoring fees 188.90474000000003 0 0 -,113.5643 75.340440000000029 Adjusted EBITDA $9,070.8675949999997 $981.22006999999985 $3,445.2014399999998 $-4,768.2429600000014 $8,729.461450000003 For the three months ended March 31, 2019 $ in thousands Durable Medical Equipment Investment Management 1 Real Estate General Corporate Consolidated EBITDA: Net income (loss) - GAAP $-,517 $-,163 $38 $4,843 $4,201 Net income from discontinued operations 0 0 0 -3,879 -3,879 Interest expense 998 47 667 0 1,712 Depreciation & amortization 2,275 180 436 0 2,891 Income tax expense (benefit) 0 0 0 -1,229 -1,229 EBITDA $2,756 $64 $1,141 $-,265 $3,696 Adjusted EBITDA: Stock based compensation 0 19 0 83 102 GECC Unrealized (gains) / losses 599 0 0 -1,406 -,807 Dividend income from GECC -,198 0 0 -,292 -,490 Transaction and integration costs 2 7 219 0 396 622 Pharmacy buildout 58 0 0 0 58 DME management and monitoring fees -5 0 0 5 0 Adjusted EBITDA $3,217 $302 $1,141 $-1,479 $3,181 For the nine months ended March 31, 2019 $ in thousands Durable Medical Equipment Investment Management 1 Real Estate General Corporate Consolidated EBITDA: Net income (loss) - GAAP $-91 $-,859 $127 $-1,261 $-2,084 Net income from discontinued operations 0 0 0 -3,786 -3,786 Interest expense 2,365 135 1,995 0 4,495 Depreciation & amortization 4,840 453 1,298 0 6,591 Income tax expense (benefit) 0 0 0 -1,229 -1,229 EBITDA $7,114 $-,271 $3,420 $-6,276 $3,987 Adjusted EBITDA: Stock based compensation 0 601 0 343 944 GECC Unrealized (gains) / losses 1,010 0 0 917 1,927 Dividend income from GECC -,629 0 0 -1,312 -1,941 Transaction and integration costs 2 551 219 0 1,855 2,625 Pharmacy buildout 58 0 0 0 58 DME management and Monitoring fees 65 0 0 -65 0 Adjusted EBITDA $8,169 $549 $3,420 $-4,538 $7,600
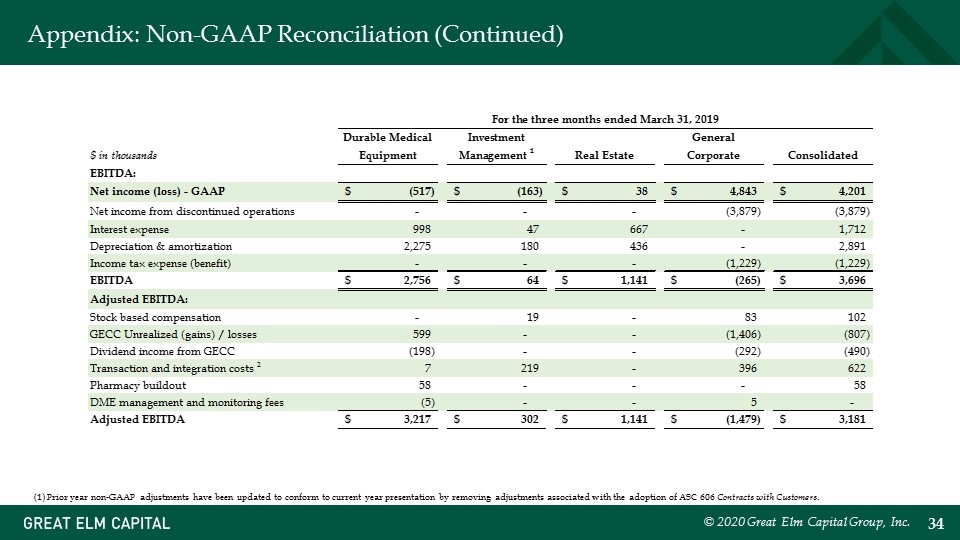
Appendix: Non-GAAP Reconciliation (Continued) © 2020 Great Elm Capital Group, Inc. (1) Prior year non-GAAP adjustments have been updated to conform to current year presentation by removing adjustments associated with the adoption of ASC 606 Contracts with Customers. . For the three months ended March 31, 2020 $ in thousands Durable Medical Equipment Investment Management 1 Real Estate General Corporate Consolidated EBITDA: Net income (loss) - GAAP $-1,397.7751199999957 $490.71375999999998 $67.013439999999832 $,-11,078.36922 $,-11,918.417139999994 Interest expense 906.27076999999997 39.084290000000003 653.89288999999997 155 1,754.2479499999999 Depreciation & amortization 2,354.1745799999999 150.26635000000002 430.47344999999996 1 2,934.9143799999997 Income tax expense (benefit) 0 0 0 -,147.81800000000001 -,147.81800000000001 EBITDA $1,861.6702300000043 $680.06439999999998 $1,151.3797799999998 $,-11,070.18722 $-7,377.728099999969 Adjusted EBITDA: Stock based compensation 0 -,373.16941000000003 0 106.43194 -,266.73747000000003 Change in contingent consideration 0 0 0 0 0 GECC Unrealized (gains) / losses 0 0 0 9,794.16599999999 9,794.16599999999 Dividend income from GECC 0 0 0 -,490 -,490 Transaction and integration costs 539.97606000000007 0 0 290.83960000000002 830.81566000000009 Pharmacy buildout 65.309840000000008 0 0 0 65.309840000000008 DME management and Monitoring fees 58.981750000000005 0 0 -33.641330000000004 25.340420000000002 Adjusted EBITDA $2,525.937880000004 $306.89498999999995 $1,151.3797799999998 $-1,402.5553499999994 $2,580.657300000003 For the nine months ended March 31, 2020 $ in thousands Durable Medical Equipment Investment Management 1 Real Estate General Corporate Consolidated EBITDA: Net income (loss) - GAAP $-2,893.2413799999981 $451.04985999999985 $186.51143999999977 $,-14,968.17713 $,-17,222.857209999998 Interest expense 2,838.82978 122.36733000000001 1,967.26964 155 5,083.4667499999996 Depreciation & amortization 7,343.9407899999997 508.29567999999995 1,291.4203599999998 2 9,144.6568299999999 Income tax expense (benefit) 0 0 0 -5.217000000000013 -5.217000000000013 EBITDA $7,289.5291900000011 $1,080.7128699999998 $3,445.2014399999998 $,-14,816.394130000001 $-2,999.9506299999994 Adjusted EBITDA: Stock based compensation 0 -,100.49280000000005 0 334.31360999999998 233.82080999999994 Change in contingent consideration 2 0 0 0 -1,135 -1,135 GECC Unrealized (gains) / losses 0 0 0 11,603.33555 11,603.33555 Dividend income from GECC 0 0 0 -1,567 -1,567 Other (income) expense -2.7766999999999999 0 0 0 -2.7766999999999999 Transaction and integration costs 2 1,276.4187400000001 0 0 926.06631000000004 2,201.4850500000002 Pharmacy buildout 319.79162499999995 0 0 0 319.79162499999995 DME management and Monitoring fees 188.90474000000003 0 0 -,113.5643 75.340440000000029 Adjusted EBITDA $9,070.8675949999997 $981.22006999999985 $3,445.2014399999998 $-4,768.2429600000014 $8,729.461450000003 For the three months ended March 31, 2019 $ in thousands Durable Medical Equipment Investment Management 1 Real Estate General Corporate Consolidated EBITDA: Net income (loss) - GAAP $-,517 $-,163 $38 $4,843 $4,201 Net income from discontinued operations 0 0 0 -3,879 -3,879 Interest expense 998 47 667 0 1,712 Depreciation & amortization 2,275 180 436 0 2,891 Income tax expense (benefit) 0 0 0 -1,229 -1,229 EBITDA $2,756 $64 $1,141 $-,265 $3,696 Adjusted EBITDA: Stock based compensation 0 19 0 83 102 GECC Unrealized (gains) / losses 599 0 0 -1,406 -,807 Dividend income from GECC -,198 0 0 -,292 -,490 Transaction and integration costs 2 7 219 0 396 622 Pharmacy buildout 58 0 0 0 58 DME management and monitoring fees -5 0 0 5 0 Adjusted EBITDA $3,217 $302 $1,141 $-1,479 $3,181 For the nine months ended March 31, 2019 $ in thousands Durable Medical Equipment Investment Management 1 Real Estate General Corporate Consolidated EBITDA: Net income (loss) - GAAP $-91 $-,859 $127 $-1,261 $-2,084 Net income from discontinued operations 0 0 0 -3,786 -3,786 Interest expense 2,365 135 1,995 0 4,495 Depreciation & amortization 4,840 453 1,298 0 6,591 Income tax expense (benefit) 0 0 0 -1,229 -1,229 EBITDA $7,114 $-,271 $3,420 $-6,276 $3,987 Adjusted EBITDA: Stock based compensation 0 601 0 343 944 GECC Unrealized (gains) / losses 1,010 0 0 917 1,927 Dividend income from GECC -,629 0 0 -1,312 -1,941 Transaction and integration costs 2 551 219 0 1,855 2,625 Pharmacy buildout 58 0 0 0 58 DME management and Monitoring fees 65 0 0 -65 0 Adjusted EBITDA $8,169 $549 $3,420 $-4,538 $7,600
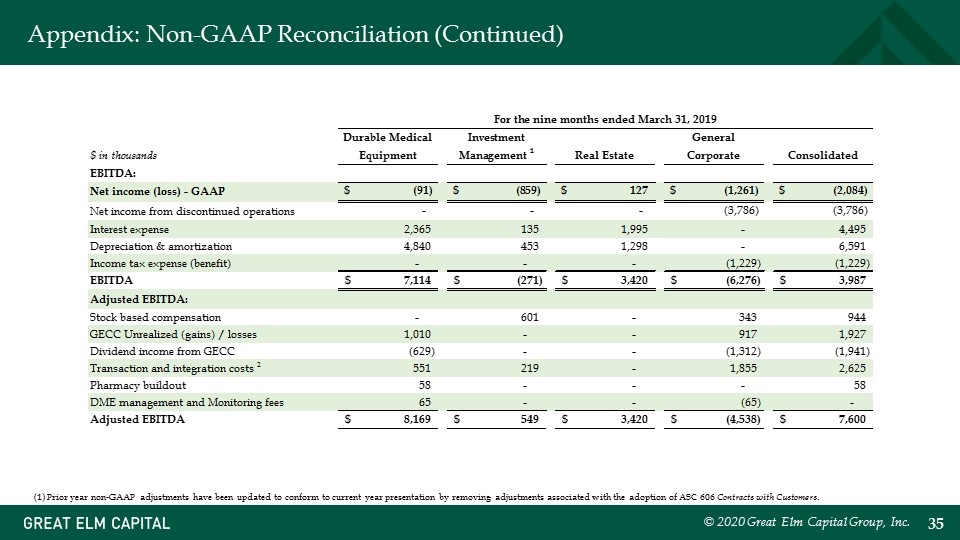
Appendix: Non-GAAP Reconciliation (Continued) © 2020 Great Elm Capital Group, Inc. (1) Prior year non-GAAP adjustments have been updated to conform to current year presentation by removing adjustments associated with the adoption of ASC 606 Contracts with Customers. . For the three months ended March 31, 2020 $ in thousands Durable Medical Equipment Investment Management 1 Real Estate General Corporate Consolidated EBITDA: Net income (loss) - GAAP $-1,397.7751199999957 $490.71375999999998 $67.013439999999832 $,-11,078.36922 $,-11,918.417139999994 Interest expense 906.27076999999997 39.084290000000003 653.89288999999997 155 1,754.2479499999999 Depreciation & amortization 2,354.1745799999999 150.26635000000002 430.47344999999996 1 2,934.9143799999997 Income tax expense (benefit) 0 0 0 -,147.81800000000001 -,147.81800000000001 EBITDA $1,861.6702300000043 $680.06439999999998 $1,151.3797799999998 $,-11,070.18722 $-7,377.728099999969 Adjusted EBITDA: Stock based compensation 0 -,373.16941000000003 0 106.43194 -,266.73747000000003 Change in contingent consideration 0 0 0 0 0 GECC Unrealized (gains) / losses 0 0 0 9,794.16599999999 9,794.16599999999 Dividend income from GECC 0 0 0 -,490 -,490 Transaction and integration costs 539.97606000000007 0 0 290.83960000000002 830.81566000000009 Pharmacy buildout 65.309840000000008 0 0 0 65.309840000000008 DME management and Monitoring fees 58.981750000000005 0 0 -33.641330000000004 25.340420000000002 Adjusted EBITDA $2,525.937880000004 $306.89498999999995 $1,151.3797799999998 $-1,402.5553499999994 $2,580.657300000003 For the nine months ended March 31, 2020 $ in thousands Durable Medical Equipment Investment Management 1 Real Estate General Corporate Consolidated EBITDA: Net income (loss) - GAAP $-2,893.2413799999981 $451.04985999999985 $186.51143999999977 $,-14,968.17713 $,-17,222.857209999998 Interest expense 2,838.82978 122.36733000000001 1,967.26964 155 5,083.4667499999996 Depreciation & amortization 7,343.9407899999997 508.29567999999995 1,291.4203599999998 2 9,144.6568299999999 Income tax expense (benefit) 0 0 0 -5.217000000000013 -5.217000000000013 EBITDA $7,289.5291900000011 $1,080.7128699999998 $3,445.2014399999998 $,-14,816.394130000001 $-2,999.9506299999994 Adjusted EBITDA: Stock based compensation 0 -,100.49280000000005 0 334.31360999999998 233.82080999999994 Change in contingent consideration 2 0 0 0 -1,135 -1,135 GECC Unrealized (gains) / losses 0 0 0 11,603.33555 11,603.33555 Dividend income from GECC 0 0 0 -1,567 -1,567 Other (income) expense -2.7766999999999999 0 0 0 -2.7766999999999999 Transaction and integration costs 2 1,276.4187400000001 0 0 926.06631000000004 2,201.4850500000002 Pharmacy buildout 319.79162499999995 0 0 0 319.79162499999995 DME management and Monitoring fees 188.90474000000003 0 0 -,113.5643 75.340440000000029 Adjusted EBITDA $9,070.8675949999997 $981.22006999999985 $3,445.2014399999998 $-4,768.2429600000014 $8,729.461450000003 For the three months ended March 31, 2019 $ in thousands Durable Medical Equipment Investment Management 1 Real Estate General Corporate Consolidated EBITDA: Net income (loss) - GAAP $-,517 $-,163 $38 $4,843 $4,201 Net income from discontinued operations 0 0 0 -3,879 -3,879 Interest expense 998 47 667 0 1,712 Depreciation & amortization 2,275 180 436 0 2,891 Income tax expense (benefit) 0 0 0 -1,229 -1,229 EBITDA $2,756 $64 $1,141 $-,265 $3,696 Adjusted EBITDA: Stock based compensation 0 19 0 83 102 GECC Unrealized (gains) / losses 599 0 0 -1,406 -,807 Dividend income from GECC -,198 0 0 -,292 -,490 Transaction and integration costs 2 7 219 0 396 622 Pharmacy buildout 58 0 0 0 58 DME management and monitoring fees -5 0 0 5 0 Adjusted EBITDA $3,217 $302 $1,141 $-1,479 $3,181 For the nine months ended March 31, 2019 $ in thousands Durable Medical Equipment Investment Management 1 Real Estate General Corporate Consolidated EBITDA: Net income (loss) - GAAP $-91 $-,859 $127 $-1,261 $-2,084 Net income from discontinued operations 0 0 0 -3,786 -3,786 Interest expense 2,365 135 1,995 0 4,495 Depreciation & amortization 4,840 453 1,298 0 6,591 Income tax expense (benefit) 0 0 0 -1,229 -1,229 EBITDA $7,114 $-,271 $3,420 $-6,276 $3,987 Adjusted EBITDA: Stock based compensation 0 601 0 343 944 GECC Unrealized (gains) / losses 1,010 0 0 917 1,927 Dividend income from GECC -,629 0 0 -1,312 -1,941 Transaction and integration costs 2 551 219 0 1,855 2,625 Pharmacy buildout 58 0 0 0 58 DME management and Monitoring fees 65 0 0 -65 0 Adjusted EBITDA $8,169 $549 $3,420 $-4,538 $7,600

Appendix: Contact Information Investor Relations 800 South Street, Suite 230 Waltham, MA 02453 Phone: +1 (617) 375-3006 investorrelations@greatelmcap.com © 2020 Great Elm Capital Group, Inc.
