Attached files
| file | filename |
|---|---|
| 8-K - FORM 8-K - CITIZENS FINANCIAL GROUP INC/RI | d876357d8k.htm |
Barclays Americas Select Franchise Conference 2020 Bruce Van Saun Chief Executive Officer May 12, 2020 Exhibit 99.1
Forward-looking statements and use of key performance metrics and non-GAAP financial measures Forward-Looking Statements. This document contains forward-looking statements within the meaning of Private Securities Litigation Reform Act of 1995. Statements regarding potential future share repurchases and future dividends, as well as the potential effects of the COVID-19 pandemic on our business, operations, financial performance and prospects, are forward-looking statements. Also, any statement that does not describe historical or current facts is a forward-looking statement. These statements often include the words “believes,” “expects,” “anticipates,” “estimates,” “intends,” “plans,” “goals,” “targets,” “initiatives,” “potentially,” “probably,” “projects,” “outlook” or similar expressions or future conditional verbs such as “may,” “will,” “should,” “would,” and “could.” Forward-looking statements are based upon the current beliefs and expectations of management, and on information currently available to management. Our statements speak as of the date hereof, and we do not assume any obligation to update these statements or to update the reasons why actual results could differ from those contained in such statements in light of new information or future events. We caution you, therefore, against relying on any of these forward-looking statements. They are neither statements of historical fact nor guarantees or assurances of future performance. While there is no assurance that any list of risks and uncertainties or risk factors is complete, important factors that could cause actual results to differ materially from those in the forward-looking statements include the following, without limitation: Negative economic and political conditions that adversely affect the general economy, housing prices, the job market, consumer confidence and spending habits which may affect, among other things, the level of nonperforming assets, charge-offs and provision expense; The rate of growth in the economy and employment levels, as well as general business and economic conditions, and changes in the competitive environment; Our ability to implement our business strategy, including the cost savings and efficiency components, and achieve our financial performance goals; The COVID-19 pandemic and its effects on the economic and business environments in which we operate; Our ability to meet heightened supervisory requirements and expectations; Liabilities and business restrictions resulting from litigation and regulatory investigations; Our capital and liquidity requirements (including under regulatory capital standards, such as the U.S. Basel III capital rules) and our ability to generate capital internally or raise capital on favorable terms; The effect of changes in interest rates on our net interest income, net interest margin and our mortgage originations, mortgage servicing rights and mortgages held for sale; Changes in interest rates and market liquidity, as well as the magnitude of such changes, which may reduce interest margins, impact funding sources and affect the ability to originate and distribute financial products in the primary and secondary markets; The effect of changes in the level of checking or savings account deposits on our funding costs and net interest margin; Financial services reform and other current, pending or future legislation or regulation that could have a negative effect on our revenue and businesses; A failure in or breach of our operational or security systems or infrastructure, or those of our third party vendors or other service providers, including as a result of cyber-attacks; and Management’s ability to identify and manage these and other risks. In addition to the above factors, we also caution that the actual amounts and timing of any future common stock dividends or share repurchases will be subject to various factors, including our capital position, financial performance, capital impacts of strategic initiatives, market conditions, and regulatory and accounting considerations, as well as any other factors that our Board of Directors deems relevant in making such a determination. Therefore, there can be no assurance that we will repurchase shares or pay any dividends to holders of our common stock, or as to the amount of any such repurchases or dividends. Further, statements about the effects of the COVID-19 pandemic on our business, operations, financial performance and prospects may constitute forward-looking statements and are subject to the risk that the actual impacts may differ, possibly materially, from what is reflected in those forward-looking statements due to factors and future developments that are uncertain, unpredictable and in many cases beyond our control, including the scope and duration of the pandemic, actions taken by governmental authorities in response to the pandemic, and the direct and indirect impact of the pandemic on our customers, third parties and us. Further, statements about the estimated impact of CECL are forward-looking statements and are subject to the risk that the actual impact of CECL may differ, possibly materially, from what is reflected in those statements due to, among other things, changes in macroeconomic conditions and any of the other variables discussed on page 6, as well as changes based on continuing review of models and assumptions. More information about factors that could cause actual results to differ materially from those described in the forward-looking statements can be found under “Risk Factors” in our Annual Report on Form 10-K for the year ended December 31, 2019 and our Quarterly Report on Form 10-Q for the period ending March 31, 2020. Key Performance Metrics and Non-GAAP Financial Measures and Reconciliations Key Performance Metrics: Our Management uses certain key performance metrics (KPMs) to gauge our progress against strategic and operational goals, as well as to compare our performance against peers. The KPMs are referred to in our Registration Statements on Form S-1 and our external financial reports filed with the Securities and Exchange Commission. The KPMs include: Return on average tangible common equity (ROTCE); Efficiency ratio; Operating leverage; and Common equity tier 1 capital ratio. Established targets for the KPMs are based on Management-reporting results which are currently referred to by the Company as “Underlying” results. In historical periods, these results may have been referred to as “Adjusted” or “Adjusted/Underlying” results. We believe that Underlying results, which exclude notable items, provide the best representation of our underlying financial progress toward the KPMs as the results exclude items that our Management does not consider indicative of our on-going financial performance. We have consistently shown investors our KPMs on a Management-reporting basis since our initial public offering in September of 2014. KPMs that reflect Underlying results are considered non-GAAP financial measures. Non-GAAP Financial Measures: This document contains non-GAAP financial measures denoted as Underlying results and Underlying excluding the impact of COVID-19 on the provision for credit losses. In historical periods, these results may have been referred to as Adjusted or Adjusted/Underlying results. Underlying results for any given reporting period exclude certain items that may occur in that period which Management does not consider indicative of the Company’s on-going financial performance. We believe these non-GAAP financial measures provide useful information to investors because they are used by our Management to evaluate our operating performance and make day-to-day operating decisions. In addition, we believe our Underlying results in any given reporting period reflect our on-going financial performance in that period and, accordingly, are useful to consider in addition to our GAAP financial results. We further believe the presentation of Underlying results increases comparability of period-to-period results. The Appendix presents reconciliations of our non-GAAP measures to the most directly comparable GAAP financial measures. Underlying excluding the impact of COVID-19 on the provision for credit losses reflects information valuable to investors given the outsized impact of the pandemic which is not expected to have a similar ongoing impact to our results given the timing of the impact of adoption of CECL and the unprecedented nature of the COVID-19 pandemic. Other companies may use similarly titled non-GAAP financial measures that are calculated differently from the way we calculate such measures. Accordingly, our non-GAAP financial measures may not be comparable to similar measures used by such companies. We caution investors not to place undue reliance on such non-GAAP financial measures, but to consider them with the most directly comparable GAAP measures. Non-GAAP financial measures have limitations as analytical tools and should not be considered in isolation or as a substitute for our results reported under GAAP.
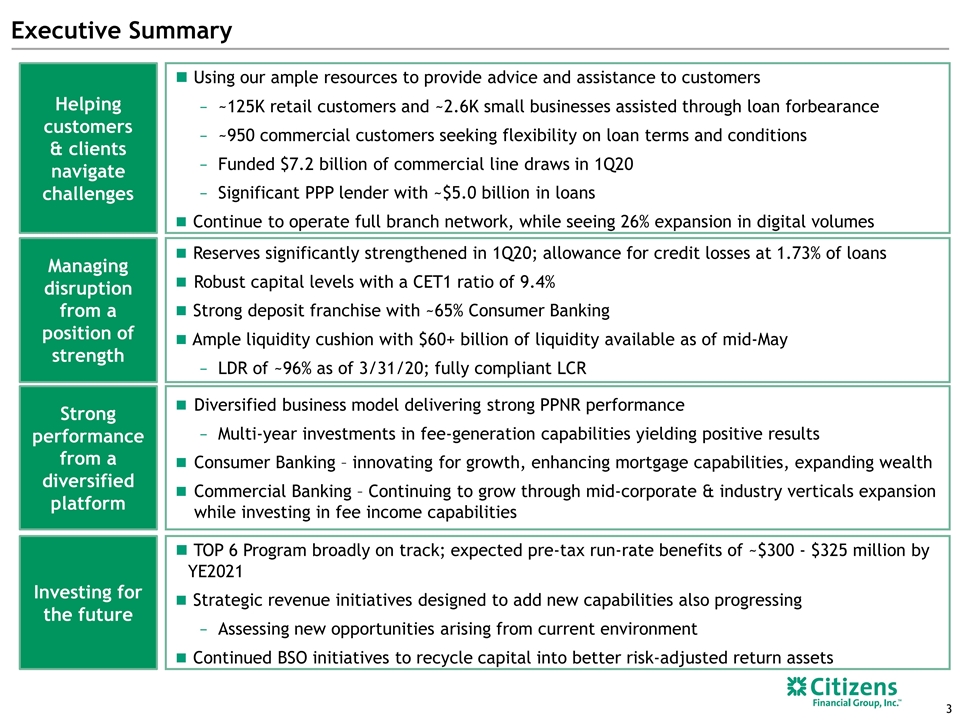
Investing for the future TOP 6 Program broadly on track; expected pre-tax run-rate benefits of ~$300 - $325 million by YE2021 Strategic revenue initiatives designed to add new capabilities also progressing Assessing new opportunities arising from current environment Continued BSO initiatives to recycle capital into better risk-adjusted return assets Executive Summary Strong performance from a diversified platform Diversified business model delivering strong PPNR performance Multi-year investments in fee-generation capabilities yielding positive results Consumer Banking – innovating for growth, enhancing mortgage capabilities, expanding wealth Commercial Banking – Continuing to grow through mid-corporate & industry verticals expansion while investing in fee income capabilities Managing disruption from a position of strength Reserves significantly strengthened in 1Q20; allowance for credit losses at 1.73% of loans Robust capital levels with a CET1 ratio of 9.4% Strong deposit franchise with ~65% Consumer Banking Ample liquidity cushion with $60+ billion of liquidity available as of mid-May LDR of ~96% as of 3/31/20; fully compliant LCR Helping customers & clients navigate challenges Using our ample resources to provide advice and assistance to customers ~125K retail customers and ~2.6K small businesses assisted through loan forbearance ~950 commercial customers seeking flexibility on loan terms and conditions Funded $7.2 billion of commercial line draws in 1Q20 Significant PPP lender with ~$5.0 billion in loans Continue to operate full branch network, while seeing 26% expansion in digital volumes
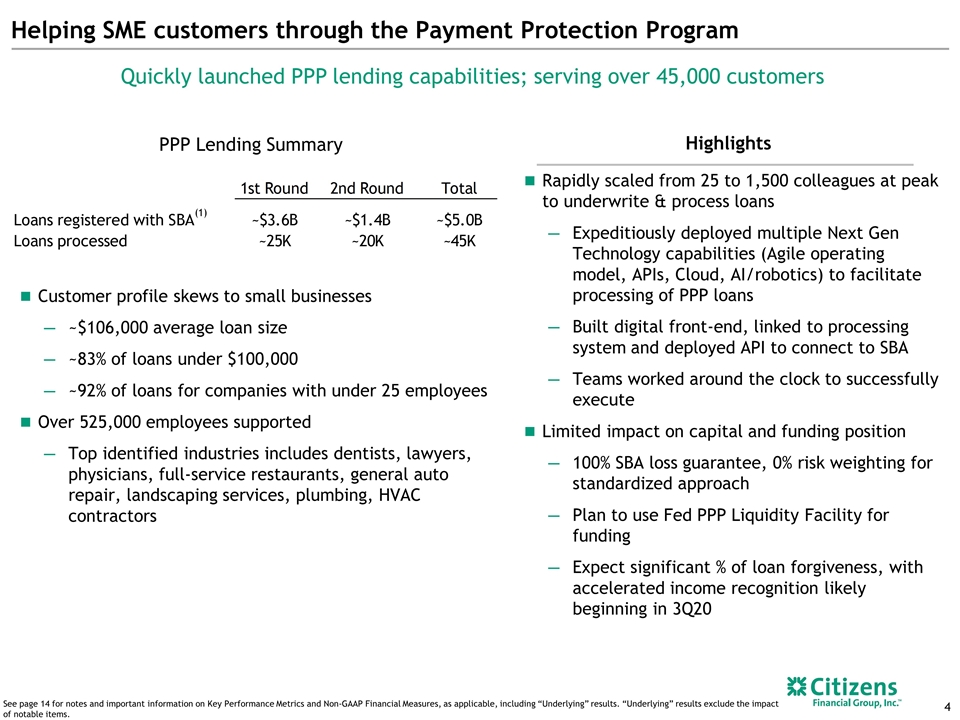
Helping SME customers through the Payment Protection Program Rapidly scaled from 25 to 1,500 colleagues at peak to underwrite & process loans Expeditiously deployed multiple Next Gen Technology capabilities (Agile operating model, APIs, Cloud, AI/robotics) to facilitate processing of PPP loans Built digital front-end, linked to processing system and deployed API to connect to SBA Teams worked around the clock to successfully execute Limited impact on capital and funding position 100% SBA loss guarantee, 0% risk weighting for standardized approach Plan to use Fed PPP Liquidity Facility for funding Expect significant % of loan forgiveness, with accelerated income recognition likely beginning in 3Q20 Quickly launched PPP lending capabilities; serving over 45,000 customers Highlights PPP Lending Summary Customer profile skews to small businesses ~$106,000 average loan size ~83% of loans under $100,000 ~92% of loans for companies with under 25 employees Over 525,000 employees supported Top identified industries includes dentists, lawyers, physicians, full-service restaurants, general auto repair, landscaping services, plumbing, HVAC contractors See page 14 for notes and important information on Key Performance Metrics and Non-GAAP Financial Measures, as applicable, including “Underlying” results. “Underlying” results exclude the impact of notable items.
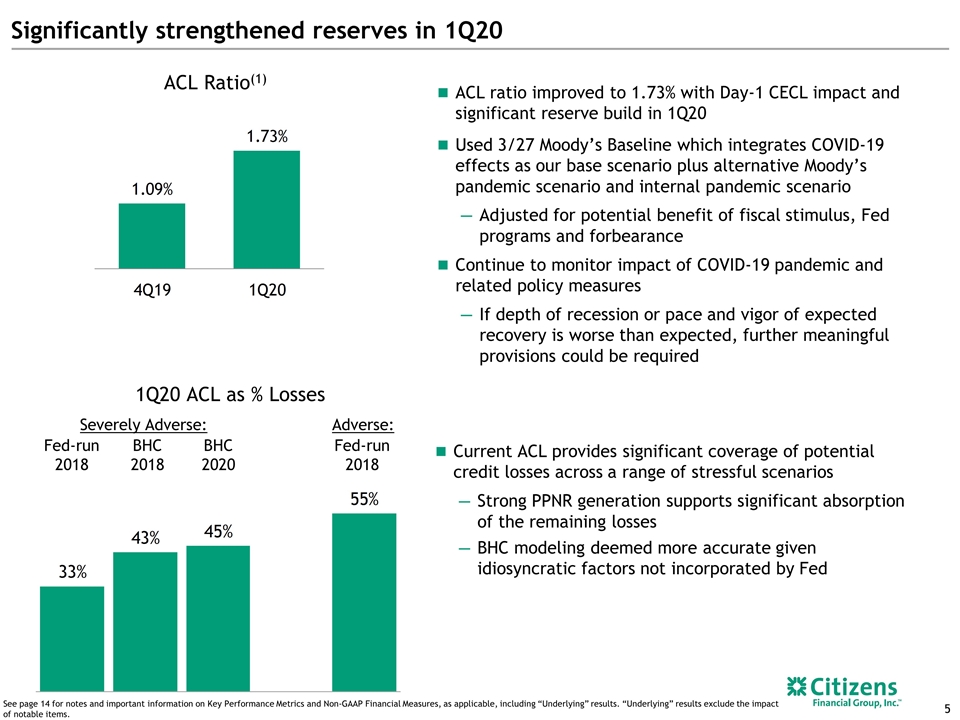
Significantly strengthened reserves in 1Q20 Current ACL provides significant coverage of potential credit losses across a range of stressful scenarios Strong PPNR generation supports significant absorption of the remaining losses BHC modeling deemed more accurate given idiosyncratic factors not incorporated by Fed ACL ratio improved to 1.73% with Day-1 CECL impact and significant reserve build in 1Q20 Used 3/27 Moody’s Baseline which integrates COVID-19 effects as our base scenario plus alternative Moody’s pandemic scenario and internal pandemic scenario Adjusted for potential benefit of fiscal stimulus, Fed programs and forbearance Continue to monitor impact of COVID-19 pandemic and related policy measures If depth of recession or pace and vigor of expected recovery is worse than expected, further meaningful provisions could be required ACL Ratio(1) 1Q20 ACL as % Losses Fed-run 2018 Severely Adverse: Adverse: BHC 2018 BHC 2020 Fed-run 2018 See page 14 for notes and important information on Key Performance Metrics and Non-GAAP Financial Measures, as applicable, including “Underlying” results. “Underlying” results exclude the impact of notable items.
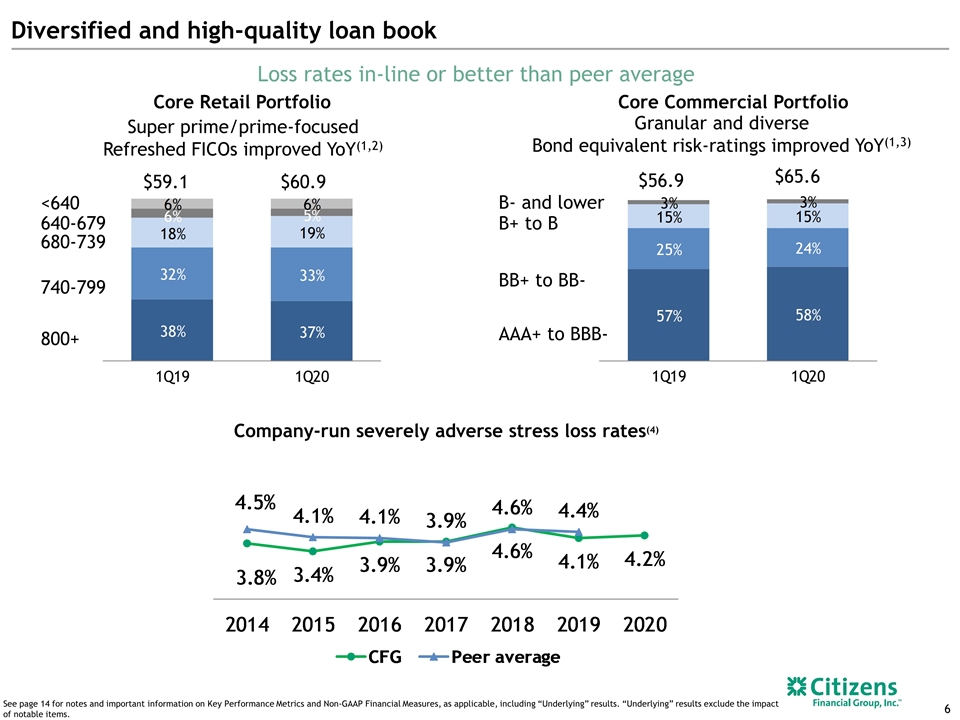
Diversified and high-quality loan book Company-run severely adverse stress loss rates(4) Loss rates in-line or better than peer average 800+ 740-799 680-739 640-679 <640 $60.9 $59.1 $56.9 $65.6 B- and lower B+ to B BB+ to BB- AAA+ to BBB- Granular and diverse Bond equivalent risk-ratings improved YoY(1,3) Super prime/prime-focused Refreshed FICOs improved YoY(1,2) Core Retail Portfolio Core Commercial Portfolio See page 14 for notes and important information on Key Performance Metrics and Non-GAAP Financial Measures, as applicable, including “Underlying” results. “Underlying” results exclude the impact of notable items.
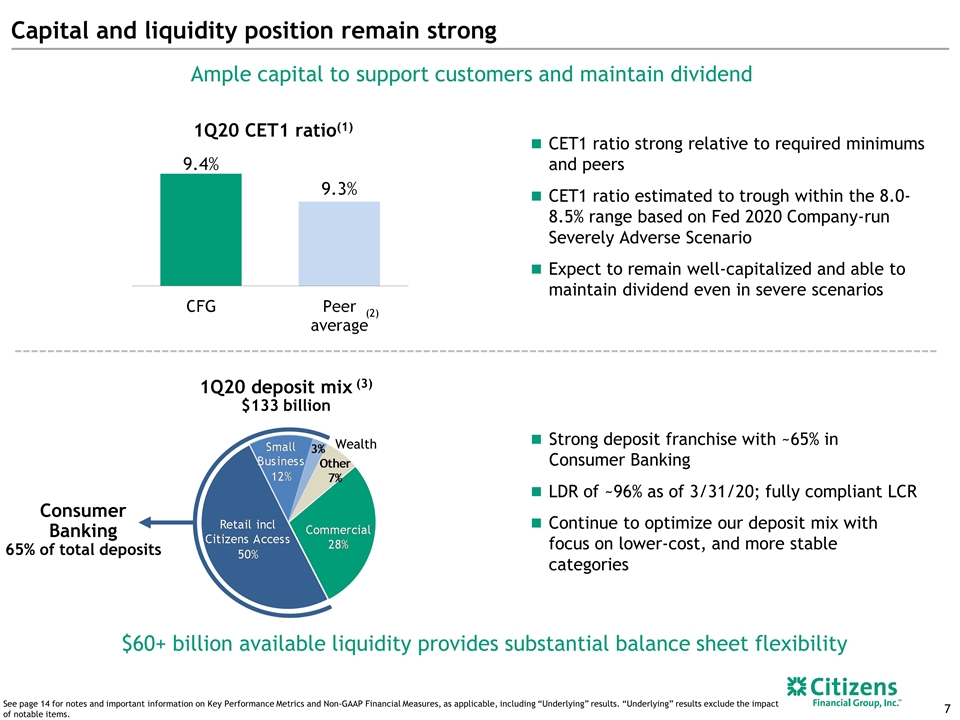
Capital and liquidity position remain strong Ample capital to support customers and maintain dividend CET1 ratio strong relative to required minimums and peers CET1 ratio estimated to trough within the 8.0-8.5% range based on Fed 2020 Company-run Severely Adverse Scenario Expect to remain well-capitalized and able to maintain dividend even in severe scenarios $60+ billion available liquidity provides substantial balance sheet flexibility Strong deposit franchise with ~65% in Consumer Banking LDR of ~96% as of 3/31/20; fully compliant LCR Continue to optimize our deposit mix with focus on lower-cost, and more stable categories Consumer Banking 65% of total deposits 1Q20 deposit mix (3) $133 billion Wealth 1Q20 CET1 ratio(1) See page 14 for notes and important information on Key Performance Metrics and Non-GAAP Financial Measures, as applicable, including “Underlying” results. “Underlying” results exclude the impact of notable items. (2)
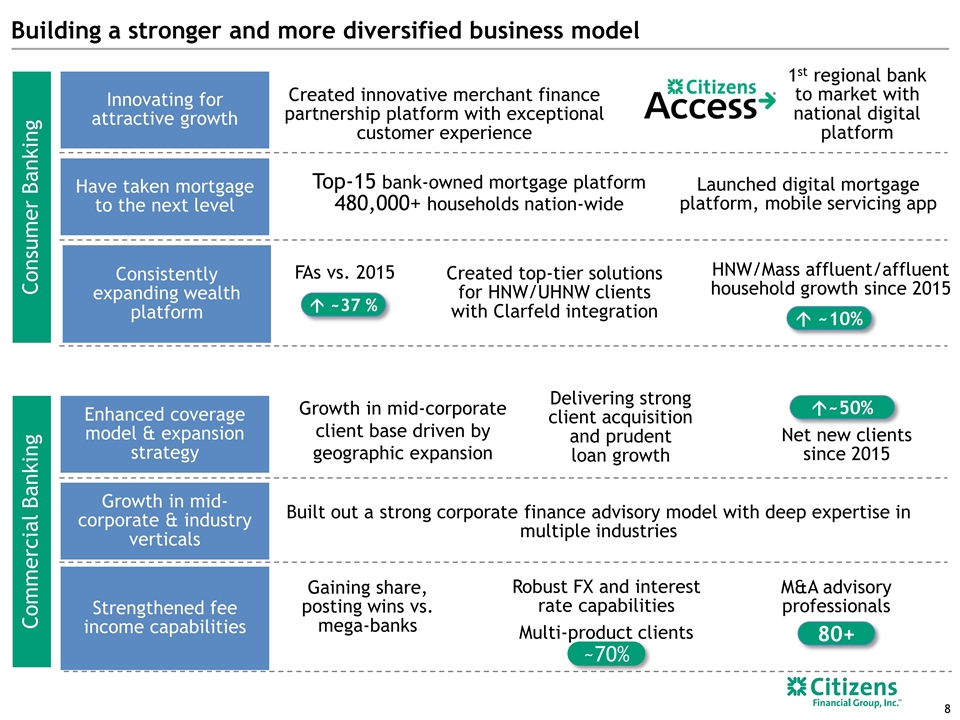
Building a stronger and more diversified business model Innovating for attractive growth Consistently expanding wealth platform Have taken mortgage to the next level á ~37 % Created innovative merchant finance partnership platform with exceptional customer experience Top-15 bank-owned mortgage platform 480,000+ households nation-wide FAs vs. 2015 Created top-tier solutions for HNW/UHNW clients with Clarfeld integration á ~10% HNW/Mass affluent/affluent household growth since 2015 Commercial Banking Strengthened fee income capabilities Growth in mid-corporate & industry verticals Enhanced coverage model & expansion strategy Net new clients since 2015 á~50% Delivering strong client acquisition and prudent loan growth M&A advisory professionals 80+ Built out a strong corporate finance advisory model with deep expertise in multiple industries Robust FX and interest rate capabilities Gaining share, posting wins vs. mega-banks Consumer Banking 1st regional bank to market with national digital platform Multi-product clients ~70% Growth in mid-corporate client base driven by geographic expansion Launched digital mortgage platform, mobile servicing app
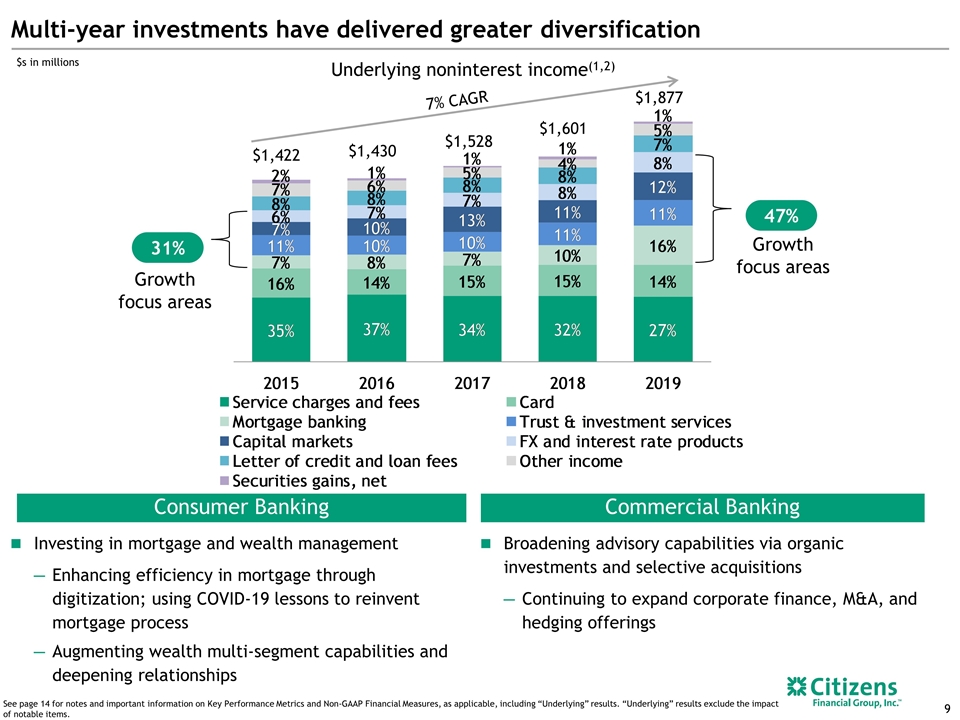
Multi-year investments have delivered greater diversification $s in millions 7% CAGR $1,422 $1,877 $1,430 $1,528 $1,601 Underlying noninterest income(1,2) Investing in mortgage and wealth management Enhancing efficiency in mortgage through digitization; using COVID-19 lessons to reinvent mortgage process Augmenting wealth multi-segment capabilities and deepening relationships Broadening advisory capabilities via organic investments and selective acquisitions Continuing to expand corporate finance, M&A, and hedging offerings Consumer Banking Commercial Banking 47% 31% Growth focus areas Growth focus areas See page 14 for notes and important information on Key Performance Metrics and Non-GAAP Financial Measures, as applicable, including “Underlying” results. “Underlying” results exclude the impact of notable items.
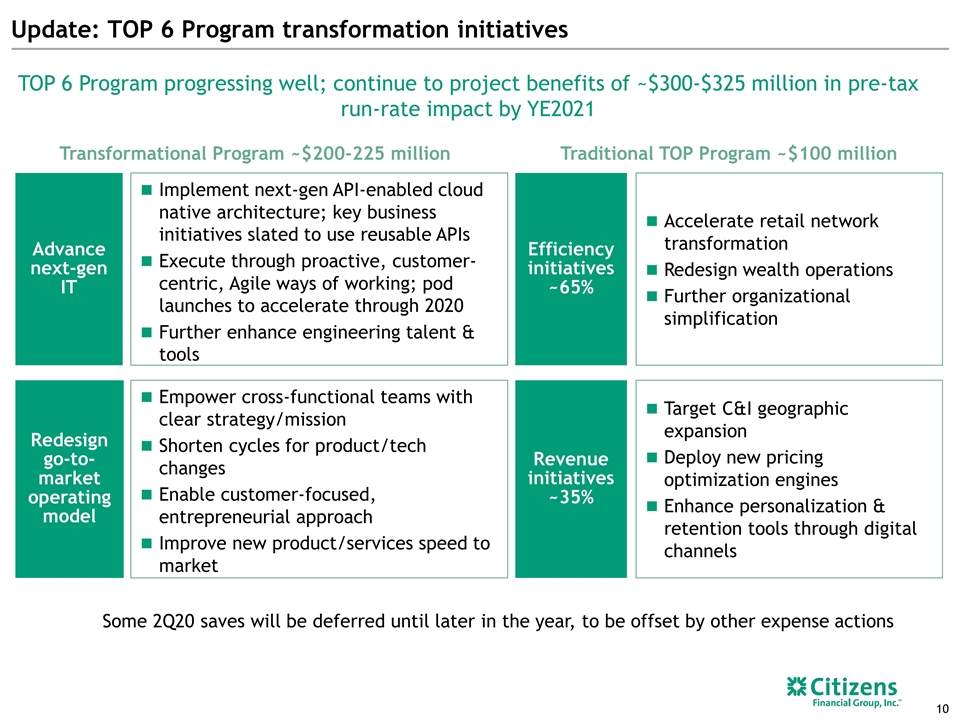
Update: TOP 6 Program transformation initiatives Redesign go-to-market operating model Empower cross-functional teams with clear strategy/mission Shorten cycles for product/tech changes Enable customer-focused, entrepreneurial approach Improve new product/services speed to market Advance next-gen IT Implement next-gen API-enabled cloud native architecture; key business initiatives slated to use reusable APIs Execute through proactive, customer-centric, Agile ways of working; pod launches to accelerate through 2020 Further enhance engineering talent & tools Transformational Program ~$200-225 million Traditional TOP Program ~$100 million Revenue initiatives ~35% Target C&I geographic expansion Deploy new pricing optimization engines Enhance personalization & retention tools through digital channels Efficiency initiatives ~65% Accelerate retail network transformation Redesign wealth operations Further organizational simplification TOP 6 Program progressing well; continue to project benefits of ~$300-$325 million in pre-tax run-rate impact by YE2021 Some 2Q20 saves will be deferred until later in the year, to be offset by other expense actions
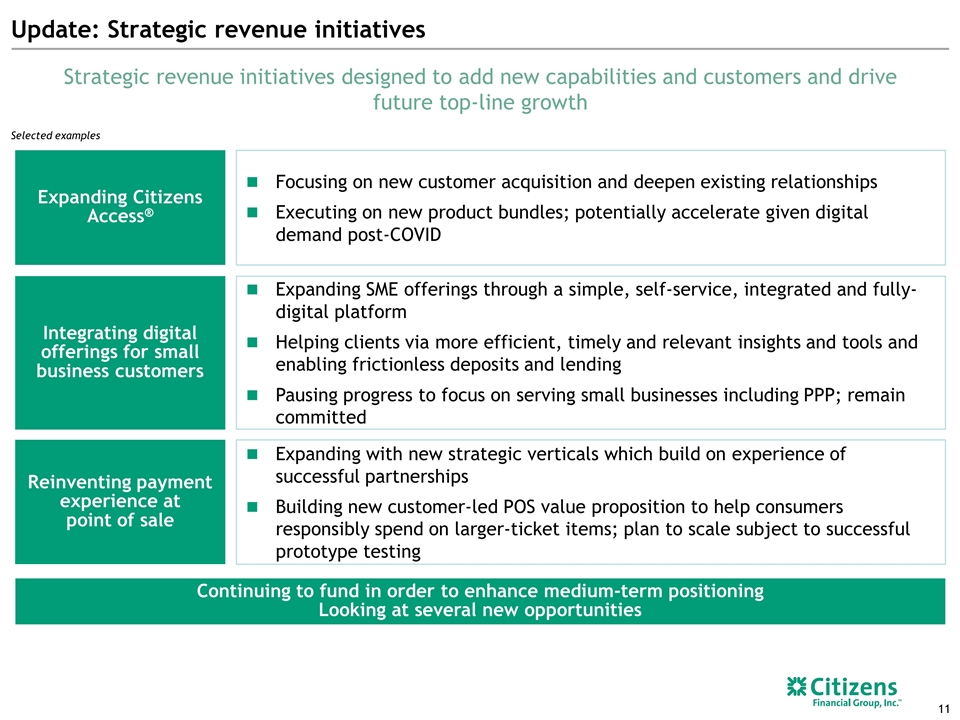
Update: Strategic revenue initiatives Selected examples Strategic revenue initiatives designed to add new capabilities and customers and drive future top-line growth Expanding Citizens Access® Reinventing payment experience at point of sale Integrating digital offerings for small business customers Focusing on new customer acquisition and deepen existing relationships Executing on new product bundles; potentially accelerate given digital demand post-COVID Expanding SME offerings through a simple, self-service, integrated and fully-digital platform Helping clients via more efficient, timely and relevant insights and tools and enabling frictionless deposits and lending Pausing progress to focus on serving small businesses including PPP; remain committed Expanding with new strategic verticals which build on experience of successful partnerships Building new customer-led POS value proposition to help consumers responsibly spend on larger-ticket items; plan to scale subject to successful prototype testing Continuing to fund in order to enhance medium-term positioning Looking at several new opportunities
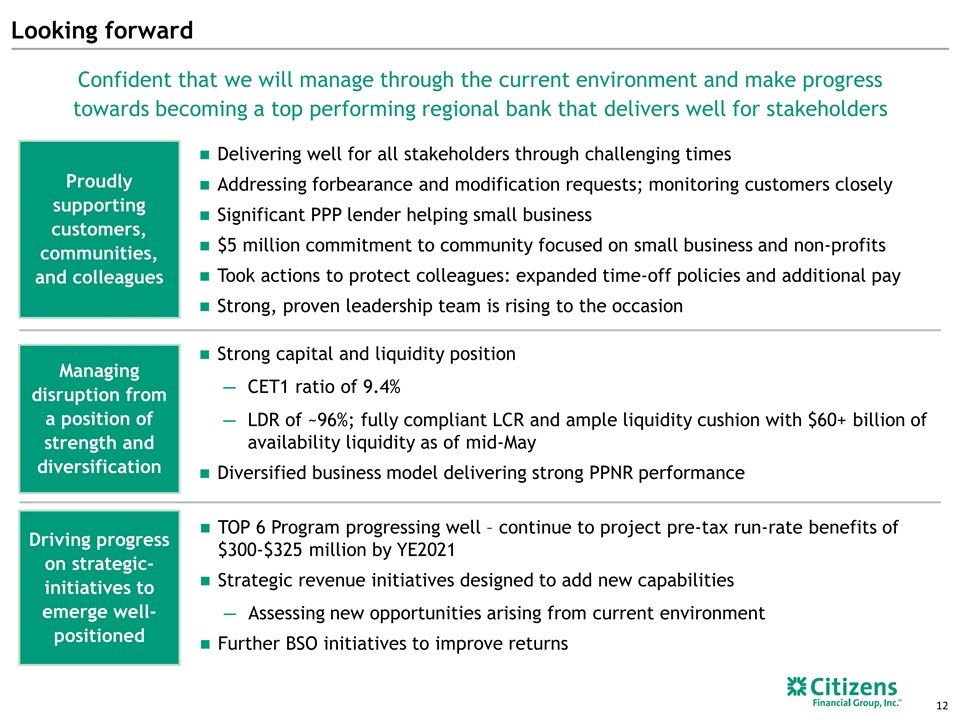
Looking forward Proudly supporting customers, communities, and colleagues Driving progress on strategic-initiatives to emerge well-positioned Delivering well for all stakeholders through challenging times Addressing forbearance and modification requests; monitoring customers closely Significant PPP lender helping small business $5 million commitment to community focused on small business and non-profits Took actions to protect colleagues: expanded time-off policies and additional pay Strong, proven leadership team is rising to the occasion Confident that we will manage through the current environment and make progress towards becoming a top performing regional bank that delivers well for stakeholders Managing disruption from a position of strength and diversification Strong capital and liquidity position CET1 ratio of 9.4% LDR of ~96%; fully compliant LCR and ample liquidity cushion with $60+ billion of availability liquidity as of mid-May Diversified business model delivering strong PPNR performance TOP 6 Program progressing well – continue to project pre-tax run-rate benefits of $300-$325 million by YE2021 Strategic revenue initiatives designed to add new capabilities Assessing new opportunities arising from current environment Further BSO initiatives to improve returns

Appendix
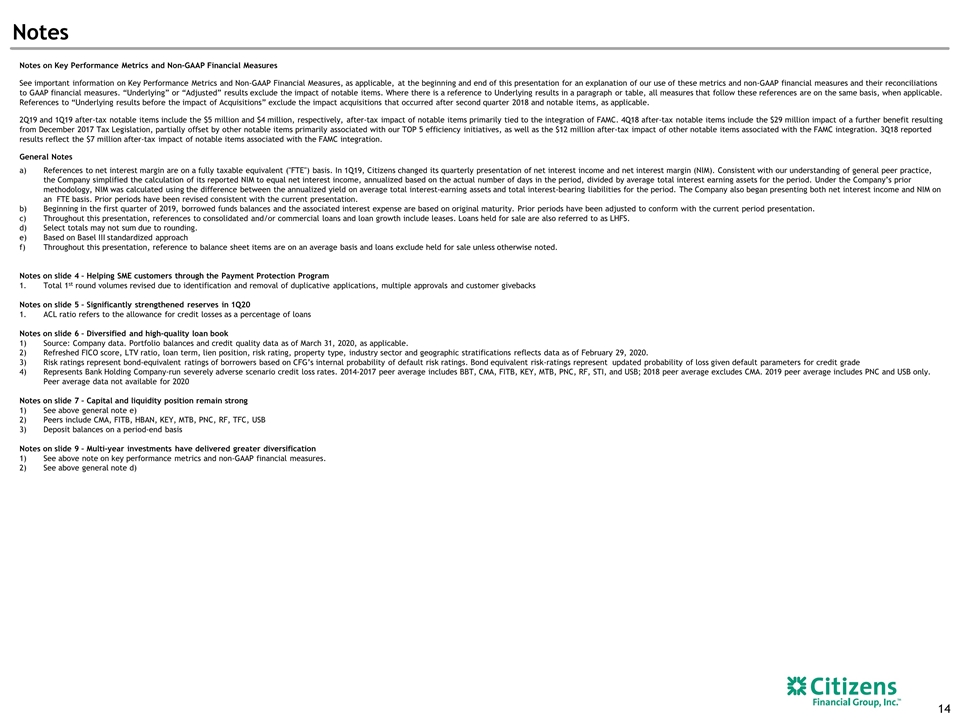
Notes Notes on Key Performance Metrics and Non-GAAP Financial Measures See important information on Key Performance Metrics and Non-GAAP Financial Measures, as applicable, at the beginning and end of this presentation for an explanation of our use of these metrics and non-GAAP financial measures and their reconciliations to GAAP financial measures. “Underlying” or “Adjusted” results exclude the impact of notable items. Where there is a reference to Underlying results in a paragraph or table, all measures that follow these references are on the same basis, when applicable. References to “Underlying results before the impact of Acquisitions” exclude the impact acquisitions that occurred after second quarter 2018 and notable items, as applicable. 2Q19 and 1Q19 after-tax notable items include the $5 million and $4 million, respectively, after-tax impact of notable items primarily tied to the integration of FAMC. 4Q18 after-tax notable items include the $29 million impact of a further benefit resulting from December 2017 Tax Legislation, partially offset by other notable items primarily associated with our TOP 5 efficiency initiatives, as well as the $12 million after-tax impact of other notable items associated with the FAMC integration. 3Q18 reported results reflect the $7 million after-tax impact of notable items associated with the FAMC integration. General Notes References to net interest margin are on a fully taxable equivalent ("FTE") basis. In 1Q19, Citizens changed its quarterly presentation of net interest income and net interest margin (NIM). Consistent with our understanding of general peer practice, the Company simplified the calculation of its reported NIM to equal net interest income, annualized based on the actual number of days in the period, divided by average total interest earning assets for the period. Under the Company’s prior methodology, NIM was calculated using the difference between the annualized yield on average total interest-earning assets and total interest-bearing liabilities for the period. The Company also began presenting both net interest income and NIM on an FTE basis. Prior periods have been revised consistent with the current presentation. Beginning in the first quarter of 2019, borrowed funds balances and the associated interest expense are based on original maturity. Prior periods have been adjusted to conform with the current period presentation. Throughout this presentation, references to consolidated and/or commercial loans and loan growth include leases. Loans held for sale are also referred to as LHFS. Select totals may not sum due to rounding. Based on Basel III standardized approach Throughout this presentation, reference to balance sheet items are on an average basis and loans exclude held for sale unless otherwise noted. Notes on slide 4 – Helping SME customers through the Payment Protection Program Total 1st round volumes revised due to identification and removal of duplicative applications, multiple approvals and customer givebacks Notes on slide 5 – Significantly strengthened reserves in 1Q20 ACL ratio refers to the allowance for credit losses as a percentage of loans Notes on slide 6 – Diversified and high-quality loan book Source: Company data. Portfolio balances and credit quality data as of March 31, 2020, as applicable. Refreshed FICO score, LTV ratio, loan term, lien position, risk rating, property type, industry sector and geographic stratifications reflects data as of February 29, 2020. Risk ratings represent bond-equivalent ratings of borrowers based on CFG’s internal probability of default risk ratings. Bond equivalent risk-ratings represent updated probability of loss given default parameters for credit grade Represents Bank Holding Company-run severely adverse scenario credit loss rates. 2014-2017 peer average includes BBT, CMA, FITB, KEY, MTB, PNC, RF, STI, and USB; 2018 peer average excludes CMA. 2019 peer average includes PNC and USB only. Peer average data not available for 2020 Notes on slide 7 – Capital and liquidity position remain strong See above general note e) Peers include CMA, FITB, HBAN, KEY, MTB, PNC, RF, TFC, USB Deposit balances on a period-end basis Notes on slide 9 – Multi-year investments have delivered greater diversification See above note on key performance metrics and non-GAAP financial measures. See above general note d)
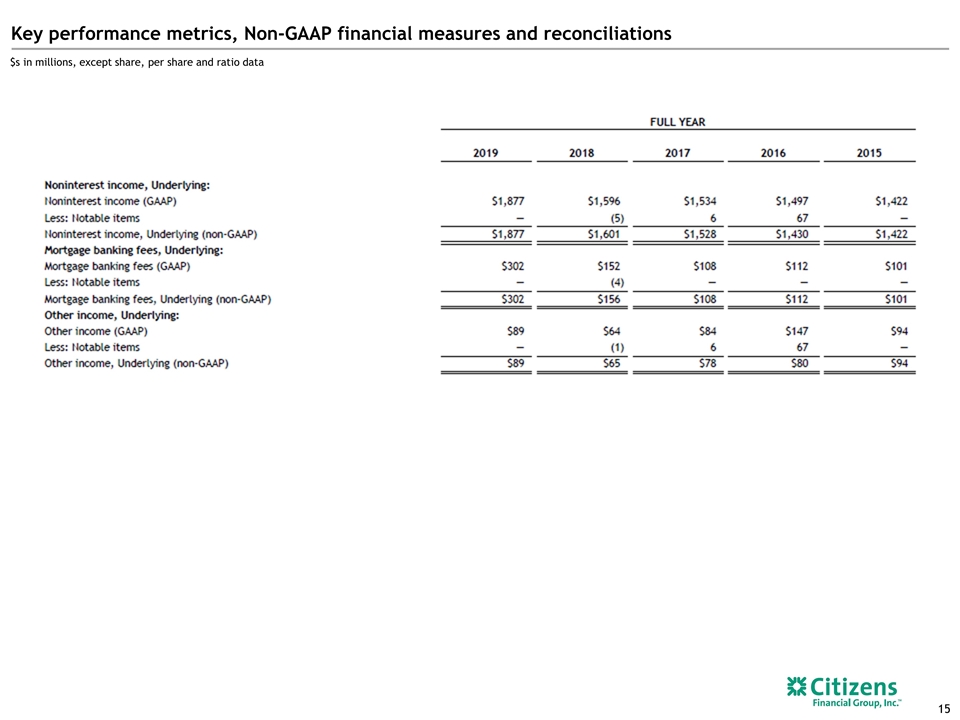
Key performance metrics, Non-GAAP financial measures and reconciliations $s in millions, except share, per share and ratio data
