Attached files
| file | filename |
|---|---|
| EX-99.1 - EX-99.1 - Yellow Corp | d842778dex991.htm |
| 8-K - 8-K - Yellow Corp | d842778d8k.htm |

YRC WORLDWIDE First QUARTER 2020 EARNINGS CONFERENCE CALL Exhibit 99.2

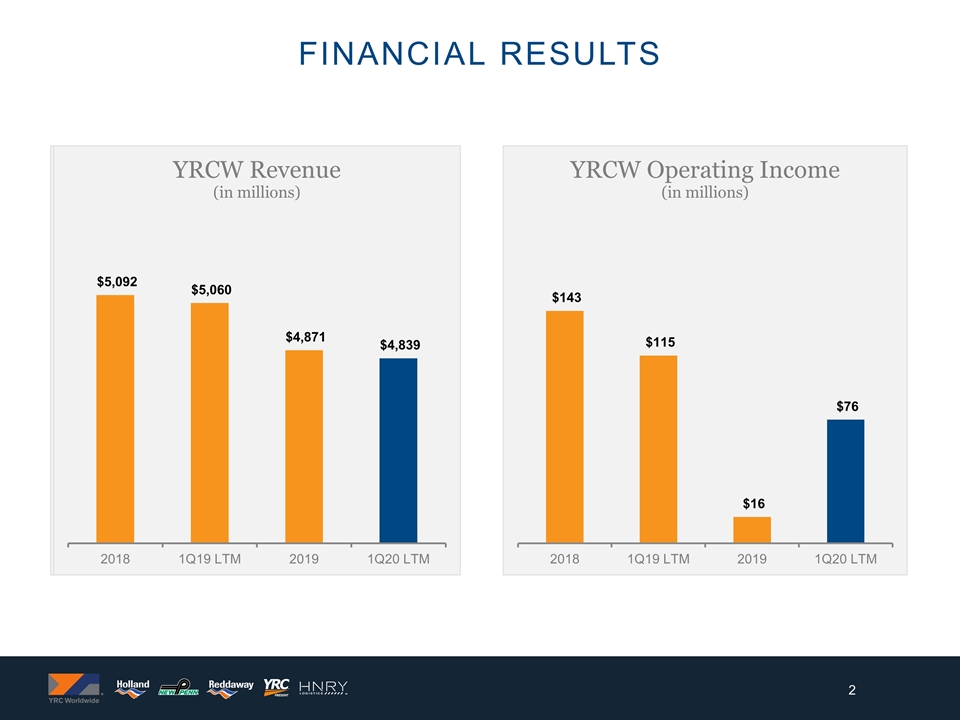
Financial results

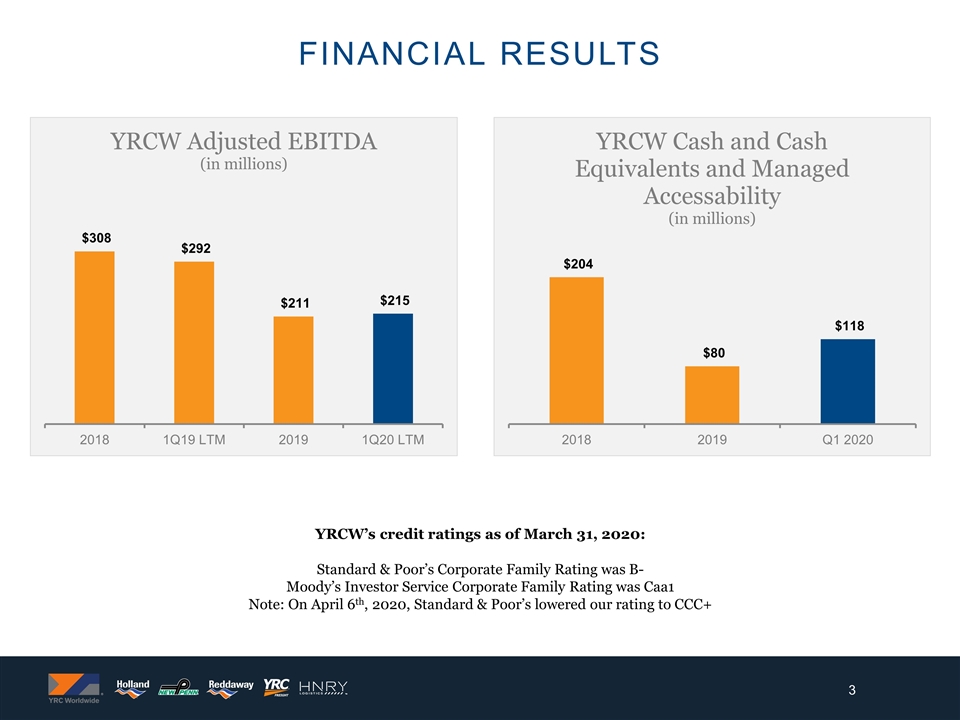
Financial results YRCW’s credit ratings as of March 31, 2020: Standard & Poor’s Corporate Family Rating was B- Moody’s Investor Service Corporate Family Rating was Caa1 Note: On April 6th, 2020, Standard & Poor’s lowered our rating to CCC+

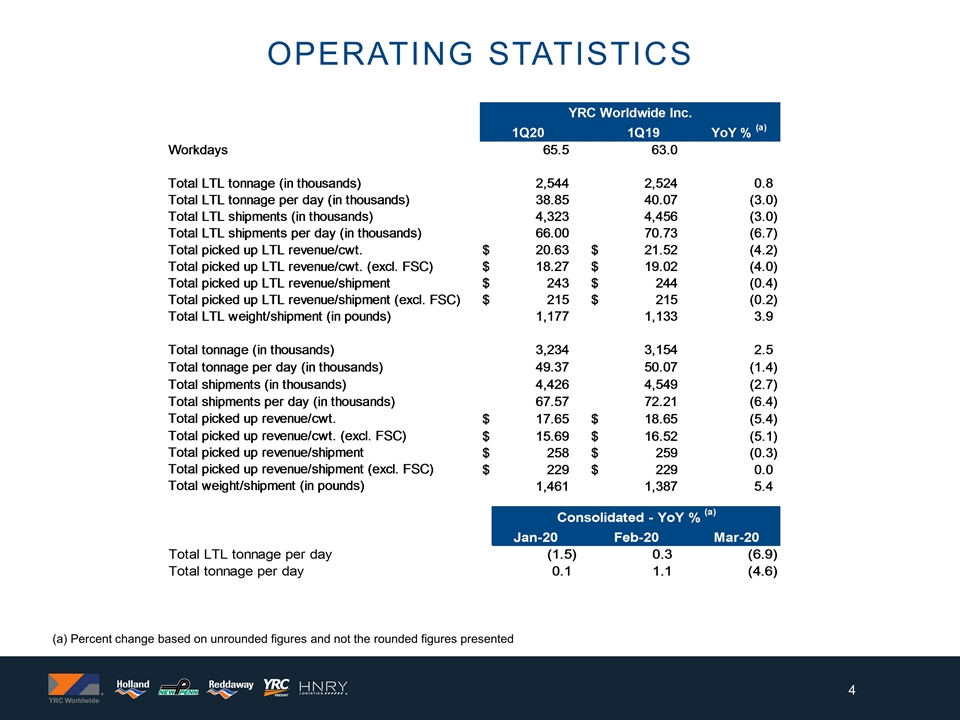
Operating statistics (a) Percent change based on unrounded figures and not the rounded figures presented Consolidated - YoY % (a) 43861 43890 43921 Total LTL tonnage per day -1.5321364887364797 0 0.29102148493551638 0 -6.9226361412681019 Total tonnage per day 0.12729207983404045 0 1.0613346161826298 0 -4.5608686113548513 (a) Percent change based on unrounded figures and not the rounded figures presented. YRC Worldwide Inc. Instructions: Statistics 1 Update linking as appropriate Quarterly Comparison 2 Review check totals at the bottom YRC Worldwide Inc. 1Q20 1Q19 YoY % (a) Workdays 65.5 63 Total LTL tonnage (in thousands) 2,544.3769425 2,524.1401149999901 0.80173154333827368 Total LTL tonnage per day (in thousands) 38.845449503816795 40.065716111110952 -3.0456627903769196 Total LTL shipments (in thousands) 4,322.7939999999999 4,455.7260029999998 -2.9833971593068784 Total LTL shipments per day (in thousands) 65.996854961832057 70.72580957142857 -6.6863209318524239 Total picked up LTL revenue/cwt. $ 20.625166450208056 $ 21.519078610588029 -4.1540447737392494 Total picked up LTL revenue/cwt. (excl. FSC) $ 18.267279423769008 $ 19.020493576200476 -3.9600137052906588 Total picked up LTL revenue/shipment $ 242.79758855561448 $ 243.80839181876192 -0.41458920080931044 Total picked up LTL revenue/shipment (excl. FSC) $ 215.04075636286416 $ 215.49974486969032 -0.21298795834013787 Total LTL weight/shipment (in pounds) 1,177.1909290611582 1,132.9871330959352 3.9015267405936234 Total tonnage (in thousands) 3,233.6407004964999 3,154.3662644999899 2.513165223984414 Total tonnage per day (in thousands) 49.368560312923663 50.069305785714128 -1.39955100593866 Total shipments (in thousands) 4,425.96 4,548.9310029999997 -2.7032945304930065 Total shipments per day (in thousands) 67.571908396946569 72.20525401587301 -6.4169092430696031 Total picked up revenue/cwt. $ 17.648636692280704 $ 18.646914357111616 -5.3535810038736296 Total picked up revenue/cwt. (excl. FSC) $ 15.685276876223373 $ 16.522723308752649 -5.068452802121624 Total picked up revenue/shipment $ 257.88461674499905 $ 258.60668164147756 -0.279213550050326 Total picked up revenue/shipment (excl. FSC) $ 229.1956985852222 $ 229.14711596383827 2.1201498076718412E-2 Total weight/shipment (in pounds) 1,461.2155105317263 1,386.8604568500596 5.3613940259388064 (a) Percent change based on unrounded figures and not the rounded figures presented. QTD Check 0 0 0 YTD Check 0

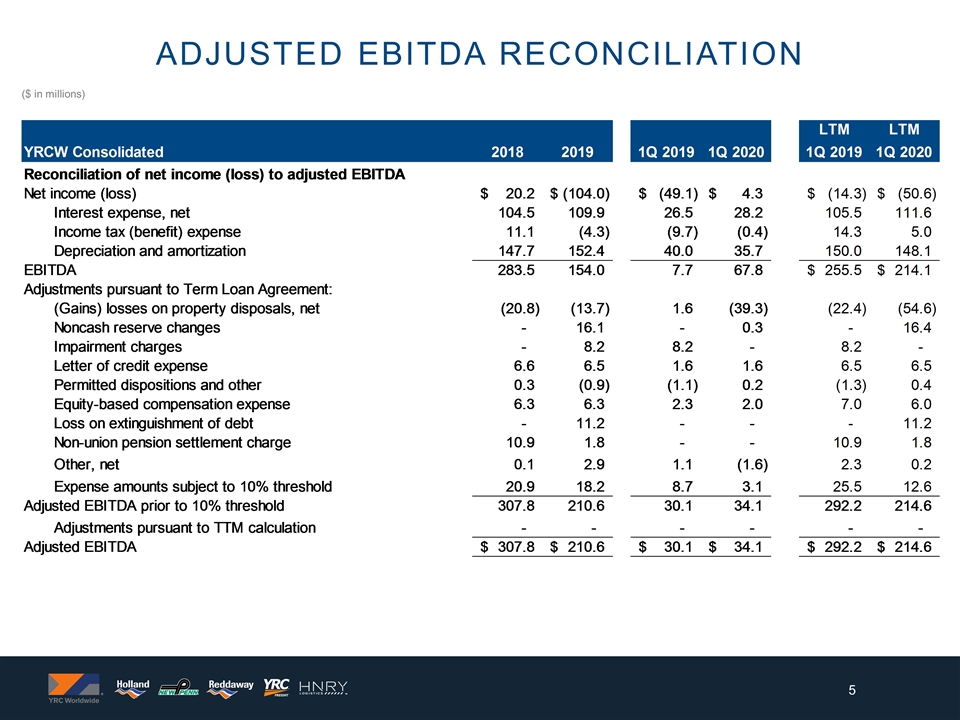
($ in millions) Adjusted Ebitda reconciliation YRCW Inc. Reconciliation of Net (Loss) Income to Adjusted EBITDA LTM LTM YRCW Consolidated 2015 2016 2017 2018 2019 2Q 2018 1Q 2019 3Q 2019 4Q 2019 1Q 2020 1Q 2019 LTM 3Q 2019 LTM 3Q 2019 1Q 2020 Reconciliation of net income (loss) to adjusted EBITDA Net income (loss) $0.7 $21.5 $-10.8 $20.2 $-,103.99999999999928 $14.4 $-49.1 $-16 $-15.299999999999827 $4.3 $-14.299999999999862 $-71.199999999999875 $-,103.99999999999983 $-50.599999999999831 Interest expense, net 107.1 103 102.4 104.5 109.9 25.5 26.5 27.7 27.900000000000006 28.2 105.5 109.3 109.9 111.60000000000001 Income tax (benefit) expense -5.0999999999999996 3.1 -7.3 11.1 -4.3 10.4 -9.6999999999999993 -0.5 -3.1999999999999997 -0.4 14.3 7.8000000000000007 -4.2999999999999989 5 Depreciation and amortization 163.69999999999999 159.80000000000001 147.69999999999999 147.69999999999999 152.4 37.599999999999994 40 37.200000000000003 36.700000000000003 35.700000000000003 150 153.19999999999999 152.4 148.10000000000002 EBITDA $266.39999999999998 $287.39999999999998 232 283.5 154.00000000000074 $87.899999999999991 7.7000000000000028 48.400000000000006 46.100000000000179 67.800000000000011 $255.50000000000011 $199.10000000000011 $154.00000000000017 $214.10000000000019 Adjustments pursuant to Term Loan Agreement: (Gains) losses on property disposals, net 1.9 -14.6 -0.6 -20.8 -13.7 2.2000000000000002 1.6 1 -10.1 -39.299999999999997 -22.4 -31.700000000000003 -13.7 -54.599999999999994 Noncash reserve changes 0 0 0 0 16.100000000000001 0 0 -2 2.1000000000000014 0.3 0 14 16.100000000000001 16.400000000000002 Impairment charges 0 0 0 0 8.1999999999999993 0 8.1999999999999993 0 0 0 8.1999999999999993 8.1999999999999993 8.1999999999999993 0 Letter of credit expense 8.8000000000000007 7.7 6.8 6.6 6.5 1.7 1.6 1.6 1.7000000000000002 1.6 6.5 6.4 6.5000000000000009 6.5 Permitted dispositions and other 0.4 3 1.2 0.3 -0.9 0.19999999999999996 -1.1000000000000001 0.1 0.1 0.2 -1.3000000000000003 -1 -0.9 0.4 Equity-based compensation expense 8.5 7.3 6.5 6.3 6.3 3.1999999999999997 2.2999999999999998 1.8 1.1000000000000001 2 6.9999999999999991 5.9999999999999991 6.3000000000000007 6 Loss on extinguishment of debt 0.6 0 0 0 11.2 0 0 11.2 0 0 0 11.2 11.2 11.2 Non-union pension settlement charge 28.7 0 7.6 10.9 1.8 0 0 1.7 0.1 0 10.9 5.4 1.8 1.8 Other, net #REF! #REF! 2.2999999999999998 0.1 2.9 1.4 1.1000000000000001 0.2 0.6 -1.6 2.2999999999999998 1.2 2.9000000000000004 0.19999999999999973 Expense amounts subject to 10% threshold 5.0999999999999996 0 8.1 20.9 18.2 3.8 8.6999999999999993 1.3 4.0999999999999996 3.1 25.5 23.500000000000004 18.2 12.6 Adjusted EBITDA prior to 10% threshold 274.2000000000001 307.8 210.60000000000073 100.4 30.1 65.300000000000011 45.800000000000189 34.100000000000016 292.2000000000001 242.30000000000007 210.60000000000016 214.60000000000019 Adjustments pursuant to TTM calculation 0.2 0 0 0 0 0 0 0.6 1.5 0 0 -1.5 0 0 Adjusted EBITDA #REF! #REF! $274.2000000000001 $307.8 $210.60000000000073 $100.4 $30.1 $65.900000000000006 $47.300000000000189 $34.100000000000016 $292.2000000000001 $240.80000000000007 $210.60000000000016 $214.60000000000019
