Attached files
| file | filename |
|---|---|
| EX-99.1 - EXHIBIT 99.1 - WhiteHorse Finance, Inc. | tm2019217d1_ex99-1.htm |
| 8-K - 8-K - WhiteHorse Finance, Inc. | tm2019217d1_8k.htm |
Exhibit 99.2

Earnings Presentation Quarter Ended March 31, 2020 WhiteHorse Finance, Inc. NASDAQ: WHF (Common Stock) NASDAQ: WHFBZ (6.50% Notes due 2025)

1 References in this presentation to “WHF”, “we”, “us”, “our” and “the Company” refer to WhiteHorse Finance, Inc. This presentation and the information and views included herein do not constitute investment advice, or a recommendation or a n o ffer to enter into any transaction with the Company or any of its affiliates. Investors are advised to consider carefully the Company’s investment objectives, r isk s, charges and expenses before investing in the Company’s securities. Our annual reports on Form 10 - K, quarterly reports on Form 10 - Q and current reports on Fo rm 8 - K, which have been filed with the Securities and Exchange Commission (“SEC”), contain this and other information about the Company and should be read car efully before investing in the Company’s securities. The information in this presentation is not complete and may be changed. This presentation is not an of fer to sell the Company’s securities and is not soliciting an offer to buy the Company’s securities in any jurisdiction where such offer or sale is not permitted. A shelf registration statement relating to the Company’s securities is on file with the SEC. A public offering of the Company ’s securities may be made only by means of a prospectus and a related prospectus supplement, copies of which may be obtained by writing the Company at 1450 Bri cke ll Avenue, 31st Floor, Miami, FL 33131, Attention: Investor Relations, or by calling (305) 381 - 6999; copies may also be obtained by visiting EDGAR on the SEC’ s website at http://www.sec.gov . Forward Looking Statements Some of the statements in this presentation constitute forward - looking statements, which relate to future events or the Company’ s future performance or financial condition. The forward - looking statements contained in this presentation involve risks and uncertainties, including statements as to: the Company’s future operating results; changes in political, economic or industry conditions, the interest rate environment or conditions affecti ng the financial and capital markets, which could result in changes to the value of the Company’s assets; the impact of the COVID - 19 pandemic and its effects on the C ompany’s and its portfolio companies’ results of operations and financial condition; the Company’s business prospects and the prospects of its prospecti ve portfolio companies; the impact of investments that the Company expects to make; the impact of increased competition; the Company’s contractual arrangements and relationships with third parties; the dependence of the Company’s future success on the general economy and its impact on the industries in which the Com pany invests; the ability of the Company’s prospective portfolio companies to achieve their objectives; the relative and absolute performance of the Company’s in vestment adviser; the Company’s expected financings and investments; the adequacy of the Company’s cash resources and working capital; the timing o f c ash flows, if any, from the operations of the Company’s prospective portfolio companies; and the impact of future acquisitions and divestitures. Such forward - looking statements may include statements preceded by, followed by or that otherwise include the words “may,” “migh t,” “will,” “intend,” “should,” “could,” “can,” “would,” “expect,” “believe,” “estimate,” “anticipate,” “predict,” “potential,” “plan” or similar words. The Company has based the forward - looking statements included in this presentation on information available to us on the date of this presentation, and the Company assumes no obligation to update any such forward - looking statements. Actual results could differ materially from those implied or expressed in the Company’s forward - looking statements for any reason, and future results could differ materially from historical performance. Al though the Company undertakes no obligation to revise or update any forward - looking statements, whether as a result of new information, future events or other wise, you are advised to consult any additional disclosures that are made directly to you or through reports that the Company in the future may file with the SEC , including annual reports on Form 10 - K, quarterly reports on Form 10 - Q and current reports on Form 8 - K. For a further discussion of factors that could cause the Company’s future results to differ materially from any forward - looking statements, see the section entitled “Risk Factors” in the annual reports on Form 10 - K and q uarterly reports on Form 10 - Q we file with the SEC. Important Information and Forward Looking Statements

2 WhiteHorse Finance Snapshot Company: WhiteHorse Finance, Inc. (“ WhiteHorse Finance” or the “Company”) : Equity Ticker: NASDAQ: WHF Market Cap: $191.7MM (1) NAV / Share: $13.86 Portfolio Fair Value: $557.1MM Current Dividend Yield: 15.2% (1)(2) ; consistent quarterly dividends of $0.355 per share since 2012 IPO (1) Based on May 8, 2020 share price of $9.33. (2) Based on LTM annualized dividend rate, excluding special dividends, relative to closing share price. External Manager: Affiliate of H.I.G. Capital, LLC (“H.I.G. Capital” or “H.I.G.”)
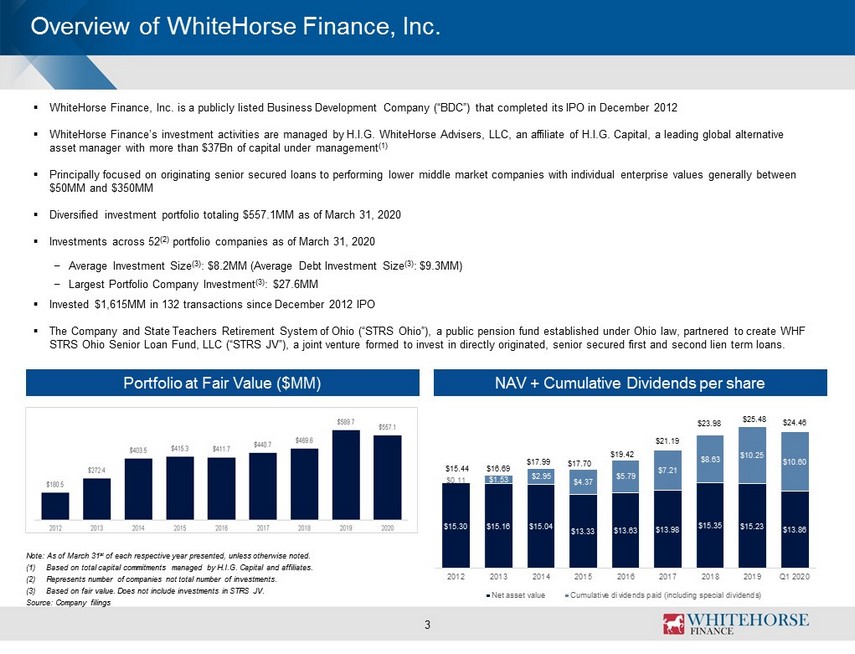
Overview of WhiteHorse Finance, Inc. 3 Portfolio at Fair Value ($MM) NAV + Cumulative Dividends per share Note: As of March 31 st of each respective year presented, unless otherwise noted. (1) Based on total capital commitments managed by H.I.G. Capital and affiliates. (2) Represents number of companies not total number of investments. (3) Based on fair value. Does not include investments in STRS JV. Source: Company filings ▪ WhiteHorse Finance, Inc. is a publicly listed Business Development Company (“BDC”) that completed its IPO in December 2012 ▪ WhiteHorse Finance’s investment activities are managed by H.I.G. WhiteHorse Advisers, LLC, an affiliate of H.I.G. Capital, a leading glo ba l alternative asset manager with more than $37Bn of capital under management (1) ▪ Principally focused on originating senior secured loans to performing lower middle market companies with individual enterpris e v alues generally between $50MM and $350MM ▪ Diversified investment portfolio totaling $557.1MM as of March 31, 2020 ▪ Investments across 52 (2) portfolio companies as of March 31, 2020 − Average Investment Size (3) : $8.2MM (Average Debt Investment Size (3) : $9.3MM) − Largest Portfolio Company Investment (3) : $27.6MM ▪ Invested $1,615MM in 132 transactions since December 2012 IPO ▪ The Company and State Teachers Retirement System of Ohio (“STRS Ohio”), a public pension fund established under Ohio law, par tne red to create WHF STRS Ohio Senior Loan Fund, LLC (“STRS JV”), a joint venture formed to invest in directly originated, senior secured first an d s econd lien term loans. $15.44 $16.69 $17.99 $17.70 $19.42 $25.48 $23.98 $21.19 $24.46 $15.30 $15.16 $15.04 $13.33 $13.63 $13.98 $15.35 $15.23 $13.86 $0.11 $1.53 $2.95 $4.37 $5.79 $7.21 $8.63 $10.25 $10.60 2012 2013 2014 2015 2016 2017 2018 2019 Q1 2020 Net asset value Cumulative dividends paid (including special dividends)

4 Overview of WhiteHorse Finance, Inc. (continued) Note: As of March 31, 2020 unless otherwise noted. (1) Reflects life - to - date since IPO, and may exclude follow - on transactions and investments in STRS JV made via asset transfers in - k ind. (2) Across 63 investments. Does not include investments in STRS JV. (3) Reflects weighted average effective yield of income - producing debt investments. Weighted average effective yield for entire port folio, including equities and investments in STRS JV, as of March 31, 2020, is 9.1%. Weighted average effective yield is computed by dividing (a) annualized interest income (including interest in com e resulting from the amortization of fees and discounts) by (b) the weighted average cost of investments. (4) Measured at origination based on WHF’s underwriting leverage. Does not include investments in STRS JV. (5) Does not include investments in STRS JV. ▪ Generate attractive risk - adjusted return in all market conditions by originating and investing in senior secured loans to performing lower middle market companies and leveraging the knowledge of H.I.G. Capital ▪ Differentiated proprietary deal flow from over 40 dedicated deal professionals sourced through direct coverage of financial sponsors and intermediaries as of March 31, 2020 ▪ Rigorous credit process focused on fundamental analysis with emphasis on downside protection and cash flow visibility ▪ 11 - person investment committee with more than 250 years of industry experience ▪ Investment strategy focused on first lien and second lien senior secured investments in lower middle market companies with a target hold size of $4MM to $20MM Summary Stats: Invested Capital since IPO: $1,615MM (1) Number of Investments Made: ~ 132 (1) Average Investment Size: ~$8.2 MM (2) All - in Yield : 9.9% (3) Net Debt / EBITDA of Current Portfolio Companies: ~3.7x (4) Secured Debt as a % of Total Debt : 100% (5) Investment Strategy
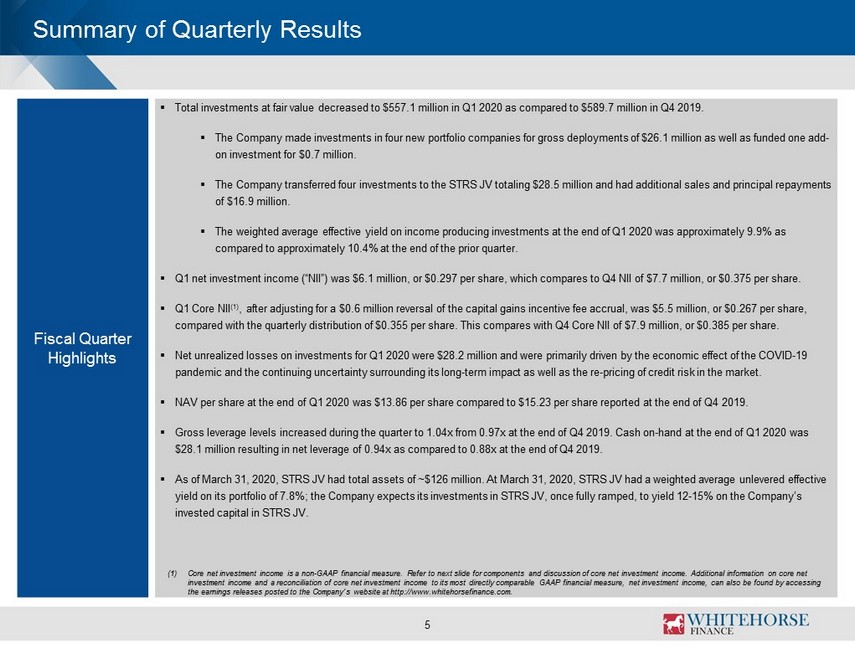
5 Summary of Quarterly Results Fiscal Quarter Highlights ▪ Total investments at fair value decreased to $557.1 million in Q1 2020 as compared to $589.7 million in Q4 2019. ▪ The Company made investments in four new portfolio companies for gross deployments of $26.1 million as well as funded one add - on investment for $0.7 million. ▪ The Company transferred four investments to the STRS JV totaling $28.5 million and had additional sales and principal repayme nts of $16.9 million. ▪ The weighted average effective yield on income producing investments at the end of Q1 2020 was approximately 9.9% as compared to approximately 10.4% at the end of the prior quarter. ▪ Q1 net investment income (“NII”) was $6.1 million, or $0.297 per share, which compares to Q4 NII of $7.7 million, or $0.375 p er share. ▪ Q1 Core NII (1) , after adjusting for a $0.6 million reversal of the capital gains incentive fee accrual, was $5.5 million, or $0.267 per share, compared with the quarterly distribution of $0.355 per share. This compares with Q4 Core NII of $7.9 million, or $0.385 per s har e. ▪ Net unrealized losses on investments for Q1 2020 were $28.2 million and were primarily driven by the economic effect of the C OVI D - 19 pandemic and the continuing uncertainty surrounding its long - term impact as well as the re - pricing of credit risk in the market. ▪ NAV per share at the end of Q1 2020 was $13.86 per share compared to $15.23 per share reported at the end of Q4 2019. ▪ Gross leverage levels increased during the quarter to 1.04x from 0.97x at the end of Q4 2019. Cash on - hand at the end of Q1 2020 was $28.1 million resulting in net leverage of 0.94x as compared to 0.88x at the end of Q4 2019. ▪ As of March 31, 2020, STRS JV had total assets of ~$126 million. At March 31, 2020, STRS JV had a weighted average unlevered eff ective yield on its portfolio of 7.8%; the Company expects its investments in STRS JV, once fully ramped, to yield 12 - 15% on the Compan y’s invested capital in STRS JV. (1) Core net investment income is a non - GAAP financial measure. Refer to next slide for components and discussion of core net invest ment income. Additional information on core net investment income and a reconciliation of core net investment income to its most directly comparable GAAP financial measure, net investment income, can also be found by accessing the earnings releases posted to the Company’s website at http://www.whitehorsefinance.com.

6 Quarterly Operating Highlights Note: N umbers may not foot due to rounding. (1) Total investment income includes investment income (e.g., interest and dividends) from investments in STRS JV. (2) Net of fee waivers, if any. (3) Core net investment income is a non - GAAP financial measure. The Company believes that core net investment income provides useful information to investors and management because it reflects the Company's financial performance excluding (i) the net impact of costs associated with the refinancing of the Company's indebtedness, (ii) the acc rua l of the capital gains incentive fee attributable to realized and unrealized gains and losses, and (iii) certain excise or other income taxes (net of incentive fees). The presentation of this additional information is not me ant to be considered in isolation or as a substitute for financial results prepared in accordance with GAAP. Additional information on core net investment income and a reconciliation of core net investment income to its most directly com parable GAAP financial measure, net investment income, can be found by accessing the earnings releases posted to the Company’s website at http://www.whitehorsefinance.com . Source: Company filings Unaudited Quarterly Financials Q4 18 Q1 19 Q2 19 Q3 19 Q4 19 Q1 20 (USD in MM, expect per share data) Total Investment Income (1) 16.7$ 15.9$ 16.0$ 17.8$ 17.4$ 14.5$ Expenses Interest Expenses 3.0 3.1 3.2 3.5 3.7 3.7 Base Management Fees (2) 2.5 2.4 2.6 2.8 3.1 3.1 Performance-based Incentive Fees 1.2 1.8 2.1 1.7 2.2 0.4 Other Expenses 1.9 1.1 0.9 1.1 0.7 1.2 Total Expenses 8.6 8.3 8.8 9.1 9.7 8.4 Net Investment Income 8.0$ 7.6$ 7.2$ 8.7$ 7.7$ 6.1$ Net Realized and Unrealized Gain / (Loss) (3.1) (0.6) 1.0 (1.8) 1.1 (27.1) Net Increase in Net Assets from Operations 4.9$ 7.0$ 8.2$ 6.9$ 8.8$ (21.0)$ Per Share Net Investment Income (NII) 0.39$ 0.37$ 0.35$ 0.42$ 0.37$ 0.30$ Core NII (3) 0.40$ 0.37$ 0.36$ 0.40$ 0.39$ 0.27$ Net Realized and Unrealized Gain / (Loss) (0.15)$ (0.03)$ 0.06$ (0.08)$ 0.05$ (1.31)$ Earnings 0.24$ 0.34$ 0.41$ 0.34$ 0.42$ (1.01)$ Dividends Declared 0.355$ 0.355$ 0.355$ 0.355$ 0.355$ 0.355$ Core NII Dividend Coverage 112% 103% 102% 114% 108% 75%

7 Quarterly Balance Sheet Highlights Note: Numbers may not foot due to rounding (1) Includes Restricted Cash (2) Calculated as Total Gross Debt Outstanding divided by Total Net Assets (3) Net Leverage Ratio is defined as debt outstanding less cash, divided by total net assets (4) Fundings , exits and repayments may include cash flows on revolver investments as well as non - cash transactions (e.g., PIK, equity issuan ces). Unaudited Quarterly Financials Q4 18 Q1 19 Q2 19 Q3 19 Q4 19 Q1 20 (USD in MM, expect per share data) Assets Investments at Fair Value 469.6$ 468.4$ 534.8$ 527.5$ 589.7$ 557.1$ Cash and Equivalents (1) 33.7 36.9 50.4 22.2 27.5 28.1 Other Assets 10.8 16.2 7.9 16.3 14.0 6.7 Total Assets 514.1$ 521.5$ 593.1$ 566.0$ 631.2$ 591.9$ Liabilities Debt (net of issuance costs) 176.0 176.2 245.8 232.0 298.9 291.1 Other Liabilities 22.8 30.3 31.4 18.6 19.3 16.1 Total Liabilities 198.8$ 206.5$ 277.2$ 250.5$ 318.3$ 307.2$ Total Net Assets 315.3$ 315.0$ 315.9$ 315.5$ 313.0$ 284.7$ Total Liabilities and Net Assets 514.1$ 521.5$ 593.1$ 566.0$ 631.2$ 591.9$ Net Asset Value per Share 15.35$ 15.33$ 15.38$ 15.36$ 15.23$ 13.86$ Leverage Ratio (2) 0.57x 0.57x 0.79x 0.75x 0.97x 1.04x Net Leverage Ratio (3) 0.46x 0.45x 0.63x 0.68x 0.88x 0.94x Gross Fundings (4) 67.2 49.7 76.5 81.6 155.4 27.6 Exits and Repayments (4) (105.6) (52.3) (12.3) (89.1) (95.8) (33.6) Net Fundings (38.3)$ (2.6)$ 64.2$ (7.5)$ 59.6$ (6.0)$
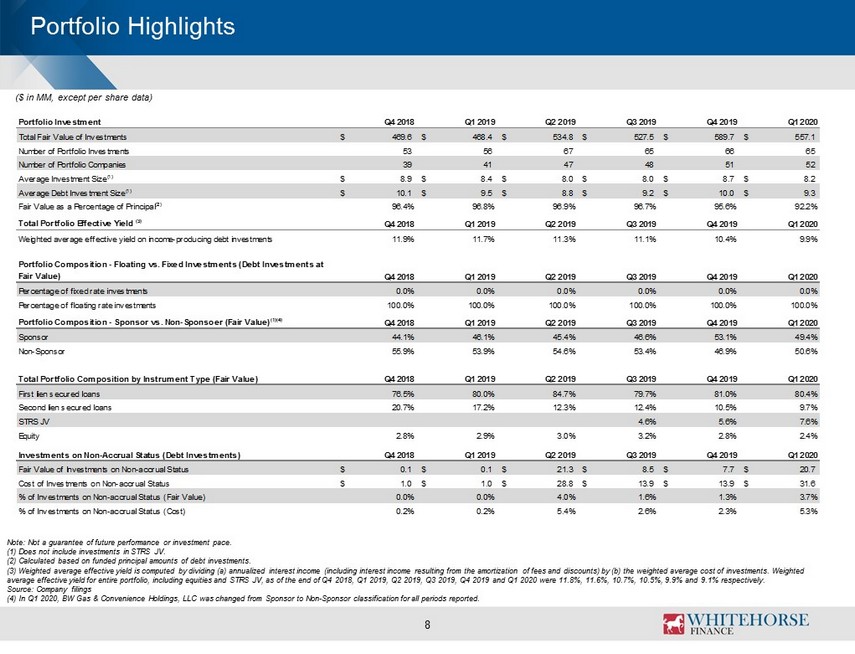
Portfolio Highlights 8 Note: Not a guarantee of future performance or investment pace. (1) Does not include investments in STRS JV. (2) Calculated based on funded principal amounts of debt investments. ( 3) Weighted average effective yield is computed by dividing (a) annualized interest income (including interest income resulting fro m the amortization of fees and discounts) by (b) the weighted average cost of investments. Weighted average effective yield for entire portfolio, including equities and STRS JV, as of the end of Q4 2018, Q1 2019, Q2 2019, Q3 201 9, Q4 2019 and Q1 2020 were 11.8%, 11.6%, 10.7%, 10.5%, 9.9% and 9.1% respectively. Source: Company filings (4) In Q1 2020, BW Gas & Convenience Holdings, LLC was changed from Sponsor to Non - Sponsor classification for all periods report ed. ($ in MM, except per share data) Portfolio Investment Q4 2018 Q1 2019 Q2 2019 Q3 2019 Q4 2019 Q1 2020 Total Fair Value of Investments 469.6$ 468.4$ 534.8$ 527.5$ 589.7$ 557.1$ Number of Portfolio Investments 53 56 67 65 66 65 Number of Portfolio Companies 39 41 47 48 51 52 Average Investment Size(1) 8.9$ 8.4$ 8.0$ 8.0$ 8.7$ 8.2$ Average Debt Investment Size(1) 10.1$ 9.5$ 8.8$ 9.2$ 10.0$ 9.3$ Fair Value as a Percentage of Principal(2) 96.4% 96.8% 96.9% 96.7% 95.6% 92.2% Total Portfolio Effective Yield (3) Q4 2018 Q1 2019 Q2 2019 Q3 2019 Q4 2019 Q1 2020 Weighted average effective yield on income-producing debt investments 11.9% 11.7% 11.3% 11.1% 10.4% 9.9% Portfolio Composition - Floating vs. Fixed Investments (Debt Investments at Fair Value) Q4 2018 Q1 2019 Q2 2019 Q3 2019 Q4 2019 Q1 2020 Percentage of fixed rate investments 0.0% 0.0% 0.0% 0.0% 0.0% 0.0% Percentage of floating rate investments 100.0% 100.0% 100.0% 100.0% 100.0% 100.0% Portfolio Composition - Sponsor vs. Non-Sponsoer (Fair Value)(1)(4) Q4 2018 Q1 2019 Q2 2019 Q3 2019 Q4 2019 Q1 2020 Sponsor 44.1% 46.1% 45.4% 46.6% 53.1% 49.4% Non-Sponsor 55.9% 53.9% 54.6% 53.4% 46.9% 50.6% Total Portfolio Composition by Instrument Type (Fair Value) Q4 2018 Q1 2019 Q2 2019 Q3 2019 Q4 2019 Q1 2020 First lien secured loans 76.5% 80.0% 84.7% 79.7% 81.0% 80.4% Second lien secured loans 20.7% 17.2% 12.3% 12.4% 10.5% 9.7% STRS JV 4.6% 5.6% 7.6% Equity 2.8% 2.9% 3.0% 3.2% 2.8% 2.4% Investments on Non-Accrual Status (Debt Investments) Q4 2018 Q1 2019 Q2 2019 Q3 2019 Q4 2019 Q1 2020 Fair Value of Investments on Non-accrual Status 0.1$ 0.1$ 21.3$ 8.5$ 7.7$ 20.7$ Cost of Investments on Non-accrual Status 1.0$ 1.0$ 28.8$ 13.9$ 13.9$ 31.6$ % of Investments on Non-accrual Status (Fair Value) 0.0% 0.0% 4.0% 1.6% 1.3% 3.7% % of Investments on Non-accrual Status (Cost) 0.2% 0.2% 5.4% 2.6% 2.3% 5.3%

Portfolio Trends Historical Portfolio Trends 9 % Floating and % Fixed (Based on Fair Value) % Instrument Type (Based on Fair Value) % Sponsored / Non - Sponsored (Based on Fair Value) % Non Accruals (Based on Fair Value) (1) Note: As of end of each year/quarter presented, unless otherwise noted; percentages may not add up to 100% due to rounding. Not a guarantee of future performance or investment pace. (1) Except as otherwise indicated, non - zero values <0.05%.
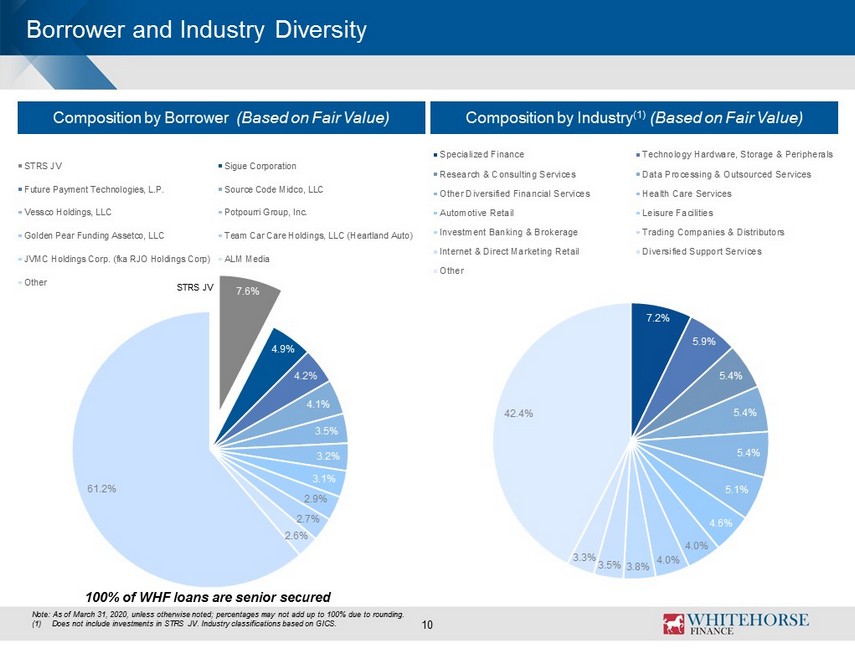
10 Note: As of March 31, 2020, unless otherwise noted; percentages may not add up to 100% due to rounding. (1) Does not include investments in STRS JV. Industry classifications based on GICS. Composition by Borrower (Based on Fair Value) Composition by Industry (1) (Based on Fair Value) 100% of WHF loans are senior secured Borrower and Industry Diversity 7.6% 4.9% 4.2% 4.1% 3.5% 3.2% 3.1% 2.9% 2.7% 2.6% 61.2% STRS JV Sigue Corporation Future Payment Technologies, L.P. Source Code Midco, LLC Vessco Holdings, LLC Potpourri Group, Inc. Golden Pear Funding Assetco, LLC Team Car Care Holdings, LLC (Heartland Auto) JVMC Holdings Corp. (fka RJO Holdings Corp) ALM Media Other 7.2% 5.9% 5.4% 5.4% 5.4% 5.1% 4.6% 4.0% 4.0% 3.8% 3.5% 3.3% 42.4% Specialized Finance Technology Hardware, Storage & Peripherals Research & Consulting Services Data Processing & Outsourced Services Other Diversified Financial Services Health Care Services Automotive Retail Leisure Facilities Investment Banking & Brokerage Trading Companies & Distributors Internet & Direct Marketing Retail Diversified Support Services Other STRS JV

Effective Yield & Dividend Coverage Debt Portfolio Effective Yield and Borrower Leverage (1) From IPO to March 31, 2020 11 Core NII (2) to Dividend Coverage (3) Note: Amounts may not foot due to rounding. (1) Portfolio leverage is based on investment leverage at inception (2) Core net investment income is a non - GAAP financial measure. The Company believes that core net investment income provides useful information to investors and management because it reflects the Company's financial performance excluding (i) the net impact of costs associated with the refinancing of the Company's indebtedness, (ii) the accrual of the capital gains incentive fee attributable to realized and unrealized gains and losses, and (iii) certain excise or other income taxes (net of incentive fees). The presentation of this additional information is not meant to be considered in isolation or as a substitute for financial r es ults prepared in accordance with GAAP. The presentation of this additional information is not meant to be considered in isolation or as a substitute for financial resul ts prepared in accordance with GAAP. Additional information on core net investment income and a reconciliation of core net investment income to its most directly comparable GAAP financial measure, net investment income, can be found by acc essing the earnings releases posted to the Company’s website at http://www.whitehorsefinance.com (3) Does not include special dividends. (4) WHF’s dividend coverage was impacted in 3Q 2017 by the timing of deployment of the equity issuance of ~$31mm in June 2017 Source: Company filings Covered by $0.01 Missed by $0.00 Covered by $0.04 Covered by $0.00 Covered by $0.00 Covered by $0.02 Missed by $0.07 (4) Covered by $0.07 Missed by $0.02 Missed by $0.03 Missed by $0.01 Covered by $0.04 Covered by $0.01 Covered by $0.05 Covered by $ 0.03 Missed by $0.09
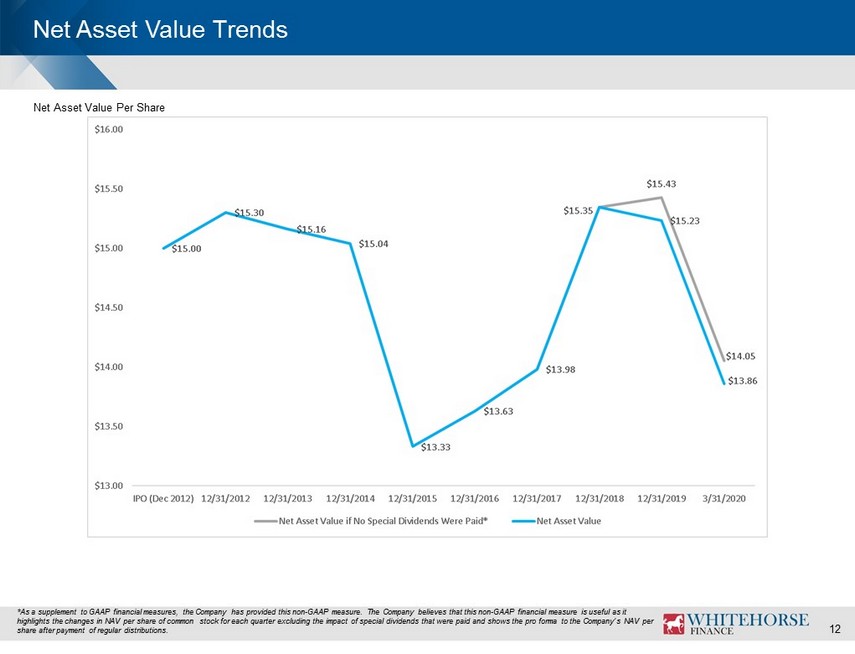
Net Asset Value Trends 12 *As a supplement to GAAP financial measures, the Company has provided this non - GAAP measure. The Company believes that this non - GAAP financial measure is useful as it highlights the changes in NAV per share of common stock for each quarter excluding the impact of special dividends that were pai d and shows the pro forma to the Company’s NAV per share after payment of regular distributions. Net Asset Value Per Share

Note: As of end of each quarter presented, unless otherwise noted. Not a guarantee of future performance or investment pace. (1) As of March 31, 2020 WHF had $4.7MM of deferred debt issuance costs (2) Gross leverage excluding cash 3 Current Debt Outstanding (as of March 31, 2020) ($ in MM) Commitment Outstanding (1) Weighted Average Interest Rate Maturity Additional Information Revolving Credit Facility $250.0 ($100 Accordion Feature) $230.9 L+2.50% payable quarterly 2024 Private Notes $30.0 $30.0 6.00% payable semi - annually; unsecured 2023 Senior Notes $35.0 $35.0 6.50% payable quarterly; unsecured 2025 NASDAQ: WHFBZ Total Debt $315.0 $295.9 Total Shareholders’ Equity/Net Assets $284.7 NA Funding Profile 13 Gross Debt to Equity (2) 1.0x - 1.25x Target Leverage

14 Appendix

15 COVID - 19 Portfolio Exposure WhiteHorse Finance, Inc. STRS JV Very High , 3.8% High , 2.5% Moderate , 41.2% Low/Moderate , 7.3% Low , 37.7% Very High , 7.8% High , 4.3% Moderate , 33.3% Low/Moderate , 9.4% Low , 45.3% WHF STRS JV, 7.6% WHF Fair Value % of FV Very High $ 21 . 0 3 . 8 % High 13 . 7 2 . 5 Moderate 229 . 8 41 . 2 Low/Moderate 40 . 6 7 . 3 Low 210 . 0 37 . 7 STRS JV 42 . 1 7 . 6 Total $ 557 . 1 100 . 0 % STRS JV Fair Value % of FV Very High $ 9 . 6 7 . 8 % High 5 . 3 4 . 3 Moderate 40 . 9 33 . 3 Low/Moderate 11 . 5 9 . 4 Low 55 . 6 45 . 3 Total 123 . 0 100 . 0 % Note: Fair values are as of March 31, 2020 and may not foot due to rounding; percentages may not add up to 100% due to roundi ng. (1) The information above reflects management’s best estimates based on data available as of May 11, 2020 and not as of any futur e d ate. The assumptions and estimates underlying the allocations presented herein are inherently uncertain and subject to a wide variety of significant b usi ness and economic risks and uncertainties, including as a direct or indirect result of the COVID - 19 pandemic or the decrease in business activity that resul ted from it, that could cause the allocations of actual portfolio exposure to differ materially from the estimates contained herein. These allocations are ther efo re subject to change without notice at any given time as more data become available. WhiteHorse Finance, Inc. undertakes no duty or obligation to publicly update, supplement or revise the information contained in this Presentation. (2) Within any given category, there are variations in the amount of exposure. For example, not all investments in the Low categ ory experience the same level of exposure. (3) The Low/Moderate category includes portfolio companies where impact so far has been low, but is expected to rise to moderate ove r time.

Origination Footprint ( March 31, 2020) Regional Direct Origination Footprint ▪ Scope of H.I.G. WhiteHorse market coverage results in consistent investment activity levels regardless of market conditions ▪ Dedicated direct lending team of over 40 investment and origination professionals ▪ Regional footprint with 19 dedicated direct lending originators in 12 North American offices ▪ Global platform of approximately 415 investment professionals across 18 offices in 9 countries and 3 continents ▪ Additional 25 generalist business development professionals dedicated to sourcing proprietary opportunities in the lower to m idd le market Los Angeles Miami New York Boston Chicago Atlanta Stamford San Francisco Existing offices with senior originators Puerto Rico Headquarters of a portfolio company Dallas Washington, D.C. Toronto Vancouver 16
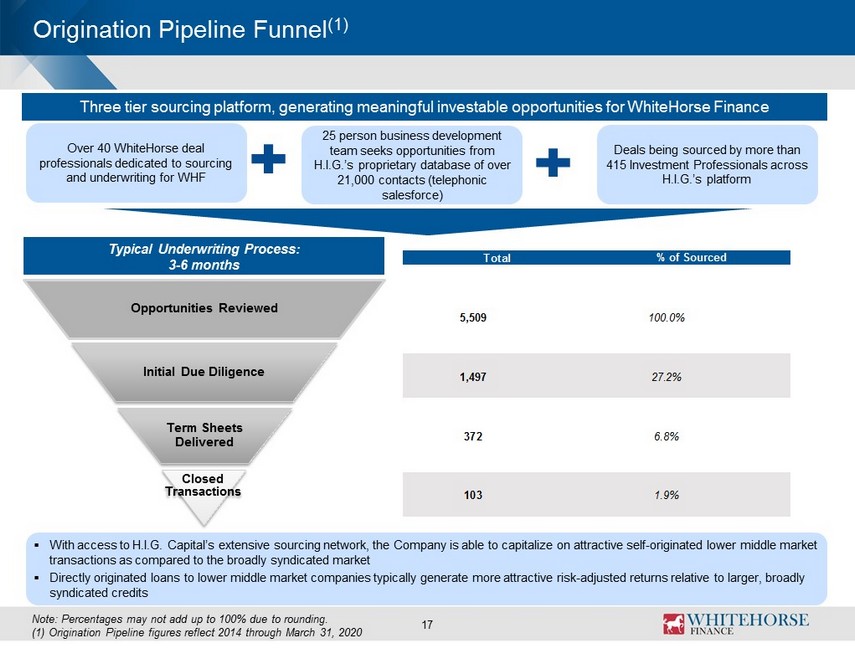
Origination Pipeline Funnel (1) 17 Note: Percentages may not add up to 100% due to rounding. (1) Origination Pipeline figures reflect 2014 through March 31, 2020 Three tier sourcing platform, generating meaningful investable opportunities for WhiteHorse Finance Over 40 WhiteHorse deal professionals dedicated to sourcing and underwriting for WHF 25 person business development team seeks opportunities from H.I.G.’s proprietary database of over 21,000 contacts (telephonic salesforce) ▪ With access to H.I.G. Capital’s extensive sourcing network, the Company is able to capitalize on attractive self - originated lowe r middle market transactions as compared to the broadly syndicated market ▪ Directly originated loans to lower middle market companies typically generate more attractive risk - adjusted returns relative to larger, broadly syndicated credits Typical Underwriting Process: 3 - 6 months Opportunities Reviewed Initial Due Diligence Term Sheets Delivered Closed Transactions Deals being sourced by more than 415 Investment Professionals across H.I.G.’s platform 5,509 100.0% 1,497 27.2% 372 6.8% 103 1.9% Total % of Sourced

18 Corporate Data Board of Directors Investment Committee Corporate Officers Research Coverage Corporate Counsel John Bolduc Sami Mnaymneh Stuart Aronson Tim Hayes Dechert LLP Chairman of the Board Founder and Co - CEO of H.I.G. Capital Chief Executive Officer B. Riley FBR New York, NY Stuart Aronson Anthony Tamer Marco Collazos George Bahamondes Corporate Headquarters Director Founder and Co - CEO of H.I.G. Capital Chief Compliance Officer Deutsche Bank 1450 Brickell Avenue 31st Floor Jay Carvell Stuart Aronson Joyson Thomas Richard Shane Miami, FL 33131 Director Chief Executive Officer and Director Chief Financial Officer J.P. Morgan Transfer Agent Kevin F. Burke Mark Bernier Mickey Schleien American Stock Transfer & Independent Director Managing Director of WhiteHorse Capital Ladenburg Thalmann & Co. Inc. Trust Company, LLC New York, NY Rick P. Frier John Bolduc Bryce Rowe Independent Director Chairman of the Board, Executive Managing National Securities Investor Relations Contact Director of H.I.G. Capital 1450 Brickell Avenue Rick D. Puckett Chris Kotowski 31st Floor Independent Director Jay Carvell Oppenheimer & Co. Attention: Investor Relations Managing Director of WhiteHorse Capital Miami, FL 33131 G. Stacy Smith Robert Dodd (305) 381 - 6999 Independent Director Javier Casillas Raymond James Managing Director of WhiteHorse Capital Independent Registered Public Accounting Firm Pankaj Gupta Crowe LLP Managing Director of WhiteHorse Capital New York, NY David Indelicato Equity Securities Listing Managing Director of WhiteHorse Capital NASDAQ: WHF Brian Schwartz Please visit our website at: Co - President of H.I.G. Capital www.whitehorsefinance.com John Yeager Managing Director of WhiteHorse Capital