Attached files
| file | filename |
|---|---|
| EX-99.1 - EX-99.1 - Ready Capital Corp | tmb-20200511xex99d1.htm |
| 8-K - 8-K - Ready Capital Corp | tmb-20200511x8k.htm |
Exhibit 99.2
| Supplemental Financial Data First Quarter 2020 |

| DISCLAIMER 2 This presentation contains statements that constitute "forward-looking statements," as such term is defined in Section 27A of the Securities Act of 1933, as amended, and Section 21E of the Securities Exchange Act of 1934, as amended, and such statements are intended to be covered by the safe harbor provided by the same. These statements are based on management's current expectations and beliefs and are subject to a number of trends and uncertainties that could cause actual results to differ materially from those described in the forward-looking statements; Ready Capital Corporation (the "Company") can give no assurance that its expectations will be attained. Factors that could cause actual results to differ materially from the Company's expectations include those set forth in the Risk Factors section of the most recent Annual Report on Form 10-K filed with the SEC and other reports filed by the Company with the SEC, copies of which are available on the SEC's website, www.sec.gov. The Company undertakes no obligation to update these statements for revisions or changes after the date of this release, except as required by law. This presentation includes certain non-GAAP financial measures, including Core Earnings. These non-GAAP financial measures should be considered only as supplemental to, and not as superior to, financial measures in accordance with GAAP. Please refer to Appendix A for the most recent GAAP information. This presentation also contains market statistics and industry data which are subject to uncertainty and are not necessarily reflective of market conditions. These have been derived from third party sources and have not been independently verified by the Company or its affiliates. All material presented is compiled from sources believed to be reliable and current, but accuracy cannot be guaranteed. All data is as of March 31, 2020 unless otherwise noted. |
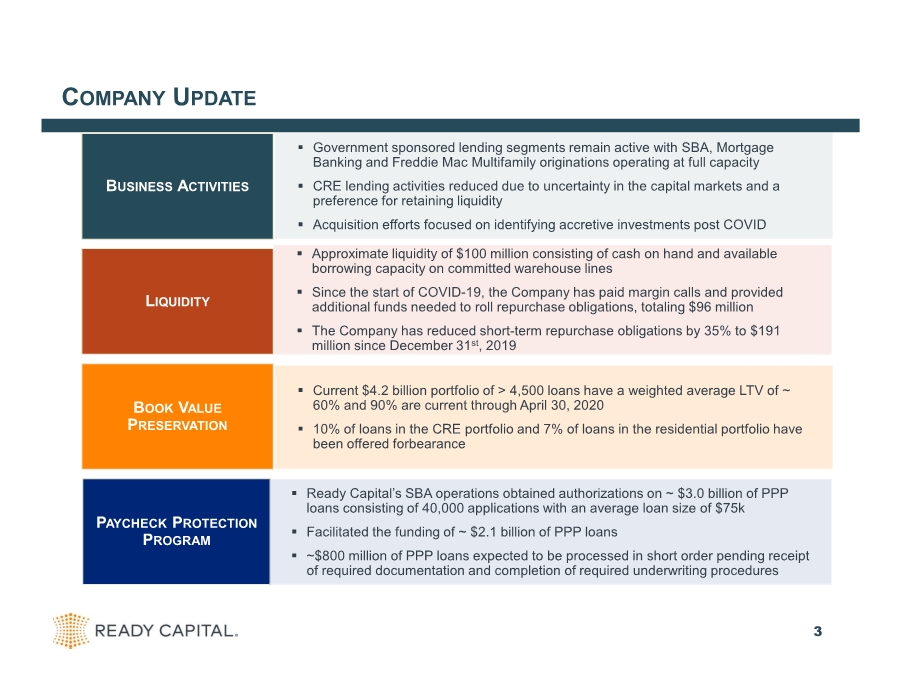
| 3 COMPANY UPDATE . Government sponsored lending segments remain active with SBA, Mortgage Banking and Freddie Mac Multifamily originations operating at full capacity . CRE lending activities reduced due to uncertainty in the capital markets and a preference for retaining liquidity . Acquisition efforts focused on identifying accretive investments post COVID BUSINESS ACTIVITIES . Approximate liquidity of $100 million consisting of cash on hand and available borrowing capacity on committed warehouse lines . Since the start of COVID-19, the Company has paid margin calls and provided additional funds needed to roll repurchase obligations, totaling $96 million . The Company has reduced short-term repurchase obligations by 35% to $191 million since December 31st, 2019 LIQUIDITY . Current $4.2 billion portfolio of > 4,500 loans have a weighted average LTV of ~ 60% and 90% are current through April 30, 2020 . 10% of loans in the CRE portfolio and 7% of loans in the residential portfolio have been offered forbearance BOOK VALUE PRESERVATION PAYCHECK PROTECTION PROGRAM . Ready Capital’s SBA operations obtained authorizations on ~ $3.0 billion of PPP loans consisting of 40,000 applications with an average loan size of $75k . Facilitated the funding of ~ $2.1 billion of PPP loans . ~$800 million of PPP loans expected to be processed in short order pending receipt of required documentation and completion of required underwriting procedures |
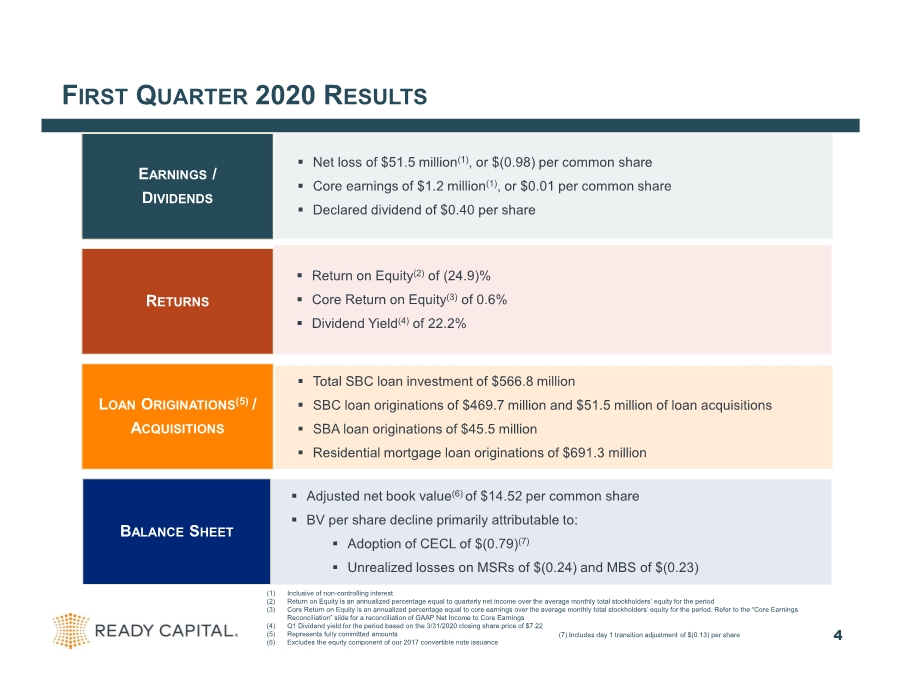
| FIRST QUARTER 2020 RESULTS 4 . Net loss of $51.5 million(1), or $(0.98) per common share . Core earnings of $1.2 million(1), or $0.01 per common share . Declared dividend of $0.40 per share EARNINGS / DIVIDENDS . Return on Equity(2) of (24.9)% . Core Return on Equity(3) of 0.6% . Dividend Yield(4) of 22.2% RETURNS . Total SBC loan investment of $566.8 million . SBC loan originations of $469.7 million and $51.5 million of loan acquisitions . SBA loan originations of $45.5 million . Residential mortgage loan originations of $691.3 million LOAN ORIGINATIONS(5) / ACQUISITIONS . Adjusted net book value(6) of $14.52 per common share . BV per share decline primarily attributable to: . Adoption of CECL of $(0.79)(7) . Unrealized losses on MSRs of $(0.24) and MBS of $(0.23) BALANCE SHEET (1) Inclusive of non-controlling interest (2) Return on Equity is an annualized percentage equal to quarterly net income over the average monthly total stockholders’ equity for the period (3) Core Return on Equity is an annualized percentage equal to core earnings over the average monthly total stockholders’ equity for the period. Refer to the “Core Earnings Reconciliation” slide for a reconciliation of GAAP Net Income to Core Earnings (4) Q1 Dividend yield for the period based on the 3/31/2020 closing share price of $7.22 (5) Represents fully committed amounts (6) Excludes the equity component of our 2017 convertible note issuance (7) Includes day 1 transition adjustment of $(0.13) per share |
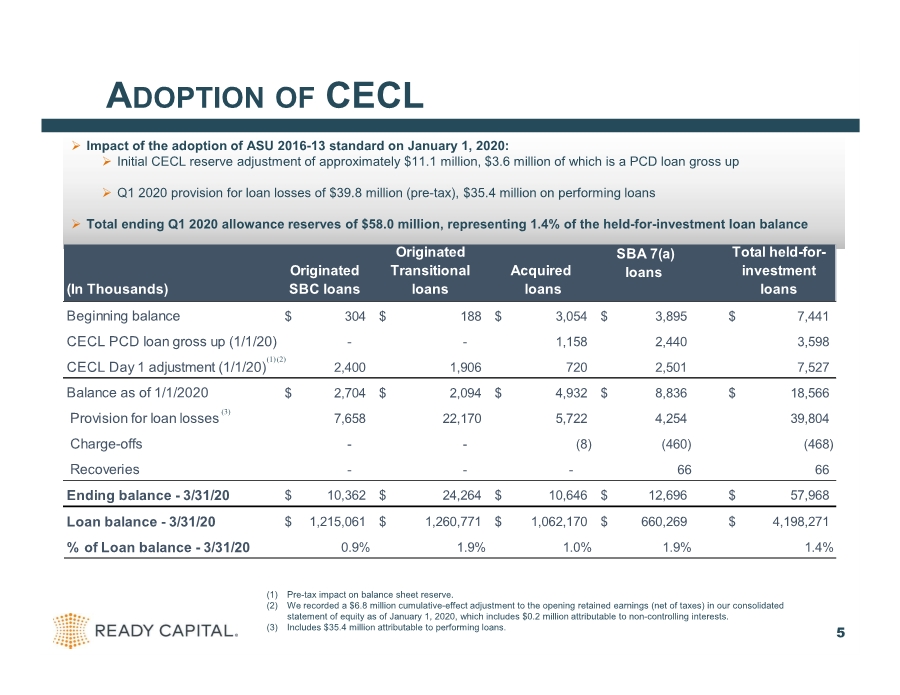
| ADOPTION OF CECL Impact of the adoption of ASU 2016-13 standard on January 1, 2020: Initial CECL reserve adjustment of approximately $11.1 million, $3.6 million of which is a PCD loan gross up Q1 2020 provision for loan losses of $39.8 million (pre-tax), $35.4 million on performing loans Total ending Q1 2020 allowance reserves of $58.0 million, representing 1.4% of the held-for-investment loan balance 5 (In Thousands) Originated SBC loans Originated Transitional loans Acquired loans SBA 7(a) loans Total held-for- investment loans Beginning balance 304 $ 188 $ 3,054 $ 3,895 $ 7,441 $ CECL PCD loan gross up (1/1/20) - - 1,158 2,440 3,598 CECL Day 1 adjustment (1/1/20) 2,400 1,906 720 2,501 7,527 Balance as of 1/1/2020 2,704 $ 2,094 $ 4,932 $ 8,836 $ 18,566 $ Provision for loan losses 7,658 22,170 5,722 4,254 39,804 Charge-offs - - (8) (460) (468) Recoveries - - - 66 66 Ending balance - 3/31/20 10,362 $ 24,264 $ 10,646 $ 12,696 $ 57,968 $ Loan balance - 3/31/20 1,215,061 $ 1,260,771 $ 1,062,170 $ 660,269 $ 4,198,271 $ % of Loan balance - 3/31/20 0.9% 1.9% 1.0% 1.9% 1.4% (1) Pre-tax impact on balance sheet reserve. (2) We recorded a $6.8 million cumulative-effect adjustment to the opening retained earnings (net of taxes) in our consolidated statement of equity as of January 1, 2020, which includes $0.2 million attributable to non-controlling interests. (3) Includes $35.4 million attributable to performing loans. (1) (3) (2) |
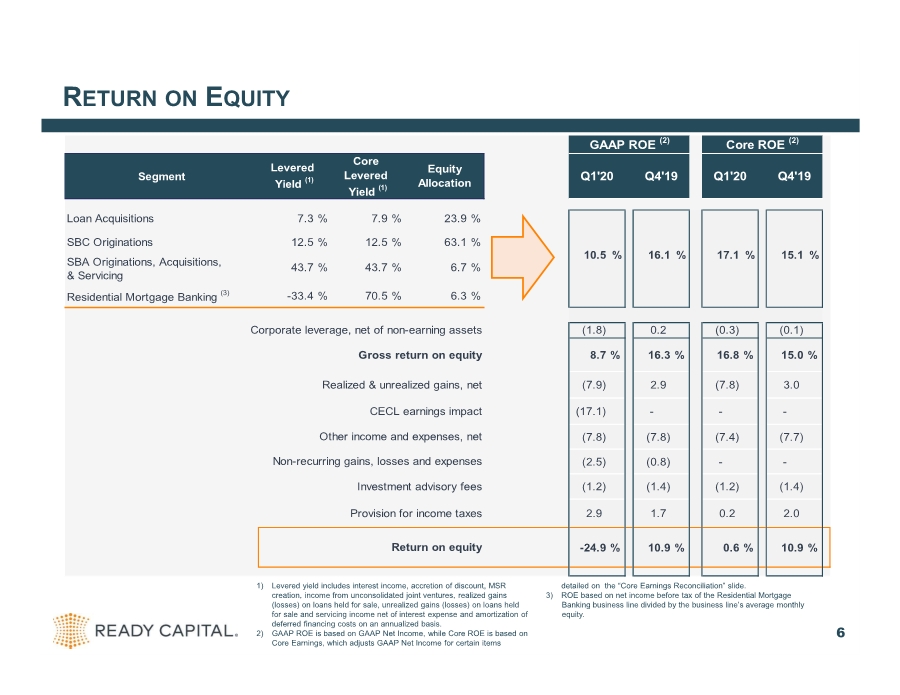
| RETURN ON EQUITY 6 1) Levered yield includes interest income, accretion of discount, MSR creation, income from unconsolidated joint ventures, realized gains (losses) on loans held for sale, unrealized gains (losses) on loans held for sale and servicing income net of interest expense and amortization of deferred financing costs on an annualized basis. 2) GAAP ROE is based on GAAP Net Income, while Core ROE is based on Core Earnings, which adjusts GAAP Net Income for certain items detailed on the “Core Earnings Reconciliation” slide. 3) ROE based on net income before tax of the Residential Mortgage Banking business line divided by the business line’s average monthly equity. Segment Loan Acquisitions 7.3 % 7.9 % 23.9 % SBC Originations 12.5 % 12.5 % 63.1 % SBA Originations, Acquisitions, & Servicing 43.7 % 43.7 % 6.7 % Residential Mortgage Banking (3) -33.4% 70.5% 6.3% (1.8) 0.2 (0.3) (0.1) 8.7% 16.3% 16.8% 15.0% (7.9) 2.9 (7.8) 3.0 (17.1) - - - (7.8) (7.8) (7.4) (7.7) (2.5) (0.8) - - (1.2) (1.4) (1.2) (1.4) 2.9 1.7 0.2 2.0 -24.9% 10.9% 0.6% 10.9% Return on equity CECL earnings impact Gross return on equity Realized & unrealized gains, net Other income and expenses, net Non-recurring gains, losses and expenses Investment advisory fees Provision for income taxes 10.5 % 16.1 % 17.1 % 15.1 % Corporate leverage, net of non-earning assets GAAP ROE (2) Core ROE (2) Levered Yield (1) Core Levered Yield (1) Equity Allocation Q1'20 Q4'19 Q1'20 Q4'19 |
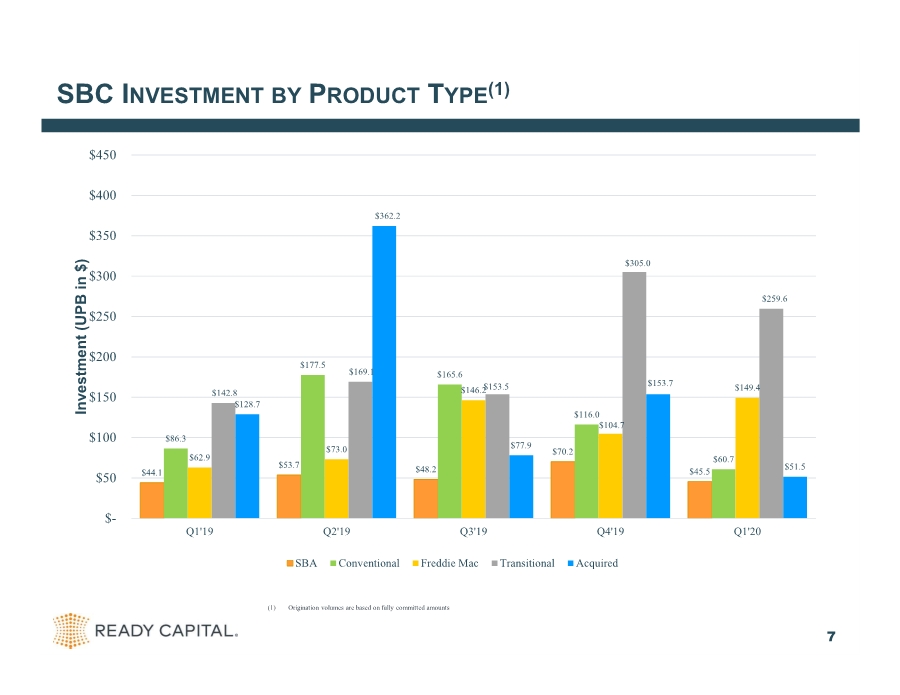
| SBC INVESTMENT BY PRODUCT TYPE(1) 7 (1) Origination volumes are based on fully committed amounts $44.1 $53.7 $48.2 $70.2 $45.5 $86.3 $177.5 $165.6 $116.0 $60.7 $62.9 $73.0 $146.2 $104.7 $149.4 $142.8 $169.1 $153.5 $305.0 $259.6 $128.7 $362.2 $77.9 $153.7 $51.5 $- $50 $100 $150 $200 $250 $300 $350 $400 $450 Q1'19 Q2'19 Q3'19 Q4'19 Q1'20 Investment (UPB in $) SBA Conventional Freddie Mac Transitional Acquired |
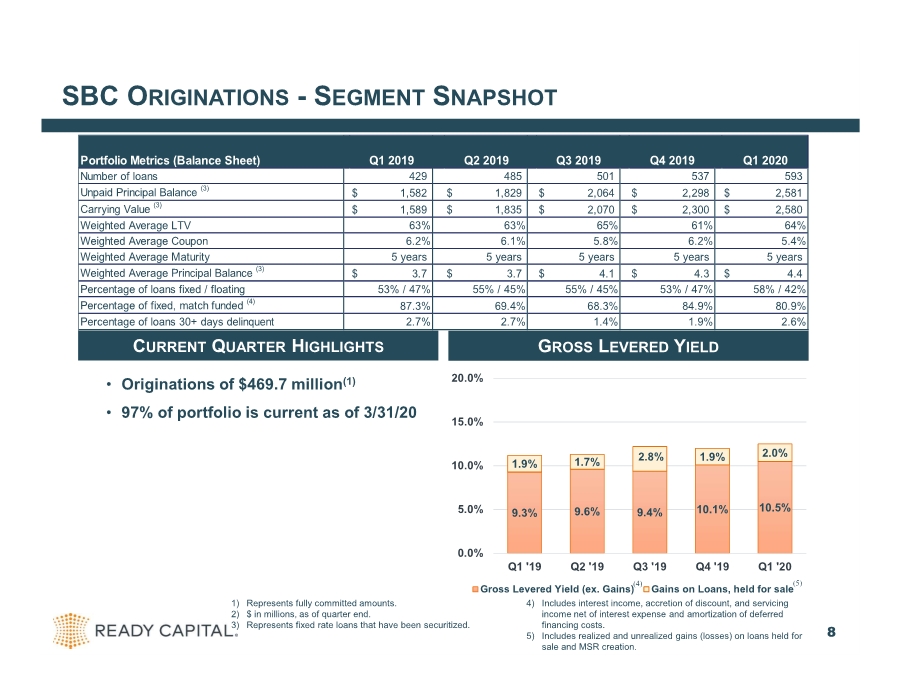
| SBC ORIGINATIONS -SEGMENT SNAPSHOT 8 1) Represents fully committed amounts. 2) $ in millions, as of quarter end. 3) Represents fixed rate loans that have been securitized. 4) Includes interest income, accretion of discount, and servicing income net of interest expense and amortization of deferred financing costs. 5) Includes realized and unrealized gains (losses) on loans held for sale and MSR creation. • Originations of $469.7 million(1) • 97% of portfolio is current as of 3/31/20 9.3% 9.6% 9.4% 10.1% 10.5% 1.9% 1.7% 2.8% 1.9% 2.0% 0.0% 5.0% 10.0% 15.0% 20.0% Q1 '19 Q2 '19 Q3 '19 Q4 '19 Q1 '20 Gross Levered Yield (ex. Gains) Gains on Loans, held for sale GROSS LEVERED YIELD CURRENT QUARTER HIGHLIGHTS (4) (5) Portfolio Metrics (Balance Sheet) Number of loans 429 485 501 537 593 Unpaid Principal Balance (3) $ 1,582 $ 1,829 $ 2,064 $ 2,298 $ 2,581 Carrying Value (3) $ 1,589 $ 1,835 $ 2,070 $ 2,300 $ 2,580 Weighted Average LTV 63% 63% 65% 61% 64% Weighted Average Coupon 6.2% 6.1% 5.8% 6.2% 5.4% Weighted Average Maturity 5 years 5 years 5 years 5 years 5 years Weighted Average Principal Balance (3) $ 3.7 $ 3.7 $ 4.1 $ 4.3 $ 4.4 Percentage of loans fixed / floating 53% / 47% 55% / 45% 55% / 45% 53% / 47% 58% / 42% Percentage of fixed, match funded (4) 87.3% 69.4% 68.3% 84.9% 80.9% Percentage of loans 30+ days delinquent 2.7% 2.7% 1.4% 1.9% 2.6% Q1 2019 Q2 2019 Q3 2019 Q4 2019 Q1 2020 |
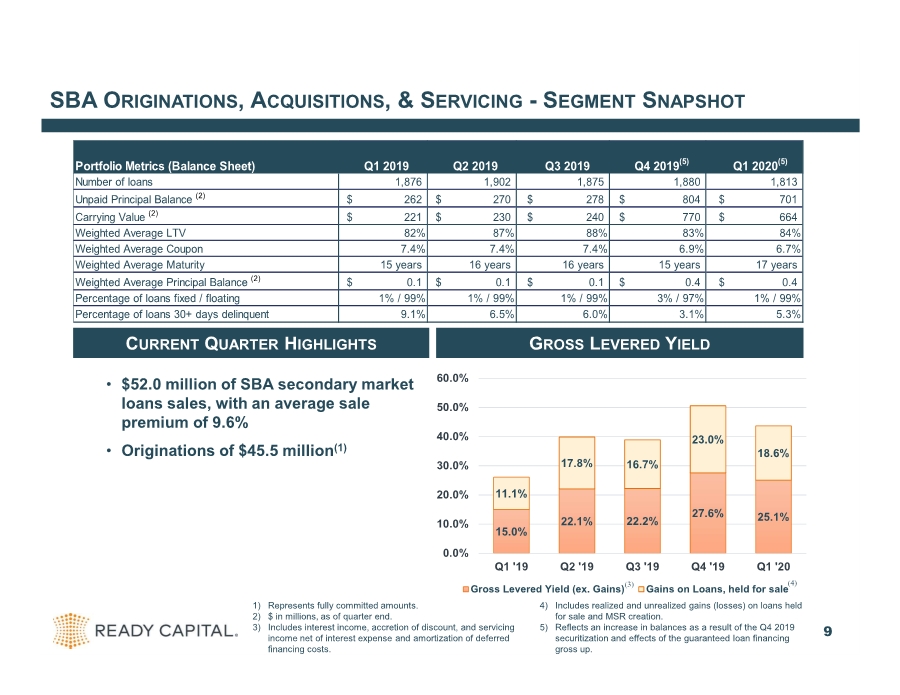
| SBA ORIGINATIONS, ACQUISITIONS, & SERVICING -SEGMENT SNAPSHOT 9 1) Represents fully committed amounts. 2) $ in millions, as of quarter end. 3) Includes interest income, accretion of discount, and servicing income net of interest expense and amortization of deferred financing costs. 4) Includes realized and unrealized gains (losses) on loans held for sale and MSR creation. 5) Reflects an increase in balances as a result of the Q4 2019 securitization and effects of the guaranteed loan financing gross up. • $52.0 million of SBA secondary market loans sales, with an average sale premium of 9.6% • Originations of $45.5 million(1) 15.0% 22.1% 22.2% 27.6% 25.1% 11.1% 17.8% 16.7% 23.0% 18.6% 0.0% 10.0% 20.0% 30.0% 40.0% 50.0% 60.0% Q1 '19 Q2 '19 Q3 '19 Q4 '19 Q1 '20 Gross Levered Yield (ex. Gains) Gains on Loans, held for sale CURRENT QUARTER HIGHLIGHTS GROSS LEVERED YIELD (3) (4) Portfolio Metrics (Balance Sheet) Number of loans 1,876 1,902 1,875 1,880 1,813 Unpaid Principal Balance (2) $ 262 $ 270 $ 278 $ 804 $ 701 Carrying Value (2) $ 221 $ 230 $ 240 $ 770 $ 664 Weighted Average LTV 82% 87% 88% 83% 84% Weighted Average Coupon 7.4% 7.4% 7.4% 6.9% 6.7% Weighted Average Maturity 15 years 16 years 16 years 15 years 17 years Weighted Average Principal Balance (2) $ 0.1 $ 0.1 $ 0.1 $ 0.4 $ 0.4 Percentage of loans fixed / floating 1% / 99% 1% / 99% 1% / 99% 3% / 97% 1% / 99% Percentage of loans 30+ days delinquent 9.1% 6.5% 6.0% 3.1% 5.3% Q1 2019 Q2 2019 Q3 2019 Q4 2019(5) Q1 2020(5) |
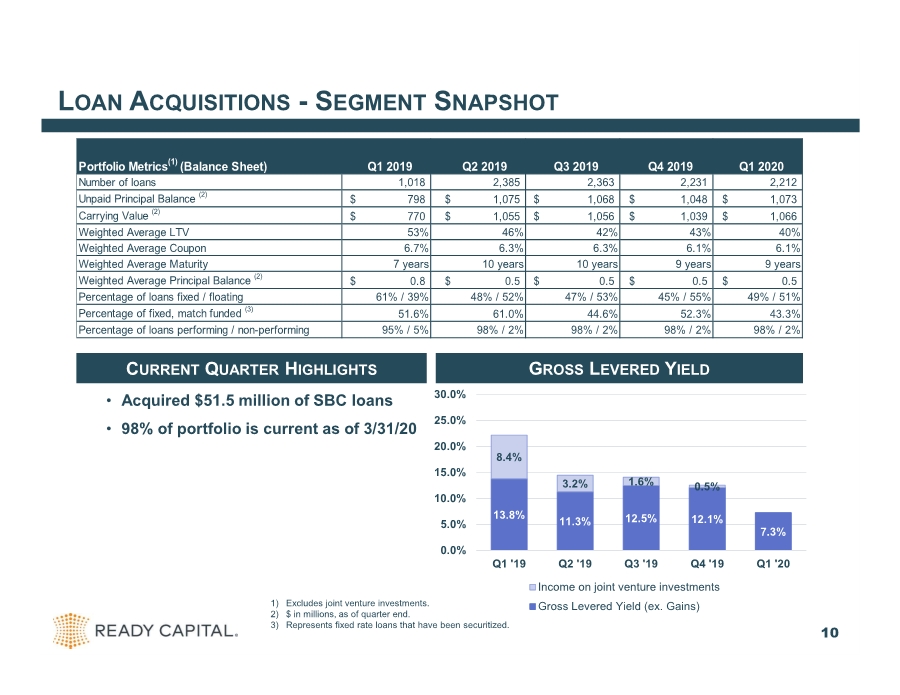
| LOAN ACQUISITIONS -SEGMENT SNAPSHOT 10 1) Excludes joint venture investments. 2) $ in millions, as of quarter end. 3) Represents fixed rate loans that have been securitized. • Acquired $51.5 million of SBC loans • 98% of portfolio is current as of 3/31/20 13.8% 11.3% 12.5% 12.1% 7.3% 8.4% 3.2% 1.6% 0.5% 0.0% 5.0% 10.0% 15.0% 20.0% 25.0% 30.0% Q1 '19 Q2 '19 Q3 '19 Q4 '19 Q1 '20 Income on joint venture investments Gross Levered Yield (ex. Gains) CURRENT QUARTER HIGHLIGHTS GROSS LEVERED YIELD Portfolio Metrics(1) (Balance Sheet) Number of loans 1,018 2,385 2,363 2,231 2,212 Unpaid Principal Balance (2) $ 798 $ 1,075 $ 1,068 $ 1,048 $ 1,073 Carrying Value (2) $ 770 $ 1,055 $ 1,056 $ 1,039 $ 1,066 Weighted Average LTV 53% 46% 42% 43% 40% Weighted Average Coupon 6.7% 6.3% 6.3% 6.1% 6.1% Weighted Average Maturity 7 years 10 years 10 years 9 years 9 years Weighted Average Principal Balance (2) $ 0.8 $ 0.5 $ 0.5 $ 0.5 $ 0.5 Percentage of loans fixed / floating 61% / 39% 48% / 52% 47% / 53% 45% / 55% 49% / 51% Percentage of fixed, match funded (3) 51.6% 61.0% 44.6% 52.3% 43.3% Percentage of loans performing / non-performing 95% / 5% 98% / 2% 98% / 2% 98% / 2% 98% / 2% Q1 2019 Q2 2019 Q3 2019 Q4 2019 Q1 2020 |
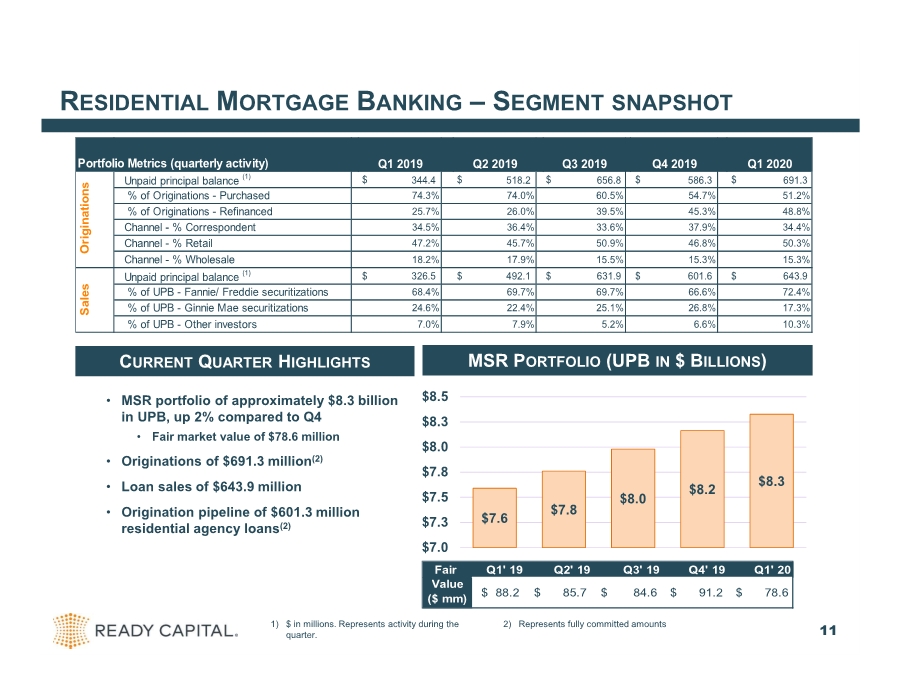
| RESIDENTIAL MORTGAGE BANKING –SEGMENT SNAPSHOT 11 1) $ in millions. Represents activity during the quarter. 2) Represents fully committed amounts • MSR portfolio of approximately $8.3 billion in UPB, up 2% compared to Q4 • Fair market value of $78.6 million • Originations of $691.3 million(2) • Loan sales of $643.9 million • Origination pipeline of $601.3 million residential agency loans(2) $7.6 $7.8 $8.0 $8.2 $8.3 $7.0 $7.3 $7.5 $7.8 $8.0 $8.3 $8.5 MSR PORTFOLIO (UPB IN $ BILLIONS)CURRENT QUARTER HIGHLIGHTS Portfolio Metrics (quarterly activity) Unpaid principal balance (1) $ 344.4 $ 518.2 $ 656.8 $ 586.3 $ 691.3 % of Originations - Purchased 74.3% 74.0% 60.5% 54.7% 51.2% % of Originations - Refinanced 25.7% 26.0% 39.5% 45.3% 48.8% Channel - % Correspondent 34.5% 36.4% 33.6% 37.9% 34.4% Channel - % Retail 47.2% 45.7% 50.9% 46.8% 50.3% Channel - % Wholesale 18.2% 17.9% 15.5% 15.3% 15.3% Unpaid principal balance (1) $ 326.5 $ 492.1 $ 631.9 $ 601.6 $ 643.9 % of UPB - Fannie/ Freddie securitizations 68.4% 69.7% 69.7% 66.6% 72.4% % of UPB - Ginnie Mae securitizations 24.6% 22.4% 25.1% 26.8% 17.3% % of UPB - Other investors 7.0% 7.9% 5.2% 6.6% 10.3% Q4 2019 Q1 2020 Originations Sales Q1 2019 Q2 2019 Q3 2019 Fair Q1' 19 Q2' 19 Q3' 19 Q4' 19 Q1' 20 Value ($ mm) $ 88.2 $ 85.7 $ 84.6 $ 91.2 $ 78.6 |
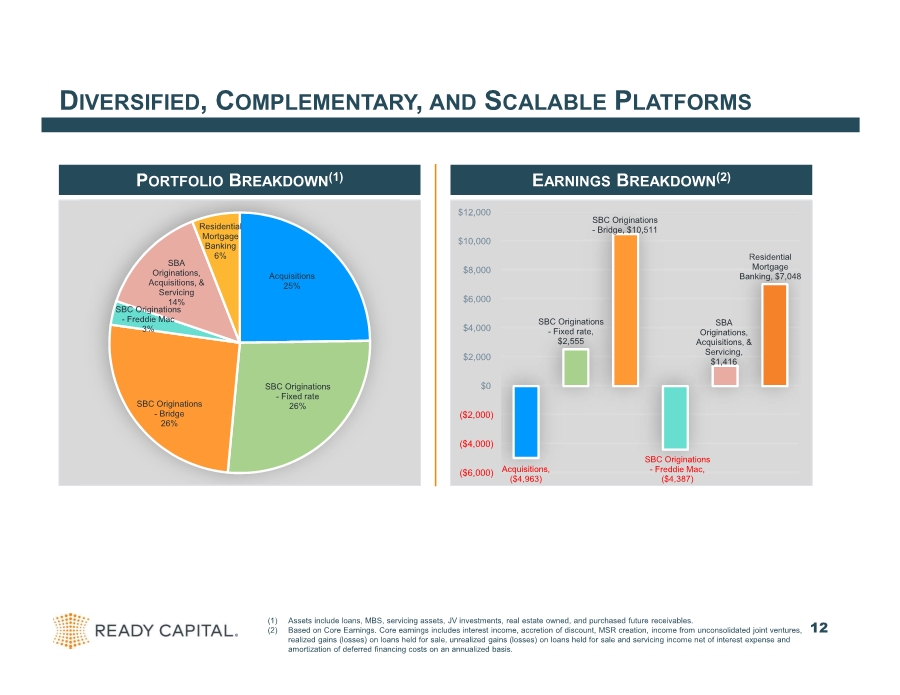
| DIVERSIFIED, COMPLEMENTARY, AND SCALABLE PLATFORMS (1) Assets include loans, MBS, servicing assets, JV investments, real estate owned, and purchased future receivables. (2) Based on Core Earnings. Core earnings includes interest income, accretion of discount, MSR creation, income from unconsolidated joint ventures, realized gains (losses) on loans held for sale, unrealized gains (losses) on loans held for sale and servicing income net of interest expense and amortization of deferred financing costs on an annualized basis. (3) 12 PORTFOLIO BREAKDOWN(1) EARNINGS BREAKDOWN(2) Acquisitions 25% SBC Originations - Fixed rate 26% SBC Originations - Bridge 26% SBC Originations - Freddie Mac 3% SBA Originations, Acquisitions, & Servicing 14% Residential Mortgage Banking 6% Acquisitions, ($4,963) SBC Originations - Fixed rate, $2,555 SBC Originations - Bridge, $10,511 SBC Originations - Freddie Mac, ($4,387) SBA Originations, Acquisitions, & Servicing, $1,416 Residential Mortgage Banking, $7,048 ($6,000) ($4,000) ($2,000) $0 $2,000 $4,000 $6,000 $8,000 $10,000 $12,000 |
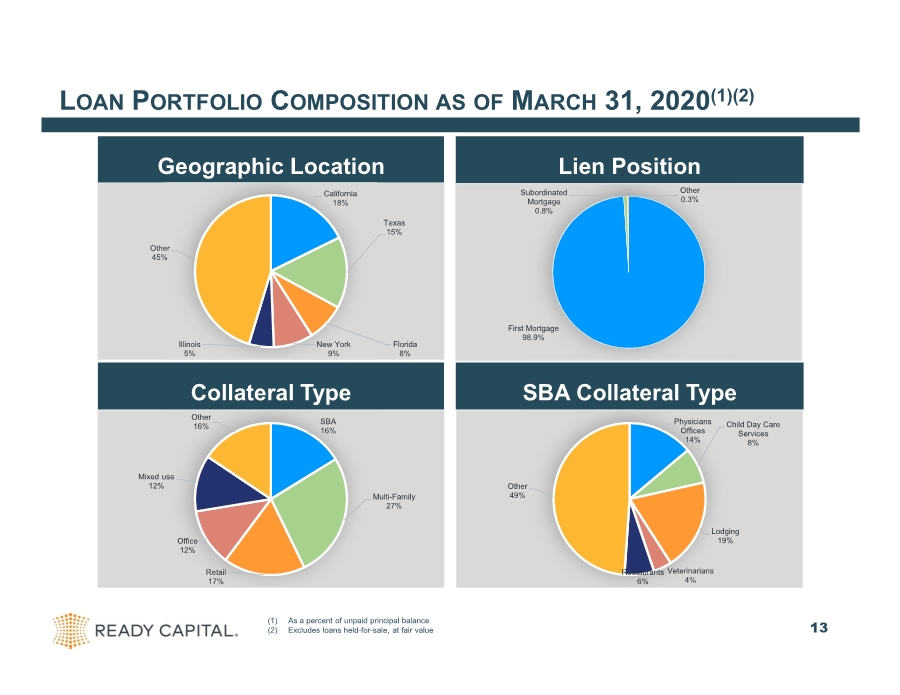
| LOAN PORTFOLIO COMPOSITION AS OF MARCH 31, 2020(1)(2) Geographic Location Lien Position (1) As a percent of unpaid principal balance (2) Excludes loans held-for-sale, at fair value (3) Collateral Type SBA Collateral Type 13 California 18% Texas 15% Florida 8% New York 9% Illinois 5% Other 45% First Mortgage 98.9% Subordinated Mortgage 0.8% Other 0.3% SBA 16% Multi-Family 27% Retail 17% Office 12% Mixed use 12% Other 16% Physicians Offices 14% Child Day Care Services 8% Lodging 19% Veterinarians 4% Restaurants 6% Other 49% |
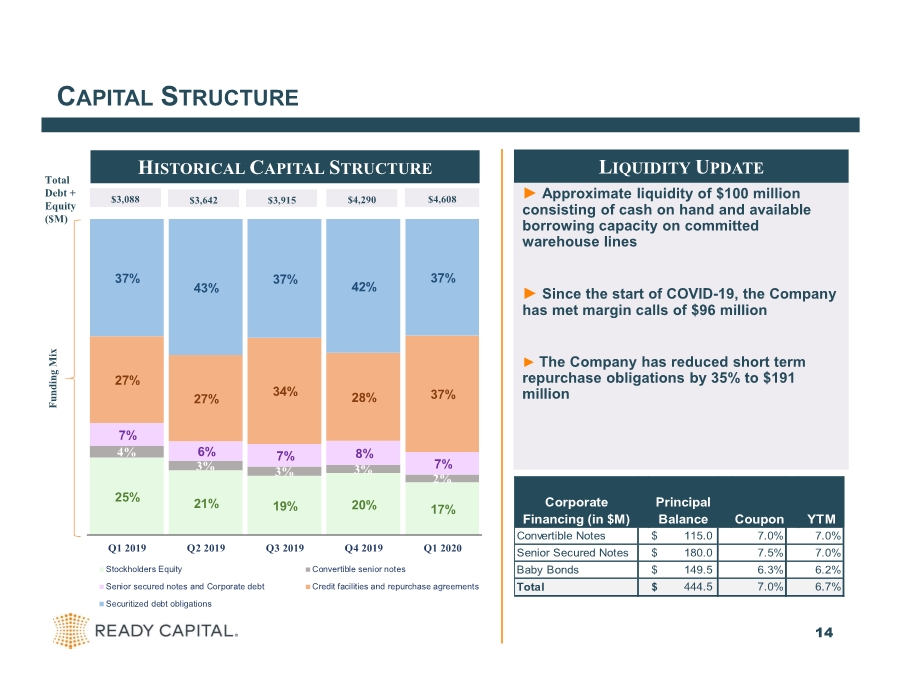
| CAPITAL STRUCTURE ► Approximate liquidity of $100 million consisting of cash on hand and available borrowing capacity on committed warehouse lines ► Since the start of COVID-19, the Company has met margin calls of $96 million ► The Company has reduced short term repurchase obligations by 35% to $191 million 14 Total Debt + Equity LIQUIDITY UPDATE HISTORICAL CAPITAL STRUCTURE Total Debt + Equity ($M) Funding Mix $3,088 $3,642 $3,915 $4,290 $4,608 Convertible Notes $ 115.0 7.0% 7.0% Senior Secured Notes $ 180.0 7.5% 7.0% Baby Bonds $ 149.5 6.3% 6.2% Total $ 444.5 7.0% 6.7% Principal Balance Coupon YTM Corporate Financing (in $M) 25% 21% 19% 20% 17% 4% 3% 3% 3% 2% 7% 6% 7% 8% 7% 27% 27% 34% 28% 37% 37% 43% 37% 42% 37% Q1 2019 Q2 2019 Q3 2019 Q4 2019 Q1 2020 Stockholders Equity Convertible senior notes Senior secured notes and Corporate debt Credit facilities and repurchase agreements Securitized debt obligations |
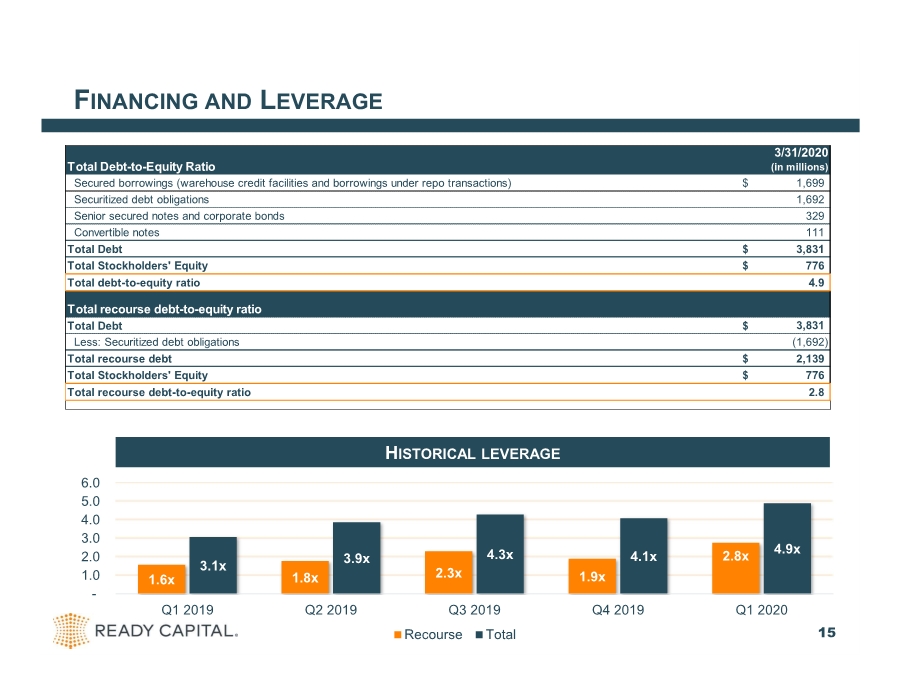
| FINANCING AND LEVERAGE 15 1.6x 1.8x 2.3x 1.9x 2.8x 3.1x 3.9x 4.3x 4.1x 4.9x - 1.0 2.0 3.0 4.0 5.0 6.0 Q1 2019 Q2 2019 Q3 2019 Q4 2019 Q1 2020 Historical Leverage Recourse Total HISTORICAL LEVERAGE Total Debt-to-Equity Ratio Secured borrowings (warehouse credit facilities and borrowings under repo transactions) $ 1,699 Securitized debt obligations 1,692 Senior secured notes and corporate bonds 329 Convertible notes 111 Total Debt $ 3,831 Total Stockholders' Equity $ 776 Total debt-to-equity ratio 4.9 Total recourse debt-to-equity ratio Total Debt $ 3,831 Less: Securitized debt obligations (1,692) Total recourse debt $ 2,139 Total Stockholders' Equity $ 776 Total recourse debt-to-equity ratio 2.8 3/31/2020 (in millions) |
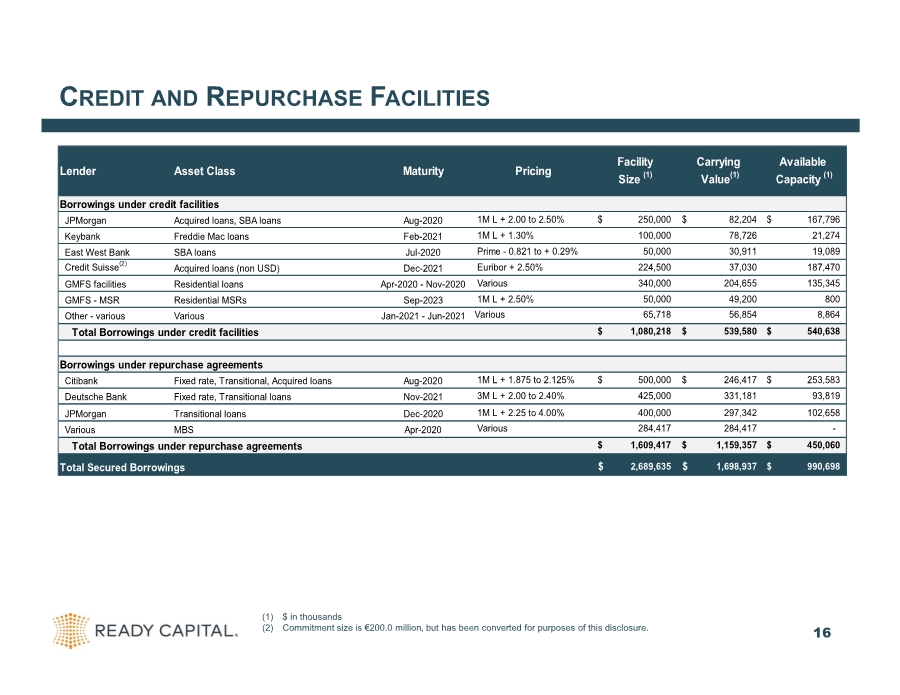
| CREDIT AND REPURCHASE FACILITIES 16 (1) $ in thousands (2) Commitment size is €200.0 million, but has been converted for purposes of this disclosure. Lender Asset Class Maturity Pricing JPMorgan Acquired loans, SBA loans Aug-2020 1M L + 2.00 to 2.50% $ 250,000 $ 82,204 $ 167,796 Keybank Freddie Mac loans Feb-2021 1M L + 1.30% 100,000 78,726 21,274 East West Bank SBA loans Jul-2020 Prime - 0.821 to + 0.29% 50,000 30,911 19,089 Credit Suisse(2) Acquired loans (non USD) Dec-2021 Euribor + 2.50% 224,500 37,030 187,470 GMFS facilities Residential loans Apr-2020 - Nov-2020 Various 340,000 204,655 135,345 GMFS - MSR Residential MSRs Sep-2023 1M L + 2.50% 50,000 49,200 800 Other - various Various Jan-2021 - Jun-2021 Various 65,718 56,854 8,864 $ 1,080,218 $ 539,580 $ 540,638 Citibank Fixed rate, Transitional, Acquired loans Aug-2020 1M L + 1.875 to 2.125% $ 500,000 $ 246,417 $ 253,583 Deutsche Bank Fixed rate, Transitional loans Nov-2021 3M L + 2.00 to 2.40% 425,000 331,181 93,819 JPMorgan Transitional loans Dec-2020 1M L + 2.25 to 4.00% 400,000 297,342 102,658 Various MBS Apr-2020 Various 284,417 284,417 - $ 1,609,417 $ 1,159,357 $ 450,060 Total Secured Borrowings $ 2,689,635 $ 1,698,937 $ 990,698 Borrowings under repurchase agreements Total Borrowings under repurchase agreements Total Borrowings under credit facilities Borrowings under credit facilities Available Capacity (1) Facility Size (1) Carrying Value(1) |
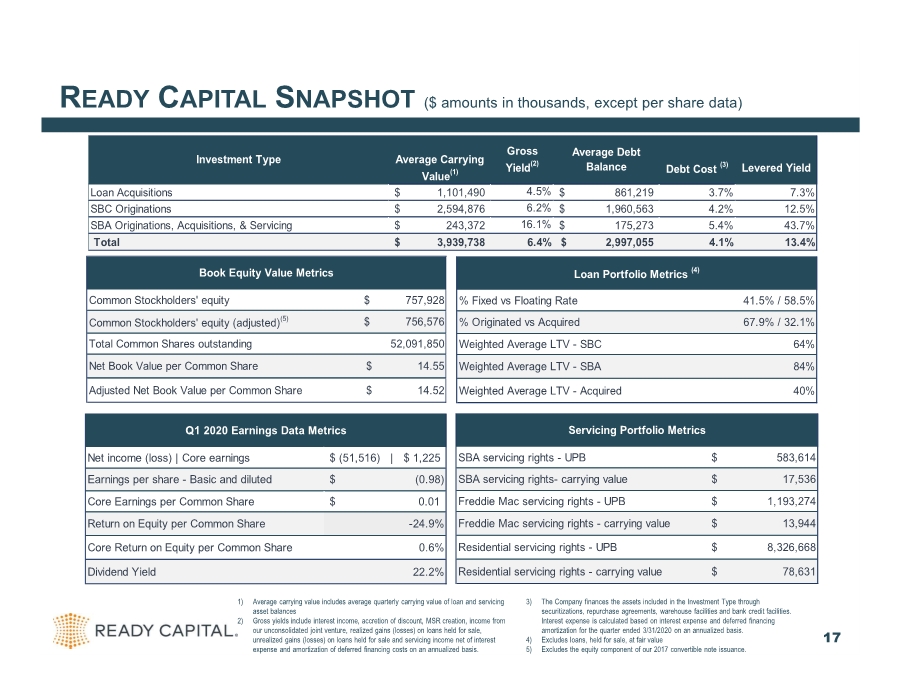
| READY CAPITAL SNAPSHOT ($ amounts in thousands, except per share data) 17 (5) Excludes the equity component of our 2017 convertible note issuance 1) Average carrying value includes average quarterly carrying value of loan and servicing asset balances 2) Gross yields include interest income, accretion of discount, MSR creation, income from our unconsolidated joint venture, realized gains (losses) on loans held for sale, unrealized gains (losses) on loans held for sale and servicing income net of interest expense and amortization of deferred financing costs on an annualized basis. 3) The Company finances the assets included in the Investment Type through securitizations, repurchase agreements, warehouse facilities and bank credit facilities. Interest expense is calculated based on interest expense and deferred financing amortization for the quarter ended 3/31/2020 on an annualized basis. 4) Excludes loans, held for sale, at fair value 5) Excludes the equity component of our 2017 convertible note issuance. Common Stockholders' equity $ 757,928 Common Stockholders' equity (adjusted)(5) $ 756,576 Total Common Shares outstanding 52,091,850 Net Book Value per Common Share $ 14.55 Adjusted Net Book Value per Common Share $ 14.52 Book Equity Value Metrics SBA servicing rights - UPB $ 583,614 SBA servicing rights- carrying value $ 17,536 Freddie Mac servicing rights - UPB $ 1,193,274 Freddie Mac servicing rights - carrying value $ 13,944 Residential servicing rights - UPB $ 8,326,668 Residential servicing rights - carrying value $ 78,631 Servicing Portfolio Metrics % Fixed vs Floating Rate 41.5% / 58.5% % Originated vs Acquired 67.9% / 32.1% Weighted Average LTV - SBC 64% Weighted Average LTV - SBA 84% Weighted Average LTV - Acquired 40% Loan Portfolio Metrics (4) Average Carrying Value(1) Debt Cost (3) Levered Yield Loan Acquisitions 1,101,490 $ 4.5% 861,219 $ 3.7% 7.3% SBC Originations 2,594,876 $ 6.2% 1,960,563 $ 4.2% 12.5% SBA Originations, Acquisitions, & Servicing 243,372 $ 16.1% 175,273 $ 5.4% 43.7% Total 3,939,738 $ 6.4% 2,997,055 $ 4.1% 13.4% Investment Type Gross Yield(2) Average Debt Balance Net income (loss) | Core earnings $ (51,516) | $ 1,225 Earnings per share - Basic and diluted $ (0.98) Core Earnings per Common Share $ 0.01 Return on Equity per Common Share -24.9% Core Return on Equity per Common Share 0.6% Dividend Yield 22.2% Q1 2020 Earnings Data Metrics |
| APPENDIX 18 |

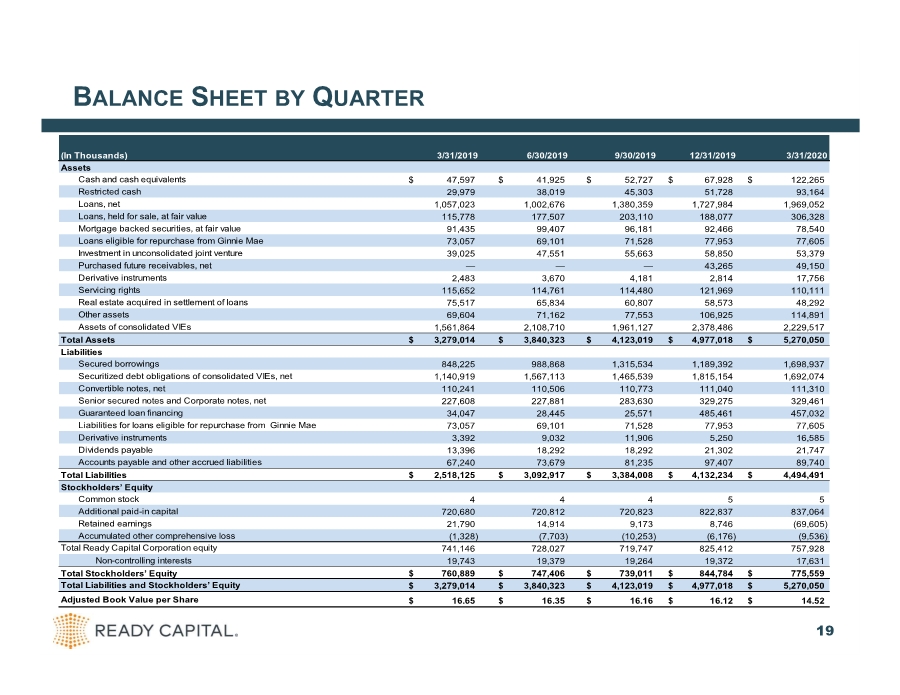
| BALANCE SHEET BY QUARTER 19 (In Thousands) Assets Cash and cash equivalents $ 47,597 $ 41,925 $ 52,727 $ 67,928 $ 122,265 Restricted cash 29,979 38,019 45,303 51,728 93,164 Loans, net 1,057,023 1,002,676 1,380,359 1,727,984 1,969,052 Loans, held for sale, at fair value 115,778 177,507 203,110 188,077 306,328 Mortgage backed securities, at fair value 91,435 99,407 96,181 92,466 78,540 Loans eligible for repurchase from Ginnie Mae 73,057 69,101 71,528 77,953 77,605 Investment in unconsolidated joint venture 39,025 47,551 55,663 58,850 53,379 Purchased future receivables, net — — — 43,265 49,150 Derivative instruments 2,483 3,670 4,181 2,814 17,756 Servicing rights 115,652 114,761 114,480 121,969 110,111 Real estate acquired in settlement of loans 75,517 65,834 60,807 58,573 48,292 Other assets 69,604 71,162 77,553 106,925 114,891 Assets of consolidated VIEs 1,561,864 2,108,710 1,961,127 2,378,486 2,229,517 Total Assets $ 3,279,014 $ 3,840,323 $ 4,123,019 $ 4,977,018 $ 5,270,050 Liabilities Secured borrowings 848,225 988,868 1,315,534 1,189,392 1,698,937 Securitized debt obligations of consolidated VIEs, net 1,140,919 1,567,113 1,465,539 1,815,154 1,692,074 Convertible notes, net 110,241 110,506 110,773 111,040 111,310 Senior secured notes and Corporate notes, net 227,608 227,881 283,630 329,275 329,461 Guaranteed loan financing 34,047 28,445 25,571 485,461 457,032 Liabilities for loans eligible for repurchase from Ginnie Mae 73,057 69,101 71,528 77,953 77,605 Derivative instruments 3,392 9,032 11,906 5,250 16,585 Dividends payable 13,396 18,292 18,292 21,302 21,747 Accounts payable and other accrued liabilities 67,240 73,679 81,235 97,407 89,740 Total Liabilities $ 2,518,125 $ 3,092,917 $ 3,384,008 $ 4,132,234 $ 4,494,491 Stockholders’ Equity Common stock 4 4 4 5 5 Additional paid-in capital 720,680 720,812 720,823 822,837 837,064 Retained earnings 21,790 14,914 9,173 8,746 (69,605) Accumulated other comprehensive loss (1,328) (7,703) (10,253) (6,176) (9,536) Total Ready Capital Corporation equity 741,146 728,027 719,747 825,412 757,928 Non-controlling interests 19,743 19,379 19,264 19,372 17,631 Total Stockholders’ Equity $ 760,889 $ 747,406 $ 739,011 $ 844,784 $ 775,559 Total Liabilities and Stockholders’ Equity $ 3,279,014 $ 3,840,323 $ 4,123,019 $ 4,977,018 $ 5,270,050 Adjusted Book Value per Share $ 16.65 $ 16.35 $ 16.16 $ 16.12 $ 14.52 3/31/2020 3/31/2019 6/30/2019 9/30/2019 12/31/2019 |
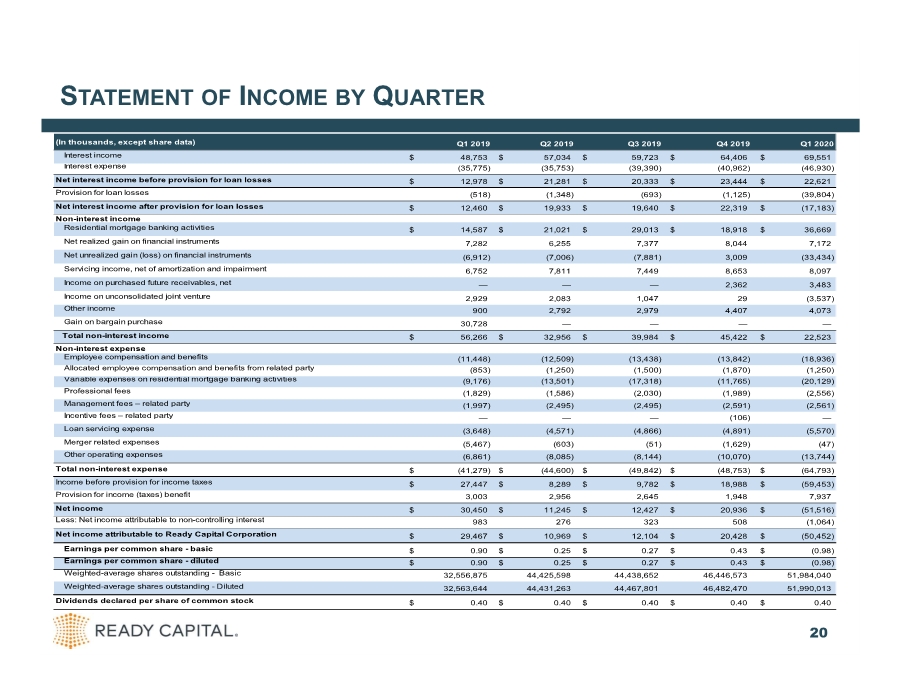
| STATEMENT OF INCOME BY QUARTER 20 (1) Certain balances have been reclassified to match current period presentation (In thousands, except share data) Interest income $ 48,753 $ 57,034 $ 59,723 $ 64,406 $ 69,551 Interest expense (35,775) (35,753) (39,390) (40,962) (46,930) Net interest income before provision for loan losses $ 12,978 $ 21,281 $ 20,333 $ 23,444 $ 22,621 Provision for loan losses (518) (1,348) (693) (1,125) (39,804) Net interest income after provision for loan losses $ 12,460 $ 19,933 $ 19,640 $ 22,319 $ (17,183) Non-interest income Residential mortgage banking activities $ 14,587 $ 21,021 $ 29,013 $ 18,918 $ 36,669 Net realized gain on financial instruments 7,282 6,255 7,377 8,044 7,172 Net unrealized gain (loss) on financial instruments (6,912) (7,006) (7,881) 3,009 (33,434) Servicing income, net of amortization and impairment 6,752 7,811 7,449 8,653 8,097 Income on purchased future receivables, net — — — 2,362 3,483 Income on unconsolidated joint venture 2,929 2,083 1,047 29 (3,537) Other income 900 2,792 2,979 4,407 4,073 Gain on bargain purchase 30,728 — — — — Total non-interest income $ 56,266 $ 32,956 $ 39,984 $ 45,422 $ 22,523 Non-interest expense Employee compensation and benefits (11,448) (12,509) (13,438) (13,842) (18,936) Allocated employee compensation and benefits from related party (853) (1,250) (1,500) (1,870) (1,250) Variable expenses on residential mortgage banking activities (9,176) (13,501) (17,318) (11,765) (20,129) Professional fees (1,829) (1,586) (2,030) (1,989) (2,556) Management fees – related party (1,997) (2,495) (2,495) (2,591) (2,561) Incentive fees – related party — — — (106) — Loan servicing expense (3,648) (4,571) (4,866) (4,891) (5,570) Merger related expenses (5,467) (603) (51) (1,629) (47) Other operating expenses (6,861) (8,085) (8,144) (10,070) (13,744) Total non-interest expense $ (41,279) $ (44,600) $ (49,842) $ (48,753) $ (64,793) Income before provision for income taxes $ 27,447 $ 8,289 $ 9,782 $ 18,988 $ (59,453) Provision for income (taxes) benefit 3,003 2,956 2,645 1,948 7,937 Net income $ 30,450 $ 11,245 $ 12,427 $ 20,936 $ (51,516) Less: Net income attributable to non-controlling interest 983 276 323 508 (1,064) Net income attributable to Ready Capital Corporation $ 29,467 $ 10,969 $ 12,104 $ 20,428 $ (50,452) Earnings per common share - basic $ 0.90 $ 0.25 $ 0.27 $ 0.43 $ (0.98) Earnings per common share - diluted $ 0.90 $ 0.25 $ 0.27 $ 0.43 $ (0.98) Weighted-average shares outstanding - Basic 32,556,875 44,425,598 44,438,652 46,446,573 51,984,040 Weighted-average shares outstanding - Diluted 32,563,644 44,431,263 44,467,801 46,482,470 51,990,013 Dividends declared per share of common stock $ 0.40 $ 0.40 $ 0.40 $ 0.40 $ 0.40 Q1 2019 Q2 2019 Q3 2019 Q4 2019 Q1 2020 |
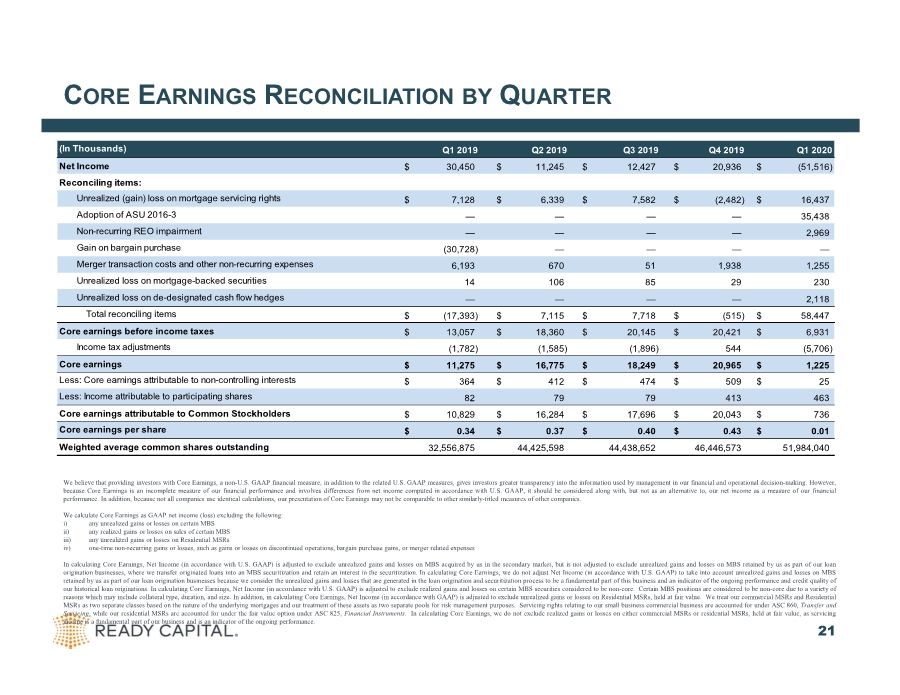
| CORE EARNINGS RECONCILIATION BY QUARTER 21 We believe that providing investors with Core Earnings, a non-U.S. GAAP financial measure, in addition to the related U.S. GAAP measures, gives investors greater transparency into the information used by management in our financial and operational decision-making. However, because Core Earnings is an incomplete measure of our financial performance and involves differences from net income computed in accordance with U.S. GAAP, it should be considered along with, but not as an alternative to, our net income as a measure of our financial performance. In addition, because not all companies use identical calculations, our presentation of Core Earnings may not be comparable to other similarly-titled measures of other companies. We calculate Core Earnings as GAAP net income (loss) excluding the following: i) any unrealized gains or losses on certain MBS ii) any realized gains or losses on sales of certain MBS iii) any unrealized gains or losses on Residential MSRs iv) one-time non-recurring gains or losses, such as gains or losses on discontinued operations, bargain purchase gains, or merger related expenses In calculating Core Earnings, Net Income (in accordance with U.S. GAAP) is adjusted to exclude unrealized gains and losses on MBS acquired by us in the secondary market, but is not adjusted to exclude unrealized gains and losses on MBS retained by us as part of our loan origination businesses, where we transfer originated loans into an MBS securitization and retain an interest in the securitization. In calculating Core Earnings, we do not adjust Net Income (in accordance with U.S. GAAP) to take into account unrealized gains and losses on MBS retained by us as part of our loan origination businesses because we consider the unrealized gains and losses that are generated in the loan origination and securitization process to be a fundamental part of this business and an indicator of the ongoing performance and credit quality of our historical loan originations. In calculating Core Earnings, Net Income (in accordance with U.S. GAAP) is adjusted to exclude realized gains and losses on certain MBS securities considered to be non-core. Certain MBS positions are considered to be non-core due to a variety of reasons which may include collateral type, duration, and size. In addition, in calculating Core Earnings, Net Income (in accordance with GAAP) is adjusted to exclude unrealized gains or losses on Residential MSRs, held at fair value. We treat our commercial MSRs and Residential MSRs as two separate classes based on the nature of the underlying mortgages and our treatment of these assets as two separate pools for risk management purposes. Servicing rights relating to our small business commercial business are accounted for under ASC 860, Transfer and Servicing, while our residential MSRs are accounted for under the fair value option under ASC 825, Financial Instruments. In calculating Core Earnings, we do not exclude realized gains or losses on either commercial MSRs or residential MSRs, held at fair value, as servicing income is a fundamental part of our business and is an indicator of the ongoing performance. (In Thousands) Net Income $ 30,450 $ 11,245 $ 12,427 $ 20,936 $ (51,516) Reconciling items: Unrealized (gain) loss on mortgage servicing rights $ 7,128 $ 6,339 $ 7,582 $ (2,482) $ 16,437 Adoption of ASU 2016-3 — — — — 35,438 Non-recurring REO impairment — — — — 2,969 Gain on bargain purchase (30,728) — — — — Merger transaction costs and other non-recurring expenses 6,193 670 51 1,938 1,255 Unrealized loss on mortgage-backed securities 14 106 85 29 230 Unrealized loss on de-designated cash flow hedges — — — — 2,118 Total reconciling items $ (17,393) $ 7,115 $ 7,718 $ (515) $ 58,447 Core earnings before income taxes $ 13,057 $ 18,360 $ 20,145 $ 20,421 $ 6,931 Income tax adjustments (1,782) (1,585) (1,896) 544 (5,706) Core earnings $ 11,275 $ 16,775 $ 18,249 $ 20,965 $ 1,225 Less: Core earnings attributable to non-controlling interests $ 364 $ 412 $ 474 $ 509 $ 25 Less: Income attributable to participating shares 82 79 79 413 463 Core earnings attributable to Common Stockholders $ 10,829 $ 16,284 $ 17,696 $ 20,043 $ 736 Core earnings per share $ 0.34 $ 0.37 $ 0.40 $ 0.43 $ 0.01 Weighted average common shares outstanding 32,556,875 44,425,598 44,438,652 46,446,573 51,984,040 Q1 2019 Q2 2019 Q3 2019 Q4 2019 Q1 2020 |
|