Attached files
| file | filename |
|---|---|
| EX-99.1 - EXHIBIT 99.1 - PREFERRED APARTMENT COMMUNITIES INC | aptssfd1q2020.htm |
| 8-K - 8-K - PREFERRED APARTMENT COMMUNITIES INC | a8k1q2020earningsrelease.htm |

BUSINESS UPDATE MAY 11, 2020

COVID-19 MAY COLLECTIONS UPDATE As the COVID-19 pandemic continues to unfold, the APTS team is working proactively to mitigate impacts to our customers, our investors, our associates, and our properties. The Company is well-positioned through its experienced leadership, sound real estate strategies, diversified business model, and operating platform to navigate these unprecedented times. As of May 10, the Company reports the following cash rental collections activity for May: MULTIHOUSING • 91.8% collected for multifamily. • 92.9% collected for student housing. GROCERY ANCHORED RETAIL • 65% collected.1 OFFICE PROPERTIES • 89% collected.1 1 Adjusted for GSA leases or other Federal government agencies which are customarily paid in arrears. 2

APTS INSIGHT EXPERIENCED PLATFORM SOUND STRATEGIES VALUE CREATION SUN BELT MARKETS 3

APTS INSIGHT DIVERSIFIED EQUITY CAPITAL BASE DEBT NYSE-Traded Common Stock Property Mortgages Non-Traded Preferred Stock Corporate Line of Credit EXPERIENCED TEAM DIVERSIFIED STRATEGY MULTI- GROCERY HOUSING ANCHORED OFFICE RETAIL USES STUDENT MULTIFAMILY HOUSING 4

APTS INSIGHT DIVERSIFIED 12,648 STRATEGY UNIFIED MULTI- OWNED UNITS BY SHARED SUNBELT HOUSING 2,718 MARKETS: UNITS IN REAL 79% of 2019 ESTATE LOAN Revenues Attributable to INVESTMENT PROGRAM TOP 4 STATES FL GROCERY ANCHORED 54 GROCERY ANCHORED RETAIL CENTERS GA 6.2M SQUARE FEET TX OFFICE 9 PROPERTIES 3.2M SQUARE FEET NC 5

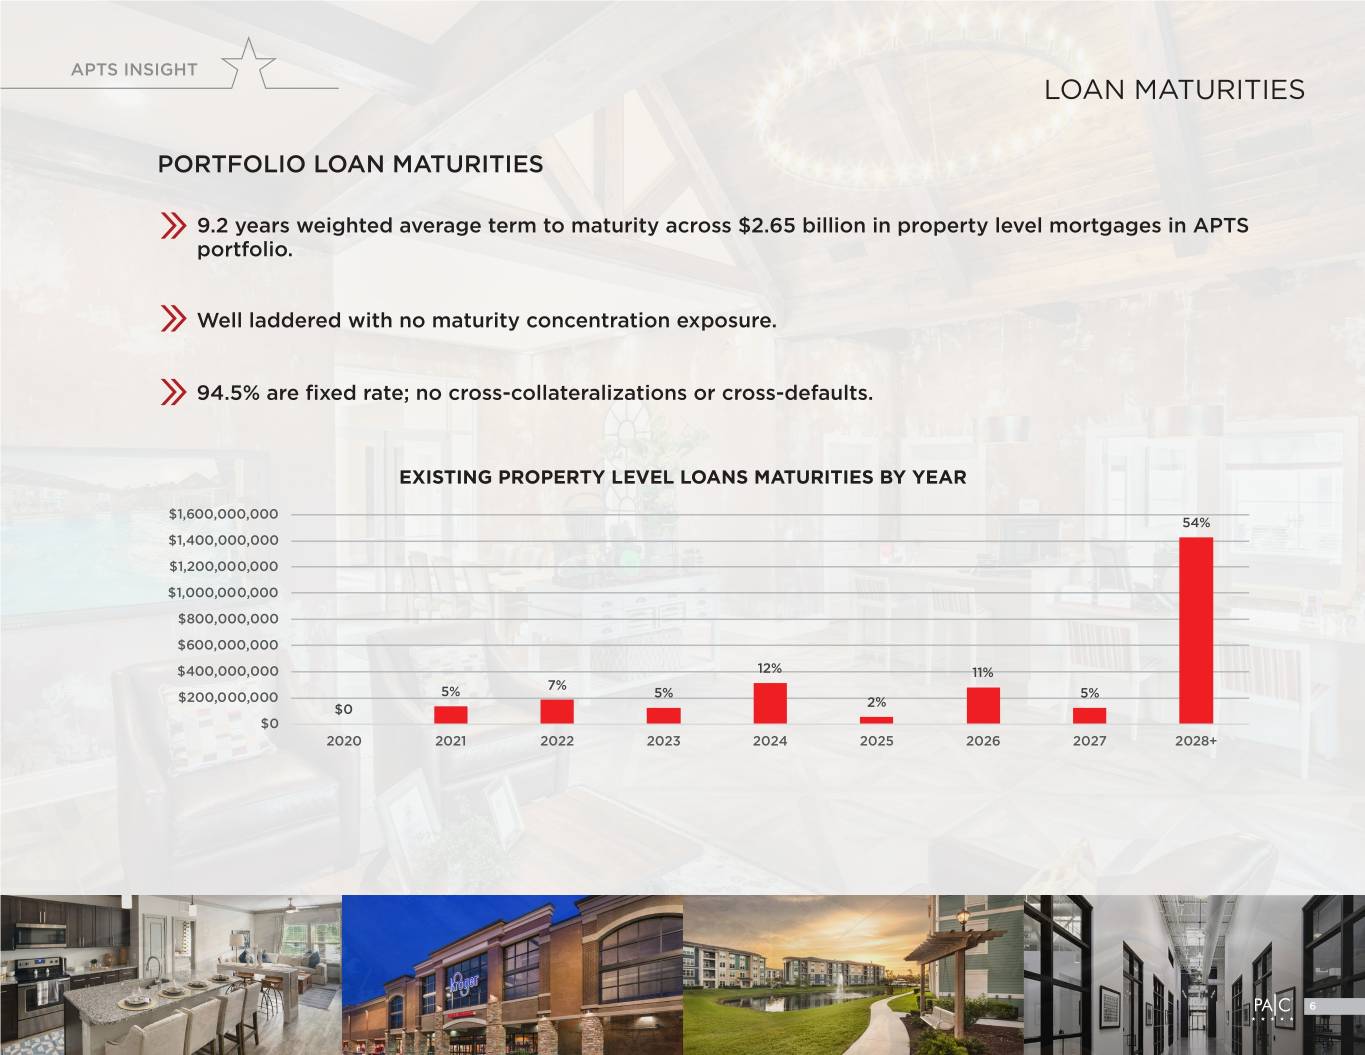
APTS INSIGHT LOAN MATURITIES PORTFOLIO LOAN MATURITIES 9.2 years weighted average term to maturity across $2.65 billion in property level mortgages in APTS portfolio. Well laddered with no maturity concentration exposure. 94.5% are fixed rate; no cross-collateralizations or cross-defaults. EXISTING PROPERTY LEVEL LOANS MATURITIES BY YEAR $1,600,000,000 54% $1,400,000,000 $1,200,000,000 $1,000,000,000 $800,000,000 $600,000,000 $400,000,000 12% 11% 7% 5% 5% 5% $200,000,000 2% $0 $0 2020 2021 2022 2023 2024 2025 2026 2027 2028+ 6

APTS INSIGHT SUN BELT MARKETS Washington D.C. APTS INSIGHT Northern Virginia Charlottesville, VA San Jose, Richmond, VA Virginia Beach, VA CA Kansas City, KS Wilmington, NC Melbourne, FL Destin, FL West Palm Beach, FL APTS TOP STATES US RANKINGS TOP STATES % OF TOTAL 2019 REVENUES FORBES BUSINESS NET MIGRATION1 POP. GROWTH1 FLORIDA 26% #6 #5 #5 GEORGIA 24% #5 #2 #2 TEXAS 15% #2 #1 #1 NORTH CAROLINA 15% #1 #3 #3 TENNESSEE 5% #7 #10 #10 VIRGINIA 4% #4 #12 #12 TOTAL 88% 7 1 Population growth data is 2000-2019 and net migration data is 2005-2018

SOUND STRATEGIES

SOUND STRATEGIES MULTIHOUSING MULTIFAMILY STRATEGY Class A Properties New Vintage Construction MSA’s of 1MM+, Focused in Sun Belt Markets First Ring Suburban Locations 3x Rent Tenant Income Qualification Standard 9

SOUND STRATEGIES MULTIHOUSING MULTIFAMILY PORTFOLIO OVERVIEW AT-A-GLANCE AVERAGE AGE OF AVERAGE RENT OF 35 10,637 5.6 $1,412 PROPERTIES UNITS YEARS OLD FLORIDA TEXAS 44% 14% TOP 3 STATES BY UNIT COUNT Q1 2020 GEORGIA 15% 4.3% 96% SAME STORE NOI OCCUPIED GROWTH 10

SOUND STRATEGIES MULTIHOUSING STUDENT HOUSING STRATEGY Well Located, Class A Properties Connected to Top Tier Universities with Growing Enrollments Secure Rent Rolls with Contractual Term Minimal Exposure to Non-growth CAPEX New Vintage Construction 11

MULTIHOUSING SOUND STRATEGIES STUDENT HOUSING PORTFOLIO OVERVIEW AT-A-GLANCE AVERAGE AGE OF 6,095BEDS 8 5.1 PROPERTIES 2,011UNITS YEARS ARIZONA 10% TEXAS 33% GEORGIA PERCENT 14% OF TOTAL BED COUNT BY STATE FLORIDA NORTH CAROLINA 25% 18% Q1 2020 96% OCCUPIED 12

GROCERY ANCHORED SOUND STRATEGIES RETAIL GROCERY ANCHORED RETAIL STRATEGY Pure Play Grocery & Necessity Based Retail Strategy Focus on Suburban Sun Belt Markets, Growing Submarkets with High Average Household Incomes Leading Market Share Grocers Drive Leasing and Occupancy through Deep Operating Experience and Long Standing Retailer Relationships 13

GROCERY ANCHORED SOUND STRATEGIES RETAIL PORTFOLIO OVERVIEW PORTFOLIO COMPOSITION BY TENANT TYPE AT-A-GLANCE Grocery/ Pharmacy 54 OWNED ASSETS 54 ASSETS PURCHASED Other Retail FOR $187 PSF, SIGNIFICANTLY BELOW REPLACEMENT COSTS 18% 36% 6.2M SQUARE FEET IN OUR ASSET’S RESPECTIVE OWNED MARKETS Fitness 95% LEASED EXCLUDING 52% OF NEW MARKET’S 3% REDEVELOPMENTS BASE RENT COMES FROM FIXED RATE DEBT WITH OVER TENANT CATEGORIES DEEMED TO BE ESSENTIAL DURING Medical 8 YEARS AVERAGE THE COVID-19 PANDEMIC TERM TO MATURITY GUIDELINES 4% 33% OF RENT IS GROCERY & PHARMACY Restaurant 19% % OF GROCER RENT 1% Service 1% 22% 1% 3% 1% 4% TOP 5 STATES # of % of # State 4% 45% Assets GLA 1. Georgia 17 26.3% 2. Florida 10 17.7% 6% 3. North Carolina 5 12.4% 4. Virginia 3 8.8% 5. Tennessee 6 8.8% TOTAL 41 74.0% 34% 14

SOUND STRATEGIES OFFICE OFFICE STRATEGY Class A Properties Target Top-Performing Sun Belt Markets ATLANTA | AUSTIN | CHARLOTTE DALLAS | NASHVILLE | RALEIGH Scalable Market Positions to Drive Operating Leverage Secure Rent Rolls with Contractual Term Minimal Exposure to Non-Growth CapEx Creditworthy Corporate Customers 15

SOUND STRATEGIES OFFICE PORTFOLIO OVERVIEW TENANCY OVERVIEW DIVERSIFIED RENT ROLL LARGE CORPORATE CUSTOMERS PORTFOLIO STATS: 9 3.2M All Other Financial PROPERTIES SQUARE FEET 21% 19% OTHER 25% CHEMICAL SOLUTIONS LARGE RETAIL PUBLIC 5% 7.2 97% Hospitality 3% 42% YEARS WEIGHTED LEASED 18% Insurance GOVERNMENT AVERAGE 9% 4% REMAINING LEASE LARGE TERM Legal Technology PRIVATE 10% 18% 26% LOAN MATURITIES LEASE EXPIRATION SCHEDULE 1,200,000 120.00% $300,000,000 100% 1,040,361 No core porfolio 90% 1,000,000 No more than 10% of 100.00% $250,000,000 maturities through 2027 80% portfolio expiring in any year 70% 800,000 through 2029 80.00% $200,000,000 60% 50% $150,000,000 600,000 60.00% 40% 400,000 321,364 40.00% $100,000,000 30% 244,740 265,529 251,242 266,263 20% 231,732 $50,000,000 126,749 128,159 200,000 56,604 20.00% 10% 95,613 $0 0% -- 0.00% 2020 2021 2022 2023 2024 2025 2026 2027 2028 2029 2030 2031 2032 2033 2020 2021 2022 2023 2024 2025 2026 2027 2028 2029 2030+ 2034+ SF EXPIRING CUMULATIVE TOTAL SF EXPIRED RSF EXPIRING % OF PORTFOLIO CUMULATIVE TOTAL 16

INVESTOR RESOURCES Click icons below to access information electronically Annual Report 2019 Executive Team Bios Investor Relations Website Investor Relations phone #: (770) 635 1284 investorrelations@pacapts.com 3284 Northside Parkway, Suite 150 Atlanta GA 30327 PACAPTS.COM Forward Looking Statements This business update (this “Update”) includes forward-looking statements made in reliance on the safe harbor provisions of the Private Se- curities Litigation Reform Act of 1995. These statements may be identified by the use of forward-looking terminology such as “may”, “trend”, “will”, “expects”, “plans”, “estimates”, “anticipates”, “projects”, “intends”, “believes”, “strategy”, “goals”, “objectives”, “outlook” and similar expressions. Forward-looking statements include, without limitation, statements relating to the impact of COVID-19 on the Company’s business and the Company’s ability to mitigate the impacts arising from COVID-19. These statements are based on the Company’s current expectations and beliefs and are subject to a number of risks, uncertainties and assumptions that could cause actual results to differ mate- rially from those described in the forward-looking statements. These risks, uncertainties and contingencies include, but are not limited to, those disclosed in PAC’s filings with the Securities and Exchange Commission. PAC undertakes no obligation to update these forward-look- ing statements to reflect events or circumstances after the date hereof or to reflect the occurrence of unanticipated events, except as may be required by law. Readers are cautioned not to place undue reliance on these forward-looking statements, which speak only as of the date of this Update. The properties depicted in this Update are multihousing communities, grocery anchored retail, Class-A office, and other income-producing property types that PAC currently owns or for which PAC currently has a real estate loan investment in connection with the development of those properties. PRIOR PERFORMANCE IN THIS UPDATE SHOULD NOT BE INDICATIVE OF HOW PAC WILL PERFORM IN THE FUTURE.
