Attached files
| file | filename |
|---|---|
| EX-99.1 - EX-99.1 - Oyster Point Pharma, Inc. | a2020-05x11xxoystxxpos.htm |
| 8-K - 8-K - Oyster Point Pharma, Inc. | oysterpoint-2020follow.htm |
ONSET-2 Phase 3 Study Top-line Results May 11, 2020 NASDAQ: OYST
Disclaimers and Forward-Looking Statements This presentation contains “forward-looking statements” within the meaning of the Private Securities Litigation Reform Act of 1995 that reflect the current beliefs, expectations and assumptions of Oyster Point Pharma, Inc. (the “Company,” “we” or “our”) regarding the future of its business, its future plans and strategies, clinical results, future financial condition and other future conditions. All statements other than statements of historical facts contained in this presentation, including statements regarding future results of operations and financial position, business strategy, product candidates, planned preclinical studies and clinical trials, results of clinical trials, research and development costs, regulatory approvals, timing and likelihood of success, as well as plans and objectives of management for future operations, are forward-looking statements. The words “may,” “will,” “should,” “would,” “expect,” “plan,” “anticipate,” “could,” “intend,” “target,” “project,” “contemplate,” “believe,” “estimate,” “predict,” “potential” or “continue” or the negative of these terms or other similar expressions are intended to identify forward-looking statements, although not all forward-looking statements contain these identifying words. These forward-looking statements are subject to a number of risks, uncertainties and assumptions, including, among other things: market conditions, the likelihood of our clinical trials demonstrating safety and efficacy of our product candidates, and other positive results; the timing of initiation of our future clinical trials, and the reporting of data from our current and future trials; our plans relating to the clinical development of our product candidates, including the size, number and disease areas to be evaluated; the size of the market opportunity and prevalence of dry eye disease (DED) for our product candidates; our plans relating to commercializing our product candidates, if approved, including the geographic areas of focus and sales strategy; the success of competing therapies that are or may become available; our estimates of the number of patients in the United States who suffer from DED and the number of patients that will enroll in our clinical trials; the beneficial characteristics, safety, efficacy and therapeutic effects of our product candidates; the timing or likelihood of regulatory filings and approval for our product candidates; our ability to obtain and maintain regulatory approval of our product candidates; our plans relating to the further development and manufacturing of our product candidates, including additional indications for which we may pursue; the expected potential benefits of strategic collaborations with third parties and our ability to attract collaborators with development, regulatory and commercialization expertise; existing regulations and regulatory developments in the United States and other jurisdictions; our plans and ability to obtain or protect intellectual property rights, including extensions of existing patent terms where available; our continued reliance on third parties to conduct additional clinical trials of our product candidates, and for the manufacture of our product candidates for preclinical studies and clinical trials; the accuracy of our estimates regarding expenses, future revenue, capital requirements and needs for additional financing; our financial performance; the sufficiency of our existing capital resources to fund our future operating expenses and capital expenditure requirements; our expectations regarding the period during which we will qualify as an emerging growth company under the JOBS Act; our anticipated use of our existing resources and the proceeds from our initial public offering; and other risks described in the “Risk Factors” section included in our public filings that we have made and will make with the Securities and Exchange Commission (SEC). The forward-looking statements in this presentation represent our views as of the date of this presentation. Although we believe the expectations reflected in such forward-looking statements are reasonable, we can give no assurance that such expectations will prove to be correct. Accordingly, readers are cautioned not to place undue reliance on these forward-looking statements. Except as required by applicable law, we do not plan to publicly update or revise any forward-looking statements contained herein, whether as a result of any new information, future events, changed circumstances or otherwise. No representations or warranties (expressed or implied) are made about the accuracy of any such forward-looking statements. New risk factors and uncertainties may emerge from time to time, and it is not possible to predict all risk factors and uncertainties. We have filed and will file Current Reports on Form 8-K, Quarterly Reports on Form 10-Q and Annual Reports on Form 10-K, and other documents with the SEC. You should read these documents for more complete information about us. You may obtain these documents for free by visiting EDGAR on the SEC website at www.sec.gov. This presentation concerns products that are under clinical investigation and which have not yet been approved for marketing by the U.S. Food and Drug Administration. They are currently limited by Federal law to investigational use, and no representation is made as to their safety or effectiveness for the purposes for which they are being investigated.
Conference Call Speakers Jeffrey Nau, PhD, MMS President and Chief Executive Officer Daniel Lochner, MBA Chief Financial Officer John Snisarenko, MBA Chief Commercial Officer ©2020 Oyster Point Pharma, Inc.: Confidential & Proprietary I 3
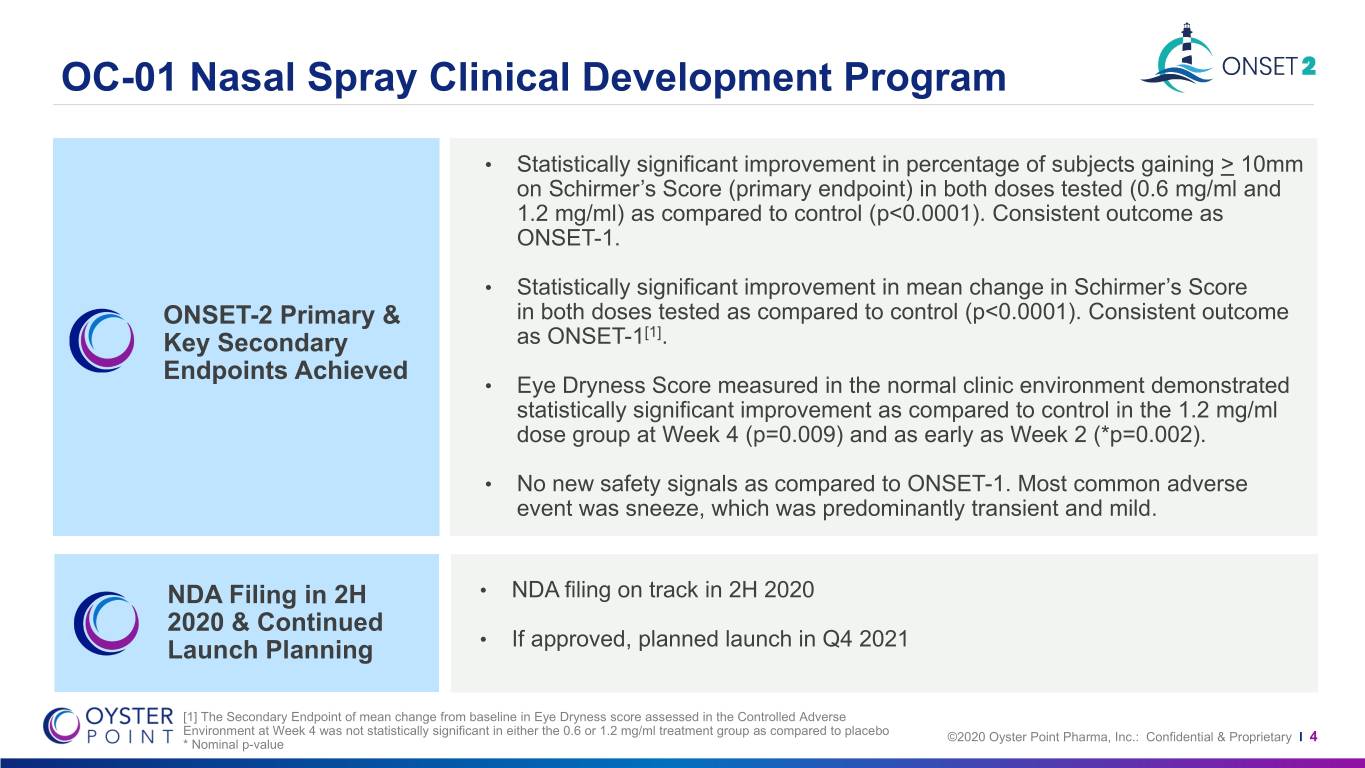
OC-01 Nasal Spray Clinical Development Program • Statistically significant improvement in percentage of subjects gaining > 10mm on Schirmer’s Score (primary endpoint) in both doses tested (0.6 mg/ml and 1.2 mg/ml) as compared to control (p<0.0001). Consistent outcome as ONSET-1. • Statistically significant improvement in mean change in Schirmer’s Score ONSET-2 Primary & in both doses tested as compared to control (p<0.0001). Consistent outcome [1] Key Secondary as ONSET-1 . Endpoints Achieved • Eye Dryness Score measured in the normal clinic environment demonstrated statistically significant improvement as compared to control in the 1.2 mg/ml dose group at Week 4 (p=0.009) and as early as Week 2 (*p=0.002). • No new safety signals as compared to ONSET-1. Most common adverse event was sneeze, which was predominantly transient and mild. NDA Filing in 2H • NDA filing on track in 2H 2020 2020 & Continued • If approved, planned launch in Q4 2021 Launch Planning [1] The Secondary Endpoint of mean change from baseline in Eye Dryness score assessed in the Controlled Adverse Environment at Week 4 was not statistically significant in either the 0.6 or 1.2 mg/ml treatment group as compared to placebo ©2020 Oyster Point Pharma, Inc.: Confidential & Proprietary I * Nominal p-value 4
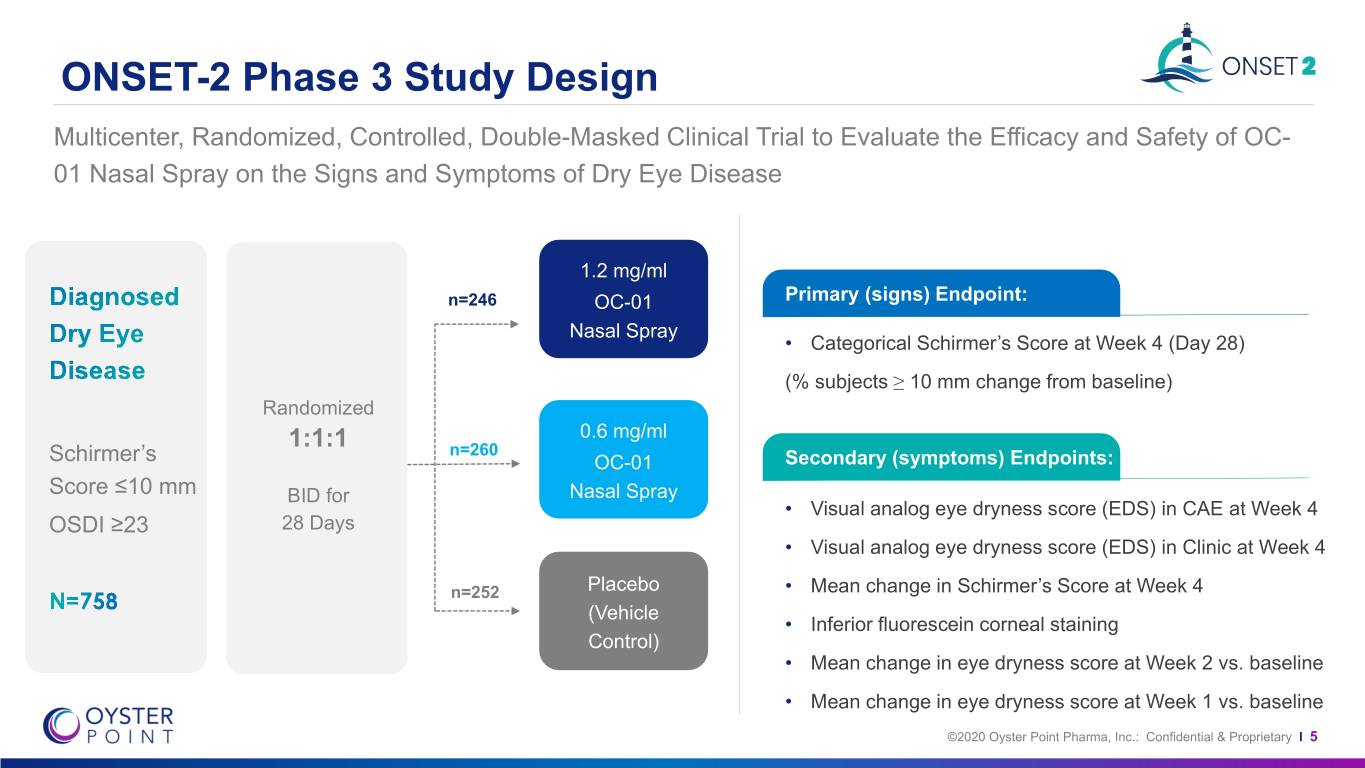
ONSET-2 Phase 3 Study Design Multicenter, Randomized, Controlled, Double-Masked Clinical Trial to Evaluate the Efficacy and Safety of OC- 01 Nasal Spray on the Signs and Symptoms of Dry Eye Disease 1.2 mg/ml n=246 OC-01 Primary (signs) Endpoint: Nasal Spray • Categorical Schirmer’s Score at Week 4 (Day 28) (% subjects ≥ 10 mm change from baseline) Randomized 0.6 mg/ml 1:1:1 n=260 Schirmer’s OC-01 Secondary (symptoms) Endpoints: Score ≤10 mm BID for Nasal Spray • Visual analog eye dryness score (EDS) in CAE at Week 4 OSDI ≥23 28 Days • Visual analog eye dryness score (EDS) in Clinic at Week 4 n=252 Placebo • Mean change in Schirmer’s Score at Week 4 (Vehicle • Inferior fluorescein corneal staining Control) • Mean change in eye dryness score at Week 2 vs. baseline • Mean change in eye dryness score at Week 1 vs. baseline ©2020 Oyster Point Pharma, Inc.: Confidential & Proprietary I 5
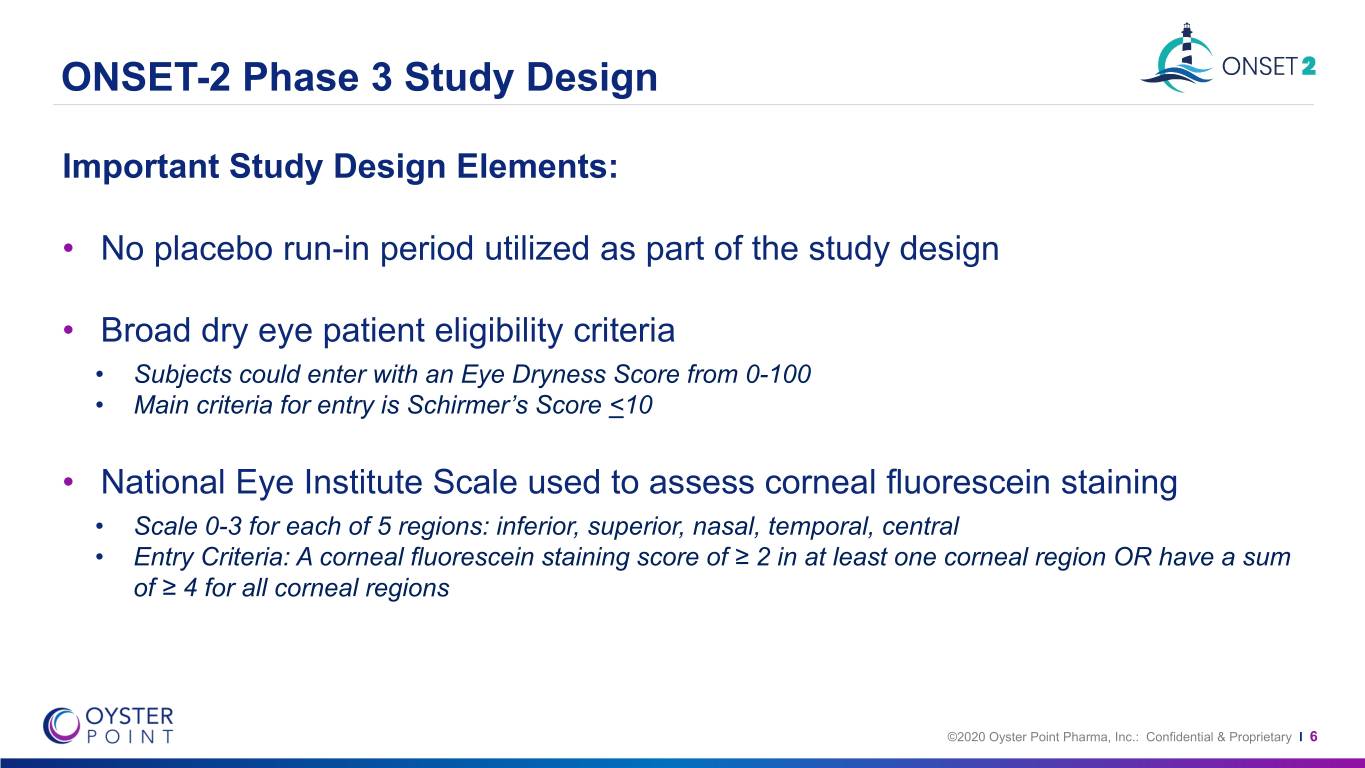
ONSET-2 Phase 3 Study Design Important Study Design Elements: • No placebo run-in period utilized as part of the study design • Broad dry eye patient eligibility criteria • Subjects could enter with an Eye Dryness Score from 0-100 • Main criteria for entry is Schirmer’s Score <10 • National Eye Institute Scale used to assess corneal fluorescein staining • Scale 0-3 for each of 5 regions: inferior, superior, nasal, temporal, central • Entry Criteria: A corneal fluorescein staining score of ≥ 2 in at least one corneal region OR have a sum of ≥ 4 for all corneal regions ©2020 Oyster Point Pharma, Inc.: Confidential & Proprietary I 6
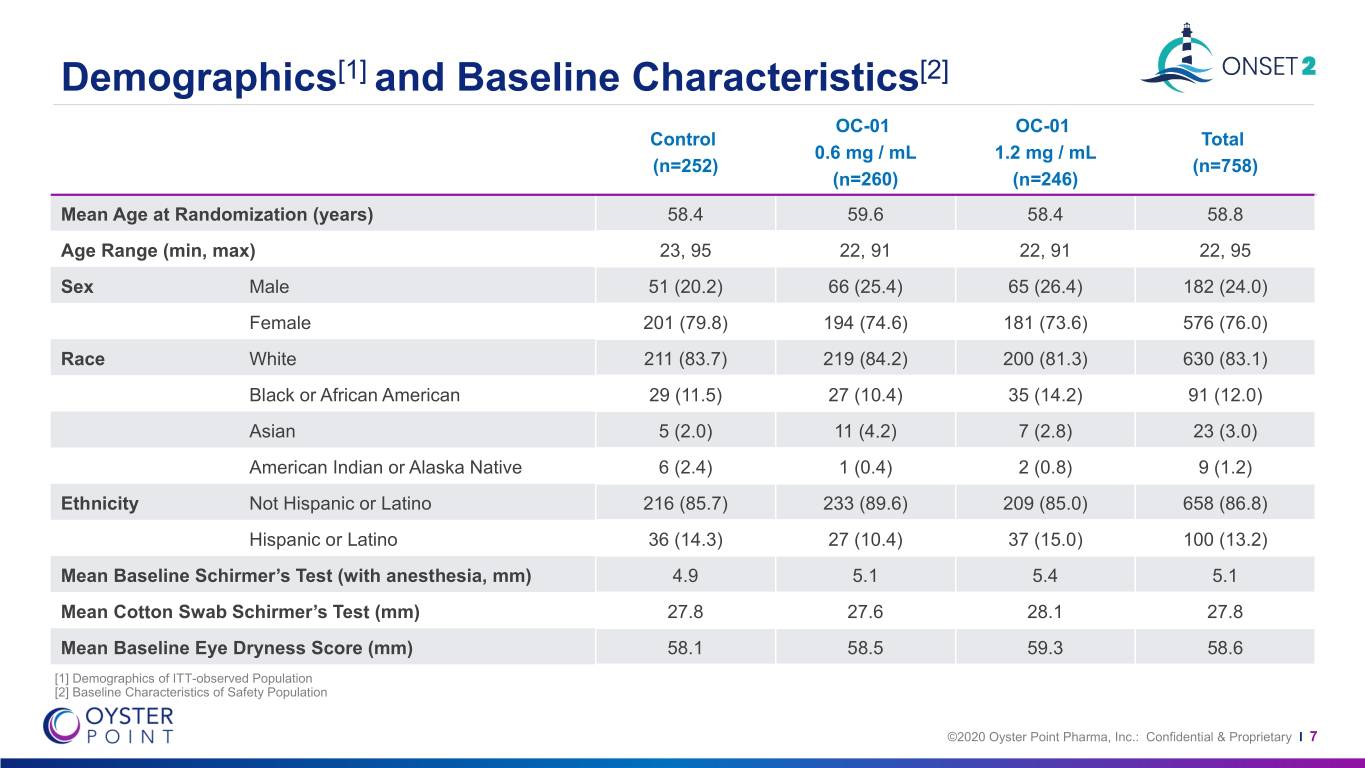
Demographics[1] and Baseline Characteristics[2] OC-01 OC-01 Control Total 0.6 mg / mL 1.2 mg / mL (n=252) (n=758) (n=260) (n=246) Mean Age at Randomization (years) 58.4 59.6 58.4 58.8 Age Range (min, max) 23, 95 22, 91 22, 91 22, 95 Sex Male 51 (20.2) 66 (25.4) 65 (26.4) 182 (24.0) Female 201 (79.8) 194 (74.6) 181 (73.6) 576 (76.0) Race White 211 (83.7) 219 (84.2) 200 (81.3) 630 (83.1) Black or African American 29 (11.5) 27 (10.4) 35 (14.2) 91 (12.0) Asian 5 (2.0) 11 (4.2) 7 (2.8) 23 (3.0) American Indian or Alaska Native 6 (2.4) 1 (0.4) 2 (0.8) 9 (1.2) Ethnicity Not Hispanic or Latino 216 (85.7) 233 (89.6) 209 (85.0) 658 (86.8) Hispanic or Latino 36 (14.3) 27 (10.4) 37 (15.0) 100 (13.2) Mean Baseline Schirmer’s Test (with anesthesia, mm) 4.9 5.1 5.4 5.1 Mean Cotton Swab Schirmer’s Test (mm) 27.8 27.6 28.1 27.8 Mean Baseline Eye Dryness Score (mm) 58.1 58.5 59.3 58.6 [1] Demographics of ITT-observed Population [2] Baseline Characteristics of Safety Population ©2020 Oyster Point Pharma, Inc.: Confidential & Proprietary I 7
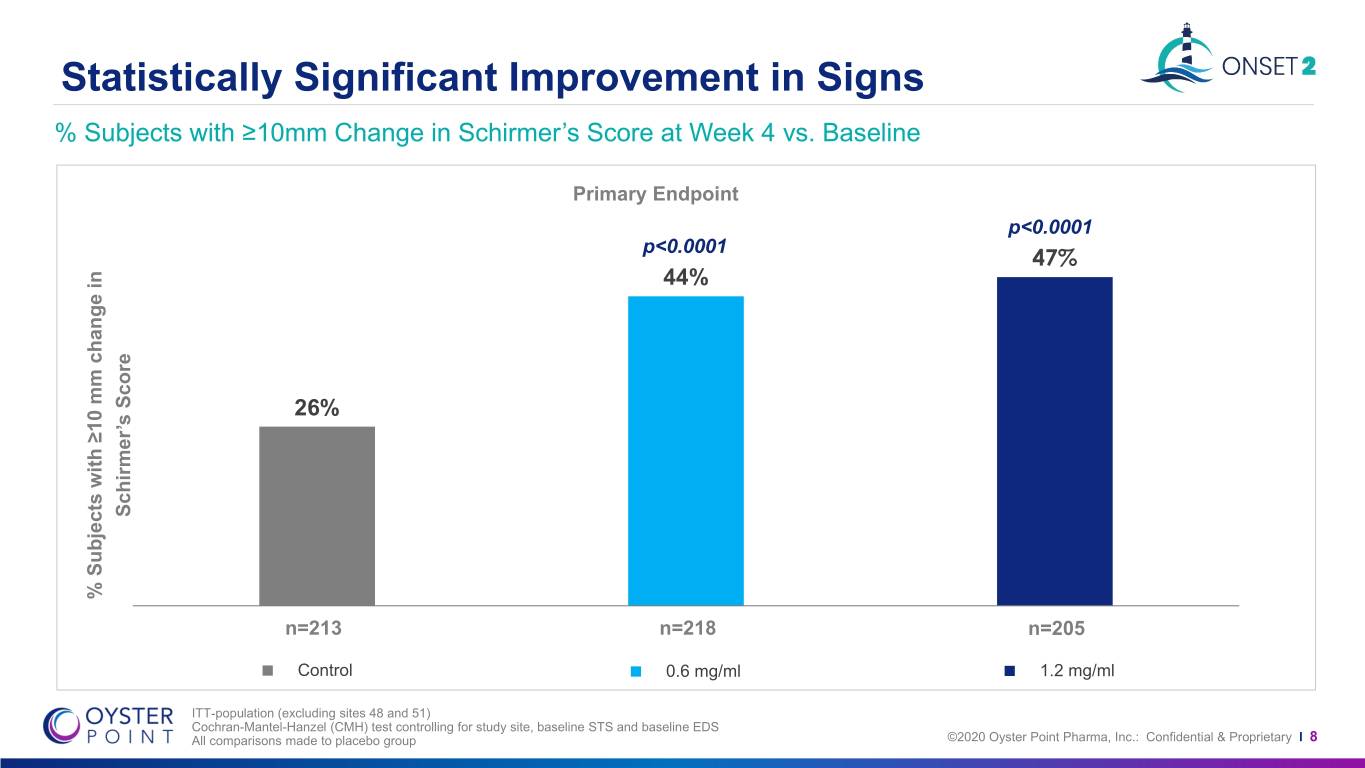
Statistically Significant Improvement in Signs % Subjects with ≥10mm Change in Schirmer’s Score at Week 4 vs. Baseline Primary Endpoint p<0.0001 p<0.0001 47% 44% 26% Schirmer’s Score Schirmer’s % mm % ≥10within Subjects change n=213 n=218 n=205 Control 0.6 mg/ml 1.2 mg/ml ITT-population (excluding sites 48 and 51) Cochran-Mantel-Hanzel (CMH) test controlling for study site, baseline STS and baseline EDS All comparisons made to placebo group ©2020 Oyster Point Pharma, Inc.: Confidential & Proprietary I 8
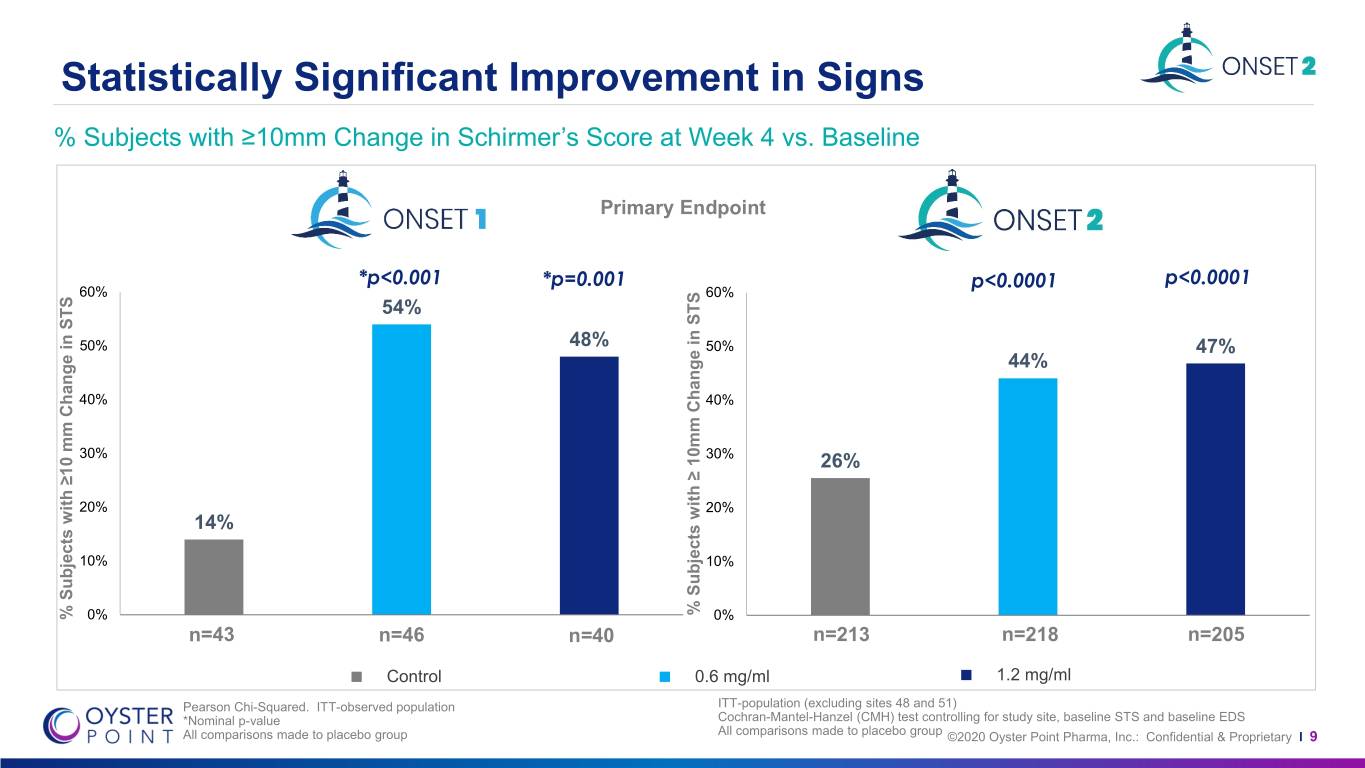
Statistically Significant Improvement in Signs % Subjects with ≥10mm Change in Schirmer’s Score at Week 4 vs. Baseline Primary Endpoint *p<0.001 *p=0.001 p<0.0001 p<0.0001 60% 60% 54% 50% 48% 50% 47% 44% 40% 40% 30% 30% 26% 20% 20% 14% 10% 10% % % Subjects with≥ Change 10mm in STS % % Subjects with≥10 Change mm in STS 0% 0% n=43 n=46 n=40 n=213 n=218 n=205 Control 0.6 mg/ml 1.2 mg/ml Pearson Chi-Squared. ITT-observed population ITT-population (excluding sites 48 and 51) *Nominal p-value Cochran-Mantel-Hanzel (CMH) test controlling for study site, baseline STS and baseline EDS All comparisons made to placebo group All comparisons made to placebo group ©2020 Oyster Point Pharma, Inc.: Confidential & Proprietary I 9
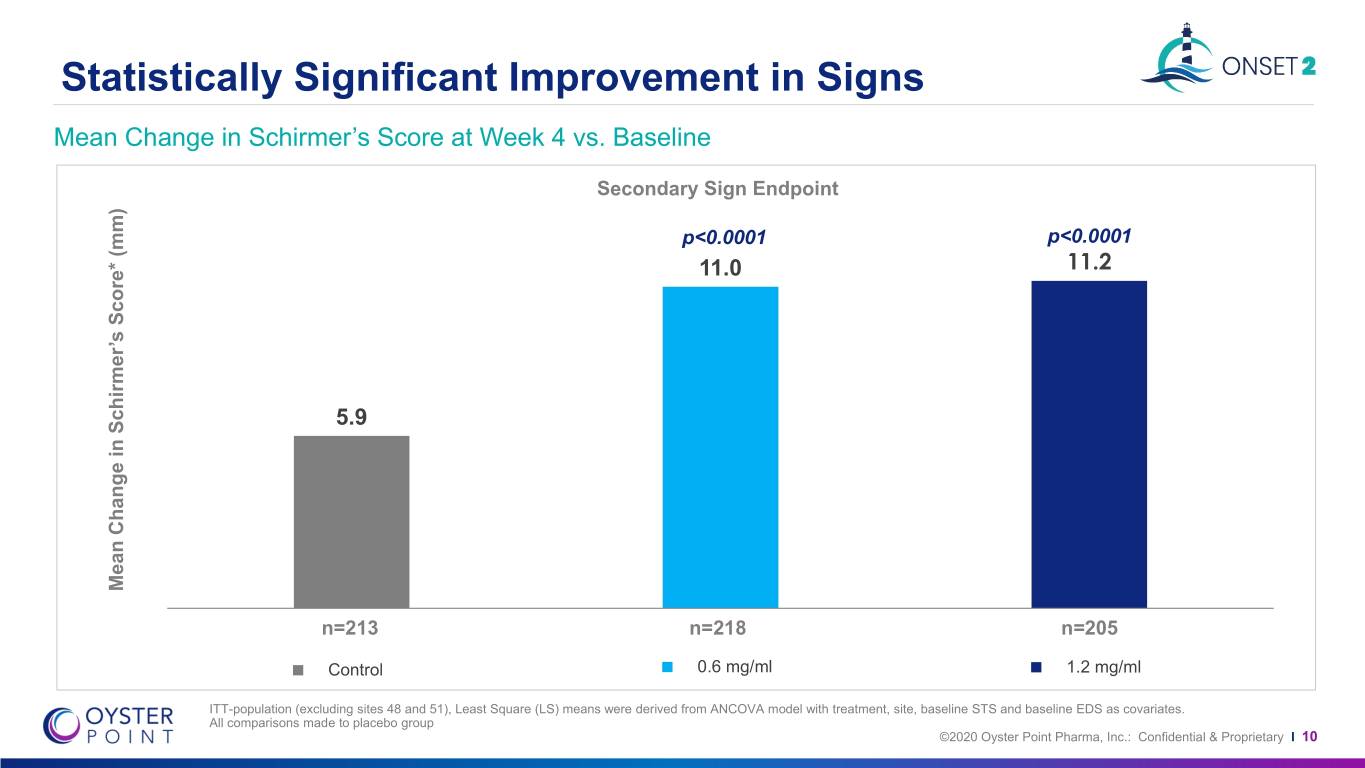
Statistically Significant Improvement in Signs Mean Change in Schirmer’s Score at Week 4 vs. Baseline Secondary Sign Endpoint p<0.0001 p<0.0001 11.0 11.2 5.9 Mean Change in Schirmer’sin Change Mean Score* (mm) n=213 n=218 n=205 Control 0.6 mg/ml 1.2 mg/ml ITT-population (excluding sites 48 and 51), Least Square (LS) means were derived from ANCOVA model with treatment, site, baseline STS and baseline EDS as covariates. All comparisons made to placebo group ©2020 Oyster Point Pharma, Inc.: Confidential & Proprietary I 10
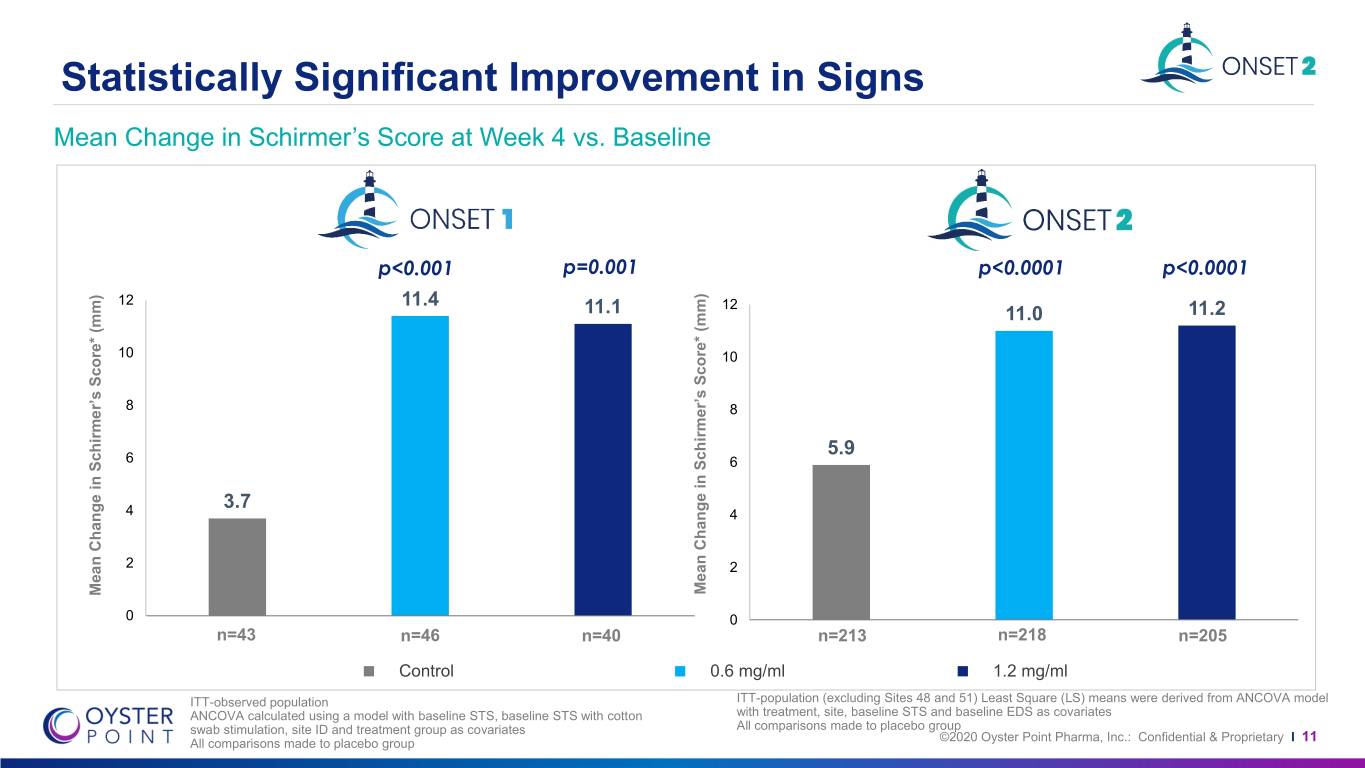
Statistically Significant Improvement in Signs Mean Change in Schirmer’s Score at Week 4 vs. Baseline p<0.001 p=0.001 p<0.0001 p<0.0001 12 11.4 12 11.1 11.0 11.2 10 10 8 8 5.9 6 6 3.7 4 4 2 2 Mean Mean Change Score* in Schirmer’s (mm) Mean Mean Change Score* in Schirmer’s (mm) 0 0 n=43 n=46 n=40 n=213 n=218 n=205 Control 0.6 mg/ml 1.2 mg/ml ITT-observed population ITT-population (excluding Sites 48 and 51) Least Square (LS) means were derived from ANCOVA model ANCOVA calculated using a model with baseline STS, baseline STS with cotton with treatment, site, baseline STS and baseline EDS as covariates swab stimulation, site ID and treatment group as covariates All comparisons made to placebo group ©2020 Oyster Point Pharma, Inc.: Confidential & Proprietary All comparisons made to placebo group I 11
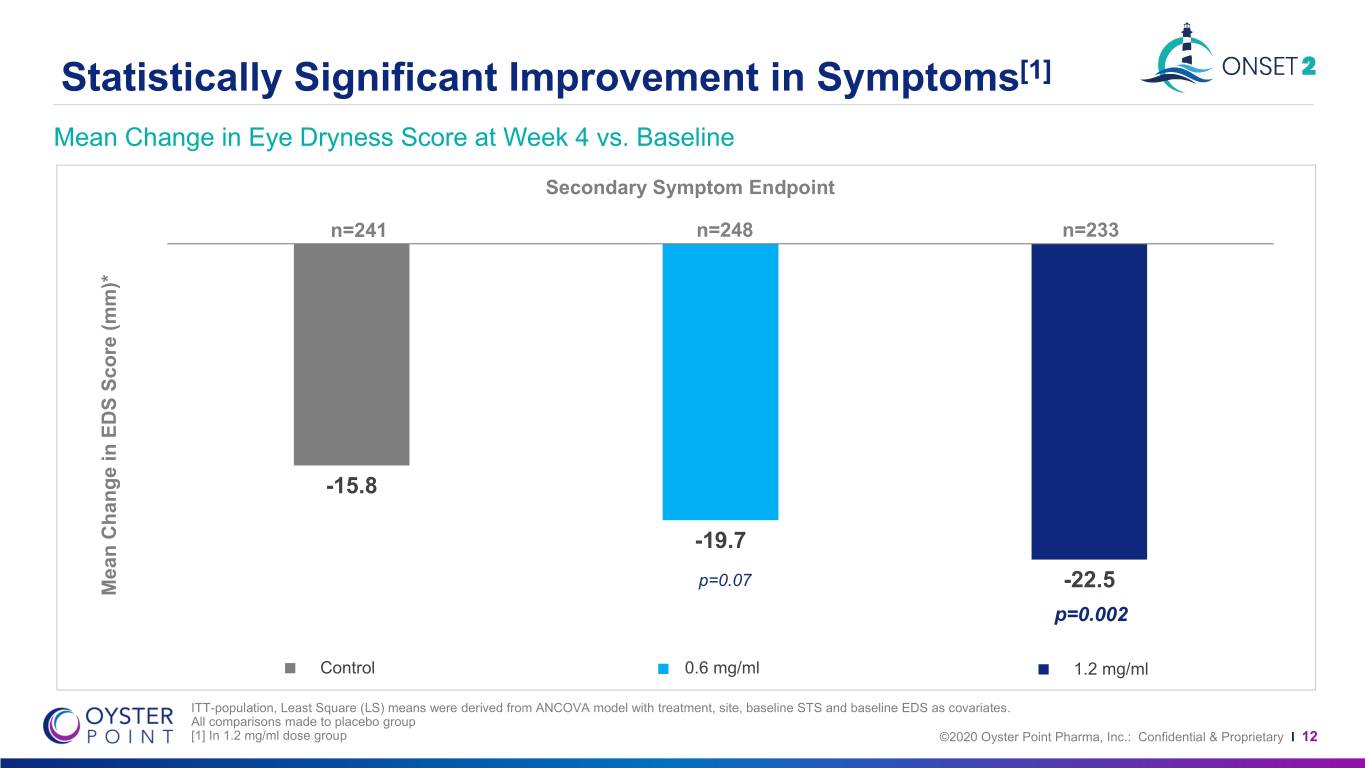
Statistically Significant Improvement in Symptoms[1] Mean Change in Eye Dryness Score at Week 4 vs. Baseline Secondary Symptom Endpoint n=241 n=248 n=233 -15.8 -19.7 p=0.07 Mean Change in Change EDS Mean Score (mm)* P<0.001 P=0.001 -22.5 p=0.002 Control 0.6 mg/ml 1.2 mg/ml ITT-population, Least Square (LS) means were derived from ANCOVA model with treatment, site, baseline STS and baseline EDS as covariates. All comparisons made to placebo group [1] In 1.2 mg/ml dose group ©2020 Oyster Point Pharma, Inc.: Confidential & Proprietary I 12
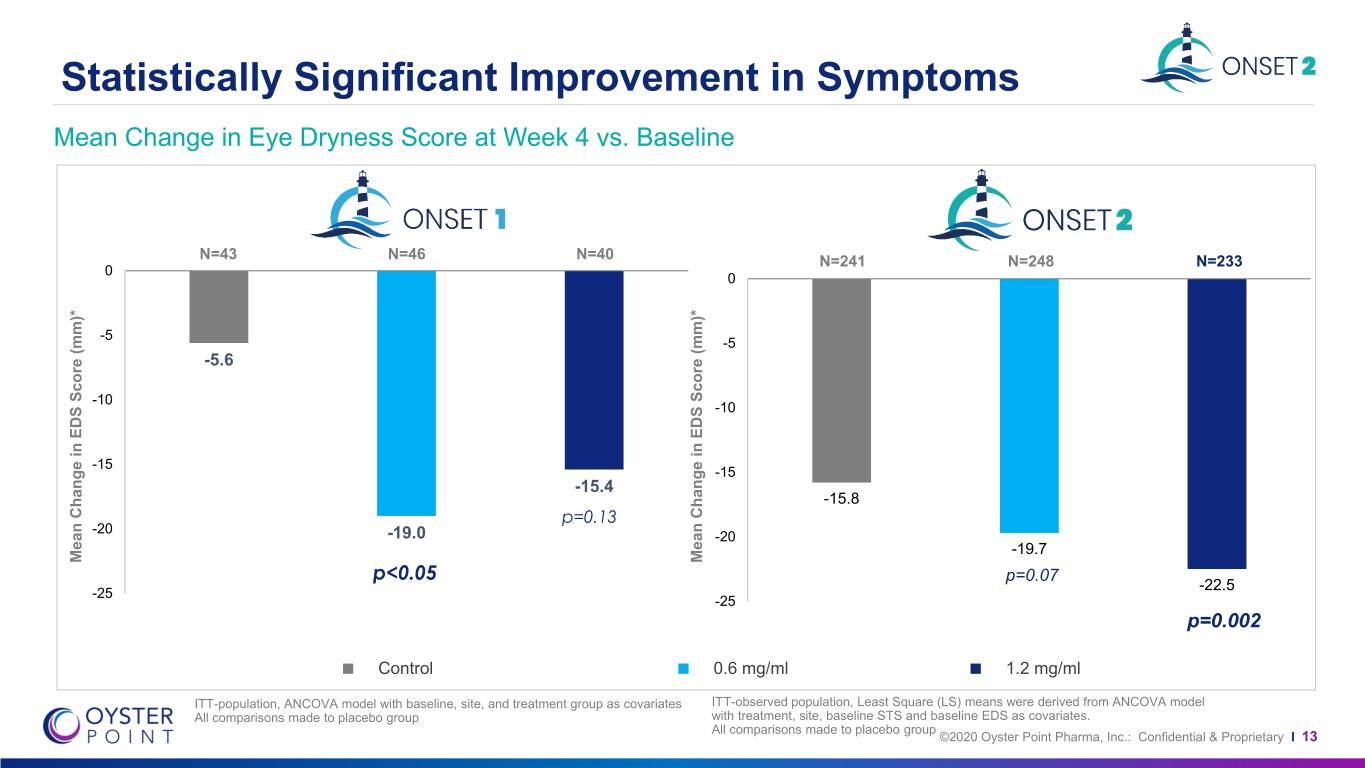
Statistically Significant Improvement in Symptoms Mean Change in Eye Dryness Score at Week 4 vs. Baseline N=43 N=46 N=40 N=241 N=248 N=233 0 0 -5 -5 -5.6 -10 -10 -15 -15 -15.4 -15.8 p=0.13 -20 -19.0 -20 -19.7 Mean Change in EDS Score (mm)* Score EDS in Change Mean Mean Change in EDS Score (mm)* Score EDS in Change Mean p<0.05 p=0.07 -22.5 -25 -25 p=0.002 Control 0.6 mg/ml 1.2 mg/ml ITT-population, ANCOVA model with baseline, site, and treatment group as covariates ITT-observed population, Least Square (LS) means were derived from ANCOVA model All comparisons made to placebo group with treatment, site, baseline STS and baseline EDS as covariates. All comparisons made to placebo group ©2020 Oyster Point Pharma, Inc.: Confidential & Proprietary I 13
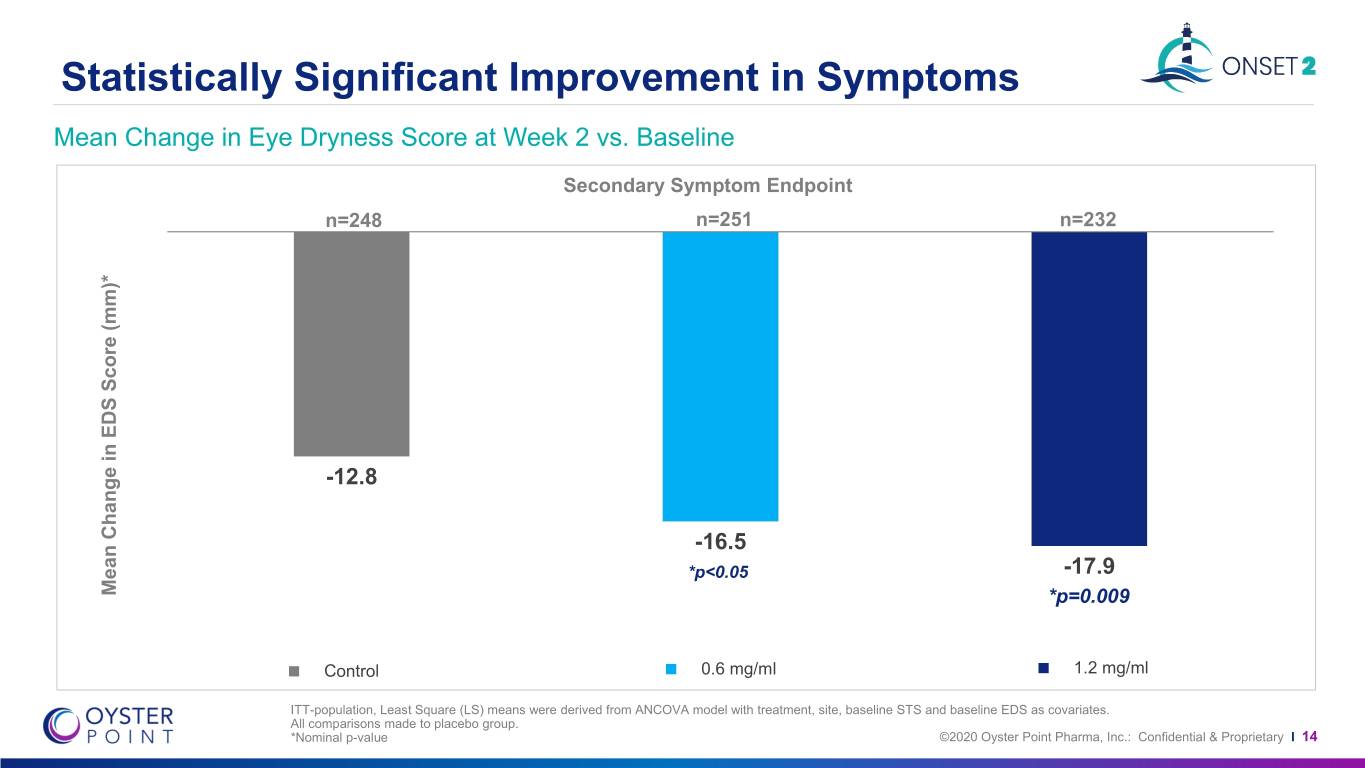
Statistically Significant Improvement in Symptoms Mean Change in Eye Dryness Score at Week 2 vs. Baseline Secondary Symptom Endpoint n=248 n=251 n=232 -12.8 -16.5 *p<0.05 -17.9 Mean Change in Change EDS Mean Score (mm)* P<0.001 *p=0.009 Control 0.6 mg/ml 1.2 mg/ml ITT-population, Least Square (LS) means were derived from ANCOVA model with treatment, site, baseline STS and baseline EDS as covariates. All comparisons made to placebo group. *Nominal p-value ©2020 Oyster Point Pharma, Inc.: Confidential & Proprietary I 14
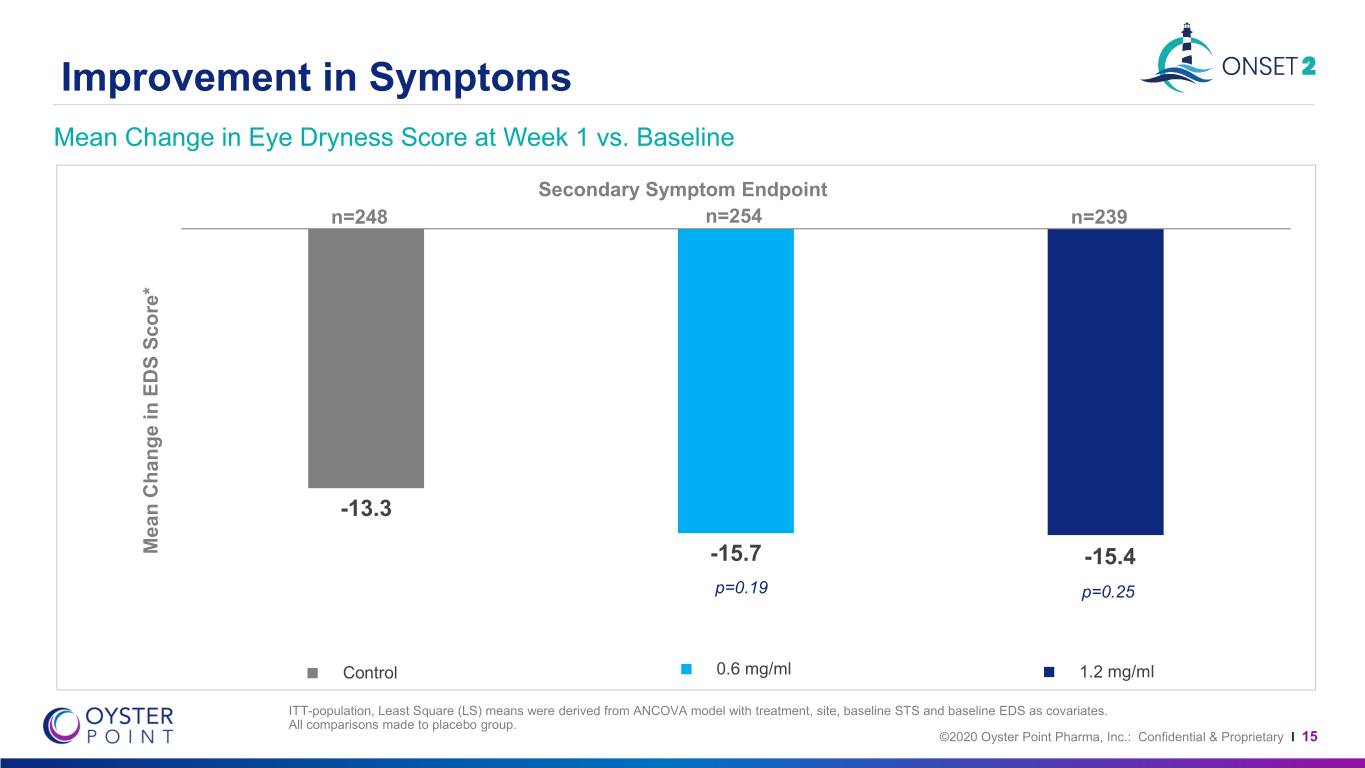
Improvement in Symptoms Mean Change in Eye Dryness Score at Week 1 vs. Baseline Secondary Symptom Endpoint n=248 n=254 n=239 -13.3 Mean Change in EDS Score* -15.7 P<0.001 -15.4 p=0.19 p=0.25 Control 0.6 mg/ml 1.2 mg/ml ITT-population, Least Square (LS) means were derived from ANCOVA model with treatment, site, baseline STS and baseline EDS as covariates. All comparisons made to placebo group. ©2020 Oyster Point Pharma, Inc.: Confidential & Proprietary I 15
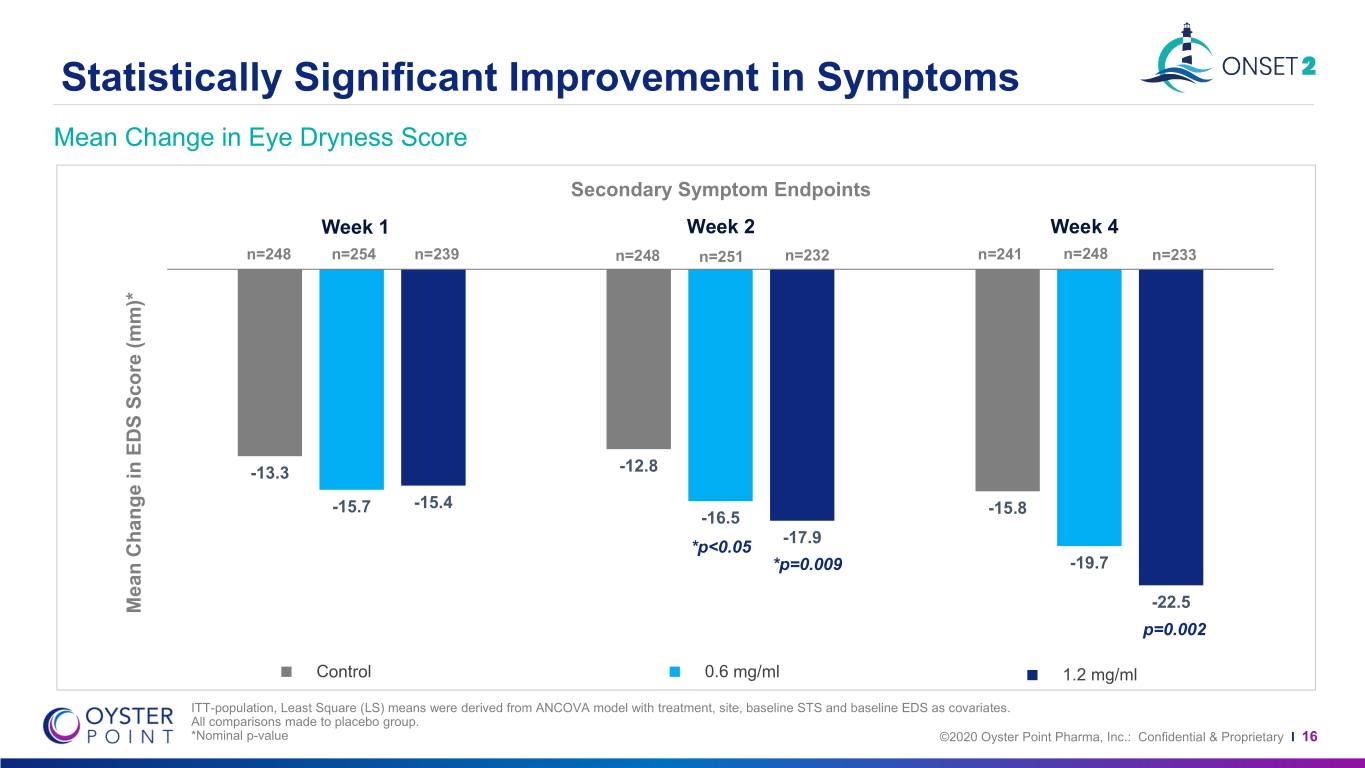
Statistically Significant Improvement in Symptoms Mean Change in Eye Dryness Score Secondary Symptom Endpoints Week 1 Week 2 Week 4 n=248 n=254 n=239 n=248 n=251 n=232 n=241 n=248 n=233 -13.3 -12.8 -15.7 -15.4 -15.8 -16.5 -17.9 *p<0.05 *p=0.009 -19.7 P<0.001 Mean Change in Change EDS Mean Score (mm)* -22.5 p=0.002 Control 0.6 mg/ml 1.2 mg/ml ITT-population, Least Square (LS) means were derived from ANCOVA model with treatment, site, baseline STS and baseline EDS as covariates. All comparisons made to placebo group. *Nominal p-value ©2020 Oyster Point Pharma, Inc.: Confidential & Proprietary I 16
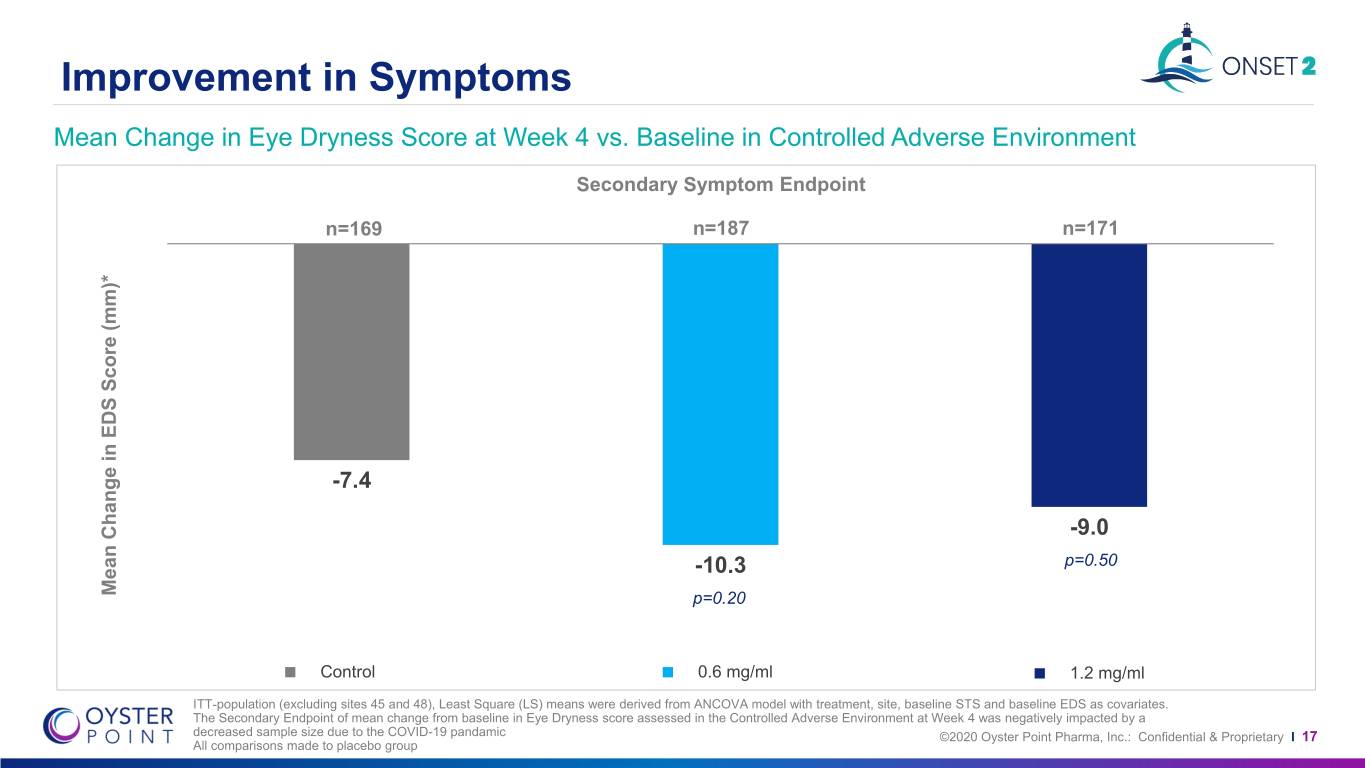
Improvement in Symptoms Mean Change in Eye Dryness Score at Week 4 vs. Baseline in Controlled Adverse Environment Secondary Symptom Endpoint n=169 n=187 n=171 -7.4 -9.0 -10.3 p=0.50 Mean Change in Change EDS Mean Score (mm)* P<0.001p=0.20 P=0.001 Control 0.6 mg/ml 1.2 mg/ml ITT-population (excluding sites 45 and 48), Least Square (LS) means were derived from ANCOVA model with treatment, site, baseline STS and baseline EDS as covariates. The Secondary Endpoint of mean change from baseline in Eye Dryness score assessed in the Controlled Adverse Environment at Week 4 was negatively impacted by a decreased sample size due to the COVID-19 pandamic ©2020 Oyster Point Pharma, Inc.: Confidential & Proprietary I 17 All comparisons made to placebo group
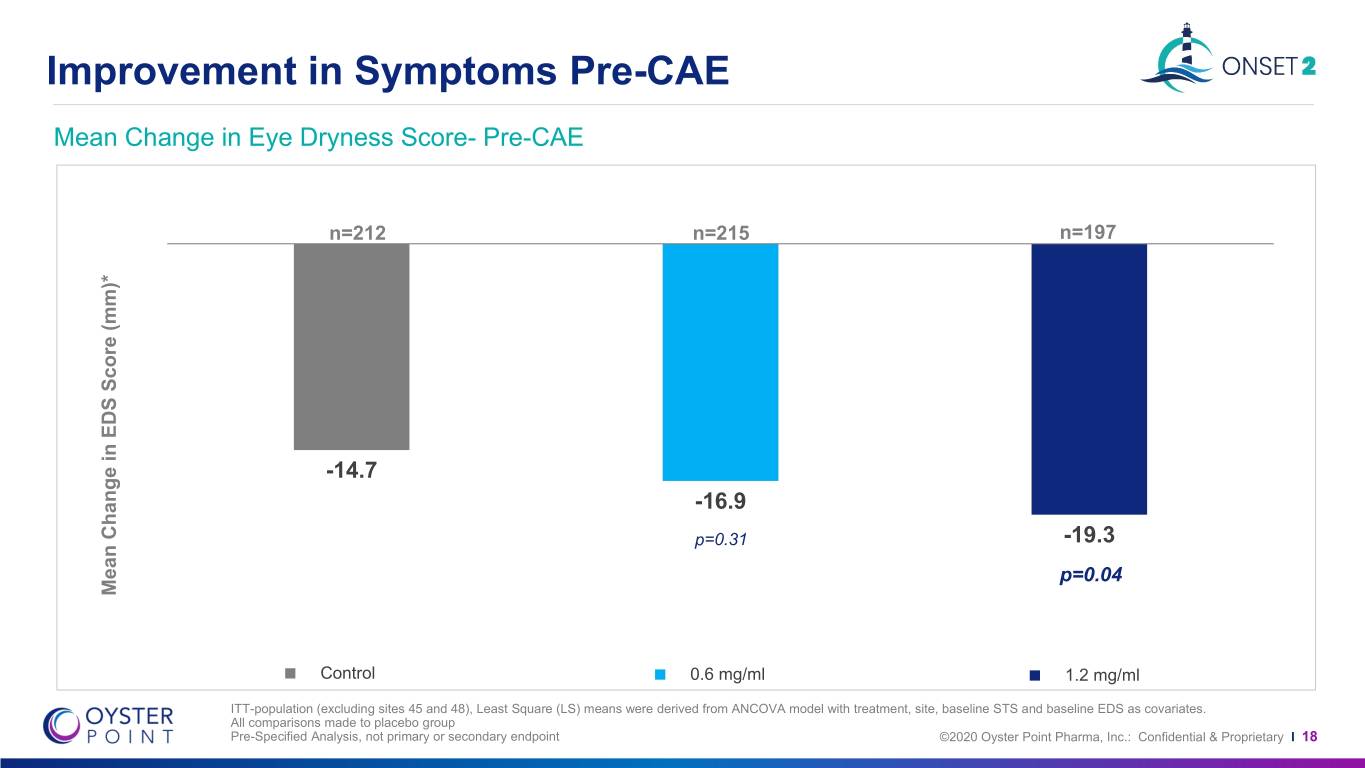
Improvement in Symptoms Pre-CAE Mean Change in Eye Dryness Score- Pre-CAE n=212 n=215 n=197 -14.7 -16.9 p=0.31 -19.3 p=0.04 Mean Change in Change EDS Mean Score (mm)* P<0.001 P=0.001 Control 0.6 mg/ml 1.2 mg/ml ITT-population (excluding sites 45 and 48), Least Square (LS) means were derived from ANCOVA model with treatment, site, baseline STS and baseline EDS as covariates. All comparisons made to placebo group Pre-Specified Analysis, not primary or secondary endpoint ©2020 Oyster Point Pharma, Inc.: Confidential & Proprietary I 18
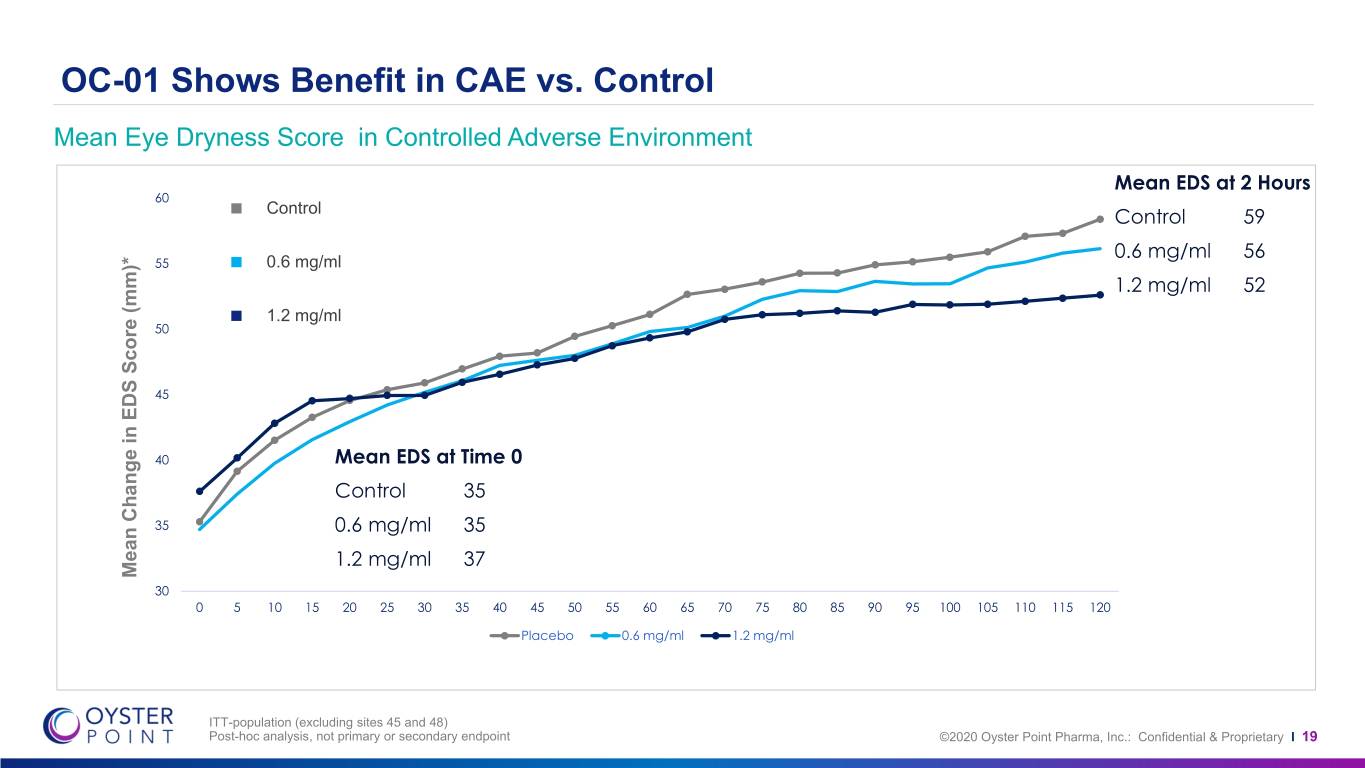
OC-01 Shows Benefit in CAE vs. Control Mean Eye Dryness Score in Controlled Adverse Environment Mean EDS at 2 Hours 60 Control Control 59 0.6 mg/ml 56 55 0.6 mg/ml 1.2 mg/ml 52 1.2 mg/ml 50 45 40 Mean EDS at Time 0 Control 35 35 0.6 mg/ml 35 1.2 mg/ml 37 Mean Change in Change EDS Mean Score (mm)* 30 0 5 10 15 20 25 30 35 40 45 50 55 60 65 70 75 80 85 90 95 100 105 110 115 120 Placebo 0.6 mg/ml 1.2 mg/ml ITT-population (excluding sites 45 and 48) Post-hoc analysis, not primary or secondary endpoint ©2020 Oyster Point Pharma, Inc.: Confidential & Proprietary I 19
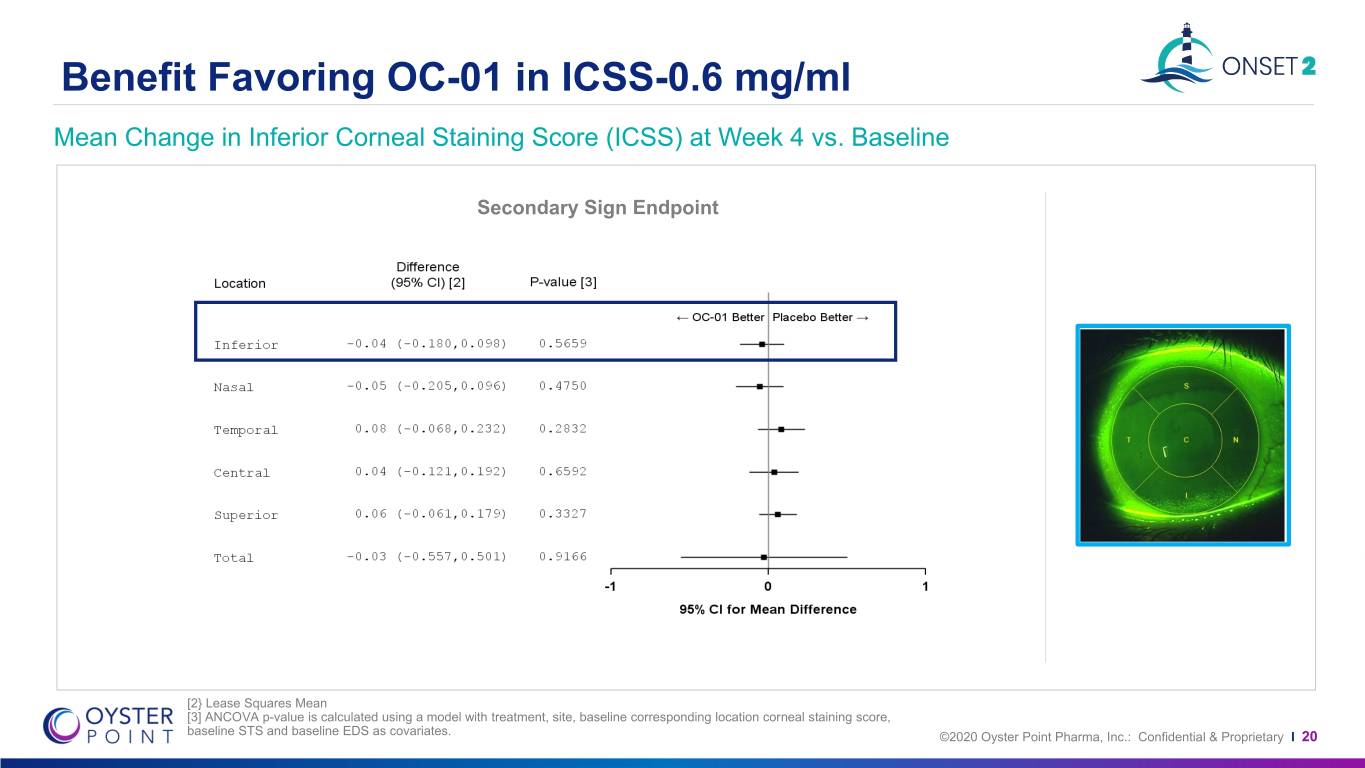
Benefit Favoring OC-01 in ICSS-0.6 mg/ml Mean Change in Inferior Corneal Staining Score (ICSS) at Week 4 vs. Baseline Secondary Sign Endpoint [2} Lease Squares Mean [3] ANCOVA p-value is calculated using a model with treatment, site, baseline corresponding location corneal staining score, baseline STS and baseline EDS as covariates. ©2020 Oyster Point Pharma, Inc.: Confidential & Proprietary I 20
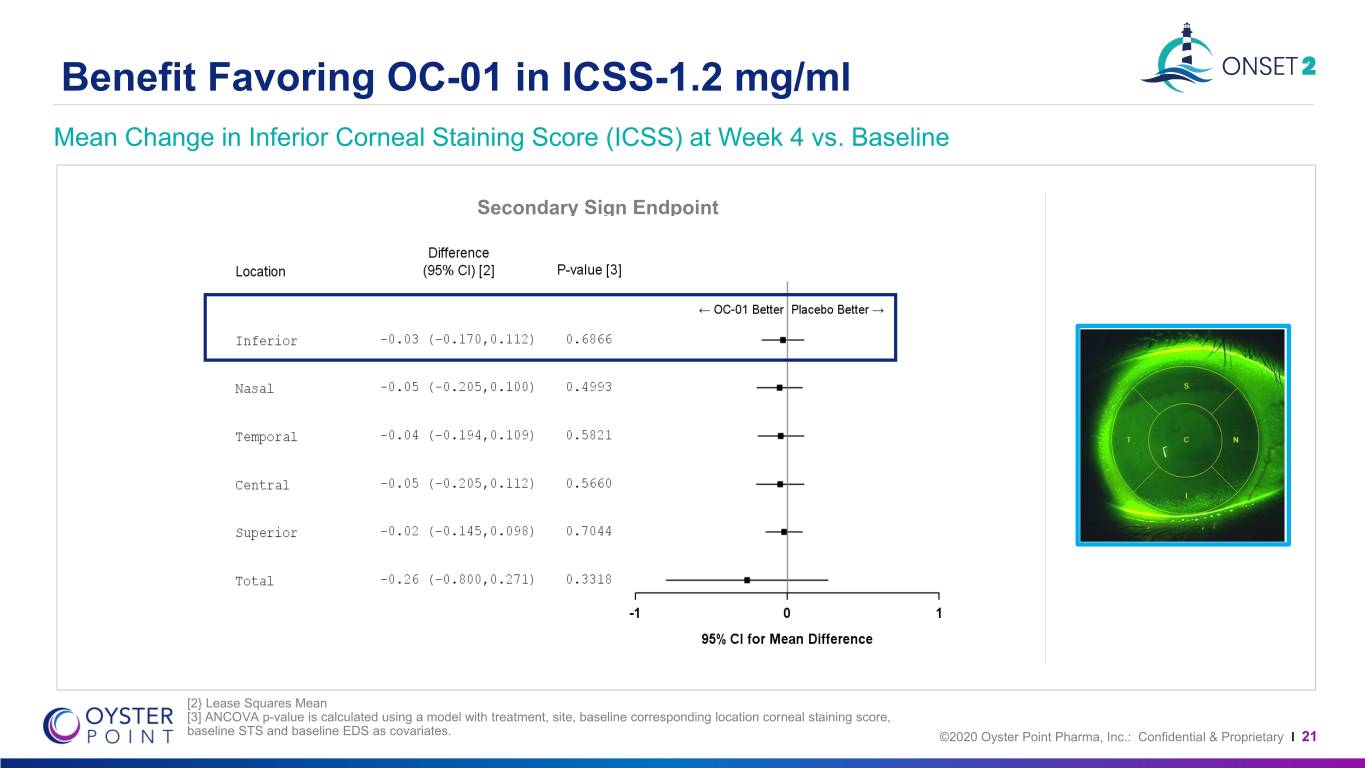
Benefit Favoring OC-01 in ICSS-1.2 mg/ml Mean Change in Inferior Corneal Staining Score (ICSS) at Week 4 vs. Baseline Secondary Sign Endpoint [2} Lease Squares Mean [3] ANCOVA p-value is calculated using a model with treatment, site, baseline corresponding location corneal staining score, baseline STS and baseline EDS as covariates. ©2020 Oyster Point Pharma, Inc.: Confidential & Proprietary I 21
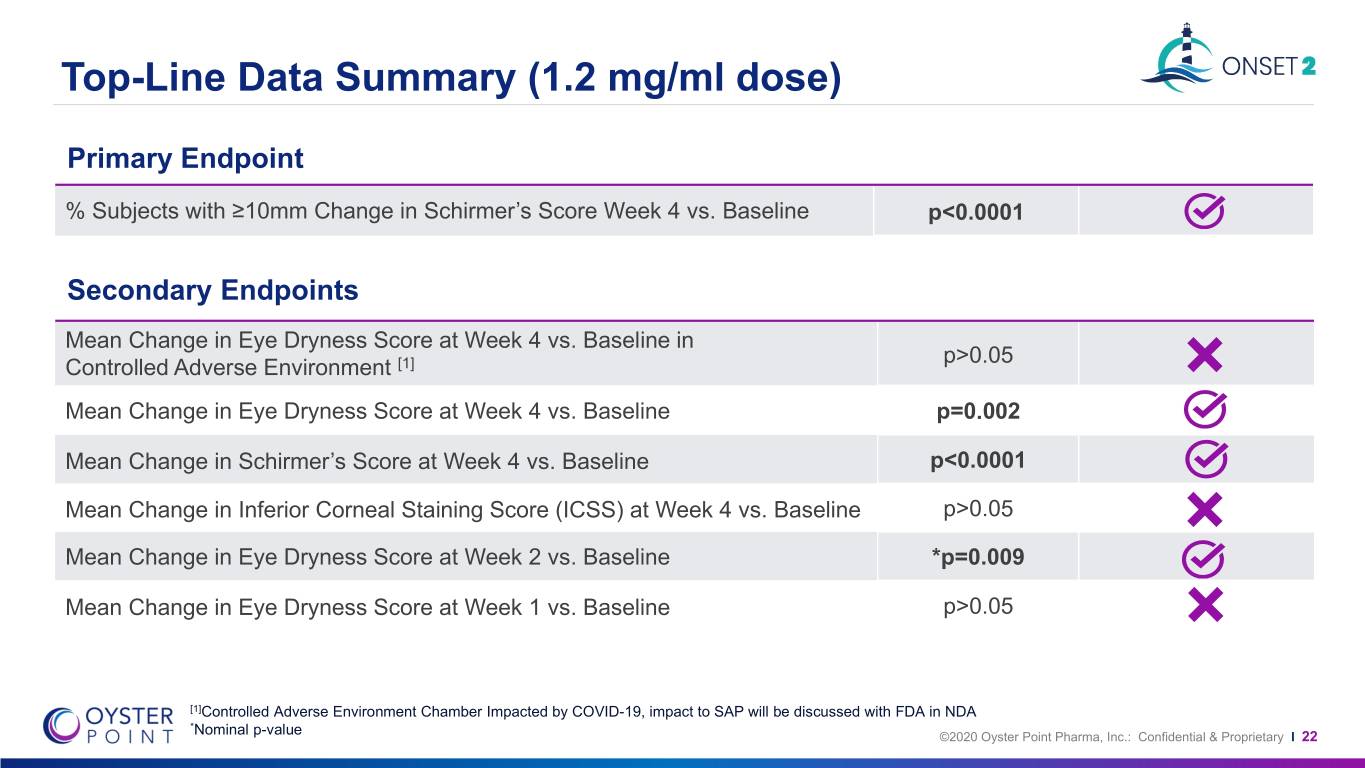
Top-Line Data Summary (1.2 mg/ml dose) Primary Endpoint % Subjects with ≥10mm Change in Schirmer’s Score Week 4 vs. Baseline p<0.0001 Secondary Endpoints Mean Change in Eye Dryness Score at Week 4 vs. Baseline in p>0.05 Controlled Adverse Environment [1] Mean Change in Eye Dryness Score at Week 4 vs. Baseline p=0.002 Mean Change in Schirmer’s Score at Week 4 vs. Baseline p<0.0001 Mean Change in Inferior Corneal Staining Score (ICSS) at Week 4 vs. Baseline p>0.05 Mean Change in Eye Dryness Score at Week 2 vs. Baseline *p=0.009 Mean Change in Eye Dryness Score at Week 1 vs. Baseline p>0.05 [1]Controlled Adverse Environment Chamber Impacted by COVID-19, impact to SAP will be discussed with FDA in NDA *Nominal p-value ©2020 Oyster Point Pharma, Inc.: Confidential & Proprietary I 22
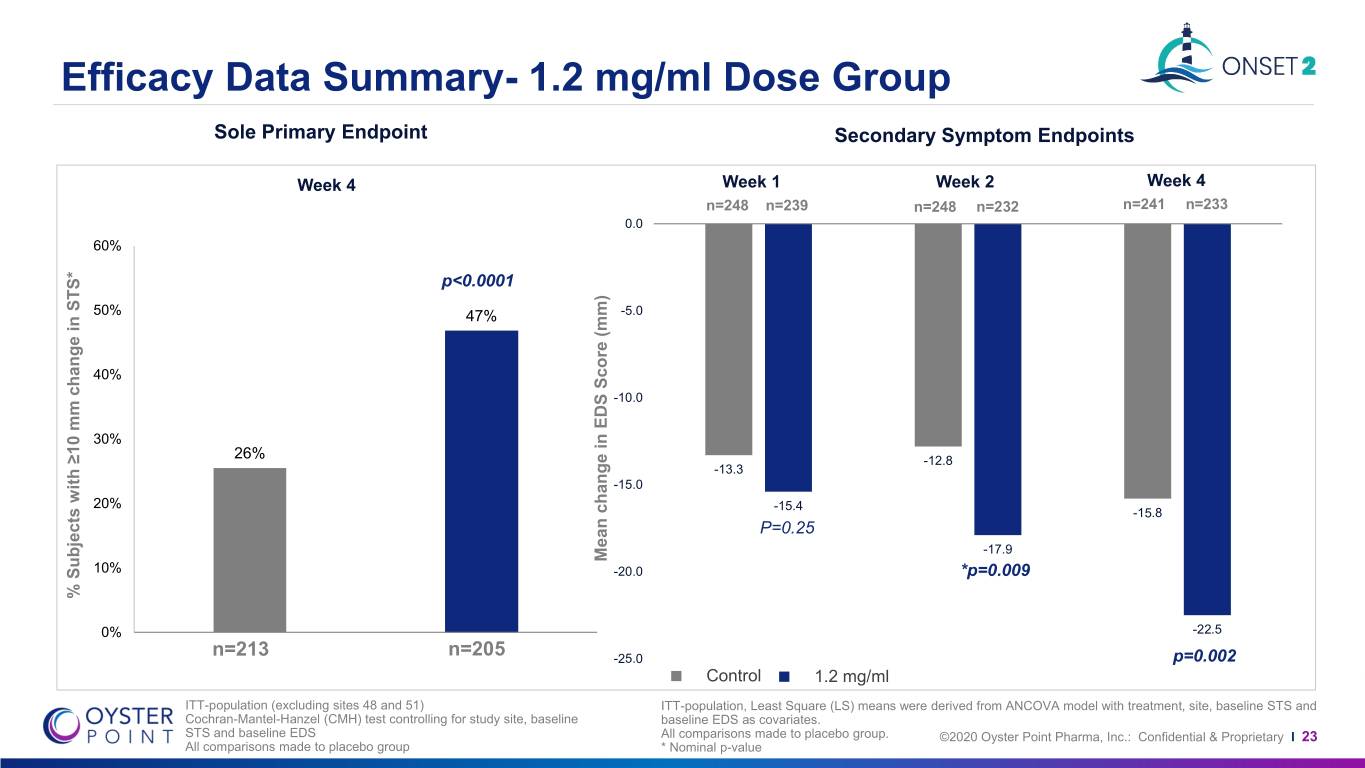
Efficacy Data Summary- 1.2 mg/ml Dose Group Sole Primary Endpoint Secondary Symptom Endpoints Week 4 Week 1 Week 2 Week 4 n=248 n=239 n=248 n=232 n=241 n=233 0.0 60% p<0.0001 50% 47% -5.0 40% -10.0 30% 26% -12.8 -13.3 -15.0 20% -15.4 -15.8 P=0.25 -17.9 Mean change in EDS Score (mm) change inScore Mean EDS 10% -20.0 *p=0.009 % % Subjects with≥10 change mm in STS* 0% -22.5 n=213 n=205 -25.0 p=0.002 Control 1.2 mg/ml ITT-population (excluding sites 48 and 51) ITT-population, Least Square (LS) means were derived from ANCOVA model with treatment, site, baseline STS and Cochran-Mantel-Hanzel (CMH) test controlling for study site, baseline baseline EDS as covariates. STS and baseline EDS All comparisons made to placebo group. ©2020 Oyster Point Pharma, Inc.: Confidential & Proprietary I 23 All comparisons made to placebo group * Nominal p-value
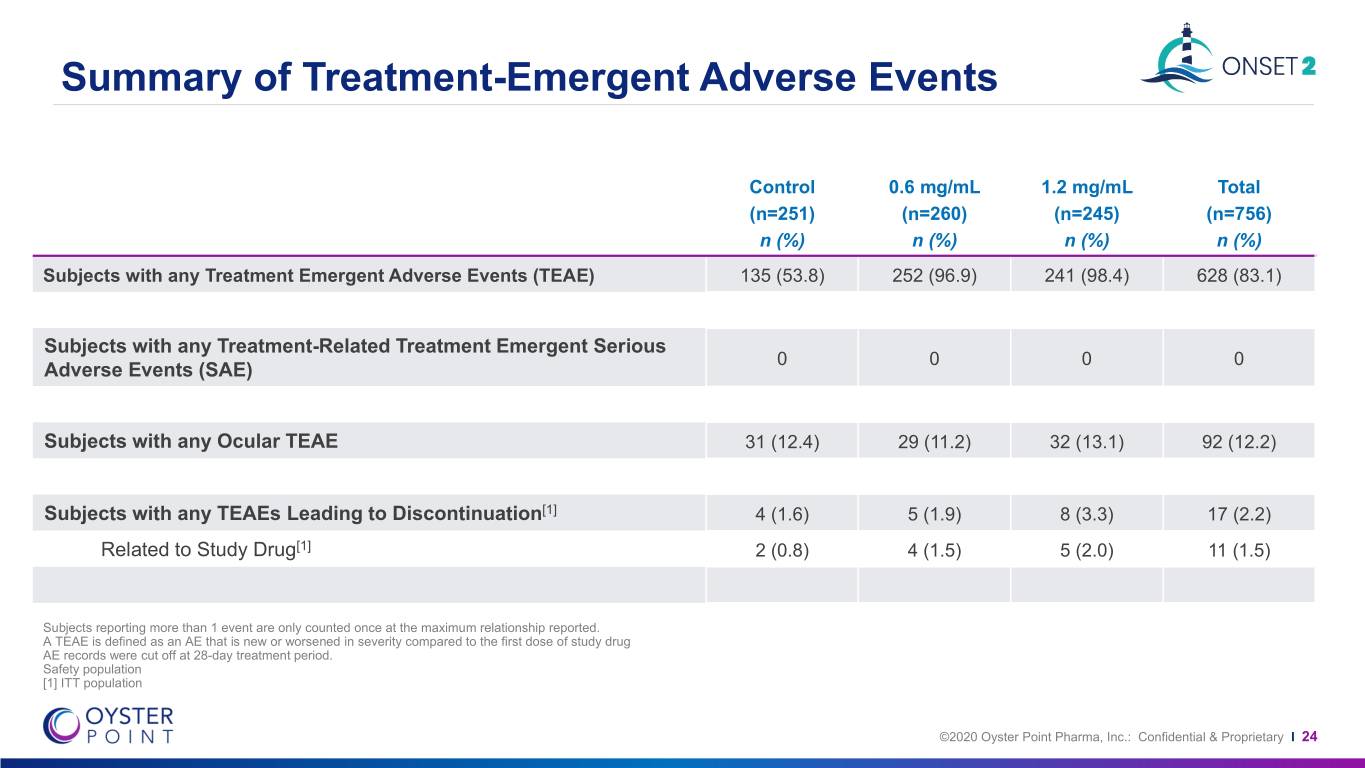
Summary of Treatment-Emergent Adverse Events Control 0.6 mg/mL 1.2 mg/mL Total (n=251) (n=260) (n=245) (n=756) n (%) n (%) n (%) n (%) Subjects with any Treatment Emergent Adverse Events (TEAE) 135 (53.8) 252 (96.9) 241 (98.4) 628 (83.1) Subjects with any Treatment-Related Treatment Emergent Serious 0 0 0 0 Adverse Events (SAE) Subjects with any Ocular TEAE 31 (12.4) 29 (11.2) 32 (13.1) 92 (12.2) Subjects with any TEAEs Leading to Discontinuation[1] 4 (1.6) 5 (1.9) 8 (3.3) 17 (2.2) Related to Study Drug[1] 2 (0.8) 4 (1.5) 5 (2.0) 11 (1.5) Subjects reporting more than 1 event are only counted once at the maximum relationship reported. A TEAE is defined as an AE that is new or worsened in severity compared to the first dose of study drug AE records were cut off at 28-day treatment period. Safety population [1] ITT population ©2020 Oyster Point Pharma, Inc.: Confidential & Proprietary I 24
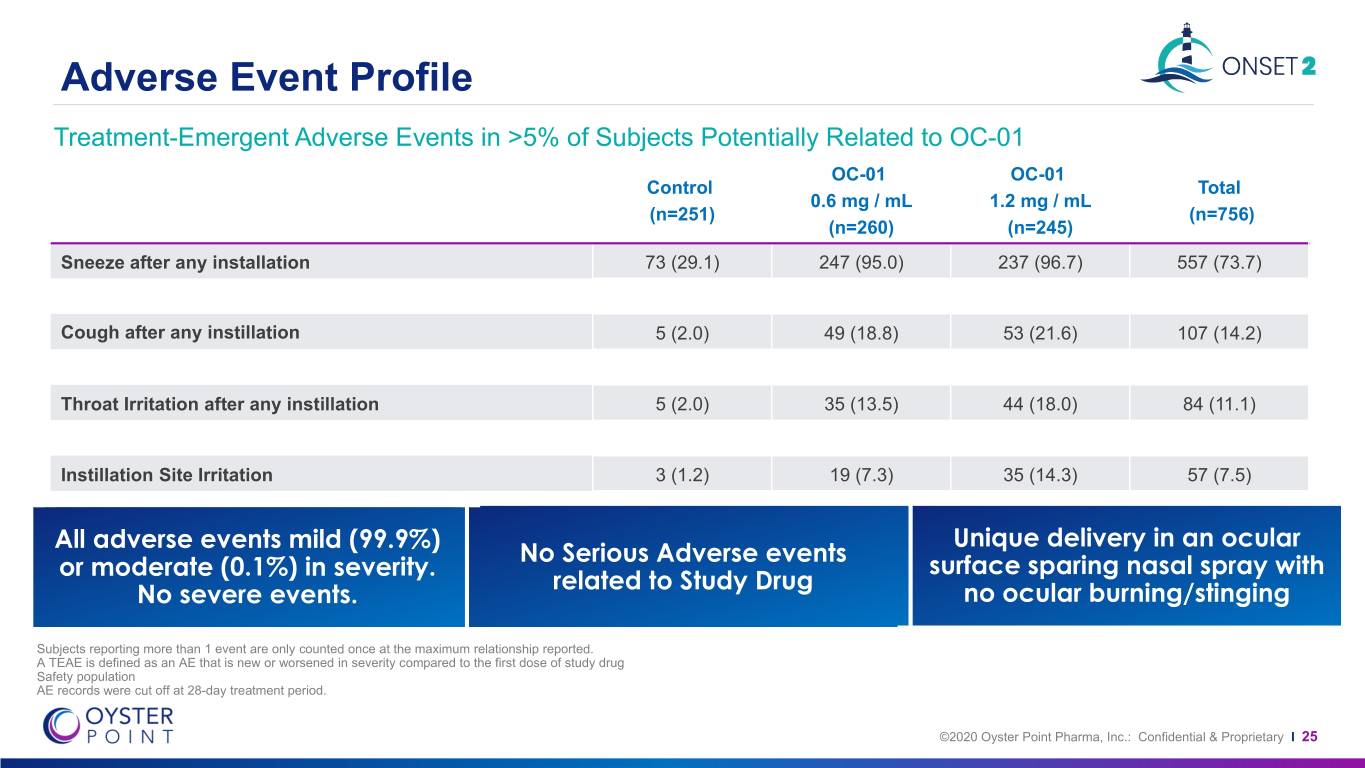
Adverse Event Profile Treatment-Emergent Adverse Events in >5% of Subjects Potentially Related to OC-01 OC-01 OC-01 Control Total 0.6 mg / mL 1.2 mg / mL (n=251) (n=756) (n=260) (n=245) Sneeze after any installation 73 (29.1) 247 (95.0) 237 (96.7) 557 (73.7) Cough after any instillation 5 (2.0) 49 (18.8) 53 (21.6) 107 (14.2) Throat Irritation after any instillation 5 (2.0) 35 (13.5) 44 (18.0) 84 (11.1) Instillation Site Irritation 3 (1.2) 19 (7.3) 35 (14.3) 57 (7.5) All adverseAllAll events events events mild mild (99.9%) mild(99.9%) (99.9%) or or Unique delivery in an ocular Unique delivery in an ocular No Serious Adverse events ormoderate moderatemoderate (0.1%) (0.1%)(0.1%) in inin severity. severity.severity. surface sparing nasal spray with surface sparing nasal spray with related to Study Drug NoNoNo severesevere severe events.events. events. no ocular burning/stinging no ocular burning/stinging Subjects reporting more than 1 event are only counted once at the maximum relationship reported. A TEAE is defined as an AE that is new or worsened in severity compared to the first dose of study drug Safety population AE records were cut off at 28-day treatment period. ©2020 Oyster Point Pharma, Inc.: Confidential & Proprietary I 25
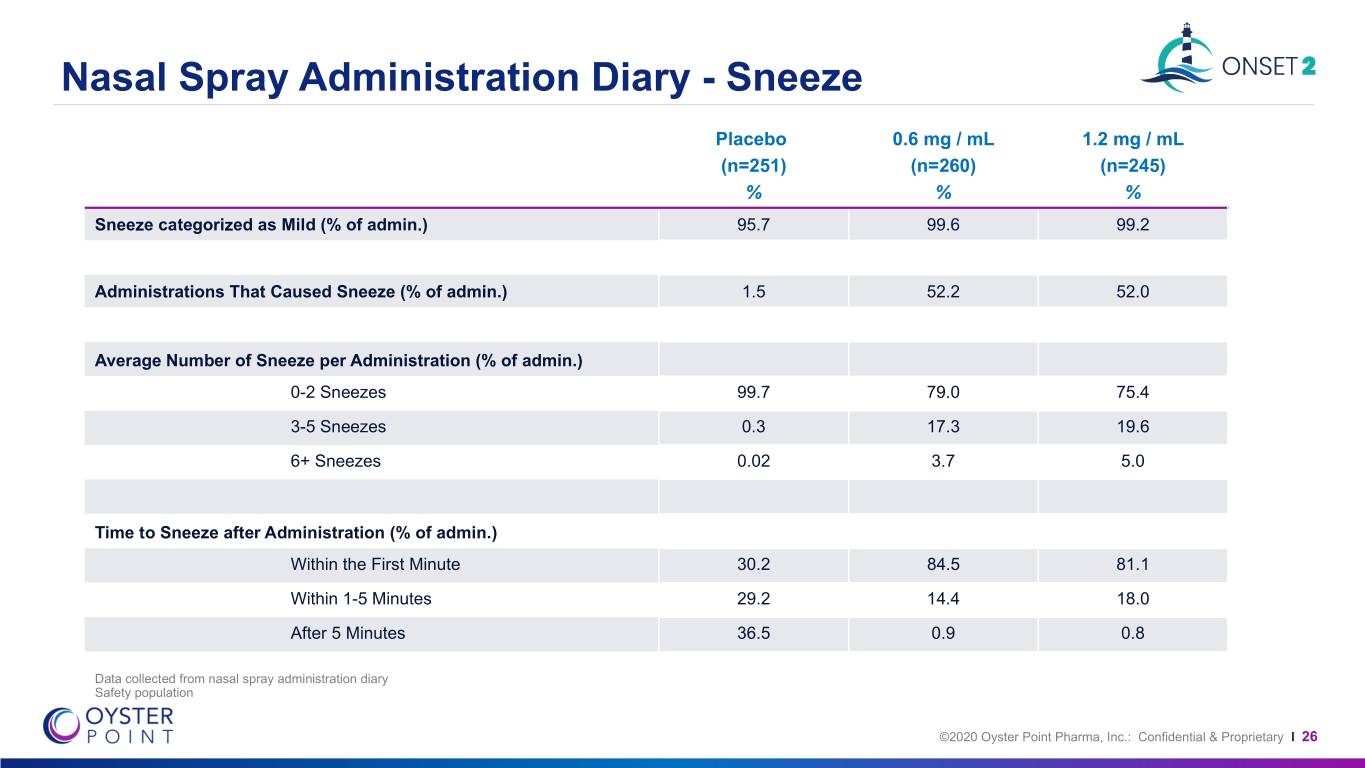
Nasal Spray Administration Diary - Sneeze Placebo 0.6 mg / mL 1.2 mg / mL (n=251) (n=260) (n=245) % % % Sneeze categorized as Mild (% of admin.) 95.7 99.6 99.2 Administrations That Caused Sneeze (% of admin.) 1.5 52.2 52.0 Average Number of Sneeze per Administration (% of admin.) 0-2 Sneezes 99.7 79.0 75.4 3-5 Sneezes 0.3 17.3 19.6 6+ Sneezes 0.02 3.7 5.0 Time to Sneeze after Administration (% of admin.) Within the First Minute 30.2 84.5 81.1 Within 1-5 Minutes 29.2 14.4 18.0 After 5 Minutes 36.5 0.9 0.8 Data collected from nasal spray administration diary Safety population ©2020 Oyster Point Pharma, Inc.: Confidential & Proprietary I 26
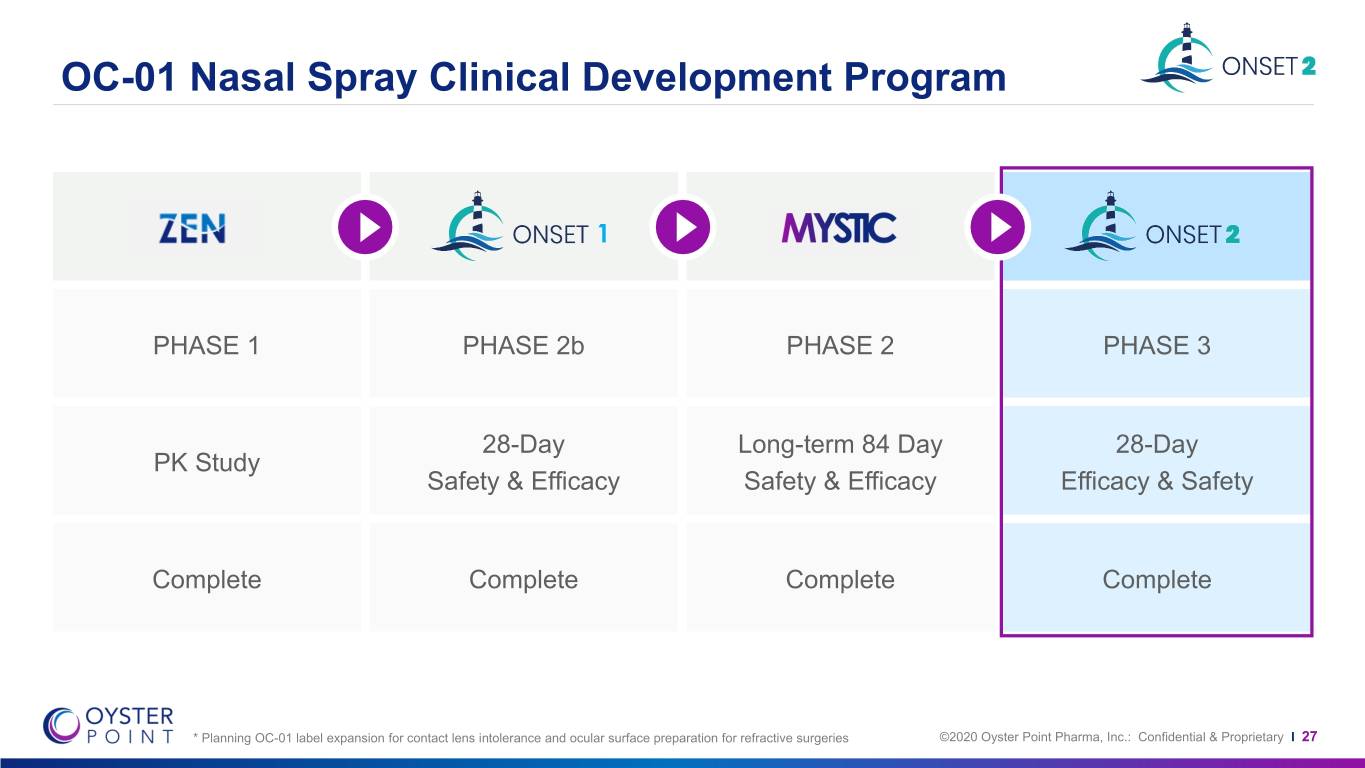
OC-01 Nasal Spray Clinical Development Program 1 PHASE 1 PHASE 2b PHASE 2 PHASE 3 28-Day Long-term 84 Day 28-Day PK Study Safety & Efficacy Safety & Efficacy Efficacy & Safety Complete Complete Complete Complete * Planning OC-01 label expansion for contact lens intolerance and ocular surface preparation for refractive surgeries ©2020 Oyster Point Pharma, Inc.: Confidential & Proprietary I 27
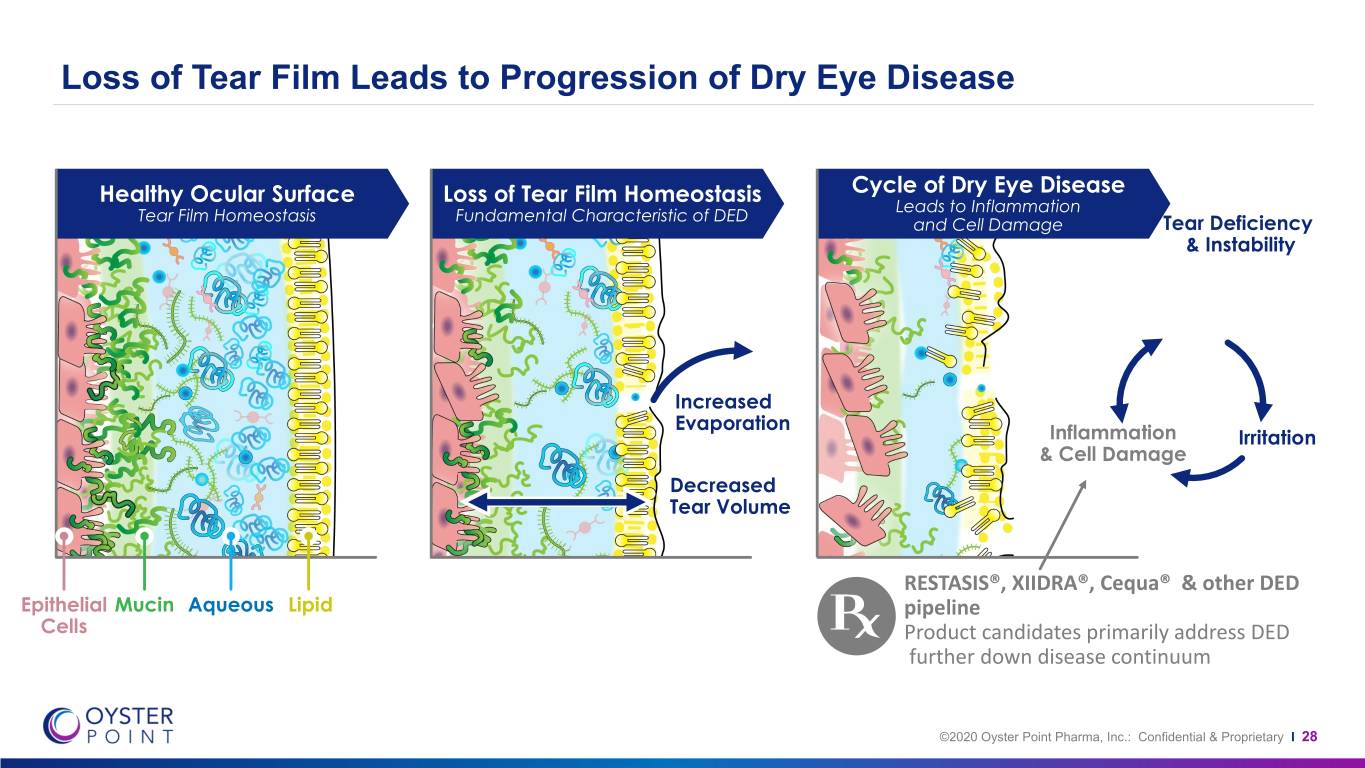
Loss of Tear Film Leads to Progression of Dry Eye Disease Healthy Ocular Surface Loss of Tear Film Homeostasis Cycle of Dry Eye Disease Leads to Inflammation Tear Film Homeostasis Fundamental Characteristic of DED and Cell Damage Tear Deficiency & Instability Increased Evaporation Inflammation Irritation & Cell Damage Decreased Tear Volume RESTASIS®, XIIDRA®, Cequa® & other DED Epithelial Mucin Aqueous Lipid pipeline Cells Product candidates primarily address DED further down disease continuum ©2020 Oyster Point Pharma, Inc.: Confidential & Proprietary I 28
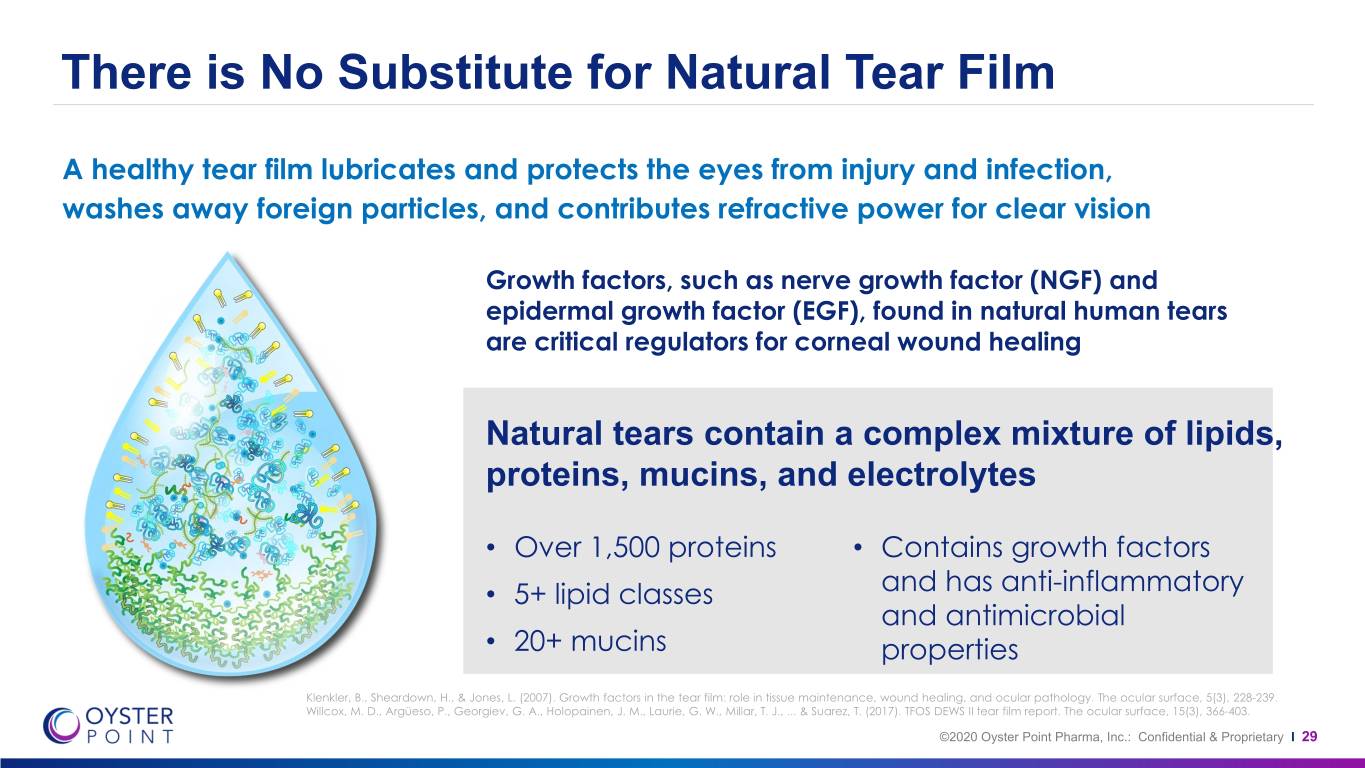
There is No Substitute for Natural Tear Film A healthy tear film lubricates and protects the eyes from injury and infection, washes away foreign particles, and contributes refractive power for clear vision Growth factors, such as nerve growth factor (NGF) and epidermal growth factor (EGF), found in natural human tears are critical regulators for corneal wound healing Natural tears contain a complex mixture of lipids, proteins, mucins, and electrolytes • Over 1,500 proteins • Contains growth factors • 5+ lipid classes and has anti-inflammatory and antimicrobial • 20+ mucins properties Klenkler, B., Sheardown, H., & Jones, L. (2007). Growth factors in the tear film: role in tissue maintenance, wound healing, and ocular pathology. The ocular surface, 5(3), 228-239. Willcox, M. D., Argüeso, P., Georgiev, G. A., Holopainen, J. M., Laurie, G. W., Millar, T. J., ... & Suarez, T. (2017). TFOS DEWS II tear film report. The ocular surface, 15(3), 366-403. ©2020 Oyster Point Pharma, Inc.: Confidential & Proprietary I 29
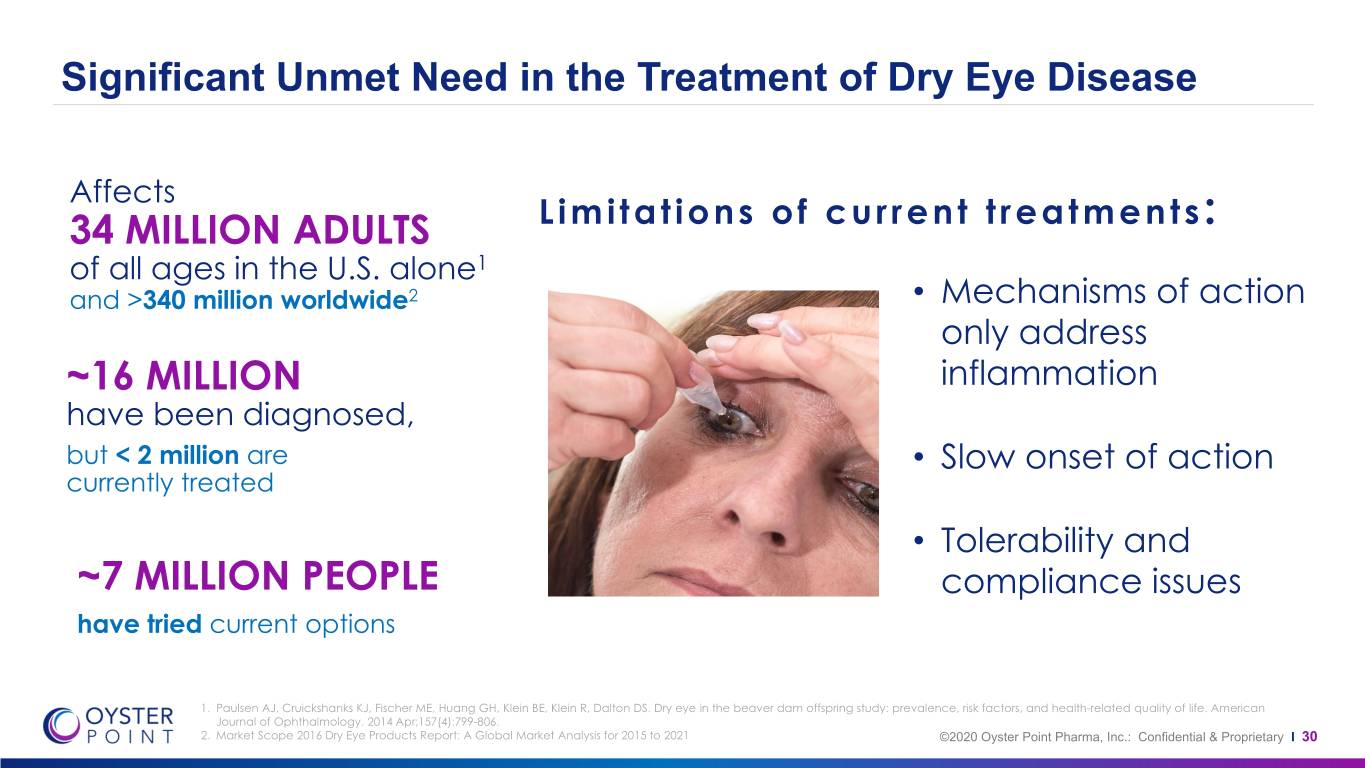
Significant Unmet Need in the Treatment of Dry Eye Disease Affects 34 MILLION ADULTS Limitations of current treatments: of all ages in the U.S. alone1 and >340 million worldwide2 • Mechanisms of action only address ~16 MILLION inflammation have been diagnosed, but < 2 million are • Slow onset of action currently treated • Tolerability and ~7 MILLION PEOPLE compliance issues have tried current options 1. Paulsen AJ, Cruickshanks KJ, Fischer ME, Huang GH, Klein BE, Klein R, Dalton DS. Dry eye in the beaver dam offspring study: prevalence, risk factors, and health-related quality of life. American Journal of Ophthalmology. 2014 Apr;157(4):799-806. 2. Market Scope 2016 Dry Eye Products Report: A Global Market Analysis for 2015 to 2021 ©2020 Oyster Point Pharma, Inc.: Confidential & Proprietary I 30
Commercialization of OC-01 Nasal Spray If approved, planning 1st launch in the US in Q4 2021. Key commercialization strategies include: Specialty sales Extensive education and Enable patient force marketing campaigns access to OC-01 Competitively sized specialty Broad ECP education and Strategic contracting for broad payer sales force of 150 to 200 marketing with focused direct-to- coverage, comprehensive pharmacy representatives targeting high consumer campaigns leveraging distribution, and patient support prescribing Eye Care novel MOA & nasal spray services Professionals (ECPs) Specialty sales force could also support the We will consider potential partnerships for international commercialization of additional ocular therapies commercialization ©2020 Oyster Point Pharma, Inc.: Confidential & Proprietary I 31
OC-01 Nasal Spray Profile: Preservative-free nasal spray with 50 uL spray delivered twice daily to each nostril Novel mechanism of action to restore tear film homeostasis with natural tear production Rapid onset of action observed in clinical trials to significantly improve signs and symptoms Improvement in tear production demonstrated in the majority of a broad population of patients Favorable tolerability - no ocular burning/stinging. Most common side effect was transient sneezing.
NASDAQ: OYST
