Attached files
| file | filename |
|---|---|
| 8-K - 8-K - Garrison Capital Inc. | gars-8k_20200511.htm |

Garrison Capital Inc. First Quarter 2020 Earnings Presentation Exhibit 99.1
DISCLAIMER Some of the statements in this presentation constitute forward-looking statements, which relate to future events or our future performance or financial condition. The forward-looking statements contained in this presentation involve risks and uncertainties, including statements as to: our future operating results; changes in political, economic or industry conditions, the interest rate environment or conditions affecting the financial and capital markets, which could result in changes to the value of our assets; our business prospects and the prospects of our current and prospective portfolio companies; the impact of investments that we may make; the impact of increased competition; our contractual arrangements and relationships with third parties; the dependence of our business on the general economy, including general economic trends, and its impact on the industries in which we invest; the ability of our prospective portfolio companies to achieve their objectives; the relative and absolute performance of our investment adviser, including in identifying suitable investments for us; any future financings and investments; the adequacy of our cash resources and working capital; our ability to make distributions to our stockholders; our ability to complete a strategic transaction on a timely basis, or at all; the effects of legislation and regulations and changes thereto; the timing of cash flows, if any, from the operations of our prospective portfolio companies; the impact of future acquisitions and divestitures; and the impact of COVID-19 on the economy and capital markets and on the operations of us and our portfolio companies. We use words such as “anticipates,” “believes,” “expects,” “intends” and similar expressions to identify forward-looking statements. Actual results could differ materially from those anticipated in our forward-looking statements for any reason, and future results could differ materially from historical performance. We have based the forward-looking statements included in this presentation on information available to us on the date of this presentation, and we assume no obligation to update any such forward-looking statements. Although we undertake no obligation to revise or update any forward-looking statements, whether as a result of new information, future events or otherwise, you are advised to consult any additional disclosures that we may make directly to you or through reports that we have filed or in the future may file with the U.S. Securities and Exchange Commission, including annual reports on Form 10-K, quarterly reports on Form 10-Q and current reports on Form 8-K.
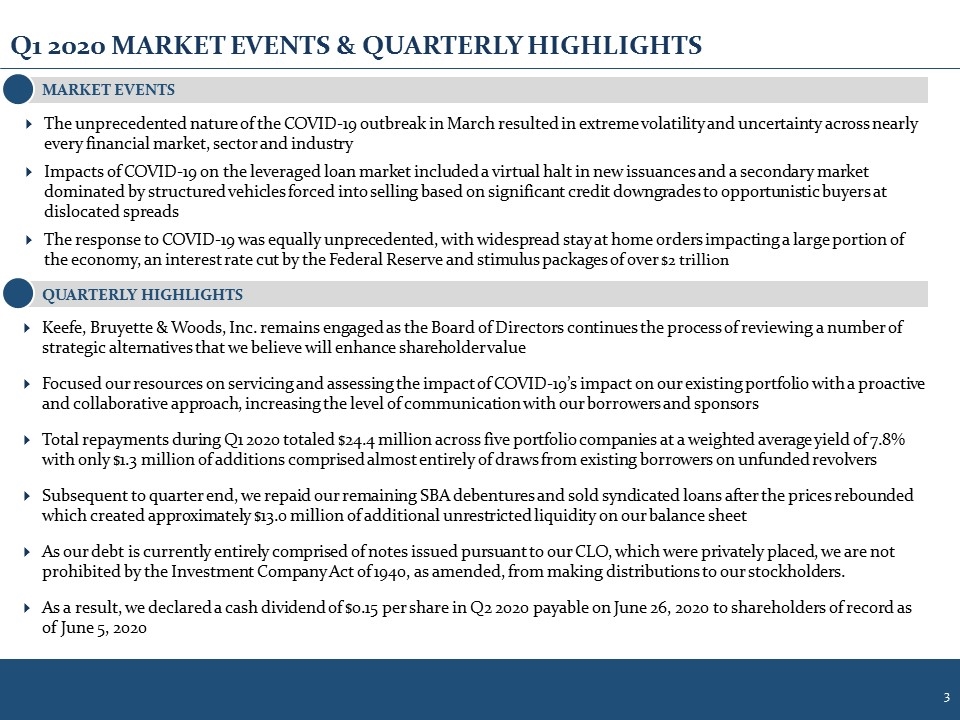
Q1 2020 MARKET EVENTS & QUARTERLY HIGHLIGHTS MARKET EVENTS The unprecedented nature of the COVID-19 outbreak in March resulted in extreme volatility and uncertainty across nearly every financial market, sector and industry Impacts of COVID-19 on the leveraged loan market included a virtual halt in new issuances and a secondary market dominated by structured vehicles forced into selling based on significant credit downgrades to opportunistic buyers at dislocated spreads The response to COVID-19 was equally unprecedented, with widespread stay at home orders impacting a large portion of the economy, an interest rate cut by the Federal Reserve and stimulus packages of over $2 trillion Keefe, Bruyette & Woods, Inc. remains engaged as the Board of Directors continues the process of reviewing a number of strategic alternatives that we believe will enhance shareholder value Focused our resources on servicing and assessing the impact of COVID-19’s impact on our existing portfolio with a proactive and collaborative approach, increasing the level of communication with our borrowers and sponsors Total repayments during Q1 2020 totaled $24.4 million across five portfolio companies at a weighted average yield of 7.8% with only $1.3 million of additions comprised almost entirely of draws from existing borrowers on unfunded revolvers Subsequent to quarter end, we repaid our remaining SBA debentures and sold syndicated loans after the prices rebounded which created approximately $13.0 million of additional unrestricted liquidity on our balance sheet As our debt is currently entirely comprised of notes issued pursuant to our CLO, which were privately placed, we are not prohibited by the Investment Company Act of 1940, as amended, from making distributions to our stockholders. As a result, we declared a cash dividend of $0.15 per share in Q2 2020 payable on June 26, 2020 to shareholders of record as of June 5, 2020 QUARTERLY HIGHLIGHTS
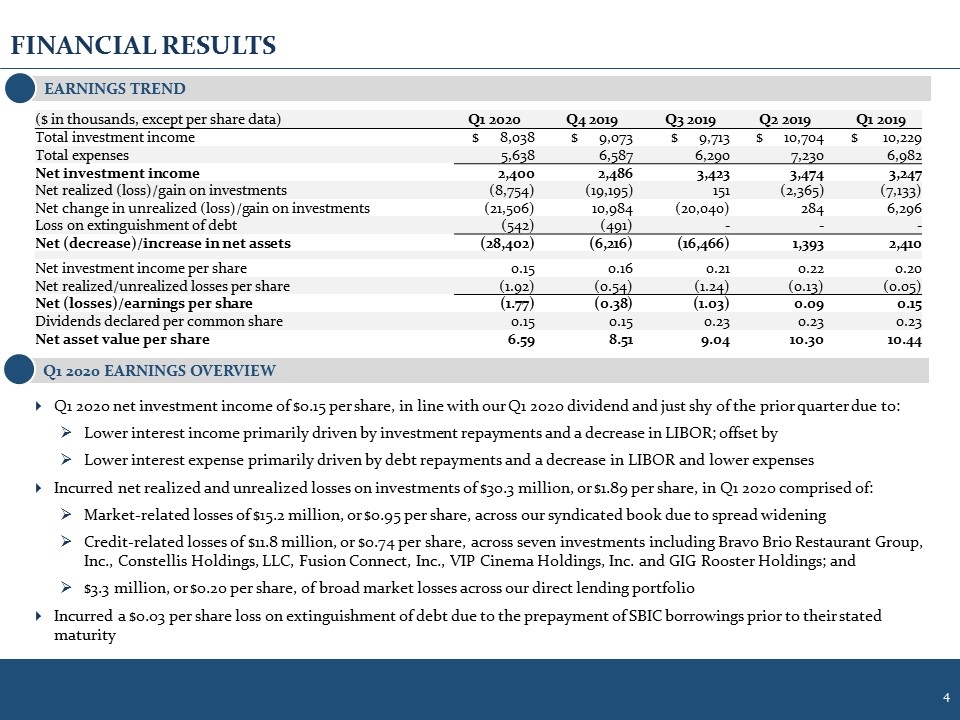
FINANCIAL RESULTS Q1 2020 EARNINGS OVERVIEW Q1 2020 net investment income of $0.15 per share, in line with our Q1 2020 dividend and just shy of the prior quarter due to: Lower interest income primarily driven by investment repayments and a decrease in LIBOR; offset by Lower interest expense primarily driven by debt repayments and a decrease in LIBOR and lower expenses Incurred net realized and unrealized losses on investments of $30.3 million, or $1.89 per share, in Q1 2020 comprised of: Market-related losses of $15.2 million, or $0.95 per share, across our syndicated book due to spread widening Credit-related losses of $11.8 million, or $0.74 per share, across seven investments including Bravo Brio Restaurant Group, Inc., Constellis Holdings, LLC, Fusion Connect, Inc., VIP Cinema Holdings, Inc. and GIG Rooster Holdings; and $3.3 million, or $0.20 per share, of broad market losses across our direct lending portfolio Incurred a $0.03 per share loss on extinguishment of debt due to the prepayment of SBIC borrowings prior to their stated maturity EARNINGS TREND ($ in thousands, except per share data) Q1 2020 Q4 2019 Q3 2019 Q2 2019 Q1 2019 Total investment income $ 8,038 $ 9,073 $ 9,713 $ 10,704 $ 10,229 Total expenses 5,638 6,587 6,290 7,230 6,982 Net investment income 2,400 2,486 3,423 3,474 3,247 Net realized (loss)/gain on investments (8,754) (19,195) 151 (2,365) (7,133) Net change in unrealized (loss)/gain on investments (21,506) 10,984 (20,040) 284 6,296 Loss on extinguishment of debt (542) (491) - - - Net (decrease)/increase in net assets (28,402) (6,216) (16,466) 1,393 2,410 Net investment income per share 0.15 0.16 0.21 0.22 0.20 Net realized/unrealized losses per share (1.92) (0.54) (1.24) (0.13) (0.05) Net (losses)/earnings per share (1.77) (0.38) (1.03) 0.09 0.15 Dividends declared per common share 0.15 0.15 0.23 0.23 0.23 Net asset value per share 6.59 8.51 9.04 10.30 10.44
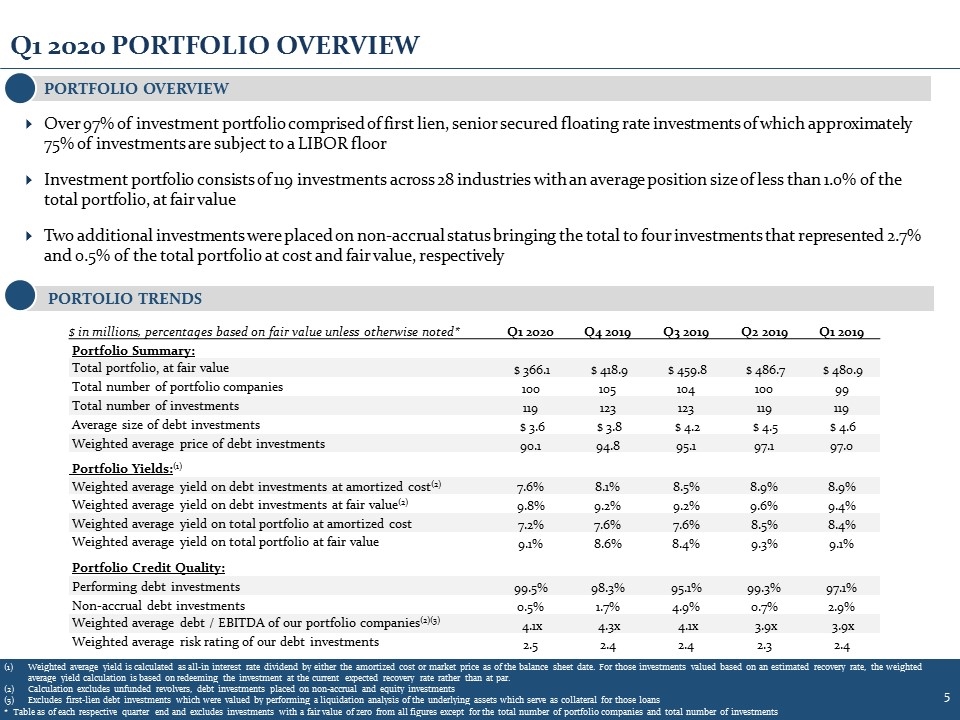
Q1 2020 PORTFOLIO OVERVIEW $ in millions, percentages based on fair value unless otherwise noted* Q1 2020 Q4 2019 Q3 2019 Q2 2019 Q1 2019 Portfolio Summary: Total portfolio, at fair value $ 366.1 $ 418.9 $ 459.8 $ 486.7 $ 480.9 Total number of portfolio companies 100 105 104 100 99 Total number of investments 119 123 123 119 119 Average size of debt investments $ 3.6 $ 3.8 $ 4.2 $ 4.5 $ 4.6 Weighted average price of debt investments 90.1 94.8 95.1 97.1 97.0 Portfolio Yields:(1) Weighted average yield on debt investments at amortized cost(2) 7.6% 8.1% 8.5% 8.9% 8.9% Weighted average yield on debt investments at fair value(2) 9.8% 9.2% 9.2% 9.6% 9.4% Weighted average yield on total portfolio at amortized cost 7.2% 7.6% 7.6% 8.5% 8.4% Weighted average yield on total portfolio at fair value 9.1% 8.6% 8.4% 9.3% 9.1% Portfolio Credit Quality: Performing debt investments 99.5% 98.3% 95.1% 99.3% 97.1% Non-accrual debt investments 0.5% 1.7% 4.9% 0.7% 2.9% Weighted average debt / EBITDA of our portfolio companies(2)(3) 4.1x 4.3x 4.1x 3.9x 3.9x Weighted average risk rating of our debt investments 2.5 2.4 2.4 2.3 2.4 Weighted average yield is calculated as all-in interest rate dividend by either the amortized cost or market price as of the balance sheet date. For those investments valued based on an estimated recovery rate, the weighted average yield calculation is based on redeeming the investment at the current expected recovery rate rather than at par. Calculation excludes unfunded revolvers, debt investments placed on non-accrual and equity investments Excludes first-lien debt investments which were valued by performing a liquidation analysis of the underlying assets which serve as collateral for those loans * Table as of each respective quarter end and excludes investments with a fair value of zero from all figures except for the total number of portfolio companies and total number of investments PORTOLIO TRENDS PORTFOLIO OVERVIEW Over 97% of investment portfolio comprised of first lien, senior secured floating rate investments of which approximately 75% of investments are subject to a LIBOR floor Investment portfolio consists of 119 investments across 28 industries with an average position size of less than 1.0% of the total portfolio, at fair value Two additional investments were placed on non-accrual status bringing the total to four investments that represented 2.7% and 0.5% of the total portfolio at cost and fair value, respectively
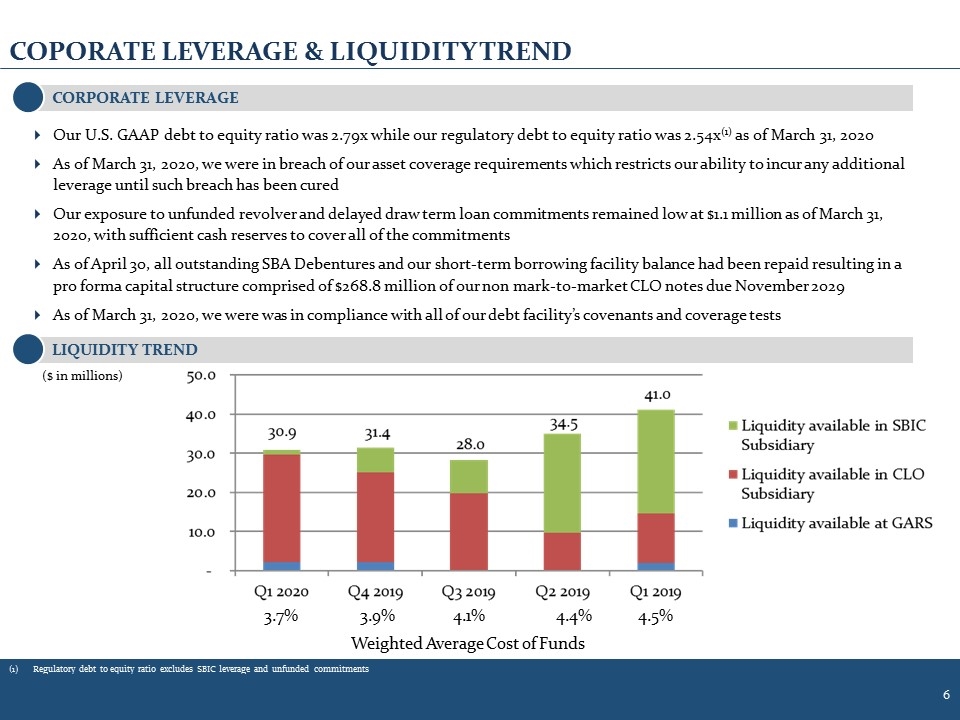
3.7% 3.9% 4.1% 4.4% 4.5% Weighted Average Cost of Funds Our U.S. GAAP debt to equity ratio was 2.79x while our regulatory debt to equity ratio was 2.54x(1) as of March 31, 2020 As of March 31, 2020, we were in breach of our asset coverage requirements which restricts our ability to incur any additional leverage until such breach has been cured Our exposure to unfunded revolver and delayed draw term loan commitments remained low at $1.1 million as of March 31, 2020, with sufficient cash reserves to cover all of the commitments As of April 30, all outstanding SBA Debentures and our short-term borrowing facility balance had been repaid resulting in a pro forma capital structure comprised of $268.8 million of our non mark-to-market CLO notes due November 2029 As of March 31, 2020, we were was in compliance with all of our debt facility’s covenants and coverage tests COPORATE LEVERAGE & LIQUIDITY TREND LIQUIDITY TREND CORPORATE LEVERAGE Regulatory debt to equity ratio excludes SBIC leverage and unfunded commitments ($ in millions) Liquidity available in SBIC Subsidiary Liquidity available in CLO Subsidiary Liquidity available in GARS ($ in millions) 50.0 40.0 30.0 20.0 10.0 $- 30.9 31.4 28.0 34.5 41.0 Weighted Average Cost of Funds Q1 2020 3.7% Q4 2019 3.9% Q3 2019 4.1% Q2 2019 4.4% Q1 2019 4.5%
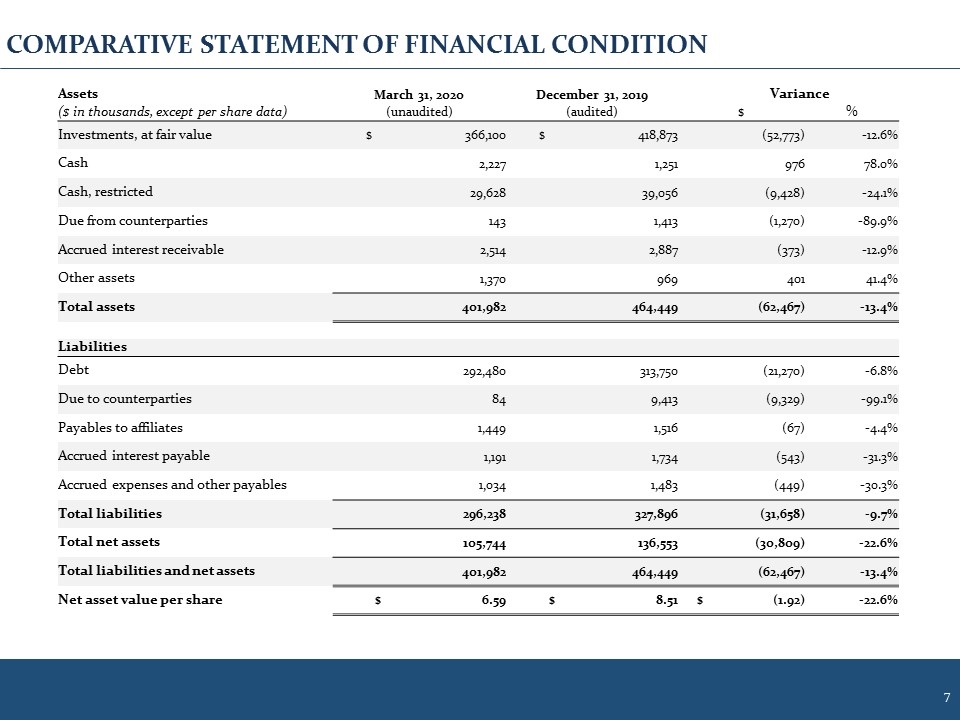
Assets March 31, 2020 December 31, 2019 Variance ($ in thousands, except per share data) (unaudited) (audited) $ % Investments, at fair value $ 366,100 $ 418,873 (52,773) -12.6% Cash 2,227 1,251 976 78.0% Cash, restricted 29,628 39,056 (9,428) -24.1% Due from counterparties 143 1,413 (1,270) -89.9% Accrued interest receivable 2,514 2,887 (373) -12.9% Other assets 1,370 969 401 41.4% Total assets 401,982 464,449 (62,467) -13.4% Liabilities Debt 292,480 313,750 (21,270) -6.8% Due to counterparties 84 9,413 (9,329) -99.1% Payables to affiliates 1,449 1,516 (67) -4.4% Accrued interest payable 1,191 1,734 (543) -31.3% Accrued expenses and other payables 1,034 1,483 (449) -30.3% Total liabilities 296,238 327,896 (31,658) -9.7% Total net assets 105,744 136,553 (30,809) -22.6% Total liabilities and net assets 401,982 464,449 (62,467) -13.4% Net asset value per share $ 6.59 $ 8.51 $ (1.92) -22.6% COMPARATIVE STATEMENT OF FINANCIAL CONDITION
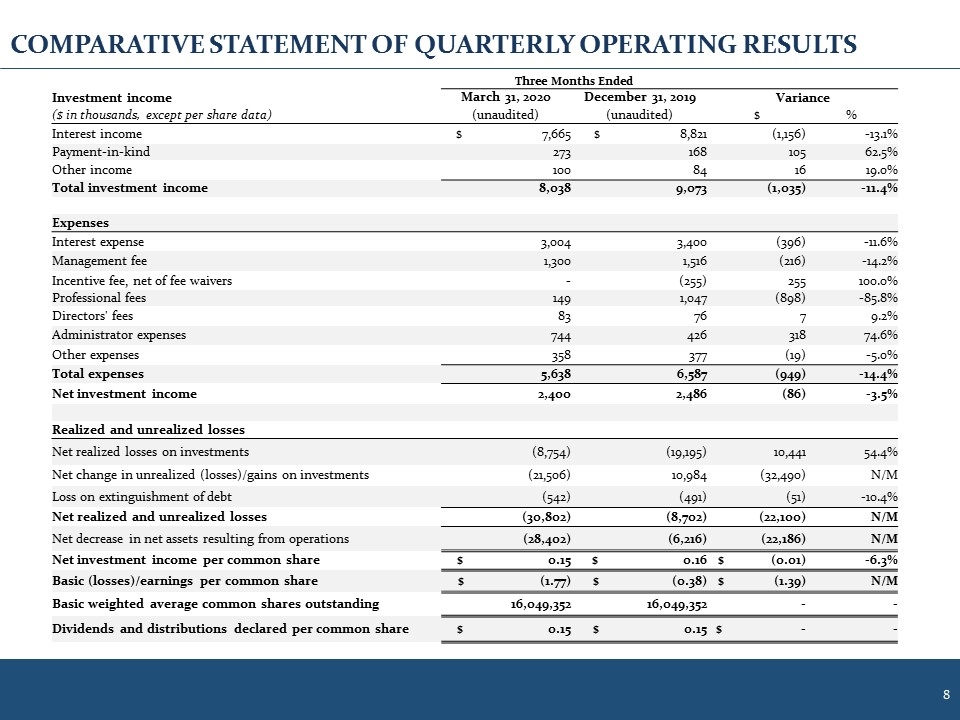
Three Months Ended Investment income March 31, 2020 December 31, 2019 Variance ($ in thousands, except per share data) (unaudited) (unaudited) $ % Interest income $ 7,665 $ 8,821 (1,156) -13.1% Payment-in-kind 273 168 105 62.5% Other income 100 84 16 19.0% Total investment income 8,038 9,073 (1,035) -11.4% Expenses Interest expense 3,004 3,400 (396) -11.6% Management fee 1,300 1,516 (216) -14.2% Incentive fee, net of fee waivers - (255) 255 100.0% Professional fees 149 1,047 (898) -85.8% Directors' fees 83 76 7 9.2% Administrator expenses 744 426 318 74.6% Other expenses 358 377 (19) -5.0% Total expenses 5,638 6,587 (949) -14.4% Net investment income 2,400 2,486 (86) -3.5% Realized and unrealized losses Net realized losses on investments (8,754) (19,195) 10,441 54.4% Net change in unrealized (losses)/gains on investments (21,506) 10,984 (32,490) N/M Loss on extinguishment of debt (542) (491) (51) -10.4% Net realized and unrealized losses (30,802) (8,702) (22,100) N/M Net decrease in net assets resulting from operations (28,402) (6,216) (22,186) N/M Net investment income per common share $ 0.15 $ 0.16 $ (0.01) -6.3% Basic (losses)/earnings per common share $ (1.77) $ (0.38) $ (1.39) N/M Basic weighted average common shares outstanding 16,049,352 16,049,352 - - Dividends and distributions declared per common share $ 0.15 $ 0.15 $ - - COMPARATIVE STATEMENT OF QUARTERLY OPERATING RESULTS
GARRISON CAPITAL INC. 1290 Avenue of the Americas, 9th Floor New York, NY 10104 Tel: 212-372-9590 Fax: 212-372-9525 Contact Information CONTACT INFORMATION
