Attached files
| file | filename |
|---|---|
| 8-K - CURRENT REPORT - ATLAS TECHNICAL CONSULTANTS, INC. | ea121651-8k_atlastechnical.htm |
| EX-99.1 - PRESS RELEASE DATED MAY 11, 2020. - ATLAS TECHNICAL CONSULTANTS, INC. | ea121651ex99-1_atlastech.htm |
Exhibit 99.2

FIRST QUARTER 2020 EARNINGS PRESENTATION MAY 11, 2020

The statements contained in this presentation that are not purely historical are forward - looking statements. Our forward - looking statements include, but are not limited to, statements regarding our or our management team’s expectations, hopes, beliefs, intentions or strategies regarding the future. The information included in this presentation in relation to Atlas ha s been provided by Atlas and its management team, and forward - looking statements include statements relating to Atlas’ management team’s expectations, hopes, beliefs, intentions or strategies regarding the future. In addition, any statements that refer to projections, forecasts or other characterizations of future events or circumstances, including any underlying assumptions, are forward - looking statements. The words “anticipate,” “believe,” “continue,” “could,” “estimate,” “expect,” “intends,” “may,” “might,” “plan,” “possible,” “potential,” “predict,” “project,” “should,” “would” and similar expressions m ay identify forward - looking statements, but the absence of these words does not mean that a statement is not forward - looking. The forward - looking statements contained in this presentation are based on our current expectations and beliefs concerning future developments and their potential effects on us. There can be no assurance that future developments affecting us will be those that we have anticipated. These forward - looking statements involve a number of risks, uncertainties (some of which are beyond our control) or other assumptions that may cause actual results or performance to be materially different from those expressed or implied by these forward - looking statements. These risks and uncertainties include, but are not limited to: (1) the ability to maintain the listing of the Company’s shares of Class A common stock and warrants on Nasdaq; (2) the ability to recognize the anticipated benefits of the business combination or acquisitions, which may be affected by, among other things, competition, the ability of the Company to grow and manage growth profitably, maintain relationships with customers and suppliers and retain management and key employees; (3) costs related to the business combination and acquisitions; (4) changes in applicable laws or regulations; (5) the possibility that the Company may be adversely affected b y other economic, business, and/or competitive factors; and (6) other risks and uncertainties indicated from time to time in th e Company’s filings with the U.S. Securities and Exchange Commission, including those under “Risk Factors” therein. FORWARD LOOKING STATEMENT 2

3 AGENDA Business Overview L. Joe Boyer Chief Executive Officer Financial Overview Walter Powell Chief Financial Officer Outlook David Quinn Executive Vice President

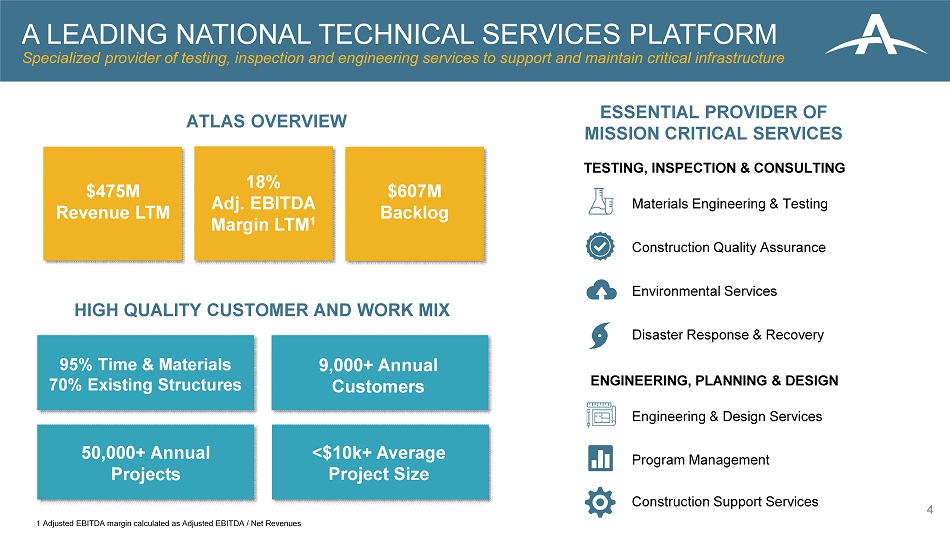
A LEADING NATIONAL TECHNICAL SERVICES PLATFORM Specialized provider of testing, inspection and engineering services to support and maintain critical infrastructure TESTING, INSPECTION & CONSULTING ESSENTIAL PROVIDER OF MISSION CRITICAL SERVICES HIGH QUALITY CUSTOMER AND WORK MIX ATLAS OVERVIEW 4 $475M Revenue LTM 18% Adj. EBITDA Margin LTM 1 $607M Backlog 95% Time & Materials 70% Existing Structures 9,000+ Annual Customers 50,000+ Annual Projects <$10k+ Average Project Size Materials Engineering & Testing Construction Quality Assurance Environmental Services Disaster Response & Recovery ENGINEERING, PLANNING & DESIGN Engineering & Design Services Program Management Construction Support Services 1 Adjusted EBITDA margin calculated as Adjusted EBITDA / Net Revenues

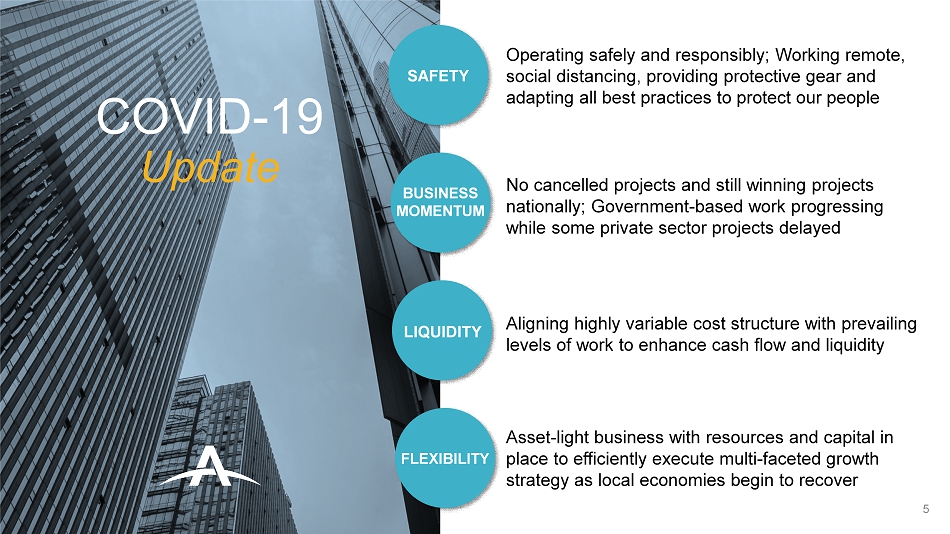
Operating safely and responsibly; Working remote, social distancing, providing protective gear and adapting all best practices to protect our people No cancelled projects and still winning projects nationally; Government - based work progressing while some private sector projects delayed Aligning highly variable cost structure with prevailing levels of work to enhance cash flow and liquidity Asset - light business with resources and capital in place to efficiently execute multi - faceted growth strategy as local economies begin to recover COVID - 19 Update SAFETY BUSINESS MOMENTUM LIQUIDITY FLEXIBILITY 5

CURRENT MARKET LANDSCAPE Non - discretionary and government - based work not materially impacted by COVID - 19 Government - Based Work ~50% No Material Impact: Government - based work largely stable with upside potential from federal stimulus on infrastructure Key End Markets: • Infrastructure • Transportation • Other Government Private Sector ~50% Highly variable cost structure to align resources with market activity Localized Impact: Localized geographic work delays, most notably in the Northeast and Northern California Key End Markets: • Commercial • Industrial Atlas’ mission critical services support infrastructure and other essential industries No contracted backlog projects have been cancelled 6

RESILIENT BUSINESS MODEL Purpose - Built National Platform To Succeed in All Economic Cycles Fully - funded backlog provides multi - year view of work pipeline Government - based work grows steadily throughout cycles Geographic exposure to well - funded regions in the U.S. Testing and inspection work is regulatory and compliance driven Work performed for repeat customers ~90% Work performed on existing assets and structures ~70% Diverse and resilient end markets, with approximately half of work government - based ~50% Mobile workforce to reallocate resources where most in demand BACKLOG DRIVEN CYCLE - TESTED HIGH GROWTH MISSION CRITICAL SCALABLE 7

FINANCIAL HIGHLIGHTS Strong Results to Start the Year $105.6 $109.3 Gross Revenue Q1 2019 Q1 2020 3.5% Increase $ 85.8 $ 90.5 Net Revenue Q1 2019 Q1 2020 $10.9 $12.9 Adjusted EBITDA Q1 2019 Q1 2020 18.6% Increase $ 575 $607 Backlog Q1 2019 Q1 2020 5.5% Increase 5.6% Increase (Dollars in Millions) 8

2020 2021 2022 2023 2024 2025 2026 No Significant Maturities Until 2025 Term Loan Revolver $14 $14 $14 $14 $54 $235 $11 $19M 3.3x Cash Net Leverage 2 Covenant Threshold <5.5x 1 Adjusted operating cash flow excludes 14.7 million of one - time cash expenses incurred to complete the business combination wit h Boxwood Merger Corp. and related public company formation transactions in February 2020 2 Net leverage calculated as (debt – cash) / LTM Adjusted EBITDA including predecessor period of acquisitions Liquidity $37M $0.6 $ - 12.6 $2.1 Operating Cash Flow 1 Q1 2020 Q1 2020 +$2.1M excludes $14.7m of one - time business combination costs Q1 2019 Adj. Q1 2020 9 Balance Sheet and Liquidity Strong Cash Flow Profile and No Near - term Debt Maturities (Dollars in Millions)

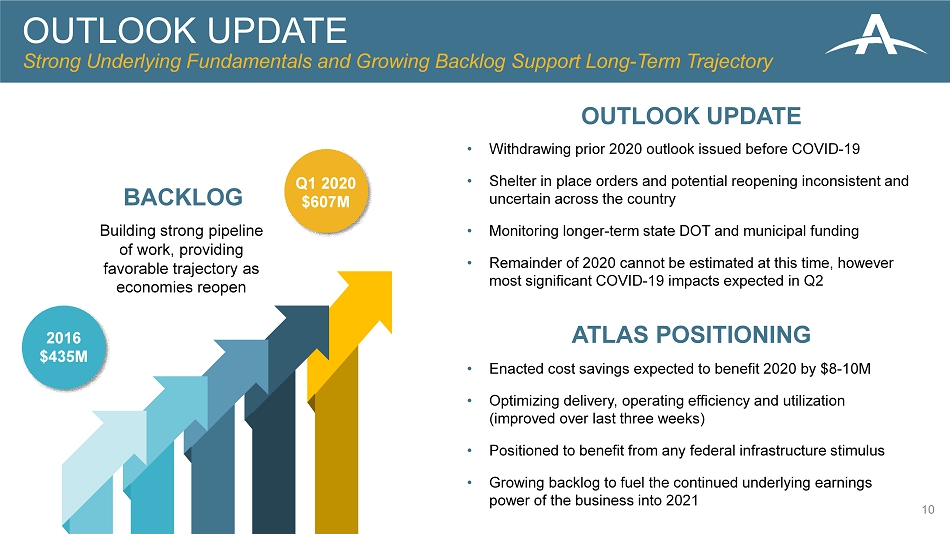
OUTLOOK UPDATE Strong Underlying Fundamentals and Growing Backlog Support Long - Term Trajectory OUTLOOK UPDATE BACKLOG 2016 $435M Q1 2020 $607M Building strong pipeline of work, providing favorable trajectory as economies reopen 10 • Withdrawing prior 2020 outlook issued before COVID - 19 • Shelter in place orders and potential reopening inconsistent and uncertain across the country • Monitoring longer - term state DOT and municipal funding • Remainder of 2020 cannot be estimated at this time, however most significant COVID - 19 impacts expected in Q2 • Enacted cost savings expected to benefit 2020 by $8 - 10M • Optimizing delivery, operating efficiency and utilization (improved over last three weeks) • Positioned to benefit from any federal infrastructure stimulus • Growing backlog to fuel the continued underlying earnings power of the business into 2021 ATLAS POSITIONING

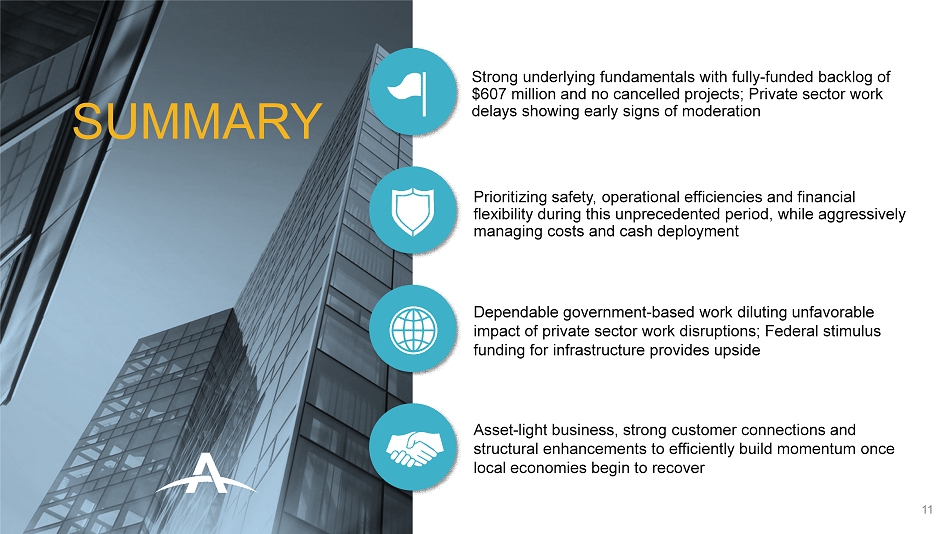
Dependable government - based work diluting unfavorable impact of private sector work disruptions; Federal stimulus funding for infrastructure provides upside Strong underlying fundamentals with fully - funded backlog of $607 million and no cancelled projects; Private sector work delays showing early signs of moderation Prioritizing safety, operational efficiencies and financial flexibility during this unprecedented period, while aggressively managing costs and cash deployment Asset - light business, strong customer connections and structural enhancements to efficiently build momentum once local economies begin to recover SUMMARY 11

APPENDIX 12

Reconciliation Revenues LTM Q1 2020 Gross Revenues Reimburseable Expenses Net Revenues Year ended December 31, 2019 471,047$ (93,265)$ 377,782$ Less: Quarter ended March 31, 2019 (105,611) (19,817) (85,794) Plus: Quarter ended March 31, 2020 109,302 (18,802) 90,500 LTM Q1 2020 474,738$ (92,250)$ 382,488$ For the year ended December 31, Reconciliation Net Income to Adjusted EBITDA 2020 2019 2019 LTM Q1 2020 Net (loss) income (23,569)$ 735$ 8,030$ (16,274)$ Interest 5,640 2,385 9,862 13,117 Taxes - - 1,342 1,342 Depreciation and amortization 5,002 5,169 19,881 19,714 EBITDA (12,927) 8,289 39,115 17,899 EBITDA for acquired business prior to acquisition date 763 843 - (80) One-time legal/transaction costs 10,795 837 19,748 29,706 Other non-recurring expenses 3,874 842 4,722 7,754 Non-cash equity compensation 10,386 56 1,984 12,314 Adjusted EBITDA 12,891$ 10,867$ 65,569$ 67,593$ Adj. EBITDA % of Net Revenues LTM Q1 2020 17.7% For the quarter ended March 31, RECONCILIATION Net Income to Adjusted EBITDA and LTM Q1 2020 13
