Attached files
| file | filename |
|---|---|
| 8-K - 8-K - AMERICA FIRST MULTIFAMILY INVESTORS, L.P. | atax-8k_20200511.htm |
Exhibit 99.1

Supplemental Financial Report for
Quarter Ended March 31, 2020
|
|
|
|


AMERICA FIRST MULTIFAMILY INVESTORS, L.P.
All statements in this document other than statements of historical facts, including statements regarding our future results of operations and financial position, business strategy and plans and objectives of management for future operations, are forward-looking statements. When used, statements which are not historical in nature, including those containing words such as “anticipate,” “estimate,” “should,” “expect,” “believe,” “intend,” and similar expressions, are intended to identify forward-looking statements. We have based forward-looking statements largely on our current expectations and projections about future events and financial trends that we believe may affect our business, financial condition and results of operations. This document may also contain estimates and other statistical data made by independent parties and by us relating to market size and growth and other industry data. This data involves a number of assumptions and limitations, and you are cautioned not to give undue weight to such estimates. We have not independently verified the statistical and other industry data generated by independent parties contained in this supplement and, accordingly, we cannot guarantee their accuracy or completeness. In addition, projections, assumptions and estimates of our future performance and the future performance of the industries in which we operate are necessarily subject to a high degree of uncertainty and risk due to a variety of factors, including those described under the headings “Item 1A Risk Factors” in our 2019 Annual Report on Form 10-K for the year ended December 31, 2019 and our Quarterly Report on Form 10-Q for the quarter ended March 31, 2020. These forward-looking statements are subject to various risks and uncertainties and America First Multifamily Investors, L.P. (“ATAX” or “Partnership”) expressly disclaims any obligation to publicly update or revise any forward-looking statements, whether as a result of new information, future events or otherwise.
Most, but not all, of the selected financial information furnished herein is derived from the America First Multifamily Investors, L.P.’s consolidated financial statements and related notes prepared in conformity with generally accepted accounting principles in the United States of America (“GAAP”) and management’s discussion and analysis of financial condition and results of operations included in the Partnership’s reports on Forms 10-K and 10-Q. The Partnership’s annual consolidated financial statements were subject to an independent audit, dated February 26, 2020.
Disclosure Regarding Non-GAAP Measures
This document refers to certain financial measures that are identified as non-GAAP. We believe these non-GAAP measures are helpful to investors because they are the key information used by management to analyze our operations. This supplemental information should not be considered in isolation or as a substitute for the related GAAP measures.
Please see the consolidated financial statements we filed with the Securities and Exchange Commission on Forms 10-K and 10-Q. Our GAAP consolidated financial statements can be located upon searching for the Partnership’s filings at www.sec.gov.
|
|
|
|
|
|
|
PARTNERSHIP FINANCIAL INFORMATION
TABLE OF CONTENTS
|
|
Pages |
|
|
|
Supplemental Letter from the CEO |
4 |
|
|
Quarterly Fact Sheet |
5 |
|
|
Financial Performance Trend Graphs |
6-11 |
|
|
Other Partnership Information |
12 |
|
|
Partnership Financial Measures |
13-14 |
|
|
|
|


|
|
|
|
|
|
|
AMERICA FIRST MULTIFAMILY INVESTORS L.P.
SUPPLEMENTAL LETTER FROM THE CEO
During the first quarter of 2020, ATAX continued to focus its efforts to “fine tune” the Balance Sheet while also assessing the impact of COVID-19 on our business and operations. We reported the following financial results:
As of and for the three months ended March 31, 2020:
|
|
• |
Total revenues of $13.7 million, |
|
|
• |
Net income, basic and diluted, of $0.04 per Beneficial Unit Certificate (“BUC”), |
|
|
• |
Cash Available for Distribution of $0.05 per BUC, |
|
|
• |
Total assets of $977.5 million, and |
|
|
• |
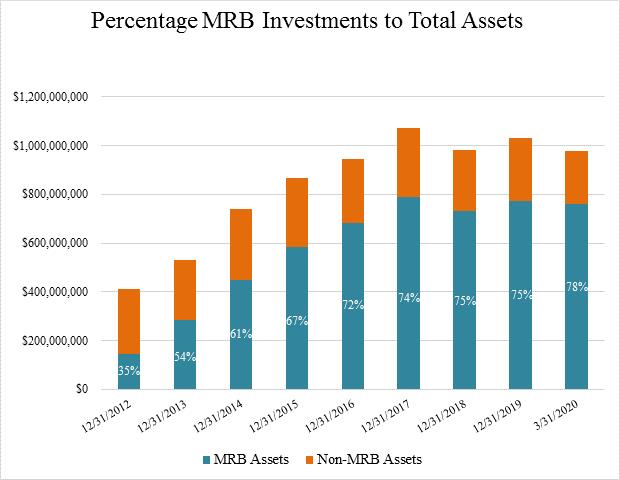
Total Mortgage Revenue Bond (“MRB”) investments of $761.1 million. |
The ATAX reported the following notable transactions during the first quarter of 2020:
|
|
• |
Sale of the Public Housing Capital Fund Trust (“PHC”) Certificates for approximately $43.3 million, |
|
|
• |
Additional Investments in unconsolidated entities of approximately $10.3 million, |
|
|
• |
Redemption of one MRB for approximately $3.1 million, and |
|
|
• |
Refinancing of two Mortgages Payable with total principal of approximately $26.7 million. |
The sale of our PHC Certificate investments for approximately $43.3 million plus accrued interest in January 2020 represents the completion of another component of our strategy to “fine tune” the Balance Sheet.
In April 2020, we terminated our debt financing arrangements with Deutsche Bank AG (“Deutsche Bank”) and entered into replacement debt financing arrangements with Mizuho Capital Markets LLC (“Mizuho”). We also terminated its Master Trust Agreement with Deutsche Bank and is no longer subject to its financial and non-financial covenant provisions, giving us more flexibility in managing our liquidity and overall debt portfolio. The closing of these new financing structures with Mizuho is a strong indicator of ATAX’s ability to access capital markets even as COVID-19 has created uncertainty in the financial markets.
The impacts of COVID-19 on the general economy and our operations are continuously evolving. What we do know is that our team is healthy, safe and thriving while working from home; our business partners remain open for business; ATAX has access to capital markets, as needed; all mortgage revenue bonds are current on debt service as of March 31, 2020; we have received no requests to date for forbearance; and there have been no supply chain disruptions for labor or building materials. We are committed to navigating these uncertain times in the best interest of our unitholders.
Thank you for your continued support of ATAX!
/s/ Chad L. Daffer
Chad L. Daffer
Chief Executive Officer
|
|
4 |
|
|
|
|
|
PARTNERSHIP DETAILS |
|
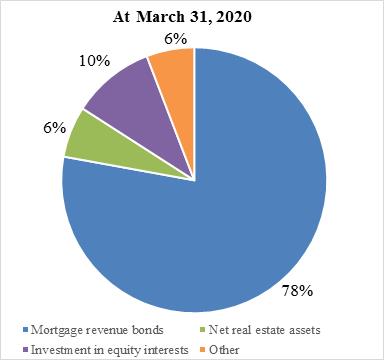
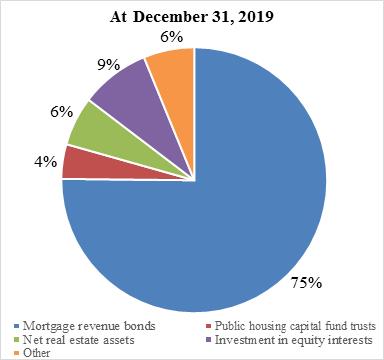
ATAX was formed for the primary purpose of acquiring a portfolio of MRBs that are issued to provide construction and/or permanent financing of multifamily residential properties. We continue to expect most of the interest paid on these MRBs to be excludable from gross income for federal income tax purposes. We continue to pursue a business strategy of acquiring additional MRBs and other investments on a leveraged basis. We also invest in other tax-exempt securities which, if not secured by a direct or indirect interest in a multifamily property, must be rated in one of the four highest rating categories by at least one nationally recognized securities rating agency. We have also acquired interests in multifamily projects (“MF Properties”) to position ourselves for future investments in MRBs issued to finance these properties or to operate the MF Properties until their “highest and best use” can be determined. In addition, we have invested in equity interests in multifamily, market rate projects throughout the U.S.
|
|||||||||
|
(As of March 31, 2020) |
|
||||||||||
|
|
|
||||||||||
|
Symbol (NASDAQ) |
|
|
ATAX |
|
|||||||
|
Annual Distribution |
|
$ |
0.50 |
|
|||||||
|
Price |
|
$ |
5.24 |
|
|||||||
|
Yield |
|
|
9.5% |
|
|||||||
|
|
|
|
|
|
|||||||
|
BUCs Outstanding (including Restricted Units) |
|
|
60,835,204 |
|
|||||||
|
Market Capitalization |
|
$ |
318,776,469 |
|
|||||||
|
52-week BUC price range |
|
$4.10 to $8.18 |
|
||||||||
|
|
|
|
|
|
|||||||
|
|
|
|
|
|
|||||||
|
Partnership Financial Information for Q1 2020 ($’s in 000’s, except per BUC amounts)
|
|
||||||||||
|
|
3/31/2020 |
|
12/31/2019 |
|
|||||||
|
|
|
|
|
|
|||||||
|
Total Assets |
$977,516 |
|
$1,029,169 |
|
|||||||
|
Leverage Ratio1 |
60% |
|
61% |
|
|||||||
|
|
|
|
|
|
|||||||
|
|
Q1 2020 |
|
YTD 2019 |
|
|||||||
|
|
|
|
|
|
|||||||
|
Total Revenue |
$13,736 |
|
$13,736 |
|
|||||||
|
Net Income |
$2,982 |
|
$2,982 |
|
|||||||
|
Cash Available for Distribution (“CAD”)2 |
$2,837 |
|
$2,837 |
|
|||||||
|
Distribution Declared per BUC3 |
$0.125 |
|
$0.125 |
|
|||||||
|
|
|
|
|
|
|||||||
|
1 |
Our overall leverage ratio is calculated as total outstanding debt divided by total assets using cost adjusted for paydowns and allowances for MRBs, PHC Certificates, property loans, and taxable MRBs, and initial cost for deferred financing costs and MF Properties. |
|
2 |
Management utilizes a calculation of Cash Available for Distribution (“CAD”) to assess the Partnership’s operating performance. This is a non-GAAP financial measure and a reconciliation of our GAAP net income to CAD is provided on page 13 of the Supplement herein. |
|
3 |
The most recent distribution was paid on April 30, 2020 for BUC holders of record as of March 31, 2020. The distribution is payable to BUC holders of record as of the last business day of the quarter end and ATAX trades ex-dividend two days prior to the record date, with a payable date of the last business day of the subsequent month. |
|
|
5 |
|
|
|
|
|
|
6 |
|
|
|
|
ATAX MORTGAGE REVENUE BOND PROFILE
|
|
7 |
|
|
|
|

|
|
8 |
|
|
|
|
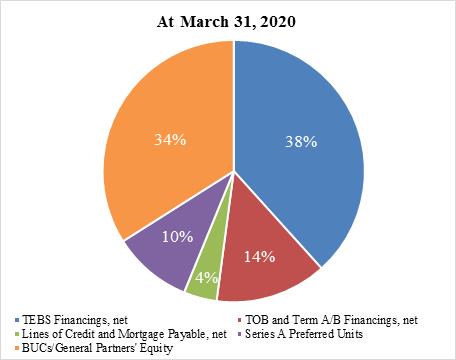
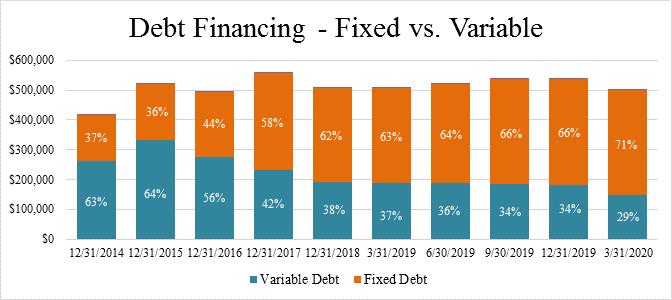
DEBT FINANCING, NET ($’s in 000’s)
INTEREST RATE SENSITIVITY ANALYSIS1
|
Description |
|
- 25 basis points |
|
+ 50 basis points |
|
+ 100 basis points |
|
+ 150 basis points |
|
+ 200 basis points |
|
TOB & Term A/B Debt Financings |
|
$180,823 |
|
$(361,610) |
|
$(723,173) |
|
$(1,084,691) |
|
$(1,446,163) |
|
TEBS Debt Financings |
|
209,739 |
|
(419,436) |
|
(838,817) |
|
(1,141,089) |
|
(1,402,544) |
|
Other Investment Financings |
|
30,830 |
|
(61,616) |
|
(123,173) |
|
(184,672) |
|
(246,113) |
|
Total |
|
$421,392 |
|
$(842,662) |
|
$(1,685,163) |
|
$(2,410,452) |
|
$(3,094,820) |
|
|
1 |
Represents the change over the next 12 months assuming an immediate shift in rates and management does not adjust its strategy in response. |
|
|
9 |
|
|
|
|
|
|
10 |
|
|
|
|
|
|
• |
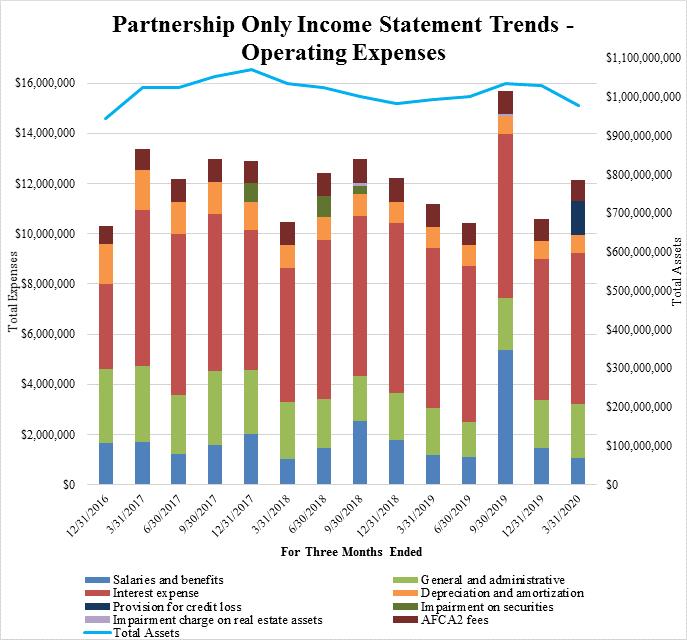
Since April 1, 2018, the ratio of “Salaries and benefits” and “General and administrative” expenses has averaged approximately 0.38% of Total Assets on a quarterly basis. |
|
|
• |
Salaries and benefits expense for the three months ended September 30, 2019 includes approximately $2.7 million of expense related to the accelerated vesting of restricted units upon the change in control of ATAX’s general partner on September 10, 2019. |
|
|
11 |
|
|
|
|
|
OTHER PARTNERSHIP INFORMATION |
|||||
|
|
|
|
|
||
|
Corporate Office: |
|
|
Transfer Agent:
|
||
|
14301 FNB Parkway |
|
|
American Stock Transfer & Trust Company |
||
|
Suite 211 |
|
|
59 Maiden Lane |
||
|
Omaha, NE 68154 |
|
|
Plaza Level |
||
|
Phone: |
402-952-1235 |
|
New York, NY 10038 |
||
|
Investor & K-1 Services: |
855-4AT-AXK1 |
|
|
Phone: 718-921-8124 |
|
|
Web Site: |
www.ataxfund.com |
|
|
888-991-9902 |
|
|
K-1 Services Email: |
k1s@ataxfund.com |
|
|
|
|
|
Ticker Symbol: |
ATAX |
|
|
|
|
|
Corporate Counsel: |
|
Independent Accountants: |
|
Barnes & Thornburg LLP |
|
PwC |
|
11 S. Meridian Street |
|
1 North Wacker Drive |
|
Indianapolis, IN 46204 |
|
Chicago, Illinois 60606 |
|
|
|
|
|
Board of Managers of Greystone AF Manager, LLC: |
||
|
(acting as the directors of ATAX) |
||
|
|
|
|
|
Stephen Rosenberg |
|
Chairman of the Board |
|
Curtis A. Pollock |
|
Manager |
|
Jeffrey M. Baevsky |
|
Manager |
|
Drew C. Fletcher |
|
Manager |
|
Steven C. Lilly |
|
Manager |
|
Walter K. Griffith |
|
Manager |
|
William P. Mando, Jr. |
|
Manager |
|
|
|
|
|
Corporate Officers: |
||
|
Chief Executive Officer – Chad L. Daffer |
||
|
Chief Financial Officer – Jesse A. Coury |
||
|
Chief Investment Officer - Kenneth C. Rogozinski |
||
|
|
12 |
|
|
|
|
AMERICA FIRST MULTIFAMILY INVESTORS, L.P.
CASH AVAILABLE FOR DISTRIBUTION (CAD) AND OTHER PERFORMANCE MEASURES
The following table contains reconciliations of the Partnership’s GAAP net income to its CAD:
|
|
For the Three |
|
|
|
|
Months Ended |
|
|
|
|
March 31, 2020 |
|
|
|
Partnership net income |
$ |
2,981,757 |
|
|
Change in fair value of derivatives and interest rate derivative amortization |
|
(25,201 |
) |
|
Depreciation and amortization expense |
|
709,438 |
|
|
Reversal of impairment on securities |
|
(1,902,979 |
) |
|
Provision for credit loss |
|
1,357,681 |
|
|
Amortization of deferred financing costs |
|
358,908 |
|
|
Restricted units compensation expense |
|
39,068 |
|
|
Deferred income taxes |
|
(30,921 |
) |
|
Redeemable Series A Preferred Unit distribution and accretion |
|
(717,763 |
) |
|
Tier 2 Income distributable to the General Partner |
|
80,501 |
|
|
Bond purchase premium (discount) amortization (accretion), net of cash received |
|
(13,806 |
) |
|
Total CAD |
$ |
2,836,683 |
|
|
|
|
|
|
|
Weighted average number of BUCs outstanding, basic |
|
60,754,179 |
|
|
|
|
|
|
|
Partnership Only: |
|
|
|
|
Net income per BUC, basic |
$ |
0.04 |
|
|
Total CAD per BUC, basic |
$ |
0.05 |
|
|
Distributions declared per BUC |
$ |
0.125 |
|
|
|
13 |
|
|
|
|
AMERICA FIRST MULTIFAMILY INVESTORS, L.P.
TAX INCOME INFORMATION RELATED TO BENEFICIAL UNIT CERTIFICATES
The following table summarizes tax-exempt and taxable income as percentages of total income allocated to the Partnership’s BUCs on Schedule K-1 for tax years 2017 to 2019. This disclosure relates only to income allocated to the Partnership’s BUCs and does not consider an individual unitholder’s basis in the BUCs or potential return of capital as such matters are dependent on the individual unitholders’ specific tax circumstances.
|
|
2019 |
|
2018 |
|
2017 |
|
Tax-exempt income |
37% |
|
41% |
|
62% |
|
Taxable income |
63% |
|
59% |
|
38% |
|
|
100% |
|
100% |
|
100% |
|
|
|
|
|
|
|
|
|
14 |