Attached files
| file | filename |
|---|---|
| EX-99.1 - EXHIBIT 99.1 - New Senior Investment Group Inc. | a52217559ex99_1.htm |
| 8-K - NEW SENIOR INVESTMENT GROUP INC. 8-K - New Senior Investment Group Inc. | a52217559.htm |
Exhibit 99.2

Company Presentation May 8, 2020 PinegateMacon, GA

Forward-Looking Statements, Non-GAAP and Other Information 1 IN GENERAL. This disclaimer applies to this
document and the verbal or written comments of any person presenting it. This document, taken together with any such verbal or written comments, is referred to herein as the “Presentation.” Throughout this Presentation, New Senior Investment
Group Inc. (NYSE: SNR) is referred to as “New Senior,” the “Company,” “SNR” or “we.”FORWARD-LOOKING STATEMENTS. Certain information in this Presentation may constitute “forward-looking statements” within the meaning of the Private Securities
Litigation Reform Act of 1995, including without limitation statements regarding expectations with respect to the potential range of 2020 financial results, the expected impact of the COVID-19 pandemic on our business, liquidity, properties,
operators and the health systems and populations that we serve; the cost and effectiveness of measures we have taken to respond to the COVID-19 pandemic, including health and safety protocols and system capacity enhancements that are intended to
limit the transmission of COVID-19 at our properties; and our expected occupancy rates and operating expenses. These statements are not historical facts. They represent management’s current expectations regarding future events and are subject to
a number of risks and uncertainties, many of which are beyond our control, that could cause actual results to differ materially from those described in the forward-looking statements. These risks and uncertainties include, but are not limited to,
risks and uncertainties relating to the continuing impact of COVID-19 on our operations and the operation of our facilities, including ongoing cases at certain of our facilities, our ability to successfully manage the asset management by third
parties, and market conditions affecting demand and supply for senior housing. Accordingly, you should not place undue reliance on any forward-looking statements contained herein. For a discussion of these and other risks and important factors
that could affect such forward-looking statements, see the sections entitled “Risk Factors” and “Management’s Discussion and Analysis of Financial Condition and Results of Operations” in the Company’s most recent annual and quarterly reports
filed with the Securities and Exchange Commission, which are available on the Company’s website (www.newseniorinv.com). New risks and uncertainties emerge from time to time, and it is not possible for us to predict or assess the impact of every
factor that may cause our results to differ materially from those anticipated by any forward-looking statements. Forward-looking statements contained herein, and all statements made in this Presentation, speak only as of the date of this
Presentation, and the Company expressly disclaims any duty or obligation to release publicly any updates or revisions to any statements contained herein to reflect any change in the Company’s expectations with regard thereto or change in events,
conditions or circumstances on which any statement is based.NON-GAAP FINANCIAL INFORMATION. This Presentation includes information based on financial measures that are not recognized under generally accepted accounting principles (“GAAP”), such
as NOI, cash NOI, adjusted same store cash NOI, Normalized FFO, AFFO and Normalized FAD. You should use non‐GAAP information in addition to, and not as an alternative to, financial information prepared in accordance with GAAP. See the end of this
Presentation for reconciliations to the most comparable GAAP measures and an explanation of each of our non-GAAP measures. Our non-GAAP measures may not be identical or comparable to measures with the same name presented by other companies due to
differences in calculation, capital structure or other factors. PAST PERFORMANCE. In all cases where historical results are presented or past performance is described, we note that past performance is not a reliable indicator of future results
and performance.GLOSSARY. See the Glossary at the end of this Presentation for an explanation of various terms used herein.

Table of Contents SECTIONS PAGES I. Company Overview 5 – 14 II. COVID-19 Situation
Update 16 – 18 III. Financial Update 20 – 22 IV. Reconciliations and Glossary 24 – 28 2

Executive Summary 3 New Senior Investment Group Inc. (NYSE: SNR) is the only U.S. pure play,
publicly-traded senior living REITPortfolio comprised of 102 Independent Living (IL) properties and one NNN leased property across 36 statesFollowing a transformational 2019, we started 2020 with strong 1Q20 results which were in-line with
expectationsTotal same store cash NOI increased +0.1% in 1Q20 versus 1Q19 (excluding COVID-19 expenses, increased +1.5%)The COVID-19 pandemic began to impact our results in the second half of March 2020The COVID-19 pandemic has had a
disproportionate impact on seniors, the cohort our properties serveOur top priority since the crisis began has been the health and safety of our residents and our operators’ associates around the countryOur operators took early action to limit
access at our properties and secure supplies, which resulted in lower move-ins and higher expenses We expect to continue to experience occupancy declines and higher expenses during the pandemicWe believe the long-term value of senior housing, and
Independent Living in particular, remains intactThe necessary measures taken will have an impact on our near-term financial performance, but we believe they will also highlight the importance of senior housing and will strengthen our position as
we move forward This presentation seeks to provide our stakeholders with the following:A review of our business and senior housing market fundamentalsAn update on the COVID-19 pandemic, our operator responses, and specific observations to
date Our initial views on the potential financial impact of COVID-19

Company Overview Rolling Hills RanchOmaha, NE

New Senior Overview New Senior Investment Group Inc. (NYSE: SNR) is a publicly-traded REIT with a
portfolio of 102 Independent Living (IL) properties and one NNN leased property Pure Play REIT Uniquely Positioned Geographic Diversification & Scale Experienced Operator Mix Uniquely positioned to capitalize on long-term
industry fundamentals(1)96% of NOI from high-margin IL properties The only pure play, publicly-traded senior housing REIT in the U.S.100% private pay senior housingAll properties wholly owned Partnered with experienced senior housing operators4
operator relationships Holiday: 3rd largest senior housing operator One of the largest owners of senior housing with a national footprint(2)10th largest owner of senior housingDiversified across 36 states Percentages calculated based on 1Q20
NOI and excludes 28 AL/MC properties that were sold in February 2020.ASHA, “50 Largest U.S. Seniors Housing Owners as of June 1, 2019”. 103 Properties12,405 Units3,300 Associates 5

Geographically Diversified Portfolio Portfolio of 103 properties located across 36 different statesNo more
than 10% of NOI generated from any one stateProperties located in markets with favorable demographic trends Properties predominately located outside of major metropolitan areas65% of NOI generated from properties located in secondary and tertiary
markets(1) 6 Top Markets and States National Footprint As defined by National Investment Center for Seniors Housing & Care (NIC); tertiary markets include Additional markets and markets not covered by NIC.Percentages calculated based on
1Q20 NOI, excluding properties sold during the
quarter. Top
5 States Properties % of NOI(2) California 9 10% North Carolina 8 10% Florida 9 10% Pennsylvania 5 8% Oregon 8 7% Markets(1) Properties % of NOI(2) Primary 32 35% Secondary 32 32% Tertiary 39 33% Managed IL
PropertiesNNN Lease

Overview of Senior Housing Acuity Spectrum(1) 7 Data per NIC Investment Guide, Fifth
Edition. Continuum Of Care Senior Apartments (SA) Independent Living (IL) Assisted Living (AL) Memory Care (MC) Nursing Care (NC) Product Services Housing & Activities Sr. Apt. Services + Transportation,Meals &
Housekeeping IL Services + Care Services AL Services + Memory Care Programming AL/MC Services +ST Post-Acute or LT Chronic Care Payor Type Private Private Private Private Private & Public Avg. Monthly Rent <
$3,000 ~$3,100 ~$4,600 ~$6,300 ~$6,000 - $15,000(Depending on Payor Type) Resident Profile Typical Entry Age 55+ 75+ 80+ 80+ 65 – 95 Length of Stay 3+ years ~3 years ~2 years ~2 years ST Post-Acute: ~30 daysLT
Chronic Care: ~1 year Supply in the U.S. By Community Type Properties -- 2,800 7,200 1,400 10,300 Units -- 427,000 595,000 73,000 1,344,000 Lower Acuity HigherAcuity Broad range of services offered across the senior
housing spectrum from senior apartments to nursing care New Senior is focused on the lower acuity end of the senior housing spectrum, specifically Independent Living96% of New Senior’s 1Q20 NOI is from Independent Living “IL” properties
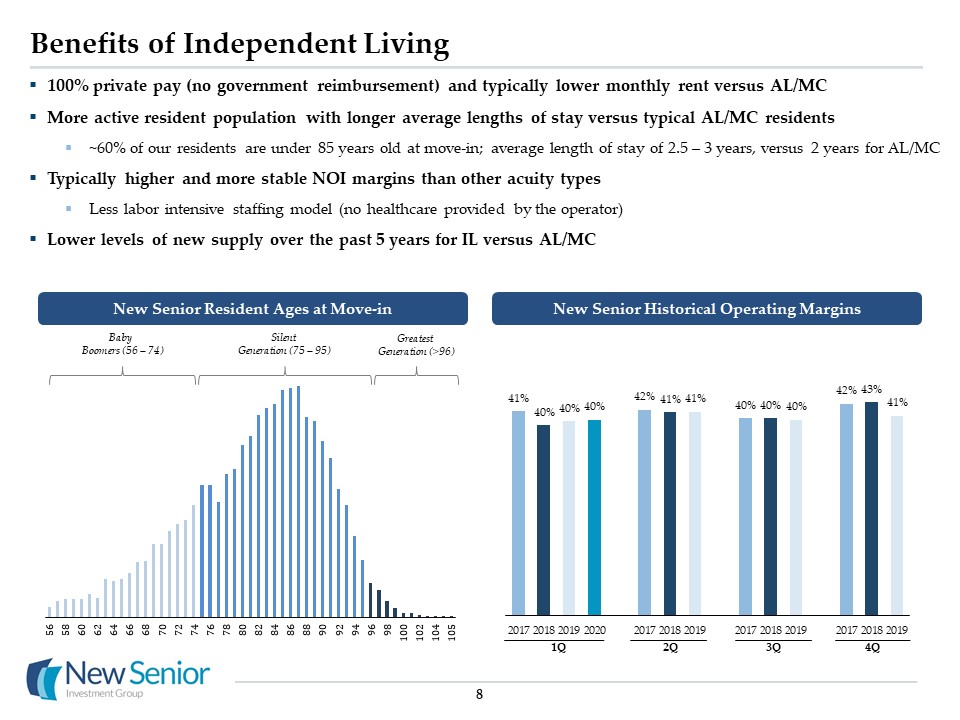
Benefits of Independent Living 8 1Q 2Q 3Q 4Q Baby Boomers (56 – 74) Silent Generation (75 –
95) Greatest Generation (>96) New Senior Resident Ages at Move-in New Senior Historical Operating Margins 100% private pay (no government reimbursement) and typically lower monthly rent versus AL/MCMore active resident population with
longer average lengths of stay versus typical AL/MC residents~60% of our residents are under 85 years old at move-in; average length of stay of 2.5 – 3 years, versus 2 years for AL/MCTypically higher and more stable NOI margins than other acuity
typesLess labor intensive staffing model (no healthcare provided by the operator)Lower levels of new supply over the past 5 years for IL versus AL/MC

Purpose Built, Uniform Independent Living Portfolio Peninsula (Gig Harbor, WA) Example of First Level
Floorplan Main atrium with adjacent sitting, activities and dining spaces Resident Hallway Resident Hallway 9 Typical Dining Room Majority of New Senior’s properties have a uniform building layout consisting of: Two to three floors with
100 to 120 units Centrally-located atriums with adjacent sitting, activities and dining spaces Allows for standardized operations and simplified staffing modelOur average IL property is staffed with 30 employees versus the 2-5x more needed in a
typical AL/MC property Also results in more effective asset management and capital expenditure planning

Senior Housing Industry is Large and Fragmented Ownership of senior housing properties is highly
fragmentedEstimated $300 billion of senior housing properties in the U.S.(1)Only 21% of properties are owned by public REITs and public operating companies(2)1.6mm total units in the industry(2)Independent Living (IL): 695k units, 44% of
industryAssisted Living (AL): 659k units, 42% of industryMemory Care (MC): 215k units, 14% of industry 10 Highly Fragmented Ownership Senior Housing Acuity Mix Breakdown By Care Type Based on management estimates.Data per NIC Investment
Guide, Fifth Edition. Public Operating Companies 6% Non-Public Owners79% PublicREITs15% IL695k units,44% AL659k units, 42% MC215k units, 14% Senior Housing: 1.6mm Total Units

Compelling Demographic Tailwinds(1) 11 Seniors Represent Fastest Growing Demographic YoY 75+ Population
Growth U.S. Census Bureau and NIC. 3-Year CAGR Per Age Cohort 3.9% 10-Year CAGR U.S. 75+ population projected to double in next twenty years; 23 million in 2019 44 million in 2039 75+ population growing 8x faster than total population over
next 20 years6% of U.S. 75+ population currently resides in senior housingDemand for 300,000 senior housing units over next 5 years, generated by growth of aging population Increase in industry penetration rate to 7% would produce 100% industry
occupancy
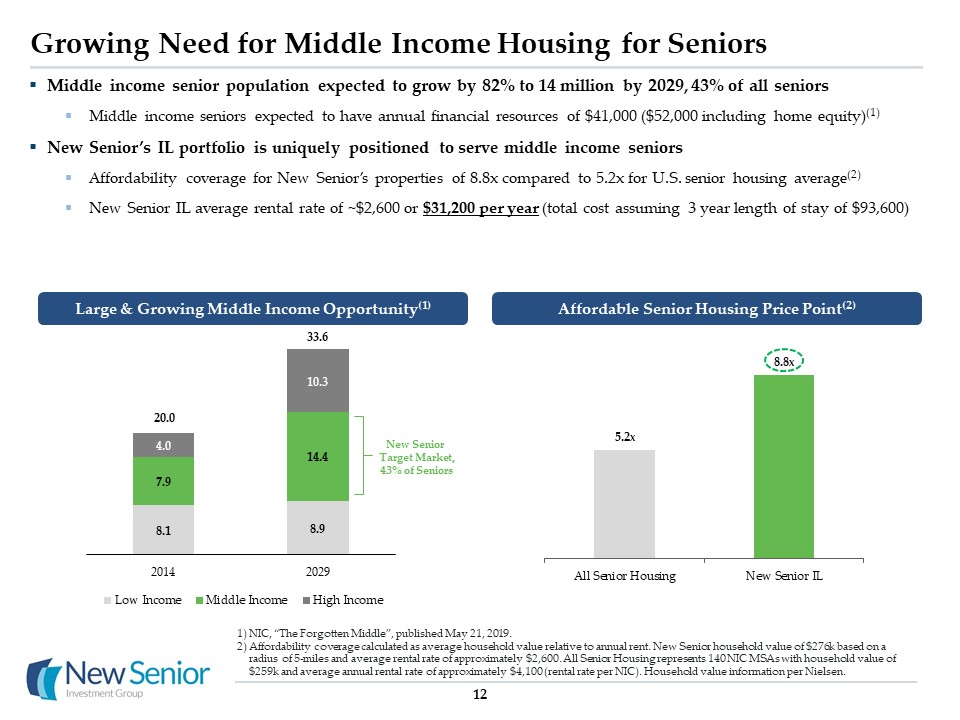
Growing Need for Middle Income Housing for Seniors NIC, “The Forgotten Middle”, published May 21,
2019.Affordability coverage calculated as average household value relative to annual rent. New Senior household value of $276k based on a radius of 5-miles and average rental rate of approximately $2,600. All Senior Housing represents 140 NIC
MSAs with household value of $259k and average annual rental rate of approximately $4,100 (rental rate per NIC). Household value information per Nielsen. 20.0 33.6 New Senior Target Market,43% of Seniors 12 Large & Growing Middle
Income Opportunity(1) Affordable Senior Housing Price Point(2) Middle income senior population expected to grow by 82% to 14 million by 2029, 43% of all seniorsMiddle income seniors expected to have annual financial resources of $41,000
($52,000 including home equity)(1)New Senior’s IL portfolio is uniquely positioned to serve middle income seniorsAffordability coverage for New Senior’s properties of 8.8x compared to 5.2x for U.S. senior housing average(2)New Senior IL average
rental rate of ~$2,600 or $31,200 per year (total cost assuming 3 year length of stay of $93,600)
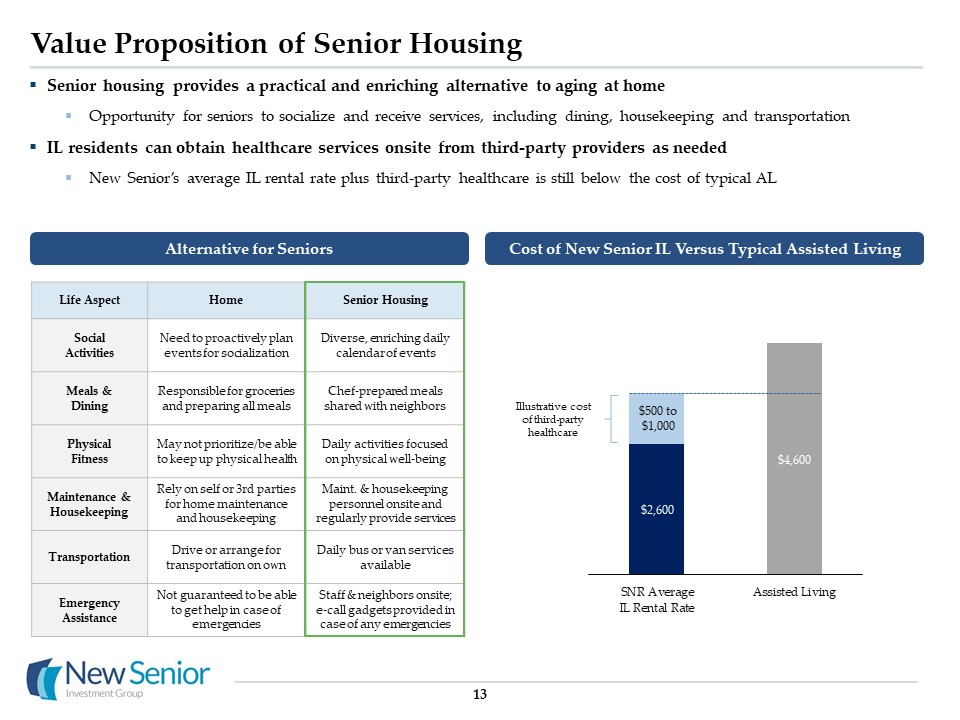
Value Proposition of Senior Housing Senior housing provides a practical and enriching alternative to aging
at homeOpportunity for seniors to socialize and receive services, including dining, housekeeping and transportationIL residents can obtain healthcare services onsite from third-party providers as neededNew Senior’s average IL rental rate plus
third-party healthcare is still below the cost of typical AL 13 Life Aspect Home Senior Housing Social Activities Need to proactively plan events for socialization Diverse, enriching daily calendar of events Meals &
Dining Responsible for groceries and preparing all meals Chef-prepared meals shared with neighbors Physical Fitness May not prioritize/be able to keep up physical health Daily activities focused on physical well-being Maintenance &
Housekeeping Rely on self or 3rd parties for home maintenance and housekeeping Maint. & housekeeping personnel onsite and regularly provide services Transportation Drive or arrange for transportation on own Daily bus or van services
available Emergency Assistance Not guaranteed to be able to get help in case of emergencies Staff & neighbors onsite; e-call gadgets provided in case of any emergencies Alternative for Seniors Cost of New Senior IL Versus Typical
Assisted Living Illustrative cost of third-party healthcare $500 to $1,000

14 Recent Company Updates Since January 2019, the Company has evolved by internalizing management,
selling its underperforming AL/MC portfolio and strengthening its balance sheet Completed internalization of management January 1, 2019 Reported earnings guidance for first timeCompleted relocation of headquarters February 2019 Completed
transitions of nine AL/MC properties to new operatorsClosed on the sale of one underperforming AL/MC propertyCompleted hires of General Counsel & Head of Corporate Strategy March & April 2019 Closed on the sale of a second
underperforming AL/MC propertyContinued corporate governance improvements including appointment of new independent directorExecuted interest rate swap to increase fixed rate debt exposure May & June 2019 Signed agreement to sell entire
AL/MC portfolio for a gross sale price of $385 million October 2019 Closed sale of AL/MC portfolioRepaid ~$360 million of debtCompleted ~$400 million of refinancing activity, resulting in lower debt costs and an extension of debt maturities by
two years Reported 2019 earnings & announced 2020 guidance February 2020 Reported 1Q20 earnings consistent with initial 2020 guidance Withdrew 2020 guidance due to COVID-19 pandemic Reduced dividend by 50% to preserve liquidity in period of
uncertainty May 2020 January 21, 2020 First COVID-19 case in US May 6, 2020 1.2 million COVID-19 cases in US 1Q 2019 2Q 2019 4Q 2019 1Q 2020 2Q 2020

COVID-19 Situation Update Simi HillsSimi Valley, CA

16 Operator Response to COVID-19 Protocol / Action Taken Operator A Operator B Operator C Operator
D Restricted access to non-essential visitors 3/14 3/19 3/9 3/13 Implemented enhanced screening process at entrance, including PPE requirements Closed dining rooms; in-room delivery only Closed resident access to
all common areas Enhanced Protocols Cancelled all group activities Enhanced Protocols Implemented quarantine for all residents Enhanced Protocols Daily temperature checks for residents / associates
Beginning early March, our operators took significant steps to stem the spread of the virus within our propertiesWhile protocols have been similar, experiences with the virus and local health agencies have varied
significantlyCertain health departments have been extremely involved, including coming onsite to test all residents and associatesSpread and impact of cases has also been inconsistent and unpredictableOur operators are currently developing phased
approaches to safely lift certain restrictions at our propertiesKey focus areas include: 1) physical tours & move-ins; 2) outside visitor access; 3) communal dining; and 4) activitiesExpect initiatives to incorporate additional testing (new
move-ins and potentially all residents and associates)

Residents Properties Active Recovered(3) Deceased Total IL: Properties with active cases
11 21 9 8 38 IL: Properties with previously active cases 4 - 4 1 5 IL: Total properties with positive cases reported 15 21 13 9 43 CCRC: Property with active cases 1 38 9 11 58 Total
Portfolio 16 59 22 20 101 Known COVID-19 Cases & Status(1) Case data as of 5/6/20.National data per Johns Hopkins University. Residents and associates are deemed “recovered” when, per CDC guidelines, either (1) two negative COVID-19
test results received or (2) no fever for at least 72 hours (without use of fever-reducing medicine), other symptoms have improved, and at least 14 days have passed since the date of a positive test. SNR Reported Positive COVID-19 Cases As of
May 6, 2020, our operators reported 141 positive cases across 16 properties (101 residents and 40 associates)Positive cases represent 0.9% of our 10,800 residents and 1.2% of our 3,300 associatesOf our total 101 resident cases, 58 have been
concentrated at our one large CCRC located in Philadelphia, PAHoliday Retirement (“Holiday”) is our largest operator & manages 98 of our 103 properties (94% of 1Q20 NOI)As of May 6, 2020, Holiday has reported 33 positive cases across 12
properties, representing 0.3% of total residentsEarly observation is that our secondary/tertiary markets have seen fewer positive cases as compared to national data(2) Unclear how these case rates will change as the pandemic continues and testing
becomes more readily availableWe expect the number of positive cases in our properties to increase as the virus continues to spread 17

Observations on March & April Results(1) 18 Leads: Down 42% compared to January / February
averagesMove-ins: Down 55% compared to January / February averages Move-outs: Down 9% compared to January / February averagesEnding occupancy: Declined an additional 120bps from 87.4% on March 31, 2020 to 86.2% on April 30,
2020 Occupancy Estimating NOI for the month of April to be down approximately 8 – 10% versus April 2019Temporarily suspended discretionary capital expenditure projects starting in mid-March Cash Flows Expect approximately $1 million of
COVID-19 related expenses, which represents an increase of +5% versus budgetThese incremental expenses were offset by lower variable costs primarily due to reduced occupancy levels As a result, total operating expenses were approximately $17
million, or in line with budget Operating Expenses April 2020 is based on preliminary results, which are subject to change. Began to see the impact of COVID-19 on our financial results in the second half of MarchEnding occupancy declined
130bps from 88.7% on February 29, 2020 to 87.4% on March 31, 2020Incurred approximately $0.5 million of COVID-19 related expenses, including PPE costs and additional suppliesApril was first full month that included the impact of COVID-19,
observations on the month are included belowCarefully monitoring key metrics to assess the short and long-term impacts of COVID-19 on our business
Financial Update The Chateau at HarvestonTemecula, CA

20 Same Store Results – 1Q 2020 1Q20 same store results were in line with expectations at the start of
the yearSame store cash NOI increased +0.1% year-over-year (excluding COVID-19 expenses, increased +1.5%)IL occupancy increased 10bps YoY / RevPOR increased 0.9% YoY / Margin decreased -40bps YoYBegan to see the impact of COVID-19 in second half
of March 2020, resulting in $0.5 million of expenses ($ in thousands) Quarterly YoY 1Q19 1Q20 Δ Occupancy 87.0% 87.1% 10bps RevPOR $2,683 $2,706 0.9% Margin 40.1% 39.7% (40bps) IL NOI (102 Properties) $33,646
$33,637 - Excluding COVID-19 Expenses $33,646 $34,138 1.5% Watermark (1 Property) 1,411 1,450 2.8% Total Same Store (103 Properties) $35,057 $35,087 0.1% Excluding COVID-19 Expenses $35,057 $35,588 1.5%

Potential Future Impact of COVID-19 21 Withdrawing 2020 full year guidance as a result of the
uncertainty surrounding the impact of COVID-19Based on estimated April results, the following is our view of the potential monthly impact from COVID-19:Occupancy: Monthly declines of 100 – 150bps (restrictions in place resulting in lower
move-ins)Expenses: Incremental COVID-19 expenses of 5 – 10% (partially offset by lower variable expenses) Assuming similar trends continue, 2Q20 could see occupancy down 320 – 420bps with NOI down 10 – 15% YoYUltimate impact of the COVID-19
pandemic will depend on a variety of factors, and it remains too early to estimate the complete effects of the pandemic on the Company’s future results Potential Future COVID-19 Impact Actual March 2020 Estimated April
2020 Illustrative Monthly Impact Illustrative 2Q20 Impact Notes Sequential Occupancy Decline (130bps) (120bps) (100bps) – (150bps) (320bps) – (420bps) Lower move-in volume partially offset by fewer move-outs End of Period
Occupancy 87.4% 86.2% - 83% – 84% Incremental COVID-19 Expenses 3% 5% 5% - 10% - Expect COVID-19 related expenses to be partially offset by lower variable costs IL YoY NOI Growth (1.5%) (8%) – (10%) - (10%) – (15%)

Capital Structure, Debt Maturities & Liquidity(1) All information is presented as of 3/31/2020. Pro
forma information is included for illustrative purposes only. 2022 maturity (secured loan) has two, 1-year extension options with the payment of a 12.5bps extension fee. 22 Amounts % of Total W.A. Maturity in Years 1Q20 Rate Pro Forma
Rate atLIBOR Spot Fixed $815 51% 5.3 years 4.4% 4.4% Floating 790 49% 6.2 years 3.7% 2.5% Total Debt $1,604 100% 6.0 years 4.0% 3.4% As of March 31, 2020, 49% of total debt is comprised of floating rate debtOne-month LIBOR
has declined from 1.7% at the beginning of 2020 to 0.2% as of May 6, 2020Floating rate debt coupon of 3.7% in 1Q20 would decline to 2.5% at current one-month LIBOR spot rateAt current one-month LIBOR spot rate, interest expense would be $9
million lower on an annualized basisAs of March 31, 2020, the Company had $135.1 million of cash and cash equivalentsDrew $100 million on revolver in early March as pandemic was emerging – expect to repay portion in 2Q20 or 3Q20No significant
debt maturities until 2024 Capital Structure Debt Maturity Schedule ($ in millions) ($ in millions) (2)
Reconciliations & Glossary Marion WoodsOcala, FL

NOI Reconciliation – 1Q 2020 Year-over-Year(1) ($ in thousands) 24 Totals may not sum due to
rounding.Includes amortization of deferred community fees and other, which includes the net change in deferred community fees and other rent discounts or incentives. 1Q20 1Q19 Managed IL Properties Other
Properties Total Managed IL Properties Other Properties Total Same Store Cash NOI (excluding COVID-19 related expenses) $ 34,138 $ 1,450 $ 35,588 $ 33,646 $ 1,411 $ 35,057 COVID-19 related
expenses (501) - (501) - - - Same Store Cash NOI 33,637 1,450 35,087 33,646 1,411 35,057 Non-Same Store Cash NOI - - - - (249) (249) Straight-line rental revenue - 134 134 - 206 206 Amortization of
deferred community fees and other(2) 305 (2) 303 (620) (2) (622) Segment / Total NOI $ 33,942 $ 1,582 $ 35,525 $ 33,026 $ 1,366 $ 34,392 Interest expense (17,219)
(19,850) Depreciation and amortization (17,536) (16,994) General and administrative expense (5,846) (4,978) Acquisition, transaction & integration expense (133) (492) Loss on extinguishment of
debt (5,884) - Other income (expense) 105 (1,315) Income tax expense (60) (36) Loss from continuing operations (11,048) (9,273) Gain on sale of real estate 19,992 - Loss from
discontinued operations (3,107) (1,920) Discontinued operations, net 16,885 (1,920) Net income (loss) $ 5,837 $ (11,193) Deemed dividend on redeemable preferred stock (598)
(598) Net income (loss) attributable to common stockholders $ 5,239 $ (11,791)
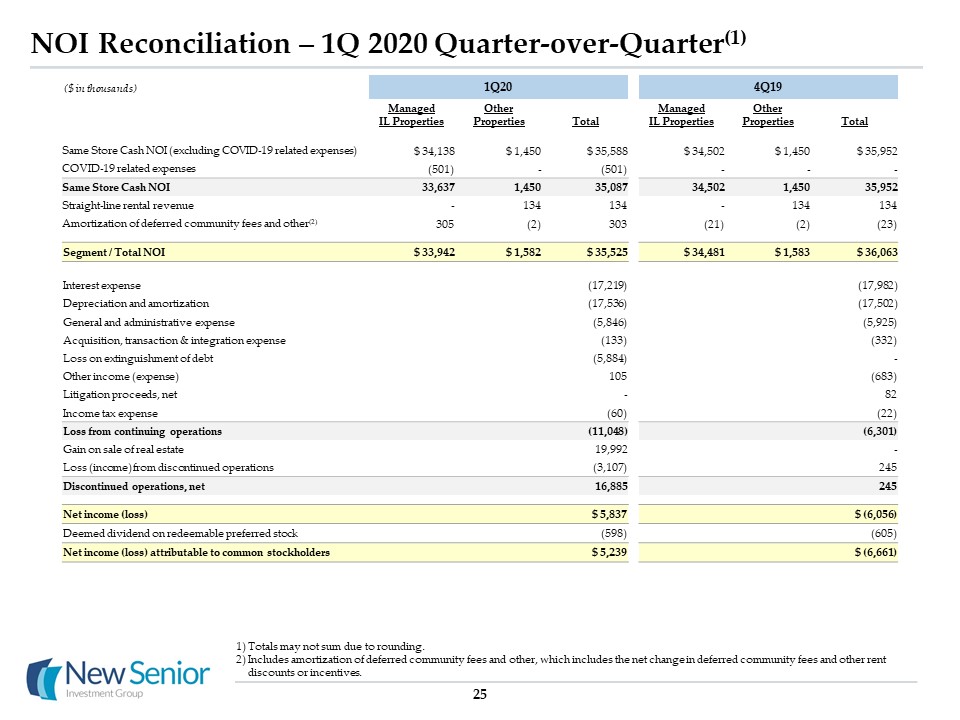
NOI Reconciliation – 1Q 2020 Quarter-over-Quarter(1) 25 Totals may not sum due to rounding.Includes
amortization of deferred community fees and other, which includes the net change in deferred community fees and other rent discounts or incentives. 1Q20 4Q19 Managed IL Properties Other Properties Total Managed IL
Properties Other Properties Total Same Store Cash NOI (excluding COVID-19 related expenses) $ 34,138 $ 1,450 $ 35,588 $ 34,502 $ 1,450 $ 35,952 COVID-19 related expenses (501) - (501) - - - Same Store Cash
NOI 33,637 1,450 35,087 34,502 1,450 35,952 Straight-line rental revenue - 134 134 - 134 134 Amortization of deferred community fees and other(2) 305 (2) 303 (21) (2) (23) Segment /
Total NOI $ 33,942 $ 1,582 $ 35,525 $ 34,481 $ 1,583 $ 36,063 Interest expense (17,219) (17,982) Depreciation and amortization (17,536) (17,502) General and administrative expense
(5,846) (5,925) Acquisition, transaction & integration expense (133) (332) Loss on extinguishment of debt (5,884) - Other income (expense) 105 (683) Litigation proceeds, net - 82
Income tax expense (60) (22) Loss from continuing operations (11,048) (6,301) Gain on sale of real estate 19,992 - Loss (income) from discontinued operations (3,107) 245 Discontinued
operations, net 16,885 245 Net income (loss) $ 5,837 $ (6,056) Deemed dividend on redeemable preferred stock (598) (605) Net income (loss) attributable to common stockholders $
5,239 $ (6,661) ($ in thousands)

GAAP Reconciliation of FFO, Normalized FFO, AFFO and Normalized FAD 26 Includes amounts related to 28
AL/MC properties that were classified as discontinued operations as of 12/31/2019 and sold in February 2020. Primarily includes insurance recoveries and casualty related charges.Includes amortization of deferred community fees and other, which
includes the net change in deferred community fees and other rent discounts or incentives. 1Q20 Net income $ 5,239 Add (Deduct)(1): Gain on sale of real estate (19,992) Depreciation and amortization 17,536 FFO $ 2,783 FFO
per Diluted Share $ 0.03 Acquisition, transaction and integration expense 1,170 Loss on extinguishment of debt 9,486 Compensation expense related to transition awards 390 Other income(2) (294) Normalized FFO $
13,535 Normalized FFO per Diluted Share $ 0.16 Straight-line rent (134) Amortization of deferred financing costs 906 Amortization of deferred community fees and other(3) (1,314) Amortization of equity-based
compensation 1,106 AFFO $ 14,099 AFFO per Diluted Share $ 0.17 Routine capital expenditures (1,865) Normalized FAD $ 12,234 Normalized FAD per Diluted Share $ 0.15 ($ and shares in thousands, except per share
data) AFFO $14,099 COVID-19 related expenses 501 AFFO Excluding COVID-19 related expenses $ 14,600 AFFO Excluding COVID-19 related expenses per Diluted Share $ 0.17 Weighted average diluted shares outstanding 83,914

Glossary Cash NOI MarginCash NOI margin is equal to Cash NOI divided by Cash Revenue.Discontinued
OperationsDiscontinued operations consists of 28 AL/MC properties that represented the entire Managed AL/MC Properties segment prior to the fourth quarter of 2019 and were classified as discontinued operations as of December 31, 2019. The
properties were subsequently sold in February 2020. EBITDARMEBITDARM is a non-GAAP measure that represents earnings before interest, taxes, depreciation, amortization, rent and management fees for the period stated unless otherwise noted. We use
EBITDARM in determining coverage and as a supplemental measure of the ability of the property to generate sufficient liquidity to meet related obligations to us. For our triple net lease portfolio, all facility financial performance data was
derived solely from information provided by operators/tenants without independent verification by us. EBITDARM does not represent net income or cash flow from operations and should not be considered an alternative to those indications. EBITDARM
CoverageFacility EBITDARM divided by the aggregate of base rent and any additional rent due to us for the same period. EBITDARM coverage is a supplemental measure of a property’s ability to generate cash flows for the operator/tenant (not for us)
to meet the operator’s/tenant’s related rent and other obligations to us. Enterprise ValueEnterprise value is equal to market capitalization plus carrying value of mortgage notes payable, minus cash. FFO, Normalized FFO, AFFO and Normalized FADWe
use Funds From Operations ("FFO") and Normalized FFO as supplemental measures of our operating performance. We use the National Association of Real Estate Investment Trusts ("NAREIT") definition of FFO. NAREIT defines FFO as GAAP net income
(loss) attributable to common stockholders, which includes loss from discontinued operations, excluding gains (losses) from sales of depreciable real estate assets and impairment charges of depreciable real estate, plus real estate depreciation
and amortization, and after adjustments for unconsolidated entities and joint ventures to reflect FFO on the same basis. FFO does not account for debt principal payments and is not intended as a measure of a REIT’s ability to satisfy such
payments or any other cash requirements. FFO, Normalized FFO, AFFO and Normalized FAD (continued)Normalized FFO, as defined below, measures the financial performance of our portfolio of assets excluding items that, although incidental to, are
not reflective of the day-to-day operating performance of our portfolio of assets. We believe that Normalized FFO is useful because it facilitates the evaluation of our portfolio’s operating performance (i) between periods on a consistent basis
and (ii) to the operating performance of other real estate companies. However, comparability may be limited because our calculation of Normalized FFO may differ significantly from that of other companies, or because of features of our business
that are not present in other companies.We define Normalized FFO as FFO excluding the following income and expense items, as applicable: (a) acquisition, transaction and integration related expenses; (b) the write off of unamortized discounts,
premiums, deferred financing costs, or additional costs, make whole payments and penalties or premiums incurred as the result of early repayment of debt (collectively “Gain (Loss) on extinguishment of debt”); (c) incentive compensation recognized
as a result of sales of real estate; (d) the remeasurement of deferred tax assets; (e) valuation allowance on deferred tax assets, net; (f) termination fee to Former affiliate; (g) gain on lease termination; (h) compensation expense related to
transition awards; (i) litigation proceeds; and (j) other items that we believe are not indicative of operating performance, generally reported as “Other (income) expense” in the Consolidated Statements of Operations. We also use AFFO and
Normalized FAD as supplemental measures of our operating performance. We believe AFFO is useful because it facilitates the evaluation of (i) the current economic return on our portfolio of assets between periods on a consistent basis and (ii) our
portfolio versus those of other real estate companies that report AFFO. However, comparability may be limited because our calculation of AFFO may differ significantly from that of other companies, or because of features of our business that are
not present in other companies. We define AFFO as Normalized FFO excluding the impact of the following: (a) straight-line rents; (b) amortization of above / below market lease intangibles; (c) amortization of deferred financing costs; (d)
amortization of premium or discount on mortgage notes payable; (e) amortization of deferred community fees and other, which includes the net change in deferred community fees and other rent discounts or incentives and (f) amortization of
equity-based compensation expense. 27

Glossary FFO, Normalized FFO, AFFO and Normalized FAD (continued)We define Normalized FAD as AFFO less
routine capital expenditures, which we view as a cost associated with the current economic return. Normalized FAD, which does not reflect debt principal payments and certain other expenses, does not represent cash available for distribution to
stockholders. We believe Normalized FAD is useful because it fully reflects the additional economic costs of maintaining the condition of the portfolio.Gross Assets The carrying amount of total assets, after adding back accumulated depreciation
and amortization, as reported in our consolidated financial statements. Investment Represents the carrying amount of real estate assets, including intangibles, after adding back accumulated depreciation and amortization, for all assets owned as
of the end of the respective reporting period. Net Operating Income (“NOI”) and Cash NOINOI and cash NOI are non-GAAP measures. We define NOI as total revenue less property operating expenses, which include property management fees and travel
cost reimbursements. Cash receipts may differ due to straight-line recognition of certain rental income and the application of other GAAP policies. We define cash NOI as NOI excluding the effects of straight-line rental revenue, amortization of
above / below market lease intangibles and amortization of deferred community fees and other, which includes the net change in deferred community fees and other rent discounts or incentives. We believe that NOI and cash NOI serve as useful
supplemental measures to net income because they allow investors, analysts and management to measure unlevered property-level operating results and to compare our operating results between periods and to the operating results of other real estate
companies on a consistent basis. 28 Occupancy For the managed portfolio, occupancy represents the facilities’ average operating occupancy for the applicable period. For the triple net lease portfolio, occupancy is based on the period reported
unless otherwise noted. The percentages are calculated based on available beds. All occupancy data was derived solely from information provided by operators/tenants without independent verification by us. RevPORRepresents average cash revenues
per occupied bed per month. We use RevPOR to evaluate the revenue generating potential of our senior housing portfolio independent of fluctuating occupancy rates.Same Store and Adjusted Same StoreSame store data presented herein excludes
properties acquired, sold, transitioned to other operators or between segments, or classified as held for sale or discontinued operations during the comparable periods. Same store data is intended to enable management to evaluate the performance
of a consistent portfolio of real estate in a manner that eliminates variances attributable to changes in the composition of our portfolio over time, due to sales and various other factors. Upon implementation of ASC 842 on 1/1/2019, bad debt
expense is required to offset revenue as opposed to being included in operating expense under previous guidance. Accordingly, we have reclassified bad debt expense for prior years to offset revenue in order to facilitate a historical comparison.
The change has no impact on the Company’s NOI or Cash NOI.Adjusted same store cash NOI adjusts same store cash NOI to include properties transitioned from the Company’s triple net lease segment to the managed segment during the comparative
periods. For the period during which the properties were owned on a triple net basis, cash NOI reflects the unaudited operating results provided by the operator, as opposed to the rent recorded by the Company, and excludes ancillary service
revenue attributable to a business that ceased operations over the course of 2018.