Attached files
| file | filename |
|---|---|
| EX-32.2 - EXHIBIT 32.2 - Luther Burbank Corp | lbcex322_1q2020.htm |
| EX-32.1 - EXHIBIT 32.1 - Luther Burbank Corp | lbcex321_1q2020.htm |
| EX-31.2 - EXHIBIT 31.2 - Luther Burbank Corp | lbcex312_1q2020.htm |
| EX-31.1 - EXHIBIT 31.1 - Luther Burbank Corp | lbcex311_1q2020.htm |
UNITED STATES
SECURITIES AND EXCHANGE COMMISSION
Washington, D.C. 20549
FORM 10-Q
x QUARTERLY REPORT PURSUANT TO SECTION 13 OR 15(d) OF THE SECURITIES EXCHANGE ACT OF 1934
For the quarterly period ended March 31, 2020
OR
o TRANSITION REPORT PURSUANT TO SECTION 13 OR 15(d) OF THE SECURITIES EXCHANGE ACT OF 1934
Commission file number 001-38317
Luther Burbank Corporation
(Exact name of registrant as specified in its charter)
California (State or other jurisdiction of incorporation or organization) | 68-0270948 (I.R.S. employer identification number) | |
520 Third St, Fourth Floor, Santa Rosa, California (Address of principal executive offices) | 95401 (Zip Code) | |
Registrant's telephone number, including area code: (844) 446-8201
Securities Registered Pursuant to Section 12(b) of the Act | ||||
Title of Each Class | Trading Symbol | Name of Each Exchange on Which Registered | ||
Common stock, no par value | LBC | The Nasdaq Stock Market LLC | ||
Indicate by check mark whether the registrant (1) has filed all reports required to be filed by Section 13 or 15(d) of the Securities Exchange Act of 1934 during the preceding twelve months (or for such shorter period that the registrant was required to file such reports), and (2) has been subject to such filing requirements for the past 90 days. YES x NO o
Indicate by checkmark whether the registrant has submitted electronically every Interactive Data File required to be submitted pursuant to Rule 405 of Regulation S-T (§232.405 of this chapter) during the preceding 12 months (or for such shorter period that the registrant was required to submit such files). YES x NO o
Indicate by checkmark whether the registrant is a large accelerated filer, an accelerated filer, a non-accelerated filer, a smaller reporting company, or an emerging growth company. See definitions of "large accelerated filer", "accelerated filer", "smaller reporting company" and "emerging growth company" in Rule 12b-2 of the Exchange Act.
Large accelerated filer | o | Accelerated filer | x | |
Non-accelerated filer | o | Smaller Reporting Company | x | |
Emerging Growth Company | x | |||
If an emerging growth company, indicate by check mark if the registrant has elected not to use the extended transition period for complying with any new or revised financial accounting standards provided pursuant to Section 13(a) of the Exchange Act. o
Indicate by check mark whether the registrant is a shell company (as defined in Rule 12b-2 of the Act): Yes o No x
As of May 1, 2020, there were 52,951,276 shares of the registrant’s common stock, no par value, outstanding.
Table of Contents
Page | ||
PART I - FINANCIAL INFORMATION | ||
Item 2. | ||
Item 3. | ||
Item 4. | ||
PART II - OTHER INFORMATION | ||
Item 1. | ||
Item 1A. | ||
1
Safe Harbor Statement under the Private Securities Litigation Reform Act of 1995
This Quarterly Report on Form 10-Q may contain forward-looking statements within the meaning of Section 27A of the Securities Act of 1933, as amended, and Section 21E of the Securities Exchange Act of 1934, as amended. You can find many (but not all) of these statements by looking for words such as “approximates,” “believes,” “expects,” “anticipates,” “estimates,” “intends,” “plans,” “would,” “may” and other similar expressions in this Quarterly Report on Form 10-Q. With respect to any such forward-looking statements, the Company claims the protection of the safe harbor provided for in the Private Securities Litigation Reform Act of 1995, as amended. The Company cautions investors that any forward-looking statements presented in this Quarterly Report on Form 10-Q, or those that the Company may make orally or in writing from time to time, are based on the beliefs of, assumptions made by, and information available to, management at the time such statements are first made. Actual outcomes will be affected by known and unknown risks, trends, uncertainties and factors that are beyond the Company’s control or ability to predict. Although the Company believes that management’s beliefs and assumptions are reasonable, they are not guarantees of future performance and some will inevitably prove to be incorrect. As a result, the Company’s actual future results can be expected to differ from management’s expectations, and those differences may be material and adverse to the Company’s business, results of operations and financial condition. Accordingly, investors should use caution in placing any reliance on forward-looking statements to anticipate future results or trends.
The coronavirus disease 2019 ("COVID-19") pandemic is adversely affecting us, our customers, counterparties, employees, and third-party service providers, and the ultimate extent of the impacts on our business, financial position, results of operations, liquidity, and prospects is uncertain. Continued deterioration in general business and economic conditions, including further increases in unemployment rates, or turbulence in domestic or global financial markets could adversely affect our revenues and the values of our assets and liabilities, reduce the availability of funding, lead to a tightening of credit, and further increase stock price volatility. In addition, changes to statutes, regulations, or regulatory policies or practices as a result of, or in response to COVID-19, could affect us in substantial and unpredictable ways. Some of the other risks and uncertainties that may cause the Company’s actual results, performance or achievements to differ materially from those expressed include, but are not limited to, the following: the impact of changes in interest rates; political instability; changes in the monetary policies of the U.S. Government; a decline in economic conditions; deterioration in the value of West Coast real estate, both residential and commercial; an increase in the level of non-performing assets and charge-offs; further increased competition among financial institutions; the Company’s ability to continue to attract deposits and quality loan customers; further government regulation, including regulations regarding capital requirements, and the implementation and costs associated with the same; internal and external fraud and cyber-security threats including the loss of bank or customer funds, loss of system functionality or the theft or loss of data; management’s ability to successfully manage the Company’s operations; and the other risks set forth in the Company’s reports filed with the U.S. Securities and Exchange Commission. For further discussion of these and other factors, see “Item 1A. Risk Factors” in Part II of this Quarterly Report on Form 10-Q and the Company’s 2019 Annual Report on Form 10-K.
Any forward-looking statements in this Quarterly Report on Form 10-Q and all subsequent written and oral forward-looking statements attributable to the Company or any person acting on behalf of the Company are expressly qualified in their entirety by the cautionary statements contained or referred to in this section. The Company does not undertake any obligation to release publicly any revisions to forward-looking statements to reflect events or circumstances after the date such forward-looking statements are made, and hereby specifically disclaims any intention to do so, unless required by law.
2
PART I.
Item 1. Financial Statements
LUTHER BURBANK CORPORATION
CONSOLIDATED STATEMENTS OF FINANCIAL CONDITION
(Dollar amounts in thousands)
March 31, 2020 (unaudited) | December 31, 2019 | ||||||
ASSETS | |||||||
Cash, cash equivalents and restricted cash | $ | 123,248 | $ | 91,325 | |||
Available for sale debt securities, at fair value | 641,474 | 625,074 | |||||
Held to maturity debt securities, at amortized cost (fair value of $10,132 and $10,349 at March 31, 2020 and December 31, 2019, respectively) | 9,732 | 10,170 | |||||
Equity securities, at fair value | 11,970 | 11,782 | |||||
Loans receivable, net of allowance for loan losses of $40,657 and $36,001 at March 31, 2020 and December 31, 2019, respectively | 6,177,657 | 6,194,976 | |||||
Accrued interest receivable | 20,823 | 20,814 | |||||
Federal Home Loan Bank ("FHLB") stock, at cost | 29,612 | 30,342 | |||||
Premises and equipment, net | 19,792 | 19,504 | |||||
Goodwill | 3,297 | 3,297 | |||||
Prepaid expenses and other assets | 36,445 | 38,544 | |||||
Total assets | $ | 7,074,050 | $ | 7,045,828 | |||
LIABILITIES AND STOCKHOLDERS' EQUITY | |||||||
Liabilities: | |||||||
Deposits | $ | 5,285,376 | $ | 5,234,717 | |||
FHLB advances | 953,694 | 978,702 | |||||
Junior subordinated deferrable interest debentures | 61,857 | 61,857 | |||||
Senior debt | |||||||
$95,000 face amount, 6.5% interest rate, due September 30, 2024 (less debt issuance costs of $553 and $584 at March 31, 2020 and December 31, 2019, respectively) | 94,447 | 94,416 | |||||
Accrued interest payable | 2,635 | 2,901 | |||||
Other liabilities and accrued expenses | 72,701 | 58,771 | |||||
Total liabilities | 6,470,710 | 6,431,364 | |||||
Commitments and contingencies (Note 16) | |||||||
Stockholders' equity: | |||||||
Preferred stock, no par value; 5,000,000 shares authorized; none issued and outstanding at March 31, 2020 and December 31, 2019 | — | — | |||||
Common stock, no par value; 100,000,000 shares authorized; 54,286,465 and 55,999,754 shares issued and outstanding at March 31, 2020 and December 31, 2019, respectively | 431,578 | 447,784 | |||||
Retained earnings | 169,572 | 165,236 | |||||
Accumulated other comprehensive income, net of taxes | 2,190 | 1,444 | |||||
Total stockholders' equity | 603,340 | 614,464 | |||||
Total liabilities and stockholders' equity | $ | 7,074,050 | $ | 7,045,828 | |||
See accompanying notes to unaudited consolidated financial statements
3
LUTHER BURBANK CORPORATION
CONSOLIDATED STATEMENTS OF INCOME (UNAUDITED)
(Dollar amounts in thousands, except per share data)
Three Months Ended March 31, | ||||||||
2020 | 2019 | |||||||
Interest and fee income: | ||||||||
Loans | $ | 60,705 | $ | 61,053 | ||||
Investment securities | 3,303 | 3,925 | ||||||
Cash, cash equivalents and restricted cash | 317 | 400 | ||||||
Total interest and fee income | 64,325 | 65,378 | ||||||
Interest expense: | ||||||||
Deposits | 24,581 | 24,288 | ||||||
FHLB advances | 5,558 | 6,772 | ||||||
Junior subordinated deferrable interest debentures | 493 | 651 | ||||||
Senior debt | 1,578 | 1,575 | ||||||
Total interest expense | 32,210 | 33,286 | ||||||
Net interest income before provision for loan losses | 32,115 | 32,092 | ||||||
Provision for loan losses | 5,300 | 300 | ||||||
Net interest income after provision for loan losses | 26,815 | 31,792 | ||||||
Noninterest income: | ||||||||
Gain on sale of loans | — | 333 | ||||||
FHLB dividends | 535 | 495 | ||||||
Other income | 263 | 552 | ||||||
Total noninterest income | 798 | 1,380 | ||||||
Noninterest expense: | ||||||||
Compensation and related benefits | 11,205 | 10,052 | ||||||
Deposit insurance premium | 476 | 498 | ||||||
Professional and regulatory fees | 431 | 441 | ||||||
Occupancy | 1,140 | 1,390 | ||||||
Depreciation and amortization | 669 | 665 | ||||||
Data processing | 967 | 919 | ||||||
Marketing | 875 | 1,154 | ||||||
Other expenses | 1,096 | 1,130 | ||||||
Total noninterest expense | 16,859 | 16,249 | ||||||
Income before provision for income taxes | 10,754 | 16,923 | ||||||
Provision for income taxes | 3,178 | 4,913 | ||||||
Net income | $ | 7,576 | $ | 12,010 | ||||
Basic earnings per common share | $ | 0.14 | $ | 0.21 | ||||
Diluted earnings per common share | $ | 0.14 | $ | 0.21 | ||||
Dividends per common share | $ | 0.06 | $ | 0.06 | ||||
See accompanying notes to unaudited consolidated financial statements
4
LUTHER BURBANK CORPORATION
CONSOLIDATED STATEMENTS OF COMPREHENSIVE INCOME (UNAUDITED)
(Dollar amounts in thousands)
Three Months Ended March 31, | |||||||
2020 | 2019 | ||||||
Net income | $ | 7,576 | $ | 12,010 | |||
Other comprehensive income: | |||||||
Unrealized gain on available for sale debt securities: | |||||||
Unrealized holding gain arising during the period | 1,051 | 2,504 | |||||
Tax effect | (305 | ) | (724 | ) | |||
Net of tax | 746 | 1,780 | |||||
Unrealized gain on cash flow hedge: | |||||||
Unrealized holding gain arising during the period | — | 147 | |||||
Tax effect | — | (43 | ) | ||||
Net of tax | — | 104 | |||||
Total other comprehensive income | 746 | 1,884 | |||||
Comprehensive income | $ | 8,322 | $ | 13,894 | |||
See accompanying notes to unaudited consolidated financial statements
5
LUTHER BURBANK CORPORATION
CONSOLIDATED STATEMENTS OF CHANGES IN STOCKHOLDERS' EQUITY (UNAUDITED)
(Dollar amounts in thousands, except per share data)
Accumulated Other Comprehensive (Loss) Income (Net of Taxes) | Total Stockholders' Equity | |||||||||||||||||||||
Common Stock | Retained Earnings | Available for Sale Securities | Cash Flow Hedge | |||||||||||||||||||
Shares | Amount | |||||||||||||||||||||
Balance, December 31, 2018 | 56,379,066 | $ | 456,378 | $ | 129,806 | $ | (4,935 | ) | $ | (104 | ) | $ | 581,145 | |||||||||
Cumulative effect of change in accounting principal (1) | — | — | (399 | ) | 399 | — | — | |||||||||||||||
Comprehensive income: | ||||||||||||||||||||||
Net income | — | — | 12,010 | — | — | 12,010 | ||||||||||||||||
Other comprehensive income | — | — | — | 1,780 | 104 | 1,884 | ||||||||||||||||
Issuance of restricted stock awards | 297,663 | — | — | — | — | — | ||||||||||||||||
Settled restricted stock units | 112,302 | — | — | — | — | — | ||||||||||||||||
Shares withheld to pay taxes on stock based compensation | (41,522 | ) | (404 | ) | — | — | — | (404 | ) | |||||||||||||
Restricted stock forfeitures | (2,728 | ) | (2 | ) | 1 | — | — | (1 | ) | |||||||||||||
Stock based compensation expense | — | 840 | — | — | — | 840 | ||||||||||||||||
Shares repurchased | (393,000 | ) | (3,881 | ) | — | — | — | (3,881 | ) | |||||||||||||
Cash dividends ($0.06 per share) | — | — | (3,295 | ) | — | — | (3,295 | ) | ||||||||||||||
Balance, March 31, 2019 | 56,351,781 | $ | 452,931 | $ | 138,123 | $ | (2,756 | ) | $ | — | $ | 588,298 | ||||||||||
Balance, December 31, 2019 | 55,999,754 | $ | 447,784 | $ | 165,236 | $ | 1,444 | $ | — | $ | 614,464 | |||||||||||
Comprehensive income: | ||||||||||||||||||||||
Net income | — | — | 7,576 | — | — | 7,576 | ||||||||||||||||
Other comprehensive income | — | — | — | 746 | — | 746 | ||||||||||||||||
Issuance of restricted stock awards | 250,118 | — | — | — | — | — | ||||||||||||||||
Settled restricted stock units | 70,220 | — | — | — | — | — | ||||||||||||||||
Shares withheld to pay taxes on stock based compensation | (53,824 | ) | (563 | ) | — | — | — | (563 | ) | |||||||||||||
Restricted stock forfeitures | (17,408 | ) | (8 | ) | 6 | — | — | (2 | ) | |||||||||||||
Stock based compensation expense | — | 911 | — | — | — | 911 | ||||||||||||||||
Shares repurchased | (1,962,395 | ) | (16,546 | ) | — | — | — | (16,546 | ) | |||||||||||||
Cash dividends ($0.06 per share) | — | — | (3,246 | ) | — | — | (3,246 | ) | ||||||||||||||
Balance, March 31, 2020 | 54,286,465 | $ | 431,578 | $ | 169,572 | $ | 2,190 | $ | — | $ | 603,340 | |||||||||||
(1) Represents the impact of adopting Accounting Standards Update ("ASU") 2016-01. See Note 3 to the unaudited consolidated financial statements for further information. | ||||||||||||||||||||||
See accompanying notes to unaudited consolidated financial statements
6
LUTHER BURBANK CORPORATION
CONSOLIDATED STATEMENTS OF CASH FLOWS (UNAUDITED)
(Dollar amounts in thousands)
Three Months Ended March 31, | |||||||
2020 | 2019 | ||||||
Cash flows from operating activities: | |||||||
Net income | $ | 7,576 | $ | 12,010 | |||
Adjustments to reconcile net income to net cash provided by operating activities: | |||||||
Depreciation and amortization | 669 | 665 | |||||
Provision for loan losses | 5,300 | 300 | |||||
Amortization of deferred loan costs, net | 3,725 | 2,646 | |||||
Amortization of premiums on investment securities, net | 487 | 362 | |||||
Gain on sale of loans | — | (333 | ) | ||||
Stock based compensation expense, net of forfeitures | 903 | 838 | |||||
Change in fair value of mortgage servicing rights | 395 | 146 | |||||
Change in fair value of equity securities | (188 | ) | (144 | ) | |||
Other items, net | (40 | ) | — | ||||
Effect of changes in: | |||||||
Accrued interest receivable | (9 | ) | (1,072 | ) | |||
Accrued interest payable | (266 | ) | 1,169 | ||||
Prepaid expenses and other assets | (1,332 | ) | 1,543 | ||||
Other liabilities and accrued expenses | (1,423 | ) | (868 | ) | |||
Net cash provided by operating activities | 15,797 | 17,262 | |||||
Cash flows from investing activities: | |||||||
Proceeds from maturities, paydowns and calls of available for sale debt securities | 92,128 | 16,263 | |||||
Proceeds from maturities and paydowns of held to maturity debt securities | 416 | 399 | |||||
Purchases of available for sale debt securities | (107,942 | ) | (44,377 | ) | |||
Net decrease (increase) in loans receivable | 46,956 | (69,765 | ) | ||||
Proceeds from loans held for sale previously classified as portfolio loans | — | 53,772 | |||||
Purchase of loans | (20,507 | ) | — | ||||
Redemption (purchase) of FHLB stock, net | 730 | (224 | ) | ||||
Purchase of premises and equipment | (957 | ) | (157 | ) | |||
Net cash provided by (used in) investing activities | 10,824 | (44,089 | ) | ||||
Cash flows from financing activities: | |||||||
Net increase in customer deposits | 50,659 | 80,791 | |||||
Proceeds from long-term FHLB advances | 126,500 | 75,000 | |||||
Repayment of long-term FHLB advances | (150,008 | ) | (7 | ) | |||
Net change in short-term FHLB advances | (1,500 | ) | (108,500 | ) | |||
Shares withheld for taxes on vested restricted stock | (563 | ) | (404 | ) | |||
Shares repurchased | (16,546 | ) | (3,881 | ) | |||
Cash paid for dividends | (3,240 | ) | (3,294 | ) | |||
Net cash provided by financing activities | 5,302 | 39,705 | |||||
Increase in cash, cash equivalents and restricted cash | 31,923 | 12,878 | |||||
Cash, cash equivalents and restricted cash, beginning of period | 91,325 | 91,697 | |||||
Cash, cash equivalents and restricted cash, end of period | $ | 123,248 | $ | 104,575 | |||
Supplemental disclosure of cash flow information: | |||||||
Cash paid during the period for: | |||||||
Interest | $ | 32,476 | $ | 32,117 | |||
Income taxes | $ | 410 | $ | 10 | |||
Non-cash investing activity: | |||||||
Loans transferred to held for sale | $ | — | $ | 53,559 | |||
See accompanying notes to unaudited consolidated financial statements
7
LUTHER BURBANK CORPORATION
NOTES TO UNAUDITED CONSOLIDATED FINANCIAL STATEMENTS
1. | NATURE OF OPERATIONS |
Organization
Luther Burbank Corporation (the ‘‘Company’’), a California corporation headquartered in Santa Rosa, is the bank holding company for its wholly-owned subsidiary, Luther Burbank Savings (the "Bank"), and its wholly-owned subsidiary, Burbank Investor Services. The Company also owns Burbank Financial Inc., a real estate investment company, and all the common interests in Luther Burbank Statutory Trusts I and II, entities created to issue trust preferred securities.
The Bank conducts its business from its headquarters in Gardena, California. It has ten full service branches in California located in Sonoma, Marin, Santa Clara, and Los Angeles Counties and one full service branch in Washington located in King County. Additionally, there are seven loan production offices located throughout California, as well as a loan production office in Clackamas County, Oregon.
Basis of Presentation
The accompanying unaudited consolidated financial statements have been prepared in accordance with the instructions to Form 10-Q and, therefore, do not include all footnotes as would be necessary for a fair presentation of financial position, results of operations and comprehensive income, changes in stockholders’ equity and cash flows in conformity with accounting principles generally accepted in the United States of America (“GAAP”). However, these interim unaudited consolidated financial statements reflect all adjustments (consisting solely of normal recurring adjustments and accruals) which, in the opinion of management, are necessary for a fair presentation of financial position, results of operations and comprehensive income, changes in stockholders’ equity and cash flows for the interim periods presented. These unaudited consolidated financial statements have been prepared on a basis consistent with, and should be read in conjunction with, the audited consolidated financial statements as of and for the year ended December 31, 2019, and the notes thereto, included in the Company’s Annual Report on Form 10-K for the year ended December 31, 2019 filed with the Securities and Exchange Commission (the “SEC”), under the Securities and Exchange Act of 1934, as amended (the “Exchange Act”). The unaudited consolidated financial statements include the accounts of the Company and its subsidiaries. All intercompany accounts and transactions have been eliminated.
The results of operations for the three months ended March 31, 2020 are not necessarily indicative of the results of operations that may be expected for any other interim period or for the year ending December 31, 2020.
The Company’s accounting and reporting policies conform to GAAP and to general practices within the banking industry.
Use of Estimates
Management is required to make estimates and assumptions that affect the reported amounts of assets and liabilities and disclosure of contingent assets and liabilities at the date of the unaudited consolidated financial statements and the reported amounts of revenues and expenses during the reporting period. These estimates and assumptions affect the amounts reported in the unaudited consolidated financial statements and the disclosures provided, and actual results could differ. The estimates utilized to determine the appropriate allowance for loan losses at March 31, 2020 may be materially different from actual results due to the COVID-19 pandemic. See Note 2 to the unaudited consolidated financial statements for additional information regarding the COVID-19 pandemic.
Reclassifications
Certain prior balances in the unaudited consolidated financial statements have been reclassified to conform
8
to current year presentation. These reclassifications had no effect on prior year net income or stockholders’ equity.
Earnings Per Share ("EPS")
Basic earnings per common share represents the amount of earnings for the period available to each share of common stock outstanding during the reporting period. Basic EPS is computed based upon net income divided by the weighted average number of common shares outstanding during the period. In determining the weighted average number of shares outstanding, vested restricted stock units are included. Diluted EPS represents the amount of earnings for the period available to each share of common stock outstanding including common stock that would have been outstanding assuming the issuance of common shares for all dilutive potential common shares outstanding during each reporting period. Diluted EPS is computed based upon net income divided by the weighted average number of common shares outstanding during each period, adjusted for the effect of dilutive potential common shares, such as restricted stock awards and units, calculated using the treasury stock method.
(Dollars in thousands, except share amounts) | Three Months Ended March 31, | |||||||
2020 | 2019 | |||||||
Net income | $ | 7,576 | $ | 12,010 | ||||
Weighted average basic common shares outstanding | 55,611,827 | 56,519,809 | ||||||
Add: Dilutive effects of assumed vesting of restricted stock | 113,271 | 202,887 | ||||||
Weighted average diluted common shares outstanding | 55,725,098 | 56,722,696 | ||||||
Income per common share: | ||||||||
Basic EPS | $ | 0.14 | $ | 0.21 | ||||
Diluted EPS | $ | 0.14 | $ | 0.21 | ||||
Anti-dilutive shares not included in calculation of diluted earnings per share | 17,313 | 13,981 | ||||||
New Financial Accounting Standards
FASB ASU 2019-12
In December 2019, the Financial Accounting Standards Board (“FASB”) issued "Simplifying the Accounting for Income Taxes (Topic 740)" (“ASU 2019-12”) removing certain exceptions to the general principles in Accounting Standards Codification (“ASC”) 740 and clarifying and amending existing guidance to provide for more consistent application. ASU 2019-12 will become effective for fiscal years beginning after December 15, 2021 and early adoption is permitted. The adoption of this standard is not expected to have a material effect on the Company’s operating results or financial condition.
2. | COVID-19 |
In late March 2020, the Company implemented a loan modification program that permits borrowers who have been financially impacted by the COVID-19 pandemic, and are unable to service their loans, to defer loan payments for a specified period of time. Because the loan modification program was established in late March 2020, borrower participation in the program and the receipt of modification applications were not generally experienced until April 2020. As of April 30, 2020, the Company had received completed applications from borrowers requesting modifications in connection with this program representing loan balances of $88.5 million, $111.9 million, $51.2 million and $1.1 million, or 2.2%, 5.9%, 24.4% and 5.4%, of our multifamily residential, single family residential, commercial real estate and construction and land loan portfolios, respectively. As of April 30, 2020, the Company has approved COVID-19 loan modifications with an aggregate principal loan balance of $84.7 million, representing 1.4% of the Company's loan portfolio. In conjunction with the passage of the Coronavirus Aid, Relief, and Economic Security Act ("CARES Act"), banks have been provided the option to temporarily suspend certain requirements under GAAP related to TDRs for a limited time to account for the effects of COVID-19. As a result, the Company will not be recognizing eligible COVID-19 loan modifications as TDRs. Additionally, loans qualifying for these modifications will not be required to be reported as delinquent, nonaccrual, impaired or criticized solely as a result of a COVID-19 loan modification.
9
Through the date of this filing, the Company has not experienced any loan charge-offs caused by the economic impact from COVID-19. Management has evaluated events related to COVID-19 that have occurred subsequent to March 31, 2020 and has concluded there are no matters that would require recognition in the accompanying unaudited consolidated financial statements.
3. | INVESTMENT SECURITIES |
Available for Sale
The following table summarizes the amortized cost and the estimated fair value of available for sale debt securities as of the dates indicated:
(Dollars in thousands) | Amortized Cost | Gross Unrealized Gains | Gross Unrealized Losses | Estimated Fair Value | |||||||||||
At March 31, 2020: | |||||||||||||||
Government and Government Sponsored Entities: | |||||||||||||||
Residential mortgage backed securities ('MBS") and collateralized mortgage obligations ("CMOs") | $ | 227,132 | $ | 1,111 | $ | (1,829 | ) | $ | 226,414 | ||||||
Commercial MBS and CMOs | 355,196 | 5,993 | (2,246 | ) | 358,943 | ||||||||||
Agency bonds | 56,058 | 97 | (38 | ) | 56,117 | ||||||||||
Total available for sale debt securities | $ | 638,386 | $ | 7,201 | $ | (4,113 | ) | $ | 641,474 | ||||||
At December 31, 2019: | |||||||||||||||
Government and Government Sponsored Entities: | |||||||||||||||
Residential MBS and CMOs | $ | 145,333 | $ | 340 | $ | (481 | ) | $ | 145,192 | ||||||
Commercial MBS and CMOs | 353,727 | 3,267 | (825 | ) | 356,169 | ||||||||||
Agency bonds | 123,977 | 59 | (323 | ) | 123,713 | ||||||||||
Total available for sale debt securities | $ | 623,037 | $ | 3,666 | $ | (1,629 | ) | $ | 625,074 | ||||||
Net unrealized gains on available for sale investment securities are recorded as accumulated other comprehensive income within stockholders’ equity and totaled $2.2 million and $1.4 million, net of $898 thousand and $593 thousand in tax liabilities, at March 31, 2020 and December 31, 2019, respectively. There were no sales or transfers of available for sale investment securities and no realized gains or losses on these securities during the three months ended March 31, 2020 and 2019.
The following tables summarize the gross unrealized losses and fair value of available for sale debt securities, aggregated by investment category and length of time that individual securities have been in a continuous unrealized loss position:
March 31, 2020 | |||||||||||||||||||||||
Less than 12 Months | 12 Months or More | Total | |||||||||||||||||||||
(Dollars in thousands) | Fair Value | Unrealized Losses | Fair Value | Unrealized Losses | Fair Value | Unrealized Losses | |||||||||||||||||
Government and Government Sponsored Entities: | |||||||||||||||||||||||
Residential MBS and CMOs | $ | 83,448 | $ | (1,038 | ) | $ | 40,964 | $ | (791 | ) | $ | 124,412 | $ | (1,829 | ) | ||||||||
Commercial MBS and CMOs | 91,732 | (1,199 | ) | 59,746 | (1,047 | ) | 151,478 | (2,246 | ) | ||||||||||||||
Agency bonds | 19,243 | (38 | ) | — | — | 19,243 | (38 | ) | |||||||||||||||
Total available for sale debt securities | $ | 194,423 | $ | (2,275 | ) | $ | 100,710 | $ | (1,838 | ) | $ | 295,133 | $ | (4,113 | ) | ||||||||
At March 31, 2020, the Company held 83 residential MBS and CMOs of which 65 were in a loss position and 27 had been in a loss position for twelve months or more. The Company held 43 commercial MBS and CMOs of which 19 were in a loss position and 9 had been in a loss position for twelve months or more. The Company held 14 agency bonds of which 2 were in a loss position and none had been in a loss position for twelve months or more.
10
December 31, 2019 | |||||||||||||||||||||||
Less than 12 Months | 12 Months or More | Total | |||||||||||||||||||||
(Dollars in thousands) | Fair Value | Unrealized Losses | Fair Value | Unrealized Losses | Fair Value | Unrealized Losses | |||||||||||||||||
Government and Government Sponsored Entities: | |||||||||||||||||||||||
Residential MBS and CMOs | $ | 43,623 | $ | (181 | ) | $ | 54,870 | $ | (300 | ) | $ | 98,493 | $ | (481 | ) | ||||||||
Commercial MBS and CMOs | 95,950 | (339 | ) | 57,219 | (486 | ) | 153,169 | (825 | ) | ||||||||||||||
Agency bonds | 29,471 | (86 | ) | 87,405 | (237 | ) | 116,876 | (323 | ) | ||||||||||||||
Total available for sale debt securities | $ | 169,044 | $ | (606 | ) | $ | 199,494 | $ | (1,023 | ) | $ | 368,538 | $ | (1,629 | ) | ||||||||
At December 31, 2019, the Company held 76 residential MBS and CMOs of which 45 were in a loss position and 25 had been in a loss position for twelve months or more. The Company held 42 commercial MBS and CMOs of which 19 were in a loss position and 8 had been in a loss position for twelve months or more. The Company held 15 agency bonds of which 12 were in a loss position and 9 had been in a loss position for twelve months or more.
The unrealized losses on the Company’s investments were caused by interest rate changes. In addition, the contractual cash flows of these investments are guaranteed by the U.S. government or agencies sponsored by the U.S. government. Accordingly, it is expected that the securities will not be settled at a price less than amortized cost. Because the decline in market value is attributable to changes in interest rates but not credit quality, and because the Company has the ability and intent to hold those investments until a recovery of fair value, which may be maturity, the Company does not consider these investments to be other-than-temporarily impaired at March 31, 2020 and December 31, 2019.
As of March 31, 2020 and December 31, 2019, there were no holdings of securities of any one issuer in an amount greater than 10% of stockholders' equity, other than the U.S. government and its agencies.
Held to Maturity
The following table summarizes the amortized cost and estimated fair value of held to maturity investment securities as of the dates indicated:
(Dollars in thousands) | Amortized Cost | Gross Unrecognized Gains | Gross Unrecognized Losses | Estimated Fair Value | |||||||||||
As of March 31, 2020: | |||||||||||||||
Government Sponsored Entities: | |||||||||||||||
Residential MBS | $ | 9,651 | $ | 400 | $ | — | $ | 10,051 | |||||||
Other investments | 81 | — | — | 81 | |||||||||||
Total held to maturity investment securities | $ | 9,732 | $ | 400 | $ | — | $ | 10,132 | |||||||
As of December 31, 2019: | |||||||||||||||
Government Sponsored Entities: | |||||||||||||||
Residential MBS | $ | 10,087 | $ | 205 | $ | (26 | ) | $ | 10,266 | ||||||
Other investments | 83 | — | — | 83 | |||||||||||
Total held to maturity investment securities | $ | 10,170 | $ | 205 | $ | (26 | ) | $ | 10,349 | ||||||
11
The following table summarizes the gross unrecognized losses and fair value of held to maturity investment securities, aggregated by investment category and length of time that individual securities have been in a continuous unrecognized loss position:
Less than 12 Months | 12 Months or More | Total | |||||||||||||||||||||
(Dollars in thousands) | Fair Value | Unrecognized Losses | Fair Value | Unrecognized Losses | Fair Value | Unrecognized Losses | |||||||||||||||||
As of December 31, 2019: | |||||||||||||||||||||||
Government Sponsored Entities: | |||||||||||||||||||||||
Residential MBS | $ | — | $ | — | $ | 2,253 | $ | (26 | ) | $ | 2,253 | $ | (26 | ) | |||||||||
At March 31, 2020, the Company had 7 held to maturity residential MBS and none were in a loss position. At December 31, 2019, the Company held 7 held to maturity residential MBS of which 2 had been in a loss position for twelve months or more.
The unrecognized losses on the Company’s held to maturity investments at December 31, 2019 were caused by interest rate changes. In addition, the contractual cash flows of these investments are guaranteed by agencies sponsored by the U.S. government. Accordingly, it is expected that the securities will not be settled at a price less than amortized cost. Because the decline in market value is attributable to changes in interest rates but not credit quality, and because the Company has the ability and intent to hold those investments until maturity, the Company does not consider those investments to be other-than-temporarily impaired at December 31, 2019.
The following table summarizes the scheduled maturities of available for sale and held to maturity investment securities as of March 31, 2020:
March 31, 2020 | |||||||
(Dollars in thousands) | Amortized Cost | Fair Value | |||||
Available for sale debt securities | |||||||
Less than one year | $ | 10,000 | $ | 10,018 | |||
One to five years | 30,000 | 29,987 | |||||
Five to ten years | 3,777 | 3,781 | |||||
Beyond ten years | 12,281 | 12,331 | |||||
MBS and CMOs | 582,328 | 585,357 | |||||
Total available for sale debt securities | $ | 638,386 | $ | 641,474 | |||
Held to maturity investments securities | |||||||
Beyond ten years | $ | 81 | $ | 81 | |||
MBS | 9,651 | 10,051 | |||||
Total held to maturity debt securities | $ | 9,732 | $ | 10,132 | |||
The amortized cost and fair value of debt securities are shown by contractual maturity. Expected maturities may differ from contractual maturities if borrowers have the right to call or prepay obligations with or without call or prepayment penalties. As such, mortgage backed securities and collateralized mortgage obligations are not included in the maturity categories above and instead are shown separately. No securities were pledged as of March 31, 2020 and December 31, 2019.
Equity Securities
Equity securities consist of investments in the CRA Qualified Investment Fund. At March 31, 2020 and December 31, 2019, the fair value of equity securities totaled $12.0 million and $11.8 million, respectively. Prior to January 1, 2019, equity securities were included with available for sale investment securities and stated at fair value with unrealized gains and losses reported in other comprehensive income. In conjunction with the adoption of ASU 2016-01, as of January 1, 2019, $399 thousand of unrealized losses on equity securities were reclassified from other comprehensive income to retained earnings. Subsequent changes in fair value are recognized in other noninterest income and totaled $188 thousand and $144 thousand during the three months ended March 31, 2020 and 2019. There were no sales of equity securities during the three
12
months ended March 31, 2020 and 2019.
4. | LOANS |
Loans consist of the following:
(Dollars in thousands) | March 31, 2020 | December 31, 2019 | |||||
Permanent mortgages on: | |||||||
Multifamily residential | $ | 4,058,869 | $ | 3,985,981 | |||
Single family residential | 1,930,831 | 2,021,320 | |||||
Commercial real estate | 205,657 | 203,134 | |||||
Construction and land loans | 22,857 | 20,442 | |||||
Non-Mortgage (‘‘NM’’) loans | 100 | 100 | |||||
Total | 6,218,314 | 6,230,977 | |||||
Allowance for loan losses | (40,657 | ) | (36,001 | ) | |||
Loans held for investment, net | $ | 6,177,657 | $ | 6,194,976 | |||
Certain loans have been pledged to secure borrowing arrangements (see Note 8).
The following table summarizes activity in and the allocation of the allowance for loan losses by portfolio segment:
(Dollars in thousands) | Multifamily Residential | Single Family Residential | Commercial Real Estate | Land, Construction and NM | Total | ||||||||||||||
Three months ended March 31, 2020 | |||||||||||||||||||
Allowance for loan losses: | |||||||||||||||||||
Beginning balance allocated to portfolio segments | $ | 23,372 | $ | 10,076 | $ | 2,341 | $ | 212 | $ | 36,001 | |||||||||
Provision for (reversal of) loan losses | 3,936 | 1,069 | 336 | (41 | ) | 5,300 | |||||||||||||
Charge-offs | — | (722 | ) | — | — | (722 | ) | ||||||||||||
Recoveries | — | 3 | — | 75 | 78 | ||||||||||||||
Ending balance allocated to portfolio segments | $ | 27,308 | $ | 10,426 | $ | 2,677 | $ | 246 | $ | 40,657 | |||||||||
Three months ended March 31, 2019 | |||||||||||||||||||
Allowance for loan losses: | |||||||||||||||||||
Beginning balance allocated to portfolio segments | $ | 21,326 | $ | 10,125 | $ | 2,441 | $ | 422 | $ | 34,314 | |||||||||
Provision for (reversal of) loan losses | 720 | (239 | ) | (163 | ) | (18 | ) | 300 | |||||||||||
Charge-offs | — | — | — | — | — | ||||||||||||||
Recoveries | — | 3 | — | 75 | 78 | ||||||||||||||
Ending balance allocated to portfolio segments | $ | 22,046 | $ | 9,889 | $ | 2,278 | $ | 479 | $ | 34,692 | |||||||||
13
The following table summarizes the allocation of the allowance for loan losses by impairment methodology:
(Dollars in thousands) | Multifamily Residential | Single Family Residential | Commercial Real Estate | Land, Construction and NM | Total | ||||||||||||||
As of March 31, 2020: | |||||||||||||||||||
Ending allowance balance allocated to: | |||||||||||||||||||
Loans individually evaluated for impairment | $ | — | $ | 25 | $ | — | $ | — | $ | 25 | |||||||||
Loans collectively evaluated for impairment | 27,308 | 10,401 | 2,677 | 246 | 40,632 | ||||||||||||||
Ending balance | $ | 27,308 | $ | 10,426 | $ | 2,677 | $ | 246 | $ | 40,657 | |||||||||
Loans: | |||||||||||||||||||
Ending balance: individually evaluated for impairment | $ | 537 | $ | 6,331 | $ | — | $ | — | $ | 6,868 | |||||||||
Ending balance: collectively evaluated for impairment | 4,058,332 | 1,924,500 | 205,657 | 22,957 | 6,211,446 | ||||||||||||||
Ending balance | $ | 4,058,869 | $ | 1,930,831 | $ | 205,657 | $ | 22,957 | $ | 6,218,314 | |||||||||
As of December 31, 2019: | |||||||||||||||||||
Ending allowance balance allocated to: | |||||||||||||||||||
Loans individually evaluated for impairment | $ | — | $ | 815 | $ | — | $ | — | $ | 815 | |||||||||
Loans collectively evaluated for impairment | 23,372 | 9,261 | 2,341 | 212 | 35,186 | ||||||||||||||
Ending balance | $ | 23,372 | $ | 10,076 | $ | 2,341 | $ | 212 | $ | 36,001 | |||||||||
Loans: | |||||||||||||||||||
Ending balance: individually evaluated for impairment | $ | 541 | $ | 7,097 | $ | — | $ | — | $ | 7,638 | |||||||||
Ending balance: collectively evaluated for impairment | 3,985,440 | 2,014,223 | 203,134 | 20,542 | 6,223,339 | ||||||||||||||
Ending balance | $ | 3,985,981 | $ | 2,021,320 | $ | 203,134 | $ | 20,542 | $ | 6,230,977 | |||||||||
The Company assigns a risk rating to all loans and periodically performs detailed reviews of all such loans to identify credit risks and to assess the overall collectability of the portfolio. During these internal reviews, management monitors and analyzes the financial condition of borrowers and guarantors, as well as the financial performance and other characteristics of loan collateral. These credit quality indicators are used to assign a risk rating to each individual loan. The risk ratings can be grouped into six major categories, defined as follows:
Pass assets are those which are performing according to contract and have no existing or known weaknesses deserving of management’s close attention. The basic underwriting criteria used to approve the loans are still valid, and all payments have essentially been made as planned.
Watch assets are expected to have an event occurring in the next 90 to 120 days that will lead to a change in risk rating with the change being either favorable or unfavorable. These assets require heightened monitoring of the event by management.
Special mention assets have potential weaknesses that deserve management’s close attention. If left uncorrected, these potential weaknesses may result in deterioration of the repayment prospects for the asset or in the Company’s credit position at some future date. Special mention assets are not adversely classified and do not expose the Company to sufficient risk to warrant adverse classification.
Substandard assets are inadequately protected by the current net worth and/or paying capacity of the obligor or by the collateral pledged. These assets have well-defined weaknesses: the primary source of repayment is gone or severely impaired (i.e., bankruptcy or loss of employment) and/or there has been a deterioration in collateral value. In addition, there is the distinct possibility that the Company will sustain some loss, either directly or indirectly (i.e., the cost of monitoring), if the deficiencies are not corrected. A deterioration in collateral value alone does not mandate that an asset be adversely classified if such factor does not indicate that the primary source of repayment is in jeopardy.
14
Doubtful assets have the weaknesses of those classified substandard with the added characteristic that the weaknesses make collection or liquidation in full highly questionable and improbable based on current facts, conditions and values.
Loss assets are considered uncollectible and of such little value that their continuance as assets, without establishment of a specific valuation allowance or charge-off, is not warranted. This classification does not necessarily mean that an asset has absolutely no recovery or salvage value; but rather, it is not practical or desirable to defer writing off a basically worthless asset (or portion thereof) even though partial recovery may be affected in the future.
The following table summarizes the loan portfolio allocated by management’s internal risk ratings at March 31, 2020 and December 31, 2019:
(Dollars in thousands) | Multifamily Residential | Single Family Residential | Commercial Real Estate | Land, Construction and NM | Total | ||||||||||||||
As of March 31, 2020: | |||||||||||||||||||
Grade: | |||||||||||||||||||
Pass | $ | 3,989,553 | $ | 1,898,641 | $ | 203,857 | $ | 22,957 | $ | 6,115,008 | |||||||||
Watch | 51,699 | 14,844 | 1,800 | — | 68,343 | ||||||||||||||
Special mention | 16,692 | 10,108 | — | — | 26,800 | ||||||||||||||
Substandard | 925 | 7,238 | — | — | 8,163 | ||||||||||||||
Doubtful | — | — | — | — | — | ||||||||||||||
Total | $ | 4,058,869 | $ | 1,930,831 | $ | 205,657 | $ | 22,957 | $ | 6,218,314 | |||||||||
As of December 31, 2019: | |||||||||||||||||||
Grade: | |||||||||||||||||||
Pass | $ | 3,917,264 | $ | 1,980,845 | $ | 200,371 | $ | 20,542 | $ | 6,119,022 | |||||||||
Watch | 47,309 | 16,432 | 2,763 | — | 66,504 | ||||||||||||||
Special mention | 19,708 | 13,635 | — | — | 33,343 | ||||||||||||||
Substandard | 1,700 | 8,808 | — | — | 10,508 | ||||||||||||||
Doubtful | — | 1,600 | — | — | 1,600 | ||||||||||||||
Total | $ | 3,985,981 | $ | 2,021,320 | $ | 203,134 | $ | 20,542 | $ | 6,230,977 | |||||||||
The following table summarizes an aging analysis of the loan portfolio by the time past due at March 31, 2020 and December 31, 2019:
(Dollars in thousands) | 30 Days | 60 Days | 90+ Days | Non-accrual | Current | Total | |||||||||||||||||
As of March 31, 2020: | |||||||||||||||||||||||
Loans: | |||||||||||||||||||||||
Multifamily residential | $ | — | $ | 897 | $ | — | $ | 537 | $ | 4,057,435 | $ | 4,058,869 | |||||||||||
Single family residential | 1,066 | 1,720 | — | 5,036 | 1,923,009 | 1,930,831 | |||||||||||||||||
Commercial real estate | — | — | — | — | 205,657 | 205,657 | |||||||||||||||||
Land, construction and NM | — | — | — | — | 22,957 | 22,957 | |||||||||||||||||
Total | $ | 1,066 | $ | 2,617 | $ | — | $ | 5,573 | $ | 6,209,058 | $ | 6,218,314 | |||||||||||
As of December 31, 2019: | |||||||||||||||||||||||
Loans: | |||||||||||||||||||||||
Multifamily residential | $ | 1,411 | $ | — | $ | — | $ | 541 | $ | 3,984,029 | $ | 3,985,981 | |||||||||||
Single family residential | 4,037 | 690 | — | 5,792 | 2,010,801 | 2,021,320 | |||||||||||||||||
Commercial real estate | — | — | — | — | 203,134 | 203,134 | |||||||||||||||||
Land, construction and NM | — | — | — | — | 20,542 | 20,542 | |||||||||||||||||
Total | $ | 5,448 | $ | 690 | $ | — | $ | 6,333 | $ | 6,218,506 | $ | 6,230,977 | |||||||||||
15
At March 31, 2020, there were 5 single family residential loans totaling $6.0 million and 1 multifamily residential loan totaling $595 thousand that would have been reported as 30 days delinquent loans if not for COVID-19 related requests. See Note 2 to the unaudited consolidated financial statements for additional information.
The following table summarizes information related to impaired loans at March 31, 2020 and December 31, 2019:
As of March 31, 2020 | As of December 31, 2019 | ||||||||||||||||||||||
(Dollars in thousands) | Recorded Investment | Unpaid Principal Balance | Related Allowance | Recorded Investment | Unpaid Principal Balance | Related Allowance | |||||||||||||||||
With no related allowance recorded: | |||||||||||||||||||||||
Multifamily residential | $ | 537 | $ | 614 | $ | — | $ | 541 | $ | 618 | $ | — | |||||||||||
Single family residential | 5,430 | 6,472 | — | 4,588 | 4,915 | — | |||||||||||||||||
5,967 | 7,086 | — | 5,129 | 5,533 | — | ||||||||||||||||||
With an allowance recorded: | |||||||||||||||||||||||
Single family residential | 901 | 898 | 25 | 2,509 | 2,484 | 815 | |||||||||||||||||
901 | 898 | 25 | 2,509 | 2,484 | 815 | ||||||||||||||||||
Total: | |||||||||||||||||||||||
Multifamily residential | 537 | 614 | — | 541 | 618 | — | |||||||||||||||||
Single family residential | 6,331 | 7,370 | 25 | 7,097 | 7,399 | 815 | |||||||||||||||||
$ | 6,868 | $ | 7,984 | $ | 25 | $ | 7,638 | $ | 8,017 | $ | 815 | ||||||||||||
The following tables summarize information related to impaired loans for the three months ended March 31, 2020 and 2019:
Three Months Ended March 31, | |||||||||||||||||||||||
2020 | 2019 | ||||||||||||||||||||||
(Dollars in thousands) | Average Recorded Investment | Interest Income | Cash Basis Interest | Average Recorded Investment | Interest Income | Cash Basis Interest | |||||||||||||||||
With no related allowance recorded: | |||||||||||||||||||||||
Multifamily residential | $ | 539 | $ | 8 | $ | 8 | $ | 560 | $ | 3 | $ | 3 | |||||||||||
Single family residential | 4,790 | 19 | 14 | 4,148 | 36 | — | |||||||||||||||||
Commercial real estate | — | — | — | — | — | — | |||||||||||||||||
5,329 | 27 | 22 | 4,708 | 39 | 3 | ||||||||||||||||||
With an allowance recorded: | |||||||||||||||||||||||
Single family residential | 2,105 | 11 | — | 929 | 12 | — | |||||||||||||||||
2,105 | 11 | — | 929 | 12 | — | ||||||||||||||||||
Total: | |||||||||||||||||||||||
Multifamily residential | 539 | 8 | 8 | 560 | 3 | 3 | |||||||||||||||||
Single family residential | 6,895 | 30 | 14 | 5,077 | 48 | — | |||||||||||||||||
Commercial real estate | — | — | — | — | — | — | |||||||||||||||||
$ | 7,434 | $ | 38 | $ | 22 | $ | 5,637 | $ | 51 | $ | 3 | ||||||||||||
The following table summarizes the recorded investment related to troubled debt restructurings ("TDRs") at March 31, 2020 and December 31, 2019:
(Dollars in thousands) | March 31, 2020 | December 31, 2019 | |||||
Troubled debt restructurings: | |||||||
Single family residential | $ | 1,296 | $ | 1,305 | |||
The Company has allocated $25 thousand of its allowance for loan losses for loans modified in TDRs at both March 31, 2020 and December 31, 2019. The Company does not have commitments to lend additional funds
16
to borrowers with loans whose terms have been modified in TDRs. There were no new troubled debt restructurings during the three months ended March 31, 2020 and 2019. See Note 2 to the unaudited consolidated financial statements for additional information.
The Company had no TDRs with a subsequent payment default within twelve months following the modification during the three months ended March 31, 2020 and 2019. A loan is considered to be in payment default once it is 90 days contractually past due under the modified terms.
5. | NONPERFORMING ASSETS |
Nonperforming assets include nonperforming loans plus real estate owned. The Company’s nonperforming assets at March 31, 2020 and December 31, 2019 are indicated below:
(Dollars in thousands) | March 31, 2020 | December 31, 2019 | |||||
Non-accrual loans: | |||||||
Multifamily residential | $ | 537 | $ | 541 | |||
Single family residential | 5,036 | 5,792 | |||||
Total non-accrual loans | 5,573 | 6,333 | |||||
Real estate owned | — | — | |||||
Total nonperforming assets | $ | 5,573 | $ | 6,333 | |||
Interest income is subsequently recognized on a cash basis as long as the remaining unpaid principal amount of a non-accrual loan is deemed to be fully collectible. If there is doubt regarding the collectability of the loan, then any interest payments received are applied to principal. Interest income was recognized on a cash basis on non-accrual loans during the three months ended March 31, 2020 and 2019 totaling $22 thousand and $3 thousand, respectively. Contractual interest not accrued on nonperforming loans during the three months ended March 31, 2020 totaled $71 thousand compared with $22 thousand for the three months ended March 31, 2019.
Generally, nonperforming loans are considered impaired because the repayment of the loan will not be made in accordance with the original contractual agreement.
6. | MORTGAGE SERVICING RIGHTS |
Servicing loans for others generally consists of collecting mortgage payments, maintaining escrow accounts, disbursing payments to investors, and conducting foreclosure proceedings. Loan servicing income is recorded on the accrual basis and includes servicing fees from investors and certain charges collected from borrowers. Mortgage loans serviced for others are not reported as assets. The principal balances of these loans are as follows:
(Dollars in thousands) | March 31, 2020 | December 31, 2019 | |||||
Mortgage loans serviced for: | |||||||
Federal Home Loan Mortgage Corporation ("Freddie Mac") | $ | 352,107 | $ | 379,339 | |||
Other financial institutions | 126,203 | 134,140 | |||||
Total mortgage loans serviced for others | $ | 478,310 | $ | 513,479 | |||
Custodial account balances maintained in connection with serviced loans totaled $4.8 million and $8.0 million at March 31, 2020 and December 31, 2019, respectively.
The Company measures servicing rights at fair value at each reporting date and reports changes in the fair value of servicing assets in earnings in the period in which the changes occur. Fair value is based on a valuation model that calculates the present value of estimated future net servicing income. Activities for mortgage servicing rights are as follows:
17
Three Months Ended March 31, | |||||||
(Dollars in thousands) | 2020 | 2019 | |||||
Beginning balance | $ | 2,657 | $ | 3,463 | |||
Additions | — | 155 | |||||
Disposals | — | — | |||||
Change in fair value due to changes in assumptions | — | — | |||||
Other changes in fair value | (395 | ) | (146 | ) | |||
Ending balance | $ | 2,262 | $ | 3,472 | |||
Fair value as of March 31, 2020 was determined using a discount rate of 10%, prepayment speeds ranging from 6.8% to 71.2%, depending on the stratification of the specific right, and a weighted average default rate of 5%. The weighted average prepayment speed at March 31, 2020 was 27.8%. Fair value as of December 31, 2019 was determined using a discount rate of 10%, prepayment speeds ranging from 6.0% to 58.7%, depending on the stratification of the specific right, and a weighted average default rate of 5%. The weighted average prepayment speed at December 31, 2019 was 22.8%.
7. | DEPOSITS |
A summary of deposits at March 31, 2020 and December 31, 2019 is as follows:
(Dollars in thousands) | March 31, 2020 | December 31, 2019 | |||||
Time deposits | $ | 3,693,790 | $ | 3,526,688 | |||
Money market savings | 1,212,209 | 1,330,585 | |||||
Interest-bearing demand | 226,207 | 222,509 | |||||
Money market checking | 104,388 | 111,338 | |||||
Noninterest-bearing demand | 48,782 | 43,597 | |||||
Total | $ | 5,285,376 | $ | 5,234,717 | |||
The Company had time deposits with a denomination of $100 thousand or more totaling $2.8 billion and $2.6 billion at March 31, 2020 and December 31, 2019, respectively.
The Company had time deposits that met or exceeded the FDIC insurance limit of $250 thousand of $1.6 billion and $1.4 billion at March 31, 2020 and December 31, 2019, respectively.
The Company utilizes brokered deposits as an additional source of funding. The Company had brokered deposits of $420.0 million and $416.0 million at March 31, 2020 and December 31, 2019, respectively.
Maturities of the Company’s time deposits at March 31, 2020 are summarized as follows (dollars
in thousands):
April 1 - December 31, 2020 | $ | 2,971,692 | |
2021 | 624,783 | ||
2022 | 84,714 | ||
2023 | 4,858 | ||
2024 | 5,206 | ||
Thereafter | 2,537 | ||
Total | $ | 3,693,790 | |
8. | FEDERAL HOME LOAN BANK AND FEDERAL RESERVE BANK ADVANCES |
The Bank may borrow from the FHLB, on either a short-term or long-term basis, up to 40% of its assets provided that adequate collateral has been pledged. As of March 31, 2020 and December 31, 2019, the Bank had pledged various mortgage loans totaling approximately $2.3 billion and $2.2 billion, respectively, as well as the FHLB stock held by the Bank to secure these borrowing arrangements.
18
The Bank has access to the Loan and Discount Window of the Federal Reserve Bank of San Francisco ("FRB"). Advances under this window are subject to the Bank providing qualifying collateral. Various mortgage loans totaling approximately $422.7 million and $447.4 million as of March 31, 2020 and December 31, 2019, respectively, secure this borrowing arrangement. There were no borrowings outstanding with the FRB as of March 31, 2020 and December 31, 2019.
The following table discloses the Bank’s outstanding advances from the FHLB of San Francisco:
Outstanding Balances | As of March 31, 2020 | |||||||||||||||||
(Dollars in thousands) | March 31, 2020 | December 31, 2019 | Minimum Interest Rate | Maximum Interest Rate | Weighted Average Rate | Maturity Dates | ||||||||||||
Fixed rate short-term | $ | — | $ | 1,500 | — | % | — | % | — | % | N/A | |||||||
Fixed rate long-term | 953,694 | 977,202 | 1.25 | % | 7.69 | % | 2.23 | % | February 2021 to August 2032 | |||||||||
$ | 953,694 | $ | 978,702 | |||||||||||||||
The Bank's available borrowing capacity based on pledged loans to the FRB and the FHLB totaled $810.0 million and $1.1 billion at March 31, 2020 and December 31, 2019, respectively. The decline in borrowing capacity during the quarter ended March 31, 2020 was primarily due to the additional FHLB letter of credit, as discussed below, and a revision in the borrowing capacity calculation at the FHLB. As of March 31, 2020 and December 31, 2019, the Bank pledged as collateral a $62.6 million FHLB letter of credit to Freddie Mac related to our multifamily securitization reimbursement obligation. In addition, the Bank pledged as collateral a $125.0 million FHLB letter of credit to the State of California Treasurer's Office in connection with a time deposit at March 31, 2020.
Short-term borrowings are borrowings with original maturities of 90 days or less. During the three months ended March 31, 2020, there was a maximum amount of short-term borrowings outstanding of $77.8 million and an average amount outstanding of $23.8 million, with a weighted average interest rate of 1.66%.
The following table summarizes principal payments on FHLB advances over the next five years as of March 31, 2020 (dollars in thousands):
April 1 - December 31, 2020 | $ | — | |
2021 | 350,700 | ||
2022 | 100,000 | ||
2023 | 400,750 | ||
2024 | — | ||
Thereafter | 102,244 | ||
$ | 953,694 | ||
9. | JUNIOR SUBORDINATED DEFERRABLE INTEREST DEBENTURES |
The Company formed two wholly-owned trust companies (the ‘‘Trusts’’) which issued guaranteed preferred beneficial interests (the "Trust Securities") in the Company’s junior subordinated deferrable interest debentures (the "Notes"). The Company is not considered the primary beneficiary of the Trusts and therefore, the Trusts are not consolidated in the Company’s financial statements, but rather the junior subordinated debentures are shown as a liability. The Company’s investment in the common securities of the Trusts, totaling $1.9 million, is included in other assets on the unaudited consolidated statements of financial condition. The sole asset of the Trusts are the Notes that they hold.
The Trusts have invested the proceeds of such Trust Securities in the Notes. Each of the Notes has an interest rate equal to the corresponding Trust Securities distribution rate. The Company has the right to defer payment of interest on the Notes at any time or from time to time for a period not exceeding five years provided that no extension period may extend beyond the stated maturity of the relevant Notes. During any such extension period, distributions on the Trust Securities will also be deferred, and the Company’s ability to pay dividends on its common stock will be restricted.
The Company has entered into contractual arrangements which, taken collectively, fully and unconditionally
19
guarantee payment of: (i) accrued and unpaid distributions required to be paid on the Trust Securities; (ii) the redemption price with respect to any Trust Securities called for redemption by the Trusts; and (iii) payments due upon a voluntary or involuntary dissolution, winding up or liquidation of the Trusts. The Trust Securities are mandatorily redeemable upon maturity of the Notes, or upon earlier redemption as provided in the indenture. The Company has the right to redeem the Notes purchased by the Trusts, in whole or in part, on or after the redemption date. As specified in the indenture, if the Notes are redeemed prior to maturity, the redemption price will be the principal amount and any accrued but unpaid interest.
The following table is a summary of the outstanding Trust Securities and Notes at March 31, 2020 and December 31, 2019 (dollars in thousands):
March 31, 2020 | December 31, 2019 | Date | Maturity | Rate Index | ||||||||||||||||
Issuer | Amount | Rate | Amount | Rate | Issued | Date | (Quarterly Reset) | |||||||||||||
Luther Burbank Statutory Trust I | $ | 41,238 | 2.12 | % | $ | 41,238 | 3.27 | % | 3/1/2006 | 6/15/2036 | 3 month LIBOR + 1.38% | |||||||||
Luther Burbank Statutory Trust II | $ | 20,619 | 2.36 | % | $ | 20,619 | 3.51 | % | 3/1/2007 | 6/15/2037 | 3 month LIBOR + 1.62% | |||||||||
10. | SENIOR DEBT |
In September 2014, the Company issued $95 million in senior unsecured term notes to qualified institutional investors. The following table summarizes information on these notes as of March 31, 2020 and December 31, 2019:
March 31, 2020 | December 31, 2019 | ||||||||||||||||||||
(Dollars in thousands) | Principal | Unamortized Debt Issuance Costs | Principal | Unamortized Debt Issuance Costs | Maturity Date | Fixed Interest Rate | |||||||||||||||
Senior Unsecured Term Notes | $ | 95,000 | $ | 553 | $ | 95,000 | $ | 584 | 9/30/2024 | 6.50 | % | ||||||||||
11. | DERIVATIVES AND HEDGING ACTIVITIES |
From time to time, the Company utilizes interest rate swaps and other derivative financial instruments as part of its asset liability management strategy to manage interest rate risk positions.
Fair Value Hedges of Interest Rate Risk
During the year ended December 31, 2019, the Company entered into two, two-year interest rate swaps with a total notional amount of $1.0 billion to hedge the interest rate risk related to certain hybrid multifamily loans which are currently in their fixed rate period. The swaps are designated as fair value hedges and involve the payment of a fixed rate amount to a counterparty in exchange for the Company receiving a variable rate payment over the life of the swaps without the exchange of the underlying notional amount. The gain or loss on the derivatives, as well as the offsetting loss or gain on the hedged items attributable to the hedged risk are recognized in interest income for loans.
For the three months ended March 31, 2020, the floating rate amounts recognized related to the net settlement of the interest rate swaps was less than the fixed rate amounts recognized. As such, interest income on loans was decreased by $390 thousand for the three months ended March 31, 2020. The Company did not have any derivative financial instruments that were designated as fair value hedges as of or for the three months ended March 31, 2019.
The following table presents the effect of the Company’s interest rate swaps on the unaudited consolidated statement of income for the three months ended March 31, 2020:
20
(Dollars in thousands) | |||
Derivative - interest rate swaps: | |||
Interest income | $ | (461 | ) |
Hedged items - loans: | |||
Interest income | 71 | ||
Net effect on interest income | $ | (390 | ) |
The following table presents the fair value of the Company’s interest rate swaps, as well as its classification on the unaudited consolidated statements of financial condition as of March 31, 2020 and December 31, 2019:
Fair Values of Derivative Instruments | ||||||||||||
Asset Derivatives | Liability Derivatives | |||||||||||
(Dollars in thousands) | Notional Amount | Balance Sheet Location | Fair Value | Balance Sheet Location | Fair Value | |||||||
Derivatives designated as hedging instruments: | ||||||||||||
As of March 31, 2020: | ||||||||||||
Interest Rate Swaps | $ | 1,000,000 | Prepaid Expenses and Other Assets | $ | — | Other Liabilities and Accrued Expenses | $ | 17,674 | ||||
As of December 31, 2019: | ||||||||||||
Interest Rate Swaps | $ | 1,000,000 | Prepaid Expenses and Other Assets | $ | 1,156 | Other Liabilities and Accrued Expenses | $ | 746 | ||||
As of March 31, 2020 and December 31, 2019, the following amounts were recorded in the unaudited consolidated statements of financial condition related to cumulative basis adjustments for its fair value hedges.
Line Item in the Consolidated Statements of Financial Condition in Which the Hedged Items are Included | Carrying Amount of the Hedged Assets | Cumulative Amount of Fair Value Hedging Adjustment Included in the Carrying Amount of the Hedged Assets | ||||||
(Dollars in thousands) | ||||||||
As of March 31, 2020: | ||||||||
Loans receivable, net (1) | $ | 1,017,750 | $ | 17,750 | ||||
As of December 31, 2019: | ||||||||
Loans receivable, net (1) | $ | 999,595 | $ | (405 | ) | |||
(1) These amounts include the amortized cost basis of closed portfolio loans used to designate hedging relationships in which the hedged items are the last layer expected to be remaining at the end of the hedging relationship. At March 31, 2020 and December 31, 2019, the amortized cost basis of the closed portfolio loans used in these hedging relationships were $2.4 billion and $2.5 billion, respectively; the cumulative basis adjustments associated with these hedging relationships were $17.8 million and $(405) thousand, respectively, and the amount of the designated hedged items were $1.0 billion and $1.0 billion, respectively.
As of March 31, 2020 and December 31, 2019, the Company had posted $18.2 million and $2.8 million, respectively, in cash collateral in connection with its interest rate swaps. Cash collateral is included in restricted cash within the unaudited consolidated statements of financial condition.
12. | STOCK BASED COMPENSATION |
The Company’s stock based compensation consists of restricted stock awards ("RSAs") and restricted stock units ("RSUs") granted under the Luther Burbank Corporation Omnibus Equity and Incentive Compensation Plan ("Omnibus Plan"). In connection with its initial public offering ("IPO") in December 2017, the Company granted RSAs and RSUs to employees and nonemployee directors which all vest ratably over three years. At the same time, the Company granted RSUs in exchange for unvested phantom stock awards held by employees and all vested and unvested phantom stock awards held by nonemployee directors on a per share basis. The RSUs were subjected to the same vesting schedule and deferral elections that existed for the original phantom stock awards. Awards granted subsequent to the IPO vest ratably over one year for nonemployee directors and ratably over three to four years for employees.
21
All RSAs and RSUs were granted at the fair value of the common stock at the time of the award. The RSAs and RSUs are considered fixed awards as the number of shares and fair value are known at the date of grant and the fair value at the grant date is amortized over the vesting and/or service period.
Non-cash stock compensation expense recognized for RSAs and RSUs for the three months ended March 31, 2020 totaled $903 thousand compared with $838 thousand for the three months ended March 31, 2019. The fair value of RSAs and RSUs that vested during the three months ended March 31, 2020 and 2019 totaled $2.5 million and $5.7 million, respectively.
As of March 31, 2020 and December 31, 2019, there was $5.3 million and $3.5 million, respectively, of unrecognized compensation expense related to 580,887 and 582,940 unvested RSAs and RSUs, respectively, which amounts are expected to be expensed over a weighted average period of 2.00 years and 1.61 years, respectively. As of March 31, 2020 and December 31, 2019, 165,185 and 135,059 shares, respectively, of RSUs were vested and remain unsettled per the original deferral elections.
The following table summarizes share information about RSAs and RSUs:
Three Months Ended March 31, | |||||||||||||
2020 | 2019 | ||||||||||||
Number of Shares | Weighted Average Grant Date Fair Value | Number of Shares | Weighted Average Grant Date Fair Value | ||||||||||
Beginning of the period balance | 717,999 | $ | 10.53 | 1,155,359 | $ | 10.97 | |||||||
Shares granted | 250,118 | 11.72 | 297,663 | 9.79 | |||||||||
Shares settled | (203,169 | ) | 10.53 | (169,648 | ) | 11.43 | |||||||
Shares forfeited | (18,876 | ) | 10.73 | (2,728 | ) | 10.75 | |||||||
End of the period balance | 746,072 | $ | 10.92 | 1,280,646 | $ | 10.63 | |||||||
Under its Omnibus Plan, the Company reserved 3,360,000 shares of common stock for new awards. At March 31, 2020 and December 31, 2019, there were 2,100,065 and 2,332,775 shares, respectively, of common stock reserved and available for grant through restricted stock or other awards under the Omnibus Plan. During the three months ended March 31, 2020 and 2019, there were 1,468 and no shares, respectively, of forfeited RSU awards that were initially issued to replace unvested phantom stock awards under the Luther Burbank Corporation Phantom Stock Plan. These awards were excluded from the shares reserved and available for grant under the Omnibus Plan.
13. | FAIR VALUE MEASUREMENTS |
Fair Value Measurements
Fair Value Hierarchy
The Company groups its assets and liabilities measured at fair value in three levels, based on the markets in which the assets and liabilities are traded and the reliability of the assumptions used to determine fair value. Valuations within these levels are based upon:
Level 1 - Quoted market prices for identical instruments traded in active exchange markets.
Level 2 - Quoted prices for similar instruments in active markets, quoted prices for identical or similar instruments in markets that are not active, and model-based valuation techniques for which all significant assumptions are observable or can be corroborated by observable market data.
Level 3 - Model-based techniques that use at least one significant assumption not observable in the market. These unobservable assumptions reflect the Company’s estimates of assumptions that market participants would use on pricing the asset or liability. Valuation techniques include management judgment and estimation which may be significant.
Because broadly traded markets do not exist for most of the Company’s financial instruments, the fair value
22
calculations attempt to incorporate the effect of current market conditions at a specific time. These determinations are subjective in nature, involve uncertainties and matters of significant judgment and do not include tax ramifications; therefore, the results cannot be determined with precision, substantiated by comparison to independent markets and may not be realized in an actual sale or immediate settlement of the instruments. There may be inherent weaknesses in any calculation technique, and changes in the underlying assumptions used, including discount rates and estimates of future cash flows, could significantly affect the results. For all of these reasons, the aggregation of the fair value calculations presented herein do not represent, and should not be construed to represent, the underlying value of the Company.
Management monitors the availability of observable market data to assess the appropriate classification of assets and liabilities within the fair value hierarchy. Changes in economic conditions or model-based valuation techniques may require the transfer of financial instruments from one fair value level to another. In such instances, the transfer is reported at the beginning of the reporting period. Management evaluates the significance of transfers between levels based upon the nature of the financial instrument and size of the transfer relative to total assets, total liabilities, or total earnings.
The following methods and assumptions were used to estimate the fair value of financial instruments:
For cash and cash equivalents, accrued interest receivable and payable, demand deposits and short-term borrowings, the carrying amount is estimated to be fair value. The fair value of accrued interest receivable/payable balances are determined using inputs and fair value measurements commensurate with the asset or liability from which the accrued interest is generated.
Fair values for available for sale and held to maturity debt securities, which include primarily debt securities issued by U.S. government sponsored agencies, are based on quoted market prices for similar securities.
Fair values for equity securities, which consist of investments in the CRA Qualified Investment Fund, are based on quoted market prices.
Loans are valued using the exit price notion. The fair value is estimated using market quotes for similar assets or the present value of future cash flows, discounted using a market rate for similar products and giving consideration to estimated prepayment risk and credit risk. The fair value of loans is determined utilizing estimates resulting in a Level 3 classification.
Impaired loans are measured for impairment based on the present value of expected future cash flows discounted at the loans' effective interest rate, except that as a practical expedient, the Company may measure impairment based on a loan’s observable market price, or the fair value of the collateral (net of estimated costs to sell) if the loan is collateral dependent. The fair value of impaired loans is determined utilizing estimates resulting in a Level 3 classification.
It was not practicable to determine the fair value of FHLB stock due to restrictions placed on its transferability.
The fair value of servicing rights is determined using a valuation model that utilizes interest rate, prepayment speed, and default rate assumptions that market participants would use in estimating future net servicing income and that can be validated against available market data.
The fair values of derivatives are based on valuation models using observable market data as of the measurement date.
Fair values for fixed-rate time deposits are estimated using discounted cash flow analyses using interest rates offered at each reporting date by the Company for time deposits with similar remaining maturities. For deposits with no contractual maturity, the fair value is assumed to equal the carrying value.
The fair value of FHLB advances is estimated based on discounting the future cash flows using the market rate currently offered for similar terms.
The fair value of subordinated debentures is based on an indication of value provided by a third-party broker.
For senior debt, the fair value is based on an indication of value provided by a third-party broker.
23
Fair Value of Financial Instruments
The carrying and estimated fair values of the Company’s financial instruments are as follows:
Fair Level Measurements Using | |||||||||||||||||||
(Dollars in thousands) | Carrying Amount | Fair Value | Level 1 | Level 2 | Level 3 | ||||||||||||||
As of March 31, 2020: | |||||||||||||||||||
Financial assets: | |||||||||||||||||||
Cash, cash equivalents and restricted cash | $ | 123,248 | $ | 123,248 | $ | 123,248 | $ | — | $ | — | |||||||||
Debt securities: | |||||||||||||||||||
Available for sale | 641,474 | 641,474 | — | 641,474 | — | ||||||||||||||
Held to maturity | 9,732 | 10,132 | — | 10,132 | — | ||||||||||||||
Equity securities | 11,970 | 11,970 | — | 11,970 | — | ||||||||||||||
Loans receivable, net | 6,177,657 | 6,234,531 | — | — | 6,234,531 | ||||||||||||||
Accrued interest receivable | 20,823 | 20,823 | 2 | 1,467 | 19,354 | ||||||||||||||
FHLB stock | 29,612 | N/A | N/A | N/A | N/A | ||||||||||||||
Financial liabilities: | |||||||||||||||||||
Deposits | $ | 5,285,376 | $ | 5,317,833 | $ | 1,441,586 | $ | 3,876,247 | $ | — | |||||||||
FHLB advances | 953,694 | 998,314 | — | 998,314 | — | ||||||||||||||
Junior subordinated deferrable interest debentures | 61,857 | 46,918 | — | 46,918 | — | ||||||||||||||
Senior debt | 94,447 | 103,170 | — | 103,170 | — | ||||||||||||||
Accrued interest payable | 2,635 | 2,635 | — | 2,635 | — | ||||||||||||||
Interest rate swaps | 17,674 | 17,674 | — | 17,674 | — | ||||||||||||||
As of December 31, 2019: | |||||||||||||||||||
Financial assets: | |||||||||||||||||||
Cash, cash equivalents and restricted cash | $ | 91,325 | $ | 91,325 | $ | 91,325 | $ | — | $ | — | |||||||||
Debt securities: | |||||||||||||||||||
Available for sale | 625,074 | 625,074 | — | 625,074 | — | ||||||||||||||
Held to maturity | 10,170 | 10,349 | — | 10,349 | — | ||||||||||||||
Equity securities | 11,782 | 11,782 | — | 11,782 | — | ||||||||||||||
Loans receivable, net | 6,194,976 | 6,346,496 | — | — | 6,346,496 | ||||||||||||||
Accrued interest receivable | 20,814 | 20,814 | 26 | 1,685 | 19,103 | ||||||||||||||
FHLB stock | 30,342 | N/A | N/A | N/A | N/A | ||||||||||||||
Interest rate swap | 1,156 | 1,156 | — | 1,156 | — | ||||||||||||||
Financial liabilities: | |||||||||||||||||||
Deposits | $ | 5,234,717 | $ | 5,253,511 | $ | 1,558,029 | $ | 3,695,482 | $ | — | |||||||||
FHLB advances | 978,702 | 996,860 | — | 996,860 | — | ||||||||||||||
Junior subordinated deferrable interest debentures | 61,857 | 59,272 | — | 59,272 | — | ||||||||||||||
Senior debt | 94,416 | 99,806 | — | 99,806 | — | ||||||||||||||
Accrued interest payable | 2,901 | 2,901 | — | 2,901 | — | ||||||||||||||
Interest rate swap | 746 | 746 | — | 746 | — | ||||||||||||||
These estimates do not reflect any premium or discount that could result from offering the Company’s entire holdings of a particular financial instrument for sale at one time, nor do they attempt to estimate the value of anticipated future business related to the instruments. In addition, the tax ramifications related to the realization of unrealized gains and losses can have a significant effect on fair value estimates and have not been considered in any of these estimates.
24
Assets and Liabilities Recorded at Fair Value
The following table presents information about the Company’s assets and liabilities measured at fair value on a recurring and nonrecurring basis as of March 31, 2020 and December 31, 2019.
Recurring Basis
The Company is required or permitted to record the following assets and liabilities at fair value on a recurring basis (dollars in thousands):
Description | Fair Value | Level 1 | Level 2 | Level 3 | |||||||||||
As of March 31, 2020: | |||||||||||||||
Financial Assets: | |||||||||||||||
Available for sale debt securities: | |||||||||||||||
Government and Government Sponsored Entities: | |||||||||||||||
Residential MBS and CMOs | $ | 226,414 | $ | — | $ | 226,414 | $ | — | |||||||
Commercial MBS and CMOs | 358,943 | — | 358,943 | — | |||||||||||
Agency bonds | 56,117 | — | 56,117 | — | |||||||||||
Total available for sale debt securities | $ | 641,474 | $ | — | $ | 641,474 | $ | — | |||||||
Equity securities | $ | 11,970 | $ | — | $ | 11,970 | $ | — | |||||||
Mortgage servicing rights | $ | 2,262 | $ | — | $ | — | $ | 2,262 | |||||||
Financial Liabilities: | |||||||||||||||
Interest rate swaps | $ | 17,674 | $ | — | $ | 17,674 | $ | — | |||||||
As of December 31, 2019: | |||||||||||||||
Financial Assets: | |||||||||||||||
Available for sale debt securities: | |||||||||||||||
Government and Government Sponsored Entities: | |||||||||||||||
Residential MBS and CMOs | $ | 145,192 | $ | — | $ | 145,192 | $ | — | |||||||
Commercial MBS and CMOs | 356,169 | — | 356,169 | — | |||||||||||
Agency bonds | 123,713 | — | 123,713 | — | |||||||||||
Total available for sale debt securities | $ | 625,074 | $ | — | $ | 625,074 | $ | — | |||||||
Equity securities | $ | 11,782 | $ | — | $ | 11,782 | $ | — | |||||||
Mortgage servicing rights | $ | 2,657 | $ | — | $ | — | $ | 2,657 | |||||||
Interest rate swap | $ | 1,156 | $ | — | $ | 1,156 | $ | — | |||||||
Financial Liabilities: | |||||||||||||||
Interest rate swap | $ | 746 | $ | — | $ | 746 | $ | — | |||||||
25
There were no transfers between Level 1 and Level 2 during the three months ended March 31, 2020 or 2019.
Non-recurring Basis
The Company may be required, from time to time, to measure certain assets and liabilities at fair value on a non-recurring basis. These include assets that are measured at the lower of cost or market value that were recognized at fair value which was below cost at the reporting date (dollars in thousands):
Description | Fair Value | Level 1 | Level 2 | Level 3 | |||||||||||
March 31, 2020 | |||||||||||||||
Impaired loans: | |||||||||||||||
Single family residential | $ | 878 | $ | — | $ | — | $ | 878 | |||||||
December 31, 2019 | |||||||||||||||
Impaired loans: | |||||||||||||||
Single family residential | $ | 790 | $ | — | $ | — | $ | 790 | |||||||
As of March 31, 2020, an impaired loan of $1.6 million was adjusted to a fair value of $878 thousand by recording a charge off of $722 thousand. At December 31, 2019, this same loan totaled $1.6 million and was adjusted to a fair value of $790 thousand by recording an allowance for loan losses of $790 thousand. The fair value of impaired, collateral dependent loans is estimated at the fair value of the underlying collateral, less estimated selling costs. These loans are categorized as Level 3 due to ongoing real estate market conditions which may require the use of unobservable inputs and assumptions in fair value measurements.
The Company held no real estate owned at March 31, 2020 or December 31, 2019.
14. | VARIABLE INTEREST ENTITIES ("VIE") |
The Company is involved with VIEs through its loan securitization activities. The Company evaluated its association with VIEs for consolidation purposes. Specifically, a VIE is to be consolidated by its primary beneficiary, the entity that has both the power to direct the activities that most significantly impact the VIE and a variable interest that could potentially be significant to the VIE. A variable interest is a contractual, ownership or other interest whose value fluctuates with the changes in the value of the VIE's assets and liabilities. The assessment includes an evaluation of the Company's continuing involvement with the VIE and the nature and significance of its variable interests.
Multifamily loan securitization
With respect to the securitization transaction with Freddie Mac which settled September 27, 2017, the Company's variable interests reside with a reimbursement agreement entered into with Freddie Mac that obligates the Bank to reimburse Freddie Mac for any defaulted contractual principal and interest payments identified after the ultimate resolution of the defaulted loans. Such reimbursement obligations are not to exceed 10% of the original principal amount of the loans comprising the securitization pool. As part of the securitization transaction, the Bank released all servicing obligations and rights to Freddie Mac who was designated as the Master Servicer. As Master Servicer, Freddie Mac appointed the Bank with sub-servicing obligations, which include obligations to collect and remit payments of principal and interest, manage payments of taxes and insurance, and otherwise administer the underlying loans. The servicing of defaulted loans and foreclosed loans was assigned to a separate third party entity, independent of the Bank and Freddie Mac. Freddie Mac, in its capacity as Master Servicer, can terminate the Bank in its role as sub-servicer and direct such responsibilities accordingly. In evaluating the variable interests and continuing involvement in the VIE, the Company determined that it does not have the power to make significant decisions or direct the activities that most significantly impact the economic performance of the VIE's assets and liabilities. As sub-servicer of the loans, the Bank does not have the authority to make significant decisions that influence the value of the VIE's net assets and therefore, is not the primary beneficiary of the VIE. Therefore, the Company determined that the VIE associated with the multifamily securitization should not be included in the consolidated financial statements of the Bank.
26
The Company believes its maximum exposure to loss as a result of involvement with the VIE associated with the securitization under the reimbursement agreement executed with Freddie Mac is 10% of the original principal amount of the loans comprising the securitization pool, or $62.6 million. The reserve for estimated losses with respect to the reimbursement obligation totaled $959 thousand and $1.0 million as of March 31, 2020 and December 31, 2019, respectively, based upon an analysis of quantitative and qualitative data over the underlying loans included in the securitization pool. No disbursements have been made in connection with the reimbursement obligation.
15. | LOAN SALE AND SECURITIZATION ACTIVITIES |
The Company sells originated and acquired loans as part of its business operations and overall management of liquidity, assets and liabilities, and financial performance. The transfer of loans is executed in securitization or sale transactions. With respect to sale transactions, the Company's continuing involvement may or may not include ongoing servicing responsibilities and general representations and warranties. With respect to securitization sales, the Company executed its first and only transaction on September 27, 2017 with Freddie Mac. The transaction involved the sale of $626.0 million in originated multifamily loans through a Freddie Mac sponsored transaction. The Company's continuing involvement includes sub-servicing responsibilities, general representations and warranties, and a limited reimbursement obligation.
As sub-servicer for Freddie Mac, the Bank is required to maintain a minimum net worth in accordance with GAAP of not less than $2.0 million. If Luther Burbank Savings’ capital were to fall below this threshold, Freddie Mac would have the authority to terminate and assume the Bank’s sub-servicing duties. At March 31, 2020, the Bank’s net worth was $729.5 million which equates to its Tier 1 capital of $724.0 million plus goodwill of $3.3 million and accumulated other comprehensive income related to net unrealized gains on available for sale securities of $2.2 million.
General representations and warranties associated with loan sales and securitization sales require the Bank to uphold various assertions that pertain to the underlying loans at the time of the transaction, including, but not limited to, compliance with relevant laws and regulations, absence of fraud, enforcement of liens, no environmental damages, and maintenance of relevant environmental insurance. Such representations and warranties are limited to those that do not meet the quality represented at the transaction date and do not pertain to a decline in value or future payment defaults. In circumstances where the Bank breaches its representations and warranties, the Bank would generally be required to cure such instances through a repurchase or substitution of the subject loan(s).
With respect to the securitization transaction, the Bank also has continuing involvement through a reimbursement agreement executed with Freddie Mac. To the extent the ultimate resolution of defaulted loans results in contractual principal and interest payments that are deficient, the Bank is obligated to reimburse Freddie Mac for such amounts, not to exceed 10% of the original principal amount of the loans comprising the securitization pool at the closing date of September 27, 2017.
The following table provides cash flows associated with the Company's loan sale activities:
Three Months Ended March 31, | ||||||||
(Dollars in thousands) | 2020 | 2019 | ||||||
Proceeds from loan sales | $ | — | $ | 53,772 | ||||
Servicing fees | 270 | 332 | ||||||
27
The following table provides information about the loans transferred through sales or securitization and not recorded on the unaudited consolidated statements of financial condition, for which the Company's continuing involvement includes sub-servicing or servicing responsibilities and/or reimbursement obligations:
(Dollars in thousands) | Single Family Residential | Multifamily Residential | |||||
As of March 31, 2020: | |||||||
Principal balance of loans | $ | 22,290 | $ | 456,020 | |||
Loans 90+ days past due | — | — | |||||
Charge-offs, net | — | — | |||||
As of December 31, 2019: | |||||||
Principal balance of loans | 24,146 | 489,333 | |||||
Loans 90+ days past due | — | — | |||||
Charge-offs, net | — | — | |||||
16. | COMMITMENTS AND CONTINGENCIES |
Financial Instruments With Off-Balance Sheet Risk
The Company is a party to financial instruments with off-balance sheet risk in the normal course of business to meet the financing needs of its customers. These financial instruments represent commitments to originate fixed and variable rate loans and loans in process, and involve, to varying degrees, credit risk and interest rate risk in excess of the amount recognized in the Company’s consolidated statements of financial condition. The Company’s exposure to credit loss in the event of nonperformance by the other party for commitments to extend credit and lines of credit is represented by the contractual amount of those instruments. The Company uses the same credit policies in making commitments to originate loans as it does for on-balance sheet instruments. As it relates to interest rate risk, the Company's exposure is generally limited to increases in interest rates that may result during the short period of time between the commitment and funding of fixed rate credit facilities and adjustable rate credit facilities with initial fixed rate periods. The limited timing risk associated with these credit facilities are considered within the Company's asset liability management process.
Commitments to fund loans are agreements to lend to a customer as long as there is no violation of any condition established in the contract. Commitments generally have expiration dates or other termination clauses. In addition, external market forces may impact the probability of commitments being exercised; therefore, total commitments outstanding do not necessarily represent future cash requirements.
At March 31, 2020 and December 31, 2019, the Company had outstanding commitments of approximately $123.5 million and $103.2 million, respectively, for loans. Unfunded loan commitment reserves totaled $95 thousand and $89 thousand at March 31, 2020 and December 31, 2019, respectively.
Operating Leases
The Company leases various office premises under long-term operating lease agreements. These leases expire between 2020 and 2030, with certain leases containing either three, five or ten year renewal options. At March 31, 2020, minimum commitments under these non-cancellable leases before considering renewal options are (dollars in thousands):
April 1 - December 31, 2020 | $ | 3,316 | |
2021 | 4,419 | ||
2022 | 3,492 | ||
2023 | 2,253 | ||
2024 | 1,278 | ||
Thereafter | 2,601 | ||
Total | $ | 17,359 | |
Rent expense under operating leases was $1.1 million for the three months ended March 31, 2020, compared with $1.3 million for the three months ended March 31, 2019. Sublease income earned was $191 thousand
28
for the three months ended March 31, 2020, compared with $177 thousand for the three months ended March 31, 2019.
Contingencies
At present, there are no pending or threatened proceedings against the Company which, if determined adversely, would have a material effect on the Company’s business, financial position, results of operations, cash flows or stock price. In the ordinary course of operations, the Company may be party to various legal proceedings.
Correspondent Banking Agreements
The Company maintains funds on deposit with other federally insured financial institutions under correspondent banking agreements. At March 31, 2020 and December 31, 2019, the Company had $25.9 million and $25.7 million, respectively, in uninsured available cash balances. Additionally, the Company had $18.2 million and $2.8 million in restricted cash as collateral for its interest rate swap agreements at a correspondent bank as of March 31, 2020 and December 31, 2019, respectively. The Company periodically monitors the financial condition of these correspondent banks.
29
Item 2. Management's Discussion and Analysis of Financial Condition and Results of Operations
The following is a discussion of our financial condition at March 31, 2020 and December 31, 2019 and our results of operations for the three months ended March 31, 2020 and 2019, and should be read in conjunction with our audited consolidated financial statements set forth in our Annual Report on Form 10-K for the year ended December 31, 2019 that was filed with the Securities and Exchange Commission (the “SEC”) on March 11, 2020 (our “Annual Report”) and with the accompanying unaudited notes to consolidated financial statements set forth in this Quarterly Report on Form 10-Q for the quarterly period ended March 31, 2020 (this “Report”). Because we conduct all of our material business operations through our bank subsidiary, Luther Burbank Savings, the discussion and analysis relates to activities primarily conducted by the Bank.
Overview
We are a bank holding company headquartered in Santa Rosa, California, and the parent company of Luther Burbank Savings, a California-chartered commercial bank headquartered in Gardena, California with $7.1 billion in assets at March 31, 2020. Our principal business is providing high-value, relationship-based banking products and services to our customers, which include real estate investors, professionals, entrepreneurs, depositors and commercial businesses. We generate most of our revenue from interest on loans and investments. Our primary source of funding for our loans is retail deposits and we place secondary reliance on wholesale funding, primarily borrowings from the FHLB and brokered deposits. Our largest expenses are interest on deposits and borrowings along with salaries and related employee benefits. Our principal lending products are real estate secured loans, consisting primarily of multifamily residential properties and jumbo single family residential properties on the West Coast.
Selected Financial Data
The following table sets forth the Company’s selected historical consolidated financial data for the periods and as of the dates indicated. You should read this information together with the Company’s audited consolidated financial statements included in our Annual Report and the unaudited consolidated financial statements and related notes included elsewhere in this Report. The selected historical consolidated financial data as of and for the three months ended March 31, 2020 and 2019 are derived from our unaudited consolidated financial statements, which are included elsewhere in this Quarterly Report on Form 10-Q. The selected historical consolidated financial data for the three months ended December 31, 2019 are derived from our unaudited consolidated financial statements. The selected historical consolidated financial data as of December 31, 2019 (except as otherwise noted below) are derived from our audited consolidated financial statements included in our previously-filed Annual Report. The Company’s historical results for any prior period are not necessarily indicative of future performance.
30
(Dollars in thousands, except per share data) | As of or For the Three Months Ended | |||||||||||
March 31, 2020 | December 31, 2019 | March 31, 2019 | ||||||||||
Statements of Income and Financial Condition Data | ||||||||||||
Net Income | $ | 7,576 | $ | 12,457 | $ | 12,010 | ||||||
Pre-tax, pre-provision net earnings (1) | $ | 16,054 | $ | 18,635 | $ | 17,223 | ||||||
Total assets | $ | 7,074,050 | $ | 7,045,828 | $ | 6,992,016 | ||||||
Per Common Share | ||||||||||||
Diluted earnings per share | $ | 0.14 | $ | 0.22 | $ | 0.21 | ||||||
Book value per share | $ | 11.11 | $ | 10.97 | $ | 10.44 | ||||||
Tangible book value per share (1) | $ | 11.05 | $ | 10.91 | $ | 10.38 | ||||||
Selected Ratios | ||||||||||||
Return on average: | ||||||||||||
Assets | 0.43 | % | 0.70 | % | 0.69 | % | ||||||
Stockholders' equity | 4.92 | % | 8.14 | % | 8.19 | % | ||||||
Dividend payout ratio | 42.77 | % | 25.99 | % | 27.43 | % | ||||||
Net interest margin | 1.84 | % | 1.89 | % | 1.86 | % | ||||||
Efficiency ratio (1) | 51.22 | % | 45.15 | % | 48.55 | % | ||||||
Noninterest expense to average assets | 0.96 | % | 0.87 | % | 0.93 | % | ||||||
Loan to deposit ratio | 117.65 | % | 119.03 | % | 120.91 | % | ||||||
Credit Quality Ratios | ||||||||||||
Allowance for loan losses to loans | 0.65 | % | 0.58 | % | 0.56 | % | ||||||
Allowance for loan losses to nonperforming loans | 729.54 | % | 568.47 | % | 2,303.59 | % | ||||||
Nonperforming assets to total assets | 0.08 | % | 0.09 | % | 0.02 | % | ||||||
Net charge-offs (recoveries) to average loans | 0.04 | % | (0.01 | )% | (0.01 | )% | ||||||
Capital Ratios | ||||||||||||
Tier 1 leverage ratio | 9.39 | % | 9.47 | % | 9.32 | % | ||||||
Total risk-based capital ratio | 17.47 | % | 17.97 | % | 17.26 | % | ||||||
(1) Considered a non-GAAP financial measure. See Item 2. Management's Discussion and Analysis of Financial Condition and Results of Operations - ‘‘Non-GAAP Financial Measures’’ for a reconciliation of our non-GAAP measures to the most directly comparable GAAP financial measure. Pre-tax, pre-provision net earnings is defined as net income before taxes and provision for loan losses. Tangible book value is defined as total assets less goodwill and total liabilities. Efficiency ratio is defined as the ratio of noninterest expense to net interest income plus noninterest income. | ||||||||||||
Critical Accounting Policies and Estimates
Our unaudited consolidated financial statements are prepared in accordance with GAAP and with general practices within the financial services industry. Application of these principles requires management to make complex and subjective estimates and assumptions that affect the amounts reported in the financial statements and accompanying notes. We base our estimates on historical experience and on various other assumptions that we believe to be reasonable under current circumstances. These assumptions form the basis for our judgments about the carrying values of assets and liabilities that are not readily available from independent, objective sources. We evaluate our estimates on an ongoing basis. Use of alternative assumptions may have resulted in significantly different estimates. Actual results may differ from these estimates.
Our most significant accounting policies are described in Note 1 to our audited financial statements for the year ended December 31, 2019, included in our Annual Report. We have identified the following accounting policies and estimates that, due to the difficult, subjective or complex judgments and assumptions inherent in those policies and estimates and the potential sensitivity of our financial statements to those judgments and assumptions, are critical to an understanding of our financial condition and results of operations. We believe that the judgments, estimates and assumptions used in the preparation of our financial statements are reasonable and appropriate.
Pursuant to the Jumpstart Our Business Startups Act, as an emerging growth company, we can elect to opt out of the extended transition period for adopting any new or revised accounting standards. We have elected not to opt out of such extended transition period, which means that when a standard is issued or revised and it has different application dates for public or private companies, we may adopt the standard for the private company.
31
We have elected to take advantage of the scaled disclosures and other relief under the JOBS Act, and we may take advantage of some or all of the reduced regulatory and reporting requirements that will be available to us under the JOBS Act, so long as we qualify as an emerging growth company.
Allowance for Loan Losses
The allowance for loan losses is provided for probable incurred credit losses inherent in the loan portfolio at the statement of financial condition date. The allowance is increased by a provision charged to expense and reduced by loan principal charge-offs, net of recoveries. Where management determines that the allowance for loan losses is more than adequate to absorb the probable incurred credit losses in the portfolio, the allowance is reduced by recapturing provisions and a credit is made to the expense account. The allowance is based on management’s assessment of various factors including, but not limited to, the nature of the loan portfolio, previous loss experience, known and inherent risks in the portfolio, the estimated value of underlying collateral, information that may affect a borrower’s ability to repay, current economic conditions and the results of our ongoing reviews of the portfolio. In addition, various regulatory agencies, as an integral part of their examination process, periodically review the Bank’s allowance. Such agencies may require the Bank to recognize additions to the allowance based on judgments different from those of management.
While we use available information, including independent appraisals for collateral, to estimate the extent of probable incurred loan losses within the loan portfolio, inherent uncertainties in the estimation process make it reasonably possible that ultimate losses may vary significantly from our original estimates. Generally, loans are partially or fully charged off when it is determined that the unpaid principal balance exceeds the current fair value of the collateral with no other likely source of repayment.
Fair Value Measurement
We use estimates of fair value in applying various accounting standards for our unaudited consolidated financial statements. Fair value is defined as the exit price at which an asset may be sold or a liability may be transferred in an orderly transaction between willing and able market participants. When available, fair value is measured by looking at observable market prices for identical assets and liabilities in an active market. When these are not available, other inputs are used to model fair value such as prices of similar instruments, yield curves, prepayment speeds and credit spreads. Depending on the availability of observable inputs and prices, different valuation models could produce materially different fair value estimates. The values presented may not represent future fair values and may not be realizable.
Changes in the fair value of debt securities available for sale and derivatives designated as effective cash flow hedges are recorded in our unaudited consolidated statements of financial condition and comprehensive income (loss) while changes in the fair value of equity securities, loans held for sale and other derivatives are recorded in the unaudited consolidated statements of financial condition and in the unaudited consolidated statements of income.
Investment Securities Impairment
We assess on a quarterly basis whether there have been any events or economic circumstances to indicate that a security in which we have an unrealized loss is impaired on an other-than-temporary basis. In any instance, we would consider many factors, including the severity and duration of the impairment, the portion of any unrealized loss attributable to a decline in the credit quality of the issuer, our intent and ability to hold the security for a period of time sufficient for a recovery in value, recent events specific to the issuer or industry, and, for debt securities, external credit ratings and recent downgrades. Securities with respect to which there is an unrealized loss that is deemed to be other-than-temporary are written down to fair value.
Non-GAAP Financial Measures
Some of the financial measures discussed in this Report are ‘‘non-GAAP financial measures.’’ In accordance with SEC rules, we classify a financial measure as being a non-GAAP financial measure if that financial measure excludes or includes amounts, or is subject to adjustments that have the effect of excluding or including amounts, that are included or excluded, as the case may be, in the most directly comparable measure calculated and presented in accordance with GAAP in our unaudited consolidated statements of financial condition, income or cash flows.
32
Pre-tax, pre-provision net earnings is defined as net income before taxes and provision for loan losses. We believe the most directly comparable GAAP financial measure is income before taxes. Disclosure of this measure enables you to compare our operations to those of other banking companies before consideration of taxes and provision expense. Efficiency ratio is defined as noninterest expenses divided by operating revenue, which is equal to net interest income plus noninterest income. Tangible book value per share is defined as tangible stockholders' equity divided by period end shares outstanding. We believe that these non-GAAP financial measures provide useful information to management and investors that is supplementary to our consolidated statements of financial condition, results of income and cash flows computed in accordance with GAAP. However, we acknowledge that our non-GAAP financial measures have a number of limitations. As such, you should not view these disclosures as a substitute for results determined in accordance with GAAP, and they are not necessarily comparable to non-GAAP financial measures that other banking companies use. Other banking companies may use names similar to those we use for the non-GAAP financial measures we disclose, but may calculate them differently. You should understand how we and other companies each calculate their non-GAAP financial measures when making comparisons.
The following reconciliation table provides a more detailed analysis of these non-GAAP financial measures:
As of or For the Three Months Ended | |||||||||||
(Dollars in thousands) | March 31, 2020 | December 31, 2019 | March 31, 2019 | ||||||||
Pre-tax, Pre-provision Net Earnings | |||||||||||
Income before taxes | $ | 10,754 | $ | 17,635 | $ | 16,923 | |||||
Plus: Provision for loan losses | 5,300 | 1,000 | 300 | ||||||||
Pre-tax, pre-provision net earnings | $ | 16,054 | $ | 18,635 | $ | 17,223 | |||||
Efficiency Ratio | |||||||||||
Noninterest expense (numerator) | $ | 16,859 | $ | 15,341 | $ | 16,249 | |||||
Net interest income | 32,115 | 33,162 | 32,092 | ||||||||
Noninterest income | 798 | 814 | 1,380 | ||||||||
Operating revenue (denominator) | $ | 32,913 | $ | 33,976 | $ | 33,472 | |||||
Efficiency ratio | 51.22 | % | 45.15 | % | 48.55 | % | |||||
(Dollars in thousands except per share data) | March 31, 2020 | December 31, 2019 | March 31, 2019 | ||||||||
Tangible Book Value Per Share | |||||||||||
Total assets | $ | 7,074,050 | $ | 7,045,828 | $ | 6,992,016 | |||||
Less: Goodwill | (3,297 | ) | (3,297 | ) | (3,297 | ) | |||||
Tangible assets | 7,070,753 | 7,042,531 | 6,988,719 | ||||||||
Less: Total liabilities | (6,470,710 | ) | (6,431,364 | ) | (6,403,718 | ) | |||||
Tangible stockholders' equity (numerator) | $ | 600,043 | $ | 611,167 | $ | 585,001 | |||||
Period end shares outstanding (denominator) | 54,286,465 | 55,999,754 | 56,351,781 | ||||||||
Tangible book value per share | $ | 11.05 | $ | 10.91 | $ | 10.38 | |||||
COVID-19
The COVID-19 pandemic has caused a substantial disruption to the economy, as well as a heightened level of uncertainty about the scope and longevity of its impact. In response to the pandemic, we have implemented a multi-pronged approach to address the challenges caused by the effects of this pandemic. Our approach includes ensuring the safety of our employees and the communities that we serve and developing new and temporarily revised programs that are responsive to the needs of our loan and deposit customers. Although we entered this environment with a fundamentally sound loan portfolio and strong liquidity and capital positions, as our results for the first quarter of 2020 demonstrate, we deemed it prudent to provide additional loss absorbing loan reserves. As we continue to closely monitor COVID-19 developments, we remain focused on our ability to navigate these challenging conditions and the underlying strength and stability of our Company.
33
Employees
The safety and health of our employees are of paramount importance to us. Financial institutions have been designated as an essential component of our nation’s critical infrastructure, therefore, all of our branches have remained open during this challenging time. To limit our branch employees' exposure to risks related to COVID-19, we have temporarily reduced our branch hours, expanded our phone support systems and enhanced branch safety protocols. Despite the staffing requirements of our branches, a remote working arrangement has been implemented for the vast majority of our non-branch employees and approximately two-thirds of our team are successfully working from home. In recognition of the demands caused by the "stay-at-home" orders on families, our employees are also being permitted to utilize a flexible work schedule to maintain our Company's productivity while fulfilling personal responsibilities. We have also provided other benefits such as wellness allowances for customer facing employees, as well as paid time off and counseling services for employees requiring additional assistance. Our employees have successfully risen to the challenge of supporting our customers during this difficult time by providing quality customer care for both deposit and lending services.
Borrowers
In late March 2020, the Company implemented a lending modification initiative to support customers financially impacted by the COVID-19 pandemic and unable to make their scheduled loan payments. The program provides borrowers the opportunity to modify their existing real estate loans by temporarily deferring payments for a specified period of time. In connection with the modifications, loan maturity dates are typically being extended for a commensurate period and deferred payments will be capitalized and reamortized into future monthly loan payments over the revised term of the loan. As a further accommodation to borrowers, all late charges are generally being waived for COVID-19 modifications. In conjunction with the passage of Section 4013 of the Coronavirus Aid, Relief, and Economic Security Act ("CARES Act"), banks have been provided the option to temporarily suspend certain requirements under U.S. GAAP related to loan delinquencies and troubled debt restructurings ("TDRs") for a limited time to account for the effects of COVID-19. As a result, the Company will not be recognizing eligible COVID-19 loan modifications as TDRs. Additionally, loans qualifying for these modifications will not be required to be reported as delinquent, nonaccrual, impaired or criticized solely as a result of a COVID-19 loan modification.
As there was minimal activity as of March 31, 2020, the following table details completed loan hardship applications submitted to the Company and currently under review and applications approved as of April 30, 2020:
Total Completed Applications Received (1) | Approved for Payment Deferral | ||||||||||||||||||||
(Dollars in thousands) | # of Loans | Current Balance | % of Loan Portfolio Segment | Monthly Cashflow Impact | # of Loans | Current Balance | % of Loan Portfolio Segment | Monthly Cashflow Impact | |||||||||||||
Multifamily residential | 61 | $ | 88,527 | 2.2 | % | $ | 445 | 11 | $ | 12,280 | 0.3 | % | $ | 61 | |||||||
Single family residential | 90 | 111,920 | 5.9 | % | 517 | 49 | 57,718 | 3.0 | % | 259 | |||||||||||
Commercial real estate | 14 | 51,167 | 24.4 | % | 274 | 3 | 13,559 | 6.5 | % | 73 | |||||||||||
Construction and land loans | 1 | 1,142 | 5.4 | % | 147 | 1 | 1,142 | 5.4 | % | 147 | |||||||||||
Total | 166 | $ | 252,756 | 4.1 | % | $ | 1,383 | 64 | $ | 84,699 | 1.4 | % | $ | 540 | |||||||
(1) Included in total completed applications above are 13 loans totaling $11.2 million, where an application was received and the deferral request was denied given a lack of current hardship. Not included in the table above are 232 incomplete applications received related to loans totaling $332.1 million and 17 withdrawn applications related to loans totaling $18.2 million. | |||||||||||||||||||||
At March 31, 2020, there were 5 single family residential loans totaling $6.0 million and 1 multifamily residential loan totaling $595 thousand that would have been reported as 30 days delinquent loans had the borrowers not requested COVID-19 loan payment deferrals.
The Bank continues to originate loans for single family and multifamily borrowers desiring to refinance loans or execute real estate purchase transactions. As a result of the pandemic, however, the Company has temporarily tightened its credit underwriting guidelines and discontinued accepting applications for certain loan programs such as those secured by second homes, nonresidential commercial properties and construction projects. While we continue to monitor the changing environment and the impacts of COVID-19 on employment and real estate values, at this time we remain committed to providing lending services required by the public. The Company has elected to not participate in the Small Business Administration's Payment Protection Program.
34
Depositors
To address depositors needs during the pandemic, we have kept all of our branches open, and have also increased ATM withdrawal limits with no fees to ensure customer access to liquidity and promote their safety. Furthermore, we have implemented the waiver of certain early withdrawal penalties and overdraft fees related to deposit accounts. In addition, we have enhanced our customer communications via mailings and website postings to inform them of telephonic, online and mobile options for transacting business, as well as the need to have a greater awareness of perpetrated scams and fraudulent schemes related to COVID-19. As of April 30, 2020, we have not experienced any material changes in deposit levels.
Allowance for Loan Losses
At March 31, 2020, 100% of our loan portfolio was secured by real estate collateral and 96.3% of our loan balances financed single family or multifamily residential housing having a weighted average loan-to-value of 59.4%. The Company has limited exposure to nonresidential commercial loans and little to no exposure to the industries most impacted by the pandemic such as travel, hospitality and entertainment. The following table shows the loan portfolio composition, with more granular emphasis on nonresidential commercial real estate, as of March 31, 2020:
(Dollars in thousands) | # of Loans | Balance | % of Total Loans | Weighted Average LTV (1) | |||||
Multifamily residential | 2,525 | $ | 4,058,869 | 65.3 | % | 56.6 | % | ||
Single family residential | 2,114 | 1,930,831 | 31.1 | % | 64.7 | % | |||
Commercial real estate type: | |||||||||
Strip Retail | 23 | 49,205 | 0.8 | % | 51.4 | % | |||
Mid Rise Office | 7 | 39,303 | 0.6 | % | 65.1 | % | |||
Low Rise Office | 14 | 25,448 | 0.4 | % | 55.2 | % | |||
Medical Office | 8 | 20,822 | 0.3 | % | 63.1 | % | |||
Shopping Center | 5 | 14,635 | 0.2 | % | 53.7 | % | |||
Multi-Tenant Industrial | 8 | 12,917 | 0.2 | % | 49.4 | % | |||
Anchored Retail | 3 | 12,477 | 0.2 | % | 53.9 | % | |||
More than 50% commercial | 10 | 9,611 | 0.2 | % | 49.2 | % | |||
Unanchored Retail | 6 | 7,603 | 0.1 | % | 44.9 | % | |||
Shadow Retail | 3 | 4,980 | 0.1 | % | 58.4 | % | |||
Warehouse | 4 | 3,110 | 0.1 | % | 41.4 | % | |||
Flex Industrial | 2 | 2,531 | — | % | 65.1 | % | |||
Restaurant | 2 | 1,550 | — | % | 34.4 | % | |||
Single-Tenant Industrial | 2 | 1,372 | — | % | 50.5 | % | |||
Other | 1 | 93 | — | % | 17.7 | % | |||
Commercial Real Estate | 98 | 205,657 | 3.2 | % | 55.6 | % | |||
Construction & Land Development | 14 | 22,857 | 0.4 | % | 53.0 | % | |||
Non-mortgage Loans | 1 | 100 | — | % | N/A | ||||
Total | 4,752 | $ | 6,218,314 | 100.0 | % | 59.1 | % | ||
(1) Construction and land development LTV is calculated based on an "as completed" property value. | |||||||||
35
As a result of the COVID-19 pandemic, we increased the qualitative component of our allowance for loan losses specific to the uncertainty surrounding the economic environment. During the current quarter, we added over $6.1 million to our reserves for this purpose. As there was a 23.1% reduction in our criticized loan balances during the quarter as compared to December 31, 2019, this improvement partially offset our required charge to increase reserves, and we recorded a first quarter provision for loan losses of $5.3 million. The following table shows the components attributed to the net increase in our allowance for loan losses during the first quarter of 2020:
(Dollars in thousands) | Balance | ||
12/31/2019 Allowance for Loan Losses | $ | 36,001 | |
COVID-19 economic impact | 6,143 | ||
Decline in criticized loans | (993 | ) | |
Net charge-offs | (644 | ) | |
Decline in loan portfolio | (37 | ) | |
Other qualitative changes | 187 | ||
3/31/2020 Allowance for Loan Losses | $ | 40,657 | |
Liquidity and Capital
As part of our response to COVID-19, we continue to closely monitor our liquidity and capital levels to ensure that we are properly prepared for the economic uncertainty caused by the pandemic. As of March 31, 2020, we maintained the following liquidity position:
(Dollars in thousands) | As of 3/31/2020 | % of Assets | |||
Cash & Cash Equivalents | $ | 105,078 | 1.5 | % | |
Unencumbered Liquid Securities | 653,444 | 9.2 | % | ||
Unutilized Brokered Deposit Capacity (1) | 372,807 | 5.3 | % | ||
Unutilized FHLB Borrowing Capacity (2) (3) | 646,291 | 9.1 | % | ||
Unutilized FRB Borrowing Capacity (2) | 163,675 | 2.3 | % | ||
Commercial Lines of Credit | 50,000 | 0.7 | % | ||
Total Liquidity | $ | 1,991,295 | 28.1 | % | |
(1) Capacity based on internal guidelines | |||||
(2) Capacity based on pledged loan collateral specific to the FHLB or FRB, as applicable | |||||
(3) Availability to borrow from the FHLB is permitted up to 40% of the Bank's assets or $2.8 billion. At March 31, 2020, we had $953.7 million and $187.6 million in outstanding advances and letters of credit with the FHLB, respectively. | |||||
36
The Company’s capital levels continue to be significantly above the minimum levels required for regulatory capital purposes. At March 31, 2020, our Tier 1 Leverage, Common Equity Tier 1 Risk-Based, Tier 1 Risk-Based and Total Risk-Based Capital ratios were 9.4%, 14.9%, 16.4% and 17.5%, respectively. Refer to Part I. Item 2. "Management's Discussion and Analysis of Financial Condition and Results of Operations" - "Capital Adequacy" for further details regarding our capital levels at March 31, 2020. The following graphs depict the Company’s capital position in relation to current regulatory requirements including capital conservation buffers:
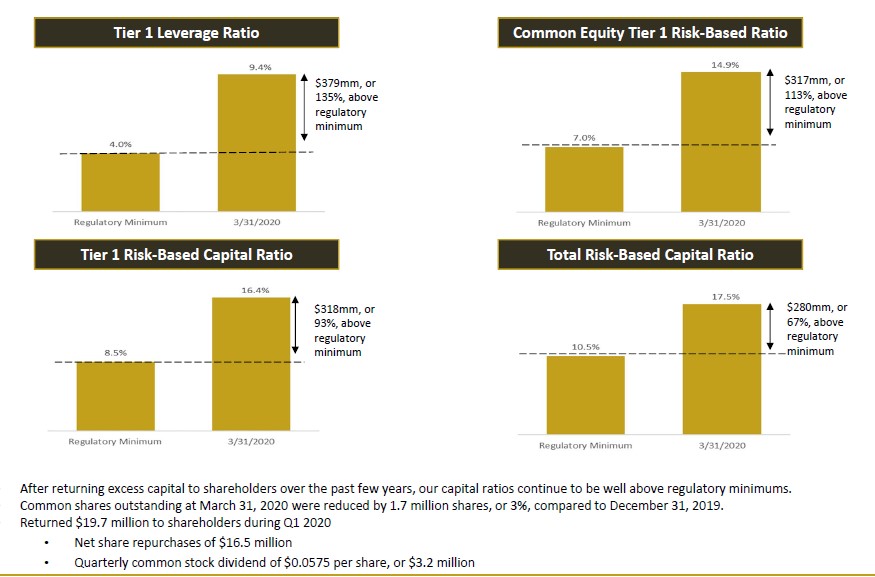
Results of Operations - Three Months Ended March 31, 2020 and 2019
Overview
For the three months ended March 31, 2020, our net income was $7.6 million as compared to $12.0 million for the same period last year. The decrease of $4.4 million, or 36.9%, was attributed primarily to an increase of $5.0 million in provision for loan losses, an increase in noninterest expense of $610 thousand and a decrease in noninterest income of $582 thousand, partially offset by a decrease of $1.7 million in income tax expense. Pre-tax, pre-provision net earnings decreased by $1.2 million, or 6.8%, for the three months ended March 31, 2020 as compared to the same period last year.
Net Interest Income
Net interest income increased by $23 thousand, or 0.1%, to $32.1 million for the three months ended March 31, 2020 from $32.1 million for the same period last year. Net interest income was impacted by a decline in the yield of our investment portfolio of 36 basis points, as well as a decline in earnings on our loan portfolio. The decrease in loan interest income as compared to the same period last year was caused by a decrease in the average loan yield of 5 basis points, partially offset by a $45.2 million increase in the average balance of loans. Net interest income was further impacted by a $293 thousand increase in interest expense on deposits caused by an increase in the average balance of interest-bearing deposits of $156.3 million compared to the same period last year, partially offset by a 5 basis point decline in the cost of interest-bearing deposits. These items were offset by a decrease in the average balance and cost of FHLB advances of $130.4 million and 19 basis points, respectively. Our net interest margin of 1.84% for the three months ended March 31, 2020 decreased from our net interest margin of 1.86% for the same
37
period last year. The decline in net interest margin from the same period last year primarily relates to the carry cost of swaps during the current quarter resulting from declines in variable interest rate payments received in connection with our swap agreements caused by multiple decreases in the federal funds rate approved by the Federal Reserve Board of Governor's Federal Open Market Committee beginning in August 2019.
Average balance sheet, interest and yield/rate analysis. The following table presents average balance sheet information, interest income, interest expense and the corresponding average yield earned and rates paid for the three months ended March 31, 2020 and 2019. The average balances are daily averages.
For the Three Months Ended March 31, | |||||||||||||||||||||||
2020 | 2019 | ||||||||||||||||||||||
(Dollars in thousands) | Average Balance | Interest Inc/Exp | Yield/Rate | Average Balance | Interest Inc/Exp | Yield/Rate | |||||||||||||||||
Interest-Earning Assets | |||||||||||||||||||||||
Multifamily residential | $ | 4,009,477 | $ | 40,594 | 4.05 | % | $ | 3,716,551 | $ | 37,801 | 4.07 | % | |||||||||||
Single family residential | 1,979,005 | 17,390 | 3.51 | % | 2,250,674 | 20,841 | 3.70 | % | |||||||||||||||
Commercial real estate | 204,118 | 2,355 | 4.61 | % | 189,485 | 2,256 | 4.76 | % | |||||||||||||||
Construction, land and NM | 21,334 | 366 | 6.90 | % | 11,983 | 155 | 5.25 | % | |||||||||||||||
Total Loans (1) | 6,213,934 | 60,705 | 3.91 | % | 6,168,693 | 61,053 | 3.96 | % | |||||||||||||||
Investment securities | 641,556 | 3,303 | 2.06 | % | 647,805 | 3,925 | 2.42 | % | |||||||||||||||
Cash, cash equivalents and restricted cash | 113,196 | 317 | 1.13 | % | 73,679 | 400 | 2.20 | % | |||||||||||||||
Total interest-earning assets | 6,968,686 | 64,325 | 3.69 | % | 6,890,177 | 65,378 | 3.80 | % | |||||||||||||||
Noninterest-earning assets (2) | 66,756 | 77,770 | |||||||||||||||||||||
Total assets | $ | 7,035,442 | $ | 6,967,947 | |||||||||||||||||||
Interest-Bearing Liabilities | |||||||||||||||||||||||
Transaction accounts | $ | 226,879 | 572 | 1.00 | % | $ | 220,225 | 720 | 1.31 | % | |||||||||||||
Money market demand accounts | 1,358,219 | 4,139 | 1.21 | % | 1,351,938 | 3,998 | 1.18 | % | |||||||||||||||
Time deposits | 3,569,897 | 19,870 | 2.21 | % | 3,426,550 | 19,570 | 2.28 | % | |||||||||||||||
Total deposits | 5,154,995 | 24,581 | 1.89 | % | 4,998,713 | 24,288 | 1.94 | % | |||||||||||||||
FHLB advances | 993,890 | 5,558 | 2.25 | % | 1,124,269 | 6,772 | 2.44 | % | |||||||||||||||
Junior subordinated debentures | 61,857 | 493 | 3.21 | % | 61,857 | 651 | 4.27 | % | |||||||||||||||
Senior debt | 94,427 | 1,578 | 6.68 | % | 94,304 | 1,575 | 6.68 | % | |||||||||||||||
Total interest-bearing liabilities | 6,305,169 | 32,210 | 2.03 | % | 6,279,143 | 33,286 | 2.12 | % | |||||||||||||||
Noninterest-bearing deposit accounts | 46,315 | 41,407 | |||||||||||||||||||||
Other noninterest-bearing liabilities | 67,827 | 60,573 | |||||||||||||||||||||
Total liabilities | 6,419,311 | 6,381,123 | |||||||||||||||||||||
Total stockholders' equity | 616,131 | 586,824 | |||||||||||||||||||||
Total liabilities and stockholders' equity | $ | 7,035,442 | $ | 6,967,947 | |||||||||||||||||||
Net interest spread (3) | 1.66 | % | 1.68 | % | |||||||||||||||||||
Net interest income/margin (4) | $ | 32,115 | 1.84 | % | $ | 32,092 | 1.86 | % | |||||||||||||||
(1) | Non-accrual loans are included in total loan balances. No adjustment has been made for these loans in the calculation of yields. Interest income on loans includes amortization of deferred loan costs, net of deferred loan fees. Net deferred loan cost amortization totaled $3.7 million and $2.6 million for the three months ended March 31, 2020 and 2019, respectively. |
(2) | Noninterest-earning assets includes the allowance for loan losses. |
(3) | Net interest spread is the average yield on total interest-earning assets minus the average rate on total interest-bearing liabilities. |
(4) | Net interest margin is net interest income divided by total interest-earning assets. |
Interest rates and operating interest differential. Increases and decreases in interest income and interest expense result from changes in average balances (volume) of interest-earning assets and interest-bearing liabilities, as well as changes in average interest rates. The following table shows the effect that these factors had on the interest earned from our interest-earning assets and interest incurred on our interest-bearing liabilities during the periods indicated.
38
The effect of changes in volume is determined by multiplying the change in volume by the prior period’s average rate. The effect of rate changes is calculated by multiplying the change in average rate by the prior period’s volume. The change in interest due to both rate and volume has been allocated to rate and volume changes in proportion to the relationship of the absolute dollar amounts of the changes in each.
Three Months Ended March 31, 2020 vs 2019 | |||||||||||
Variance Due To | |||||||||||
(Dollars in thousands) | Volume | Yield/Rate | Total | ||||||||
Interest-Earning Assets | |||||||||||
Multifamily residential | $ | 2,979 | $ | (186 | ) | $ | 2,793 | ||||
Single family residential | (2,421 | ) | (1,030 | ) | (3,451 | ) | |||||
Commercial real estate | 171 | (72 | ) | 99 | |||||||
Construction, land and NM | 151 | 60 | 211 | ||||||||
Total Loans | 880 | (1,228 | ) | (348 | ) | ||||||
Investment securities | (38 | ) | (584 | ) | (622 | ) | |||||
Cash, cash equivalents and restricted cash | 163 | (246 | ) | (83 | ) | ||||||
Total interest-earning assets | 1,005 | (2,058 | ) | (1,053 | ) | ||||||
Interest-Bearing Liabilities | |||||||||||
Transaction accounts | 22 | (170 | ) | (148 | ) | ||||||
Money market demand accounts | 22 | 119 | 141 | ||||||||
Time deposits | 865 | (565 | ) | 300 | |||||||
Total deposits | 909 | (616 | ) | 293 | |||||||
FHLB advances | (726 | ) | (488 | ) | (1,214 | ) | |||||
Junior subordinated debentures | — | (158 | ) | (158 | ) | ||||||
Senior debt | 3 | — | 3 | ||||||||
Total interest-bearing liabilities | 186 | (1,262 | ) | (1,076 | ) | ||||||
Net Interest Income | $ | 819 | $ | (796 | ) | $ | 23 | ||||
Total interest income decreased by $1.1 million, or 1.6%, for the three months ended March 31, 2020 as compared to the same period last year. Interest income on investments accounted for $622 thousand of that amount due to a decrease in the average yield on investment securities of 36 basis points. Additionally, interest income from loans decreased $348 thousand as the yield on loans decreased by 5 basis points, which impact was partially offset by a $45.2 million increase in the average balance of loans. The decline in our loan yield was primarily caused by the prepayment of higher yielding loans, which are being replaced by loans at lower current interest rates, a current quarter net cost of $390 thousand on interest rate swaps, as well as the net costs associated with elevated loan prepayments. The volume of new loans originated totaled $312.7 million and $311.5 million for the three months ended March 31, 2020 and 2019, respectively. Additionally, during the current quarter, we purchased multifamily residential loans with a total current loan balance of $20.4 million and a weighted average estimated yield of 3.51%. The weighted average rate on new loans for the three months ended March 31, 2020 was 3.98% as compared to 4.62% for the same period last year. The decline in the average coupon on originations was primarily due to the decline in market rates. Loan prepayment speeds were 19.58% and 13.66% during the three months ended March 31, 2020 and 2019, respectively. The weighted average rate on loan payoffs/curtailments during the three months ended March 31, 2020 was 4.32% as compared to 4.19% for the same period last year.
Total interest expense decreased $1.1 million to $32.2 million for the three months ended March 31, 2020 from $33.3 million for the same period last year primarily related to a decrease in the average balance and cost of FHLB advances of $130.4 million and 19 basis points, respectively. This item was partially offset by an increase of $293 thousand in interest expense on deposits caused by an increase in the average balance of interest-bearing deposits of $156.3 million compared to the same period last year, partially offset by a 5 basis point decline in the cost of interest-bearing deposits.
39
Provision for Loan Losses
For the quarter ended March 31, 2020, we recorded loan loss provisions of $5.3 million compared to $300 thousand for the same period last year. The loan loss provision recognized during the current quarter was primarily recorded to set aside reserves for the uncertain economic impacts associated with the COVID-19 pandemic. See Part I. Item 2. "Management's Discussion and Analysis of Financial Condition and Results of Operations" - "COVID-19" for additonal information. Nonperforming loans totaled $5.6 million, or 0.09% of total loans, at March 31, 2020, compared to $6.3 million, or 0.10%, and $1.5 million, or 0.02%, of total loans, at December 31, 2019 and March 31, 2019, respectively. Total criticized loans declined by $10.5 million, or 23.1%, during the current quarter as compared to December 31, 2019. During the current quarter, we recorded a $722 thousand charge-off related to a single family residential loan, which charge-off amount was fully reserved for at December 31, 2019. Our allowance for loan losses as a percentage of total loans was 0.65% at March 31, 2020 as compared to 0.56% and 0.58% at March 31, 2019 and December 31, 2019, respectively.
Noninterest Income
Noninterest income decreased by $582 thousand to $798 thousand for the three months ended March 31, 2020 from $1.4 million for the same period last year.
The following table presents the major components of our noninterest income:
For the Three Months Ended March 31, | ||||||||||||||
(Dollars in thousands) | 2020 | 2019 | $ Increase (Decrease) | % Increase (Decrease) | ||||||||||
Noninterest Income | ||||||||||||||
Gain on sale of loans | $ | — | $ | 333 | $ | (333 | ) | (100.0 | )% | |||||
FHLB dividends | 535 | 495 | 40 | 8.1 | % | |||||||||
Fee income | (38 | ) | 285 | (323 | ) | (113.3 | )% | |||||||
Other | 301 | 267 | 34 | 12.7 | % | |||||||||
Total noninterest income | $ | 798 | $ | 1,380 | $ | (582 | ) | (42.2 | )% | |||||
The decrease in noninterest income for the quarter ended March 31, 2020 compared to the quarter ended March 31, 2019, was primarily due to a $333 thousand gain on sale of loans recognized during the first quarter of 2019 and a $323 thousand decrease in servicing fee income earned. The decline in servicing fee income primarily related to elevated actual and estimated prepayments on serviced loans that decreased the fair value of our mortgage servicing rights during the current quarter.
Noninterest Expense
Noninterest expense increased $610 thousand, or 3.8%, to $16.9 million for the three months ended March 31, 2020 from $16.2 million for the three months ended March 31, 2019.
40
The following table presents the components of our noninterest expense for the three months ended March 31, 2020 and 2019:
For the Three Months Ended March 31, | ||||||||||||||
(Dollars in thousands) | 2020 | 2019 | $ Increase (Decrease) | % Increase (Decrease) | ||||||||||
Noninterest Expense | ||||||||||||||
Compensation and related benefits | $ | 11,205 | $ | 10,052 | $ | 1,153 | 11.5 | % | ||||||
Deposit insurance premium | 476 | 498 | (22 | ) | (4.4 | )% | ||||||||
Professional and regulatory fees | 431 | 441 | (10 | ) | (2.3 | )% | ||||||||
Occupancy | 1,140 | 1,390 | (250 | ) | (18.0 | )% | ||||||||
Depreciation and amortization | 669 | 665 | 4 | 0.6 | % | |||||||||
Data processing | 967 | 919 | 48 | 5.2 | % | |||||||||
Marketing | 875 | 1,154 | (279 | ) | (24.2 | )% | ||||||||
Other expenses | 1,096 | 1,130 | (34 | ) | (3.0 | )% | ||||||||
Total noninterest expense | $ | 16,859 | $ | 16,249 | $ | 610 | 3.8 | % | ||||||
The increase in noninterest expense during the quarter ended March 31, 2020 compared to the same period last year was primarily attributable to a $1.2 million increase in compensation costs primarily due to higher salary expenses and an increase in the required accrual for post-employment related benefits caused by an increase in the estimated future costs resulting from the recent decline in interest rates. This increase was partially offset by a $279 thousand decrease in marketing expenses related to deposit gathering efforts and a $238 thousand decline in rent costs related to the relocation of two facilities in the fourth quarter of 2019.
Income Tax Expense
For the three months ended March 31, 2020, we recorded income tax expense of $3.2 million as compared to $4.9 million for the same period last year with effective tax rates of 29.6% and 29.0%, respectively. The increase in our effective tax rate was primarily related to the vesting and settlement of stock awards and current year non-deductible executive compensation.
Financial Condition - As of March 31, 2020 and December 31, 2019
Total assets at March 31, 2020 were $7.1 billion, an increase of $28.2 million, or 0.4%, from December 31, 2019. The increase was primarily due to a $31.9 million increase in cash, cash equivalents and restricted cash and a $16.4 million increase in available for sale debt securities, partially offset by a $12.7 million, or 0.2%, decrease in loans. Total liabilities were $6.5 billion at March 31, 2020, an increase of $39.3 million, or 0.6%, from December 31, 2019. The increase in total liabilities was primarily attributable to growth in our deposits of $50.7 million, or 1.0%, partially offset by a decrease in FHLB advances of $25.0 million, or 2.6%, compared to December 31, 2019.
Loan Portfolio Composition
Our loan portfolio is our largest class of earning assets and typically provides higher yields than other types of earning assets. Associated with the higher yields is an inherent amount of credit risk which we attempt to mitigate with strong underwriting. As of both March 31, 2020 and December 31, 2019, our total loans held for investment amounted to $6.2 billion. The following table presents the balance and associated percentage of each major product type within our portfolio as of the dates indicated.
41
As of March 31, 2020 | As of December 31, 2019 | |||||||||||||
(Dollars in thousands) | Amount | % of total | Amount | % of total | ||||||||||
Real estate loans held for investment | ||||||||||||||
Multifamily residential | $ | 4,035,266 | 65.4 | % | $ | 3,962,929 | 64.1 | % | ||||||
Single family residential | 1,904,038 | 30.9 | % | 1,993,484 | 32.3 | % | ||||||||
Commercial real estate | 204,970 | 3.3 | % | 202,452 | 3.3 | % | ||||||||
Construction and land | 22,990 | 0.4 | % | 20,565 | 0.3 | % | ||||||||
Non-mortgage | 100 | — | % | 100 | — | % | ||||||||
Total loans before deferred items | 6,167,364 | 100.0 | % | 6,179,530 | 100.0 | % | ||||||||
Deferred loan costs, net | 50,950 | 51,447 | ||||||||||||
Total loans held for investment | $ | 6,218,314 | $ | 6,230,977 | ||||||||||
The relative composition of the loan portfolio has not changed significantly over the past few years. Our primary focus remains multifamily real estate lending, which constitutes 65% and 64% of our portfolio at March 31, 2020 and December 31, 2019, respectively. Single family residential lending is our secondary lending emphasis and represents 31% and 32% of our portfolio at March 31, 2020 and December 31, 2019, respectively. Single family residential loans have decreased slightly from the prior year due to elevated prepayments attributable to customers refinancing their hybrid-ARM loans to take advantage of lower long-term interest rates.
We recognize that these two loan products represent concentrations within our balance sheet. Multifamily loan balances as a percentage of risk-based capital were 578.6% and 562.3% as of March 31, 2020 and December 31, 2019, respectively. Our single family loans as a percentage of risk-based capital were 275.2% and 285.2% as of the same dates. Additionally, our loans are geographically concentrated with borrowers and collateral properties on the West Coast. At March 31, 2020, 61%, 26% and 11% of our real estate loans were collateralized by properties in southern California counties, northern California counties and Washington, respectively, compared to 61%, 26% and 11%, respectively, at December 31, 2019.
Our lending strategy has been to focus on products and markets where we have significant expertise. Given our concentrations, we have established strong risk management practices including risk-based lending standards, self-established product and geographical limits, annual evaluations of income property loans and semi-annual stress testing. Although we have temporarily tightened lending standards in response to the COVID-19 pandemic and have temporarily stopped accepting applications for loans secured by second homes, nonresidential commercial properties and construction projects, we expect to continue modestly growing our single family residential and multifamily residential loan portfolios.
We have a small portfolio of construction loans with commitments (funded and unfunded) totaling $44.6 million and $39.4 million at March 31, 2020 and December 31, 2019, respectively. Our construction lending typically focuses on single family residential projects with completed values of $5.0 million or less and multifamily projects with loan commitments of $15.0 million or less. In response to the aforementioned pandemic, we expect growth of our construction loan portfolio to be limited.
42
The following table presents the activity in our loan portfolio for the periods shown:
Three Months Ended March 31, | |||||||
(Dollars in thousands) | 2020 | 2019 | |||||
Loan Inflows: | |||||||
Multifamily residential | $ | 185,056 | $ | 198,385 | |||
Single family residential | 115,591 | 104,221 | |||||
Commercial real estate | 4,940 | 8,930 | |||||
Construction and land | 7,154 | — | |||||
Purchases | 20,380 | — | |||||
Total loans originated | 333,121 | 311,536 | |||||
Loan Outflows: | |||||||
Loan principal reductions and payoffs | (360,333 | ) | (247,216 | ) | |||
Portfolio loan sales | — | (52,850 | ) | ||||
Other (1) | 14,549 | 2,168 | |||||
Total loan outflows | (345,784 | ) | (297,898 | ) | |||
Net (decrease) increase in total loan portfolio | $ | (12,663 | ) | $ | 13,638 | ||
(1) Other changes in loan balances primarily represent the net change in disbursements on unfunded commitments, deferred loan costs, fair value adjustments and, to the extent applicable, may include foreclosures, charge-offs and negative amortization. | |||||||
Multifamily residential loans. We provide multifamily residential loans for the purchase or refinance of apartment buildings of five units or more, with the financed properties serving as collateral for the loan. Our multifamily lending is built around three core principles: market selection, deal selection and sponsor selection. We focus on markets with a high barrier to entry for new development, where there is a limited supply of new housing and where there is a high variance between the cost to rent and the cost to own. We typically lend on stabilized and seasoned assets and focus on older, smaller properties with rents at or below market levels, catering to low and middle income renters. Our customers are generally experienced real estate professionals who desire regular income/cash flow streams and are focused on building wealth steadily over time. We have instituted strong lending policies to mitigate credit and concentration risk. At March 31, 2020, our multifamily real estate portfolio had an average loan balance of $1.6 million, an average unit count of 15.1 units, a weighted average loan to value of 56.9% and a weighted average debt service coverage ratio of 1.50, as compared to an average loan balance of $1.6 million, an average unit count of 15.2 units, a weighted average loan to value of 56.9% and a weighted average debt service coverage ratio of 1.49 at December 31, 2019.
Single family residential loans. We provide permanent financing on single family residential properties primarily located in our market areas, which are both owner-occupied and investor owned. We conduct this business primarily through a network of third party mortgage brokers with the intention of retaining these loans in our portfolio. The majority of our originations are for purchase transactions, but we also provide refinancings. Our underwriting criteria focuses on debt ratios, credit scores, liquidity of the borrower and the borrower’s cash reserves. At March 31, 2020, our single family residential real estate portfolio had an average loan balance of $901 thousand, a weighted average loan to value of 64.7% and a weighted average credit score at origination/refreshed of 750. At December 31, 2019, our single family residential real estate portfolio had an average loan balance of $905 thousand, a weighted average loan to value of 64.6% and a weighted average credit score at origination/refreshed of 750.
Commercial real estate loans. While not a large part of our portfolio during any period presented, we also lend on nonresidential commercial real estate. Our commercial real estate loans are generally used to finance the purchase of established multi-tenant industrial, office and retail sites. At March 31, 2020, our commercial real estate portfolio had an average loan balance of $2.1 million, a weighted average loan to value of 55.6% and a weighted average debt service coverage ratio of 1.57, as compared to an average loan balance of $2.1 million, a weighted average loan to value of 55.9% and a weighted average debt service coverage ratio of 1.57 at December 31, 2019.
Other. Other categories of loans included in our portfolio include construction loans and non-mortgage loans. Construction loans currently consist primarily of single family construction projects. The non-mortgage loans in our
43
portfolio were provided in support of community investment efforts.
The following table sets forth the contractual maturity distribution of our loan portfolio:
(Dollars in thousands) | Due in 1 year or less | Due after 1 year through 5 years | Due after 5 years | Total | ||||||||||
As of March 31, 2020: | ||||||||||||||
Loans | ||||||||||||||
Real estate mortgage loans: | ||||||||||||||
Multifamily residential | $ | — | $ | 1,709 | $ | 4,033,557 | $ | 4,035,266 | ||||||
Single family residential | 3,808 | 1,344 | 1,898,886 | 1,904,038 | ||||||||||
Commercial real estate | 56 | 1,140 | 203,774 | 204,970 | ||||||||||
Construction and land | 18,044 | 4,946 | — | 22,990 | ||||||||||
Non-mortgage | — | — | 100 | 100 | ||||||||||
Total loans | $ | 21,908 | $ | 9,139 | $ | 6,136,317 | $ | 6,167,364 | ||||||
Fixed interest rates | $ | — | $ | 323 | $ | 30,585 | $ | 30,908 | ||||||
Floating or hybrid adjustable rates | 21,908 | 8,816 | 6,105,732 | 6,136,456 | ||||||||||
Total loans | $ | 21,908 | $ | 9,139 | $ | 6,136,317 | $ | 6,167,364 | ||||||
As of December 31, 2019: | ||||||||||||||
Loans | ||||||||||||||
Real estate mortgage loans: | ||||||||||||||
Multifamily residential | $ | — | $ | 1,498 | $ | 3,961,431 | $ | 3,962,929 | ||||||
Single family residential | 1,445 | 1,403 | 1,990,636 | 1,993,484 | ||||||||||
Commercial real estate | 58 | 1,640 | 200,754 | 202,452 | ||||||||||
Construction and land | 15,884 | 4,681 | — | 20,565 | ||||||||||
Non-mortgage | — | — | 100 | 100 | ||||||||||
Total loans | $ | 17,387 | $ | 9,222 | $ | 6,152,921 | $ | 6,179,530 | ||||||
Fixed interest rates | $ | — | $ | 352 | $ | 29,828 | $ | 30,180 | ||||||
Floating or hybrid adjustable rates | 17,387 | 8,870 | 6,123,093 | 6,149,350 | ||||||||||
Total loans | $ | 17,387 | $ | 9,222 | $ | 6,152,921 | $ | 6,179,530 | ||||||
Our fixed interest rate loans are primarily secured by single family residential properties in conjunction with our efforts to provide affordable housing to low-to-moderate income individuals. Our floating and adjustable rate loans are largely hybrid interest rate programs that provide an initial fixed term of 3 to 10 years and then convert to quarterly or semi-annual adjustments thereafter. As of March 31, 2020 and December 31, 2019, $4.0 billion and $3.9 billion, respectively, of our floating or hybrid adjustable rate loans were at their floor rates. The weighted average minimum interest rate on these loans was 4.14% at both March 31, 2020 and December 31, 2019. Hybrid adjustable rate loans still within their initial fixed term totaled $5.5 billion at both March 31, 2020 and December 31, 2019. These loans had a weighted average term to first repricing date of 3.32 years and 3.42 years at March 31, 2020 and December 31, 2019, respectively.
Refer to Part I. Item 2. "Management's Discussion and Analysis of Financial Condition and Results of Operations" - "COVID-19" for discussion regarding the lending initiatives implemented by the Company in connection with the COVID-19 pandemic.
Asset Quality
Our primary objective is to maintain a high level of asset quality in our loan portfolio. We believe our underwriting practices and policies, established by experienced professionals, appropriately govern the risk profile for our loan portfolio. These policies are continually evaluated and updated as necessary. All loans are assessed and assigned a risk classification at origination based on underlying characteristics of the transaction such as collateral type, collateral
44
cash flow, collateral coverage and borrower strength. We believe that we have a comprehensive methodology to proactively monitor our credit quality after origination. Particular emphasis is placed on our commercial portfolio where risk assessments are re-evaluated as a result of reviewing commercial property operating statements and borrower financials on at least an annual basis. Single family residential loans are subject to an annual credit score refresh. On an ongoing basis, we also monitor payment performance, delinquencies, and tax and property insurance compliance. We believe our practices facilitate the early detection and remediation of problems within our loan portfolio. Assigned risk ratings, as well as the evaluation of other credit metrics, are an integral part of management assessing the adequacy of our allowance for loan losses. We periodically employ the use of an outside independent consulting firm to evaluate our underwriting and risk assessment process. Like other financial institutions, we are subject to the risk that our loan portfolio will be exposed to increasing pressures from deteriorating borrower credit due to general economic conditions. Refer to Part I. Item 2. "Management's Discussion and Analysis of Financial Condition and Results of Operations" - "COVID-19" for discussion regarding loan modifications in connection with the COVID-19 pandemic.
Nonperforming assets. Our nonperforming assets consist of nonperforming loans and foreclosed real estate, if any. It is our policy to place a loan on non-accrual status in the event that the borrower is 90 days or more delinquent, unless the loan is well secured and in the process of collection, or earlier if the timely collection of contractual payments appears doubtful. Cash payments subsequently received on non-accrual loans are recognized as income only where the future collection of the remaining principal is considered by management to be probable. Loans are restored to accrual status only when the loan is less than 90 days delinquent and not in foreclosure, and the borrower has demonstrated the ability to make future payments of principal and interest. Refer to Part I. Item 2. "Management's Discussion and Analysis of Financial Condition and Results of Operations" - "COVID-19" for discussion regarding loan modifications in connection with the COVID-19 pandemic.
Troubled debt restructurings. Loans for which the terms have been modified resulting in a concession, and for which the borrower is experiencing financial difficulties, are considered TDRs. Concessions could include reductions of interest rates, extension of the maturity date at a rate lower than the current market rate for a new loan with similar risk, reduction of accrued interest, principal forgiveness, forbearance, or other material modifications. The assessment of whether a borrower is experiencing or will likely experience financial difficulty and whether a concession has been granted is highly subjective in nature, and management’s judgment is required when determining whether a modification is classified as a TDR. Refer to Part I. Item 2. "Management's Discussion and Analysis of Financial Condition and Results of Operations" - "COVID-19" for discussion regarding loan modifications in connection with the COVID-19 pandemic.
The following table provides details of our nonperforming and restructured assets as of the dates presented and certain other related information:
(Dollars in thousands) | March 31, 2020 | December 31, 2019 | |||||||
Non-accrual loans | |||||||||
Multifamily residential portfolio | $ | 537 | $ | 541 | |||||
Single family residential portfolio | 5,036 | 5,792 | |||||||
Total non-accrual loans | 5,573 | 6,333 | |||||||
Real estate owned | — | — | |||||||
Total nonperforming assets | $ | 5,573 | $ | 6,333 | |||||
Performing TDRs | $ | 1,296 | $ | 1,305 | |||||
Allowance for loan losses to period end nonperforming loans | 729.54 | % | 568.47 | % | |||||
Nonperforming loans to period end loans | 0.09 | % | 0.10 | % | |||||
Nonperforming assets to total assets | 0.08 | % | 0.09 | % | |||||
Nonperforming loans plus performing TDRs to total loans | 0.11 | % | 0.12 | % | |||||
When assessing whether a loan should be placed on non-accrual status because contractual payments appear doubtful, consideration is given to information we collect from third parties and our borrowers to substantiate their future ability to repay principal and interest due on their loans as contractually agreed.
For the three months ended March 31, 2020 and 2019, $22 thousand and $3 thousand, respectively, in interest income was recognized on non-accrual loans subsequent to their classification as non-accrual. For the three months ended March 31, 2020 and 2019, the Company recorded $16 thousand and $51 thousand, respectively, of interest income related to performing TDR loans. Gross interest income that would have been recorded on non-accrual loans had they
45
been current in accordance with their original terms was $71 thousand and $22 thousand for the three months ended March 31, 2020 and 2019, respectively.
Allowance for loan losses. Our allowance for loan losses is maintained at a level management believes is adequate to account for probable incurred credit losses in the loan portfolio as of the reporting date. We determine the allowance based on a quarterly evaluation of risk. That evaluation gives consideration to the nature of the loan portfolio, historical loss experience, known and inherent risks in the portfolio, the estimated value of any underlying collateral, adverse situations that may affect a borrower’s ability to repay, current economic and environmental conditions and risk assessments assigned to each loan as a result of our ongoing reviews of the loan portfolio. This process involves a considerable degree of judgment and subjectivity. In addition, various regulatory agencies, as an integral part of their examination process, periodically review the Bank’s allowance. Such agencies may require the Bank to recognize additions to the allowance based on judgments different from those of management.
Our allowance is established through charges to the provision for loan losses. Loans, or portions of loans, deemed to be uncollectible are charged against the allowance. Recoveries of previously charged-off amounts are credited to our allowance for loan losses. The allowance is decreased by the reversal of prior provisions when the total allowance balance is deemed excessive for the risks inherent in the portfolio. The allowance for loan losses balance is neither indicative of the specific amounts of future charge-offs that may occur, nor is it an indicator of any future loss trends. Refer to Part I. Item 2. "Management's Discussion and Analysis of Financial Condition and Results of Operations" - "COVID-19" for discussion regarding the impact of the COVID-19 pandemic on our allowance for loan losses.
The following table provides information on the activity within the allowance for loan losses as of and for the periods indicated:
Three Months Ended March 31, | ||||||||
(Dollars in thousands) | 2020 | 2019 | ||||||
Allowance for loan losses at beginning of period | $ | 36,001 | $ | 34,314 | ||||
Charge-offs: | ||||||||
Single family residential | (722 | ) | — | |||||
Total charge-offs | (722 | ) | — | |||||
Recoveries: | ||||||||
Single family residential | 3 | 3 | ||||||
Construction and land | 75 | 75 | ||||||
Total recoveries | 78 | 78 | ||||||
Net (charge-offs) recoveries | (644 | ) | 78 | |||||
Provision for loan losses | 5,300 | 300 | ||||||
Allowance for loan losses at period end | $ | 40,657 | $ | 34,692 | ||||
Allowance for loan losses to period end loans held for investment | 0.65 | % | 0.56 | % | ||||
Annualized net charge-offs (recoveries) to average loans | 0.04 | % | (0.01 | )% | ||||
Investment Portfolio
Our investment portfolio is generally comprised of government agency securities which are high-quality liquid investments under Basel III. The portfolio is primarily maintained to serve as a contingent, on-balance sheet source of liquidity and as such, is kept unencumbered. We manage our investment portfolio according to written investment policies approved by our board of directors. Our investment strategy aims to maximize earnings while maintaining liquidity in securities with minimal credit risk and interest rate risk which is reflective in the yields obtained on those securities. Most of our securities are classified as available for sale, although we occasionally purchase long-term fixed rate mortgage backed securities or municipal securities for community reinvestment purposes and classify those as held to maturity. In addition, we have equity securities which consist of investments in the CRA Qualified Investment Fund.
46
The following table presents the book value of our investment portfolio as of the dates indicated:
March 31, 2020 | December 31, 2019 | |||||||||||||
(Dollars in thousands) | Book Value | % of Total | Book Value | % of Total | ||||||||||
Available for sale debt securities (at fair value): | ||||||||||||||
Government and Government Sponsored Entities: | ||||||||||||||
Residential mortgage backed securities ('MBS") and collateralized mortgage obligations ("CMOs") | $ | 226,414 | 34.15 | % | $ | 145,192 | 22.44 | % | ||||||
Commercial MBS and CMOs | 358,943 | 54.12 | % | 356,169 | 55.05 | % | ||||||||
Agency bonds | 56,117 | 8.46 | % | 123,713 | 19.12 | % | ||||||||
U.S. Treasury | — | — | % | — | — | % | ||||||||
Total available for sale debt securities | 641,474 | 96.73 | % | 625,074 | 96.61 | % | ||||||||
Held to maturity (at amortized cost): | ||||||||||||||
Government Sponsored Entities: | ||||||||||||||
Residential MBS | 9,651 | 1.46 | % | 10,087 | 1.56 | % | ||||||||
Other investments | 81 | 0.01 | % | 83 | 0.01 | % | ||||||||
Total held to maturity debt securities | 9,732 | 1.47 | % | 10,170 | 1.57 | % | ||||||||
Equity securities (at fair value) | 11,970 | 1.80 | % | 11,782 | 1.82 | % | ||||||||
Total investment securities | $ | 663,176 | 100.00 | % | $ | 647,026 | 100.00 | % | ||||||
At March 31, 2020, there was no issuer, other than U.S. government agencies, where the aggregate book value or market value of such issuer’s securities held by the Company exceeded 10% of our stockholders’ equity.
Liabilities
Total liabilities increased $39.3 million, or 0.6%, to $6.5 billion at March 31, 2020 from December 31, 2019. The increase in total liabilities was primarily attributable to growth in our deposits of $50.7 million, or 1.0%, partially offset by a decrease in FHLB advances of $25.0 million, or 2.6%, compared to December 31, 2019.
Deposits
Representing 81.7% of our total liabilities as of March 31, 2020, deposits are our primary source of funding for our business operations. We have historically maintained and grown our deposit customer base in various rate environments based on our strong customer relationships, evidenced in part by increased deposits over recent years, as well as our reputation as a safe, sound, secure, "well-capitalized" institution and our commitment to excellent customer service. We are focused on growing our deposits by deepening our relationships with our existing loan and deposit customers and looking to expand our traditional product footprint with newer emphasis placed on specialty/business affiliations and transaction accounts. When competitively priced and/or for asset liability management purposes, we will supplement our deposits with wholesale deposits from deposit brokers and/or the State of California.
Total deposits increased by $50.7 million, or 1.0%, to $5.3 billion at March 31, 2020 from $5.2 billion as of December 31, 2019. Wholesale deposits increased $129.0 million, while retail deposits decreased $78.3 million. Time deposits represent 69.9% and 67.4% of total deposits at March 31, 2020 and December 31, 2019, respectively. We consider approximately 78.5% of our retail deposits at March 31, 2020 to be core deposits based on our internal methodology, which gives consideration to the tenure of customer relationships, product penetration and the relative cost of the deposit accounts.
Our loan to deposit ratio was 117.65% and 119.03% at March 31, 2020 and December 31, 2019, respectively. It is common for us to operate with a loan to deposit ratio exceeding those commonly seen at other banks. Our higher than average ratio is attributed to our use of FHLB borrowings to supplement loan growth and to strategically manage our interest rate risk, as well as our preference to maintain a large proportion of our assets in real estate loans which generally provide a better yield than high-quality liquid investments.
47
The following tables summarize our deposit composition by average deposits and average rates paid for the periods indicated:
Three Months Ended March 31, | |||||||||||||||||||
2020 | 2019 | ||||||||||||||||||
(Dollars in thousands) | Average Amount | Weighted average rate paid | Percent of total deposits | Average Amount | Weighted average rate paid | Percent of total deposits | |||||||||||||
Noninterest-bearing deposit accounts | $ | 46,315 | — | % | 0.9 | % | $ | 41,407 | — | % | 0.8 | % | |||||||
Interest-bearing transaction accounts | 226,879 | 1.00 | % | 4.4 | % | 220,225 | 1.31 | % | 4.4 | % | |||||||||
Money market demand accounts | 1,358,219 | 1.21 | % | 26.1 | % | 1,351,938 | 1.18 | % | 26.8 | % | |||||||||
Time deposits | 3,569,897 | 2.21 | % | 68.6 | % | 3,426,550 | 2.28 | % | 68.0 | % | |||||||||
Total | $ | 5,201,310 | 1.89 | % | 100.0 | % | $ | 5,040,120 | 1.94 | % | 100.0 | % | |||||||
The following table sets forth the maturity of time deposits as of March 31, 2020:
(Dollars in thousands except for column headings) | Under $100,000 | $100,000 and greater | ||||||
Remaining maturity: | ||||||||
Three months or less | $ | 548,545 | $ | 1,145,954 | ||||
Over three through six months | 166,743 | 886,986 | ||||||
Over six through twelve months | 121,912 | 403,022 | ||||||
Over twelve months | 66,928 | 353,700 | ||||||
Total | $ | 904,128 | $ | 2,789,662 | ||||
Percent of total deposits | 17.11 | % | 52.78 | % | ||||
The Company had time deposits that met or exceeded the FDIC insurance limit of $250 thousand of $1.6 billion and $1.4 billion at March 31, 2020 and December 31, 2019, respectively. At the same dates, the Company had $545.0 million and $416.0 million, respectively, of wholesale deposits.
FHLB Advances and Other Borrowings
In addition to deposits, we utilize collateralized FHLB borrowings to fund our loan growth. FHLB advances can, at times, have attractive rates and we have commonly used them to strategically extend the duration of our liabilities as part of our interest rate risk management. Total FHLB advances decreased $25.0 million, or 2.6%, to $953.7 million at March 31, 2020 compared to $978.7 million at December 31, 2019. As of March 31, 2020 and December 31, 2019, the Bank had FHLB letters of credit outstanding totaling $187.6 million and $62.6 million, respectively.
Historically, we have utilized other instruments such as trust preferred securities and senior debt at the bank holding company level as a source of capital for our Bank to support asset growth. We have established two trusts (the "Trusts") of which we own all the common securities, that have issued trust preferred securities, ("Trust Securities"), to investors in private placement transactions. The proceeds of the securities qualify as Tier 1 capital under the applicable regulations for community banks with total assets less than $15 billion. In accordance with GAAP, the Trusts are not consolidated in our unaudited consolidated statements of financial condition but rather the common securities are included in our other assets and the junior subordinated debentures ("Notes") issued to the Trusts are shown as a liability. The following table is a summary of our outstanding Trust Securities and related Notes as of the dates indicated (dollars in thousands):
March 31, 2020 | December 31, 2019 | Date | Maturity | Rate Index | ||||||||||||||||
Issuer | Amount | Rate | Amount | Rate | Issued | Date | (Quarterly Reset) | |||||||||||||
Luther Burbank Statutory Trust I | $ | 41,238 | 2.12 | % | $ | 41,238 | 3.27 | % | 3/1/2006 | 6/15/2036 | 3 month LIBOR + 1.38% | |||||||||
Luther Burbank Statutory Trust II | $ | 20,619 | 2.36 | % | $ | 20,619 | 3.51 | % | 3/1/2007 | 6/15/2037 | 3 month LIBOR + 1.62% | |||||||||
We have the right to defer payment of interest on the Notes at any time or from time to time for a period not exceeding
48
five years provided that no extension period may extend beyond the stated maturity of the relevant Note. During any such extension period, distributions on the Trust Securities will also be deferred, and our ability to pay dividends on our common stock will be restricted.
We have entered into contractual arrangements which, taken collectively, fully and unconditionally guarantee payment of: (i) accrued and unpaid distributions required to be paid on the Trust Securities; (ii) the redemption price with respect to any Trust Securities called for redemption by the Trusts; and (iii) payments due upon a voluntary or involuntary dissolution, winding up or liquidation of the Trusts. The Trust Securities are mandatorily redeemable upon maturity of the Notes, or upon earlier redemption as provided in the indenture. We have the right to redeem the Notes purchased by the Trusts, in whole or in part, on or after the redemption date. As specified in the indenture, if the Notes are redeemed prior to maturity, the redemption price will be the principal amount and any accrued but unpaid interest.
In 2014, we issued senior debt totaling $95.0 million to qualified institutional investors. These senior notes are unsecured, carry a fixed interest coupon of 6.5%, pay interest only on a quarterly basis and mature on September 30, 2024. The senior debt is redeemable at any time prior to August 31, 2024, at a redemption price equal to the greater of (i) 100% of the principal amount, or (ii) the sum of the present values of the remaining scheduled payments of principal and interest thereon discounted to the redemption date on a semi-annual basis at the calculated rate for a U. S. Treasury security having a comparable remaining maturity plus 30 basis points, plus in each case accrued and unpaid interest. On or after September 1, 2024, the senior debt may be redeemed at 100% of the principal amount plus accrued and unpaid interest.
The following table presents information regarding our FHLB advances and other borrowings as of and for the periods indicated:
Three Months Ended March 31, | ||||||||
(Dollars in thousands) | 2020 | 2019 | ||||||
FHLB advances | ||||||||
Average amount outstanding during the period | $ | 993,890 | $ | 1,124,269 | ||||
Maximum amount outstanding at any month-end during the period | 1,040,199 | 1,186,827 | ||||||
Balance outstanding at end of period | 953,694 | 1,109,625 | ||||||
Weighted average maturity (in years) | 2.6 | 2.3 | ||||||
Weighted average interest rate at end of period | 2.23 | % | 2.35 | % | ||||
Weighted average interest rate during the period | 2.25 | % | 2.44 | % | ||||
Junior subordinated deferrable interest debentures | ||||||||
Balance outstanding at end of period | $ | 61,857 | $ | 61,857 | ||||
Weighted average maturity (in years) | 16.8 | 17.8 | ||||||
Weighted average interest rate at end of period | 2.20 | % | 4.07 | % | ||||
Weighted average interest rate during the period | 3.21 | % | 4.27 | % | ||||
Senior unsecured term notes | ||||||||
Balance outstanding at end of period | $ | 94,447 | $ | 94,324 | ||||
Weighted average maturity (in years) | 4.6 | 5.6 | ||||||
Weighted average interest rate at end of period | 6.68 | % | 6.68 | % | ||||
Weighted average interest rate during the period | 6.68 | % | 6.68 | % | ||||
Our level of FHLB advances can fluctuate on a daily basis depending on our funding needs and the availability of other sources of funds to satisfy those needs. Short-term advances allow us flexibility in funding our daily liquidity needs.
49
The following table sets forth the amount of short-term borrowings outstanding, comprised entirely of FHLB advances, as well as the weighted average interest rate thereon, as of the dates indicated:
Three Months Ended March 31, | ||||||||
(Dollars in thousands) | 2020 | 2019 | ||||||
Outstanding at period end | $ | — | $ | 57,500 | ||||
Average amount outstanding | 23,753 | 142,974 | ||||||
Maximum amount outstanding at any month end | 63,000 | 209,700 | ||||||
Weighted average interest rate: | ||||||||
During period | 1.66 | % | 2.57 | % | ||||
End of period | — | % | 2.60 | % | ||||
Stockholders’ Equity
Stockholders’ equity totaled $603.3 million and $614.5 million at March 31, 2020 and December 31, 2019, respectively. The decrease in stockholders' equity is primarily related to stock repurchases of $16.5 million and dividends paid of $3.2 million, partially offset by net income of $7.6 million during the three months ended March 31, 2020.
During the three months ended March 31, 2020, the Company repurchased 1,962,395 shares in connection with its stock repurchase program at an average price of $8.43 per share, or a 23.7% discount to tangible book value at March 31, 2020, and a total cost of $16.5 million. During the month ended April 30, 2020, we repurchased an additional 1,309,286 shares at an average price per share of $9.56 and, as of April 30, 2020, we had $5.7 million remaining available for future share repurchases.
Off-Balance Sheet Arrangements
In the normal course of business, we enter into various transactions that are not included in our unaudited consolidated statements of financial condition in accordance with GAAP. These transactions include commitments to extend credit in the ordinary course of business including commitments to fund new loans and undisbursed funds, as well as certain guarantees and derivative transactions.
Loan commitments represent contractual cash requirements to a borrower although, a portion of these commitments to extend credit may expire without being drawn upon. Therefore, the total commitment amounts, shown below, do not necessarily represent future cash obligations. The following is a summary of our off-balance sheet arrangements outstanding as of the dates presented.
(Dollars in thousands) | March 31, 2020 | December 31, 2019 | ||||||
Commitments to fund loans held for investment | $ | 123,549 | $ | 103,227 | ||||
In connection with our Freddie Mac multifamily loan securitization, we entered into a reimbursement agreement pursuant to which we may be required to reimburse Freddie Mac for the first losses in the underlying loan portfolio, not to exceed 10% of the unpaid principal amount at settlement, or approximately $62.6 million. A $62.6 million letter of credit with the FHLB is pledged as collateral in connection with this reimbursement agreement. We have recorded a reserve for estimated losses with respect to the reimbursement obligation of $959 thousand and $1.0 million as of March 31, 2020 and December 31, 2019, respectively, which is included in other liabilities and accrued expenses on the unaudited consolidated statements of financial condition.
During the year ended December 31, 2019, we entered into two, two-year swap agreements with an aggregate notional amount of $1.0 billion to hedge the interest rate risk related to certain hybrid multifamily loans which are currently in their fixed rate period. The swaps involve the payment of a fixed rate amount to a counterparty in exchange for the Company receiving a variable rate payment over the life of the swaps without the exchange of the underlying notional amounts.
We guarantee the distributions and payments for redemption or liquidation of the Trust Securities issued by the Trusts to the extent of funds held by the Trusts. Although this guarantee is not separately recorded, the obligation underlying the guarantee is fully reflected on our unaudited consolidated statements of financial condition as junior subordinated
50
debentures held by the Trusts. The junior subordinated debentures currently qualify as Tier 1 capital under the Federal Reserve capital adequacy guidelines. With the exception of our obligations in connection with its Trust Securities and the items detailed above, we have no other off-balance sheet arrangements that have or are reasonably likely to have a current or future effect on our financial condition, changes in financial condition, revenues or expenses, results of operations, liquidity, capital expenditures, or capital resources, that is material to investors.
In addition, the Company maintains a $125.0 million letter of credit with the FHLB that is pledged as collateral to the State of California Treasurer's Office in connection with the Company's participation in a time deposit program with the State.
Contractual Obligations
The following table presents, as of March 31, 2020, our significant contractual obligations to third parties on debt and lease agreements and service obligations. For more information about our contractual obligations, see Part I, Item 1, "Financial Statements and Supplementary Data", Note 16. ‘‘Commitments and Contingencies,’’ in the notes to our unaudited consolidated financial statements in this Report.
Payments Due by Period | |||||||||||||||||||
Less than 1 Year | 1 to 3 Years | 3 to 5 Years | More than 5 Years | ||||||||||||||||
(Dollars in thousands) | Total | ||||||||||||||||||
Contractual Cash Obligations | |||||||||||||||||||
Time deposits (1) | $ | 3,693,790 | $ | 3,273,162 | $ | 412,177 | $ | 8,451 | $ | — | |||||||||
FHLB advances (1) | 953,694 | 100,000 | 400,700 | 452,250 | 744 | ||||||||||||||
Senior debt (1) | 95,000 | — | — | 95,000 | — | ||||||||||||||
Junior subordinated debentures (1) | 61,857 | — | — | — | 61,857 | ||||||||||||||
Operating leases | 17,359 | 4,487 | 7,491 | 3,064 | 2,317 | ||||||||||||||
Significant contract (2) | 1,930 | 1,730 | 200 | — | — | ||||||||||||||
Total | $ | 4,823,630 | $ | 3,379,379 | $ | 820,568 | $ | 558,765 | $ | 64,918 | |||||||||
(1) Amounts exclude interest | |||||||||||||||||||
(2) We have one significant, long-term contract for core processing services which expires May 9, 2021. The actual obligation is unknown and dependent on certain factors including volume and activities. For purposes of this disclosure, future obligations are estimated using our current year-to-date average monthly expense extrapolated over the remaining life of the contract. | |||||||||||||||||||
We believe that we will be able to meet our contractual obligations as they come due. Adequate cash levels are expected through profitability, repayments from loans and securities, deposit gathering activity, access to borrowing sources and periodic loan sales.
Liquidity Management and Capital Adequacy Liquidity Management
Liquidity refers to our capacity to meet our cash obligations at a reasonable cost. Our cash obligations require us to have cash flow that is adequate to fund loan growth and maintain on-balance sheet liquidity while meeting present and future obligations of deposit withdrawals, borrowing maturities and other contractual cash obligations. In managing our cash flows, management regularly confronts situations that can give rise to increased liquidity risk. These include funding mismatches, market constraints in accessing sources of funds and the ability to convert assets into cash. Changes in economic conditions or exposure to credit, market, operational, legal and reputational risks also could affect the Bank’s liquidity risk profile and are considered in the assessment of liquidity management.
We continually monitor our liquidity position to ensure that our assets and liabilities are managed in a manner to meet all reasonably foreseeable short-term, long-term and strategic liquidity demands. Management has established a comprehensive management process for identifying, measuring, monitoring and controlling liquidity risk. Because of its critical importance to the viability of the Bank, liquidity risk management is fully integrated into our risk management processes. Critical elements of our liquidity risk management include: effective corporate governance consisting of oversight by the board of directors and active involvement by management; appropriate strategies, policies, procedures, and limits used to manage and mitigate liquidity risk; comprehensive liquidity risk measurement and monitoring systems including stress tests that are commensurate with the complexity of our business activities; active management of intraday liquidity and collateral; an appropriately diverse mix of existing and potential future funding sources; adequate
51
levels of highly liquid marketable securities free of legal, regulatory, or operational impediments, that can be used to meet liquidity needs in stressful situations; comprehensive contingency funding plans that sufficiently address potential adverse liquidity events and emergency cash flow requirements; and internal controls and internal audit processes sufficient to determine the adequacy of the Bank’s liquidity risk management process.
Our liquidity position is supported by management of our liquid assets and liabilities and access to alternative sources of funds. Our liquidity requirements are met primarily through our deposits, FHLB advances and the principal and interest payments we receive on loans and investment securities. Cash on hand, unrestricted cash at third party banks, investments available for sale and maturing or prepaying balances in our investment and loan portfolios are our most liquid assets. Other sources of liquidity that are routinely available to us include funds from retail and wholesale deposits, advances from the FHLB and proceeds from the sale of loans. Less commonly used sources of funding include borrowings from the FRB discount window, draws on established federal funds lines from unaffiliated commercial banks and the issuance of debt or equity securities. We believe we have ample liquidity resources to fund future growth and meet other cash needs as necessary. Refer to Part I. Item 2. "Management's Discussion and Analysis of Financial Condition and Results of Operations" - "COVID-19" for additional discussion regarding liquidity.
Our total deposits at March 31, 2020 and December 31, 2019 were $5.3 billion and $5.2 billion, respectively. Based on the values of loans pledged as collateral, our $953.7 million of FHLB advances outstanding and our $125.0 million of FHLB letters of credit, we had $646.3 million of additional borrowing capacity with the FHLB at March 31, 2020. Based on the values of loans pledged as collateral, we had $163.7 million of borrowing capacity with the FRB at March 31, 2020. There were no outstanding advances with the FRB at March 31, 2020. In addition to the liquidity provided by the FHLB and FRB described above, we have established federal funds lines of credit with unaffiliated banks totaling $50.0 million at March 31, 2020, none of which was advanced at that date. In the ordinary course of business, we maintain correspondent bank accounts with unaffiliated banks which are used for normal business activity including ordering cash for our branch network, the purchase of investment securities and the receipt of principal and interest on those investments. Available cash balances at correspondent banks, including amounts at the FRB, totaled $105.1 million at March 31, 2020.
The Company is a corporation separate and apart from our Bank and, therefore, must provide for its own liquidity, including liquidity required to meet its debt service requirements on its senior notes and junior subordinated debentures. The Company’s main source of cash flow is dividends declared and paid to it by the Bank. There are statutory and regulatory limitations that affect the ability of our Bank to pay dividends to the Company. We believe that these limitations will not impact our ability to meet our ongoing short-term cash obligations. For contingency purposes, the Company typically maintains a minimum level of cash to fund one year’s projected operating cash flow needs.
Capital Adequacy
We are subject to various regulatory capital requirements administered by federal and state banking regulators. Our capital management consists of providing equity to support our current operations and future growth. Failure to meet minimum regulatory capital requirements may result in mandatory and possible additional discretionary actions by regulators that, if undertaken, could have a direct material effect on our financial statements. Under capital adequacy guidelines and the regulatory framework for prompt corrective action, we must meet specific capital guidelines that involve quantitative measures of our assets, liabilities and off-balance sheet items as calculated under regulatory accounting policies. As of March 31, 2020 and December 31, 2019, we were in compliance with all applicable regulatory capital requirements, including the capital conservation buffer, and the Bank qualified as ‘‘well-capitalized’’ for purposes of the FDIC’s prompt corrective action regulations. At March 31, 2020, the capital conservation buffer was 2.50%.
The vast majority of our multifamily residential loans and single family residential loans are currently eligible for 50% risk-weighting for purposes of calculating our regulatory capital levels. Risk-weighting requirements of multifamily residential loans and single family residential loans are contingent upon meeting specific criteria, which, if not adequately met, would increase the required risk-weighting percentage for these loans. Commercial real estate lending collateralized by real estate other than multifamily residential properties are generally risk weighted at 100%. Our leverage ratio is not impacted by the composition of our assets.
52
The following table presents our regulatory capital ratios as of the dates presented, as well as the regulatory capital ratios that are required by FDIC regulations to maintain ‘‘well-capitalized’’ status:
Minimum Required | |||||||||||||||||||||||
Actual | For Capital Adequacy Purposes | Plus Capital Conservation Buffer | For Well- Capitalized Institution | ||||||||||||||||||||
(Dollars in thousands) | Amount | Ratio | Amount | Ratio | Amount | Ratio | Amount | Ratio | |||||||||||||||
Luther Burbank Corporation | |||||||||||||||||||||||
As of March 31, 2020 | |||||||||||||||||||||||
Tier 1 Leverage Ratio | $ | 659,710 | 9.39 | % | $ | 281,125 | 4.00 | % | N/A | N/A | N/A | N/A | |||||||||||
Common Equity Tier 1 Risk-Based Ratio | 597,853 | 14.89 | % | 180,667 | 4.50 | % | $ | 281,037 | 7.00 | % | N/A | N/A | |||||||||||
Tier 1 Risk-Based Capital Ratio | 659,710 | 16.43 | % | 240,889 | 6.00 | % | 341,259 | 8.50 | % | N/A | N/A | ||||||||||||
Total Risk-Based Capital Ratio | 701,553 | 17.47 | % | 321,185 | 8.00 | % | 421,556 | 10.50 | % | N/A | N/A | ||||||||||||
As of December 31, 2019 | |||||||||||||||||||||||
Tier 1 Leverage Ratio | $ | 671,580 | 9.47 | % | $ | 283,631 | 4.00 | % | N/A | N/A | N/A | N/A | |||||||||||
Common Equity Tier 1 Risk-Based Ratio | 609,723 | 15.46 | % | 177,523 | 4.50 | % | $ | 276,147 | 7.00 | % | N/A | N/A | |||||||||||
Tier 1 Risk-Based Capital Ratio | 671,580 | 17.02 | % | 236,697 | 6.00 | % | 335,321 | 8.50 | % | N/A | N/A | ||||||||||||
Total Risk-Based Capital Ratio | 708,847 | 17.97 | % | 315,596 | 8.00 | % | 414,220 | 10.50 | % | N/A | N/A | ||||||||||||
Luther Burbank Savings | |||||||||||||||||||||||
As of March 31, 2020 | |||||||||||||||||||||||
Tier 1 Leverage Ratio | $ | 724,032 | 10.30 | % | $ | 281,227 | 4.00 | % | N/A | N/A | $ | 351,533 | 5.00 | % | |||||||||
Common Equity Tier 1 Risk-Based Ratio | 724,032 | 18.05 | % | 180,536 | 4.50 | % | $ | 280,833 | 7.00 | % | 260,774 | 6.50 | % | ||||||||||
Tier 1 Risk-Based Capital Ratio | 724,032 | 18.05 | % | 240,714 | 6.00 | % | 341,012 | 8.50 | % | 320,952 | 8.00 | % | |||||||||||
Total Risk-Based Capital Ratio | 765,875 | 19.09 | % | 320,952 | 8.00 | % | 421,250 | 10.50 | % | 401,190 | 10.00 | % | |||||||||||
As of December 31, 2019 | |||||||||||||||||||||||
Tier 1 Leverage Ratio | $ | 748,916 | 10.57 | % | $ | 283,542 | 4.00 | % | N/A | N/A | $ | 354,428 | 5.00 | % | |||||||||
Common Equity Tier 1 Risk-Based Ratio | 748,916 | 18.99 | % | 177,437 | 4.50 | % | $ | 276,012 | 7.00 | % | 256,297 | 6.50 | % | ||||||||||
Tier 1 Risk-Based Capital Ratio | 748,916 | 18.99 | % | 236,582 | 6.00 | % | 335,158 | 8.50 | % | 315,443 | 8.00 | % | |||||||||||
Total Risk-Based Capital Ratio | 786,183 | 19.94 | % | 315,443 | 8.00 | % | 414,019 | 10.50 | % | 394,303 | 10.00 | % | |||||||||||
Impact of Inflation and Changing Prices
Our unaudited consolidated financial statements and related notes have been prepared in accordance with GAAP, which require the measurement of financial position and operating results in terms of historical dollars, without considering the changes in the relative purchasing power of money over time due to inflation. The impact of inflation is reflected in the increased cost of operations. Unlike most industrial companies, nearly all of our assets and liabilities are monetary in nature. As a result, interest rates have a greater impact on our performance than do the effects of general levels of inflation. Interest rates do not necessarily move in the same direction or to the same extent as the price of goods or services.
Item 3. Quantitative and Qualitative Disclosures About Market Risk
Market risk represents the exposure to unanticipated changes in net interest earnings or loss due to changes in the market value of assets and liabilities as a result of fluctuations in interest rates. As a financial institution, our primary market risk is interest rate risk. Interest rate risk is the risk to earnings and value arising from volatility in market interest rates. Interest rate risk arises from timing differences in the repricings and maturities of interest-earning assets and interest-bearing liabilities (repricing risk), changes in the expected maturities of assets and liabilities arising from embedded options, such as borrowers’ ability to prepay loans at any time and depositors’ ability to redeem certificates of deposit before maturity (option risk), changes in the shape of the yield curve where interest rates increase or decrease in a nonparallel fashion (yield curve risk), and changes in spread relationships between different yield curves, such as U.S. Treasuries and LIBOR (basis risk).
We manage market risk though our Asset Liability Council ("ALCO") which is comprised of senior management who are responsible for ensuring that board approved strategies, policy limits, and procedures for managing interest rate risk are appropriately executed within the designated lines of authority and responsibility. The ALCO meets monthly
53
to review, among other things, the composition of our assets and liabilities, the sensitivity of our assets and liabilities to interest rate changes, our actual and forecasted liquidity position, investment activity and our interest rate hedging transactions. The ALCO reports regularly to our board of directors. Our board reviews all policies impacting asset and liability management and establishes risk tolerance limits for business operations on at least an annual basis.
Interest rate risk management is an active process that encompasses monitoring loan and deposit flows complemented by investment and funding activities. Effective management of interest rate risk begins with understanding the dynamic characteristics of assets and liabilities and determining the appropriate interest rate risk posture given business forecasts, management objectives, market expectations, and policy constraints. In recognition of this, we actively manage our assets and liabilities to maximize our net interest income and return on equity, while managing our risk exposure and maintaining adequate liquidity and capital positions.
Given the nature of our loan and deposit activities, we are liability sensitive to volatility in interest rates. A liability sensitive position refers to a balance sheet position in which an increase in short-term interest rates is expected to generate lower net interest income, as rates paid on our interest-bearing liabilities would reprice upward more quickly than rates earned on our interest-earning assets, thus compressing our net interest margin. Conversely, an asset sensitive position refers to a balance sheet position in which an increase in short-term interest rates is expected to generate higher net interest income, as rates earned on our interest-earning assets would reprice upward more quickly than rates paid on our interest-bearing liabilities, thus expanding net interest margin.
We use two primary modeling techniques to assess our exposure to interest rates that simulate the earnings and valuation effects of variations in interest rates: Net Interest Income at Risk ("NII at Risk") and the Economic Value of Equity ("EVE"). These models require that we use numerous assumptions, including asset and liability pricing and repricing, future growth, prepayment rates, non-maturity deposit sensitivity and decay rates. These assumptions are inherently uncertain and, as a result, the models cannot precisely predict the fluctuations in market interest rates or precisely measure the impact of future changes in interest rates. Actual results will differ from the model’s simulated results due to timing, magnitude and frequency of interest rate changes as well as changes in market conditions and the application and timing of various management strategies.
Stress testing the balance sheet and net interest income using instantaneous parallel shock movements in the yield curve of -100 to 400 basis points is a regulatory and banking industry practice. However, these stress tests may not represent a realistic forecast of future interest rate movements in the yield curve.
Instantaneous parallel interest rate shock modeling is not a predictor of actual future performance of earnings. It is a financial metric used to manage interest rate risk, implement hedging transactions if the metric rises above policy limits for interest rate risk, and track the movement of the bank’s interest rate risk position over a historical time frame for comparison purposes.
Our earnings are a function of collecting both a credit risk premium on our loans and an interest rate risk premium on our balance sheet position. The purpose of these premiums being to diversify our earnings position with both credit risk and interest rate risk, which tend to be negatively correlated historically for the Bank. During weak economic times, our loan losses have been higher than normal, but the Federal Reserve will generally reduce short-term interest rates in an attempt to stimulate the economy and add liquidity. As a result, our interest rate spread will generally increase during those periods. During strong economic times, when the Federal Reserve raises short-term interest rates to dampen economic activity, the Bank’s interest rate spread decreases. These periods have historically been indicative of inflation and real property value increases. As such, the decrease in net interest income is typically somewhat offset by declining loan losses in our loan portfolio. There is no guarantee, however, that the past countercyclical nature of our loan losses and our net interest spread declines will continue in the future.
On a quarterly basis, we measure and report NII at Risk to isolate the change in income related solely to interest-earning assets and interest-bearing liabilities. The following table illustrates the results of our NII at Risk analysis to determine the extent to which our net interest income over the following 12 months would change if prevailing interest rates increased or decreased by the specified amounts at March 31, 2020. It models instantaneous parallel shifts in market interest rates, implied by the forward yield curve over the next one year period.
54
Interest Rate Risk to Earnings (NII) | ||
March 31, 2020 | ||
(Dollars in millions) | ||
Change in Interest Rates (basis points) | $ Change NII | % Change NII |
+400 BP | $(13.1) | (9.1)% |
+300 BP | (7.6) | (5.3)% |
+200 BP | (4.0) | (2.8)% |
+100 BP | (1.6) | (1.1)% |
-100 BP | 1.4 | 1.0% |
The NII at Risk reported at March 31, 2020 reflects that our earnings are in a liability sensitive position in which an increase in interest rates is expected to generate lower net interest income. All NII stress tests measures were within our board established limits. During the three months ended March 31, 2020, our NII at Risk decreased as compared to December 31, 2019 due to the decline in interest rates and our interest rate swaps.
EVE measures the period end market value of assets minus the market value of liabilities and the change in this value as rates change. The EVE results included in the table below reflect the analysis reviewed monthly by management. It models instantaneous parallel shifts in market interest rates, implied by the forward yield curve. The EVE model calculates the market value of capital by taking the present value of all asset cash flows less the present value of all liability cash flows.
Interest Rate Risk to Capital (EVE) | ||
March 31, 2020 | ||
(Dollars in millions) | ||
Change in Interest Rates (basis points) | $ Change EVE | % Change EVE |
+400 BP | $(186.7) | (34.2)% |
+300 BP | (130.7) | (24.0)% |
+200 BP | (91.3) | (16.7)% |
+100 BP | (56.7) | (10.4)% |
-100 BP | 57.7 | 10.6% |
The EVE at Risk reported at March 31, 2020 reflects that our market value of capital is in a liability sensitive position in which an increase in interest rates is expected to generate lower market values of capital. All EVE stress tests measures were within our board established limits. During the three months ended March 31, 2020, our EVE at Risk increased as compared to December 31, 2019 primarily due to the decline in the Company's capital due to stock repurchases and asset growth during the quarter ended March 31, 2020, partially offset by the decline in interest rates.
Certain shortcomings are inherent in the NII and EVE analyses presented above. Both the NII and EVE simulations include assumptions regarding balances, asset prepayment speeds, deposit repricing and runoff and interest rate relationships among balances that we believe to be reasonable for the various interest rate environments. Differences in actual occurrences from these assumptions, as well as nonparallel changes in the yield curve, may change our market risk exposure. Simulated results are not intended to be used as a forecast of the actual effect of changes in market interest rates on our results, but rather as a means to better plan and execute appropriate interest rate risk strategies.
Hedge Positions
In managing our market risk, our board of directors has authorized the ALCO to utilize interest rate caps and swaps to mitigate on-balance sheet interest rate risk in accordance with regulations and our internal policy. We use or expect to use interest rate caps and swaps as macro hedges against inherent rate sensitivity in our loan portfolio, other interest-earning assets and our interest-bearing liabilities. Positions for hedging purposes are undertaken as mitigation to exposure primarily from mismatches between assets and liabilities.
We typically utilize FHLB advances with embedded interest rate caps to hedge our liability sensitive interest rate risk position. The interest rate caps embedded in FHLB advances do not qualify as derivative contracts. The cost of these contracts is inseparable from the cost of the advances and, as such, is included in interest expense in our unaudited consolidated statements of income. In addition, during 2019, we entered into two, two-year interest rate swaps with a
55
total notional amount of $1.0 billion to hedge the interest rate risk related to certain hybrid multifamily loans which are currently in their fixed rate period. The swaps are designated as fair value hedges and involve the payment of a fixed rate amount to a counterparty in exchange for the Company receiving a variable rate payment over the life of the swaps without the exchange of the underlying notional amount. The gain or loss on these derivatives, as well as the offsetting loss or gain on the hedged items attributable to the hedged risk are recognized in interest income for loans in our unaudited consolidated statements of income. During the three months ended March 31, 2020, the Company recognized a reduction in interest income of $390 thousand in connection with the swaps.
The following table summarizes FHLB borrowings with embedded caps and the derivative instruments utilized by us as interest rate risk hedge positions as of March 31, 2020:
(Dollars in thousands) | Fair Value | ||||||||||||||
Hedging Instrument | Hedge Accounting Type | Months to Maturity | Notional | Other Assets | Other Liabilities | ||||||||||
FHLB fixed rate advance | With embedded cap | 11 | 100,000 | — | — | ||||||||||
Interest rate swap | Fair value hedge | 15 | 500,000 | — | 9,238 | ||||||||||
Interest rate swap | Fair value hedge | 17 | 500,000 | — | 8,436 | ||||||||||
$ | 1,100,000 | $ | — | $ | 17,674 | ||||||||||
Counterparty Credit Risk
Derivative contracts involve the risk of dealing with institutional derivative counterparties and their ability to meet contractual terms. Our policies require that counterparties must be approved by our ALCO. Additionally, contracts are in place to ensure that minimum transfer amounts and collateral requirements are established.
Item 4. Controls and Procedures
Management of the Company, with the participation of its Chief Executive Officer and Chief Financial Officer, conducted an evaluation of the effectiveness as of March 31, 2020, of the Company's disclosure controls and procedures, as defined in Rules 13a-15(e) and 15(d)-15(e) under the Exchange Act. Based upon this evaluation, the Chief Executive Officer and Chief Financial Officer concluded that the Company's disclosure controls and procedures were effective as of March 31, 2020 in ensuring that information required to be disclosed by the Company in the reports that it files or submits under the Exchange Act is recorded, processed, summarized and reported within the time periods specified in the SEC's rules and forms, and that such information is accumulated and communicated to management of the Company as appropriate to allow timely decisions regarding required disclosures.
Changes in Internal Control over Financial Reporting
There was no change in the Company's internal control over financial reporting that occurred during the Company's last fiscal quarter that has materially affected, or is reasonably likely to materially affect, such controls.
56
PART II.
Item 1. Legal Proceedings
From time to time, we are party to legal actions that are routine and incidental to our business. Given the nature, scope and complexity of the extensive legal and regulatory landscape applicable to our business, we, like all banking organizations, are subject to heightened regulatory compliance and legal risk. However, based on available information, management does not expect the ultimate disposition of any or a combination of these actions to have a material adverse effect on our business, financial condition and results of operation.
Item 1A. Risk Factors
The section titled Risk Factors in Part I, Item 1A of our Annual Report includes a discussion of the many risks and uncertainties we face, any one or more of which could have a material adverse effect on our business, results of operations, financial condition (including capital and liquidity), or prospects or the value of or return on an investment in the Company. The information presented below provides an update to, and should be read in conjunction with, the risk factors and other information contained in our Annual Report. Except as presented below, there have been no material changes to the risk factors described in our Annual Report.
Our business and operations may be materially adversely affected by the COVID-19 pandemic and governmental authorities’ responses to the COVID-19 pandemic.
In December 2019, the COVID-19 outbreak was reported in China, and, in March 2020, the World Health Organization declared it a pandemic. Since March 13, 2020, the U.S. has been operating under a state of emergency declared in response to the spread of COVID-19. Many local and state governments, including the State of California, have instituted emergency restrictions that have substantially limited the operation of non-essential businesses and the activities of individuals. We are sensitive to general business and economic conditions in the U.S. generally, and on the West Coast in particular. The duration and impacts of the pandemic and governmental authorities’ responses to it are not yet known or knowable. Circumstances related to the COVID-19 pandemic and related events continue to change quickly. The spread of COVID-19, and government responses to it, have resulted in increased volatility in financial markets, very large increases in unemployment and the closure of non-essential businesses in our markets. The extent of COVID-19’s impact on us is unpredictable and depends on a number of factors outside of our control, such as the scope and duration of the pandemic, the nature and scope of any resulting economic downturn, customer response, and actions that governmental authorities may take in response to the pandemic.
Given the ongoing and dynamic nature of the circumstances, it is not possible to predict the ultimate impact of the pandemic on our stock price, business prospects, financial condition or results of operations. COVID-19 could cause a decline in the value of mortgaged properties or other assets that serve as our collateral and increase the risk of delinquencies, defaults, foreclosures and losses on our loans, damage our banking facilities and offices, negatively impact regional economic conditions, result in a decline in loan demand and loan originations, result in drawdowns of deposits by customers impacted by COVID-19, result in branch or office closures and business interruptions, and negatively impact the implementation of our business strategy. COVID-19, and governmental authorities’ responses to it, may also result in prolonged adverse economic conditions which could constrain our growth and profitability from our operations, and could have a material adverse effect on our business, financial condition and results of operations.
We are subject to increasing credit risk as a result of the COVID-19 pandemic, which could adversely impact our profitability.
Our business depends on our ability to successfully measure and manage credit risk. As a mortgage lender, we are exposed to the risk that the principal of, or interest on, a loan will not be paid timely or at all or that the value of any collateral supporting a loan will be insufficient to cover our outstanding exposure. In addition, we are exposed to risks with respect to the risks resulting from changes in economic and industry conditions and risks inherent in dealing with individual loans and borrowers. As the overall economic climate in the U.S., generally, and in our market areas specifically, experiences material disruption due to the COVID-19 pandemic, our borrowers may experience difficulties in repaying their loans and governmental actions may provide mortgage payment relief to borrowers affected by COVID-19 and preclude our ability to initiate foreclosure proceedings in certain circumstances, and as a result, the collateral we hold may decrease in value or become illiquid, and the level of nonperforming loans, charge-offs and delinquencies could rise and require significant additional provisions for loan losses. Additional factors related to the credit quality of investor-owned single family residential, multifamily residential and other commercial real estate loans
57
include the duration of state and local moratoriums on evictions for non-payment of rent or other fees. The payment on these loans that are secured by income producing properties are typically dependent on the successful operation of the related real estate property and may subject us to risks from adverse conditions in the real estate market or the general economy.
We are actively working to support our mortgage borrowers to mitigate the impact of the COVID-19 pandemic on them and on our portfolio, including through loan modifications that defer payments for a specified period of time for those who experienced a hardship as a result of the COVID-19 pandemic. As of April 30, 2020, we have modified an aggregate of $84.7 million in principal amount of mortgage loans, representing 1.4% of our loan portfolio. However, our inability to successfully manage the increased credit risk caused by the COVID-19 pandemic could have a material adverse effect on our business, financial condition and results of operations.
Demand for real estate loan products may decline significantly.
There is a risk that COVID-19 could significantly adversely affect the U.S. residential and commercial real estate markets, including decreasing property values, and reduced demand for commercial and multifamily real estate and increased vacancies if businesses fail or close locations. In response to the COVID-19 pandemic, state and local executive orders have been issued in our markets that include moratoriums on evictions for non-payment and limitations on the ability of real estate professionals to conduct their business, among other provisions. As a result, demand for the types of real estate secured loans that we originate may decrease, which would reduce our profitability and could materially adversely affect our business, financial condition and results of operations.
Our business and operations are concentrated in California and Washington, and we are more sensitive than our more geographically diversified competitors to adverse changes in the local economy.
Unlike many of our larger competitors that maintain significant operations located outside our market areas, substantially all of our customers are individuals and businesses located and doing business in the states of California and Washington. Our operations and profitability may be more adversely affected by a local economic downturn than those of large, more geographically diverse competitors. A downturn in the local economy could make it more difficult for our borrowers to repay their loans and may lead to loan losses that are not offset by operations in other markets. A downturn in the local economy may also reduce the ability of depositors to make or maintain deposits with us. Both of these states are currently operating under state-wide “stay-at-home” orders issued in response to the COVID-19 pandemic. For these reasons, any regional or local economic downturn resulting from the COVID-19 pandemic or government responses to the pandemic could have a material adverse effect on our business, financial condition and results of operations.
We are subject to increased cybersecurity risks and security breaches during the COVID-19 pandemic.
Our business faces increased cybersecurity risks due to the number of employees working remotely. Increased levels of remote access create additional opportunities for cybercriminals to exploit vulnerabilities, and employees may be more susceptible to phishing and social engineering attempts due to increased stress caused by the COVID-19 pandemic and from balancing family and work responsibilities at home. Technology resources may also be strained due to the increase in the number of remote users. It is possible that we may not be able to anticipate or to implement effective preventive measures against all security breaches. If an actual or perceived security breach occurs, customer perception of the effectiveness of our security measures could be harmed and could result in the loss of customers.
A successful penetration or circumvention of the security of our systems, including those of third party providers or other financial institutions, or the failure to meet regulatory requirements for security of our systems, could cause serious negative consequences, including significant disruption of our operations, misappropriation of our confidential information or that of our customers, or damage to our computers or systems or those of our customers or counterparties, significant increases in compliance costs (such as repairing systems or adding new personnel or protection technologies), and could result in violations of applicable privacy and other laws, financial loss to us or to our customers, loss of confidence in our security measures, customer dissatisfaction, significant litigation and regulatory exposure, and harm to our reputation, all of which could have a material adverse effect on our business, financial condition and results of operations.
58
We may be adversely affected by the soundness of other financial institutions during the COVID-19 pandemic.
The COVID-19 pandemic has materially increased the risk associated with the interconnectedness of financial institutions. Our ability to engage in routine funding transactions could be adversely affected by the actions and commercial soundness of other financial institutions. Financial services companies are interrelated as a result of trading, clearing, counterparty, and other relationships. As a result, defaults by, or even rumors or questions about, one or more financial services companies, or the financial services industry generally, could lead to market-wide liquidity problems and losses or defaults by us or other institutions. These losses could have a material adverse effect on our business, financial condition and results of operations.
We are dependent on our management team and key employees, and if they were unable to perform their duties as a result of COVID-19, our business operations could be materially adversely affected.
Our success depends, in large part, on our management team and key employees. Many of our critical functions are conducted by a small number of individuals. We have taken steps to mitigate exposure risk for our staff, including timely implementation of federal, state and local guidance and increasing our remote work capabilities. We have in place contingency succession plans for our management team and key employees. However, if one or more members of one of these groups were incapacitated as a result of the COVID-19 pandemic, it could have a material adverse effect on our business, financial condition and results of operations.
The impact of the COVID-19 pandemic is unknown and adds increased risk and uncertainty to our calculation of an adequate allowance for loan losses.
The extent of COVID-19’s impact on our business and our borrowers is unpredictable and depends on a number of factors outside of our control, introducing additional uncertainty into our allowance for loan loss calculations. We periodically review our allowance for loan losses for adequacy considering historical loss experience, volume and types of loans, trends in classification, volume and trends in delinquencies and non-accrual loans, economic conditions and other pertinent information. The determination of the appropriate level of the allowance for loan losses is inherently highly subjective and requires us to make significant estimates of and assumptions regarding current credit risk and future trends, all of which may change materially. These estimates of loan losses are necessarily subjective and their accuracy depends on the outcome of future events. Inaccurate management assumptions, continuing deterioration of economic conditions affecting borrowers, new information regarding existing loans, identification of additional problem loans and other factors, both within and outside of our control, may require us to increase our allowance for loan losses. In addition, our regulators, as an integral part of their examination process, periodically review our loan portfolio and the adequacy of our allowance for loan losses and may require adjustments based upon judgments that are different than those of management. Differences between our actual experience and assumptions and the effectiveness of our models could adversely affect our business, financial condition and results of operations.
Liquidity risk could impair our ability to fund operations and meet our obligations as they become due and failure to maintain sufficient liquidity could materially adversely affect our growth, business, profitability and financial condition.
Liquidity is essential to our business. Liquidity risk is the potential that we will be unable to meet our obligations as they become due because of an inability to liquidate assets or obtain adequate funding at a reasonable cost, in a timely manner and without adverse conditions or consequences. We require sufficient liquidity to fund asset growth, meet customer loan requests, customer deposit maturities and withdrawals, payments on our debt obligations as they come due and other cash commitments under both normal operating conditions and other unpredictable circumstances, including events causing industry or general financial market stress such as the COVID-19 pandemic. Liquidity risk can increase due to a number of factors, including an over-reliance on a particular source of funding or market-wide phenomena such as market dislocation and major disasters. Factors that could detrimentally impact access to liquidity sources include, but are not limited to, a decrease in the level of our deposit activity as a result of a downturn in the markets in which our loans are concentrated, a decrease in real estate values ultimately impairing the value of our loans used by us as collateral to access wholesale liquidity, adverse regulatory actions against us, or changes in the liquidity needs of our depositors. Market conditions or other events could also negatively affect the level or cost of funding, affecting our ongoing ability to accommodate liability maturities and deposit withdrawals, meet contractual obligations, and fund asset growth and new business transactions at a reasonable cost, in a timely manner, and without adverse consequences. Our inability to raise funds through deposits, borrowings, the sale of loans, and other sources could have a substantial negative effect on our business, and could result in the closure of the Bank. Our access to funding sources in amounts adequate to finance our activities or on acceptable terms could be impaired by factors
59
that affect our organization specifically or the financial services industry or economy in general. Any substantial, unexpected, and/or prolonged change in the level or cost of liquidity could impair our ability to fund operations and meet our obligations as they become due and could have a material adverse effect on our business, financial condition and results of operations.
We rely on customer deposits, advances from the FHLB and brokered deposits to fund our operations. Although we have historically been able to replace maturing deposits and advances, if desired, including throughout the most recent recession, which lasted from December 2007 through June 2009, we may not be able to replace such funds in the future if our financial condition, the financial condition of the FHLB or market conditions change. FHLB borrowings and other current sources of liquidity may not be available or, if available, sufficient to provide adequate funding for operations.
We depend on information technology and telecommunications systems of third parties, and any systems failures or interruptions resulting from or related to COVID-19 could adversely affect our operations and financial condition.
Our business depends on the successful and uninterrupted functioning of our information technology and telecommunications systems. We outsource many of our major systems, such as data processing, deposit processing, loan origination, email and anti-money laundering monitoring systems. Of particular significance is our long term contract for core data processing services with Fiserv. The failure of these systems, or the termination (for force majeure reasons related to COVID-19 or otherwise) of a third party software license or service agreement on which any of these systems is based, could interrupt our operations, and we could experience difficulty in implementing replacement solutions. In many cases, our operations rely heavily on secured processing, storage and transmission of information and the monitoring of a large number of transactions on a minute-by-minute basis, and even a short interruption in service could have significant consequences. Remote working and other factors related to the COVID-19 pandemic may significantly increase the demand and stress on information technology and telecommunications systems. Because our information technology and telecommunications systems interface with and depend on third party systems, we could experience service denials if demand for such services exceeds capacity or such third party systems fail or experience interruptions. Moreover, “stay-at-home” orders to non-essential businesses could affect the services we rely on from our third party vendors. If significant, sustained or repeated, a system failure or service denial could compromise our ability to operate effectively, damage our reputation, result in a loss of customer business, and subject us to additional regulatory scrutiny and possible financial liability, any of which could have a material adverse effect on our business, financial condition and results of operations.
Item 2. Unregistered Sales of Equity Securities and Use of Proceeds
Unregistered Sales of Equity Securities
None.
Purchases of Equity Securities
The table below summarizes the Company's monthly repurchases of equity securities during the three months ended March 31, 2020 (dollars in thousands, except per share data):
Period | Total Number of Shares Purchased | Average Price Paid Per Share | Total Number of Shares Purchased as Part of Publicly Announced Plans or Programs (1) | Approximate Dollar Value of Shares that May Yet be Purchased Under the Plans or Program (1) | ||||||||||
January 1-31, 2020 | 7,000 | $ | 10.64 | 7,000 | $ | 4,640 | ||||||||
February 1-29, 2020 | 46,821 | 10.68 | 46,821 | 19,139 | ||||||||||
March 1-31, 2020 | 1,908,574 | 8.37 | 1,908,574 | 18,168 | ||||||||||
Total | 1,962,395 | $ | 8.43 | 1,962,395 | $ | 18,168 | ||||||||
(1) In August 2018, the Company's Board of Directors authorized the purchase of up to $15.0 million of the Company's common stock from August 17, 2018 through December 31, 2019 (the "Repurchase Program"), which was announced by press release and Current Report on Form 8-K on August 16, 2018 and August 17, 2018, respectively. Under the
60
Repurchase Program, the Company may acquire its common stock in the open market or in privately negotiated transactions, including 10b5-1 plans. The Repurchase Program may be modified, suspended or terminated by the Board of Directors at any time without notice. In December 2018, the Company adopted a systematic stock repurchase plan in accordance with, and as part of, the Repurchase Program. The plan was effective from December 17, 2018 until two days following the Company's release of its 2018 year-end financial results and was announced by press release and Current Report on Form 8-K on December 14, 2018. In January 2019, the Company adopted a systematic stock repurchase plan in accordance with, and as part of, the Repurchase Program. The plan was effective from January 31, 2019 until December 31, 2019 and was announced by Current Report on Form 8-K on February 1, 2019. These plans were adopted under the guidelines specified by Rule 10b5-1 and under Rule 10b-18 under the Securities Exchange Act of 1934, as amended, and the Company's Insider Trading Policy. On October 23, 2019, the plan was extended from December 31, 2019 to December 31, 2020 and was announced by Current Report on Form 8-K on October 23, 2019. In February 2020, the Company's Board of Directors authorized the repurchase of an additional $15.0 million of the Company's common stock under the Repurchase Program, which was announced on Form 8-K on February 26, 2020. In March 2020, the Company's Board of Directors further authorized the repurchase of an additional $15.0 million of the Company's common stock under the Repurchase Program, which was announced on Form 8-K on March 12, 2020.
Item 3. Defaults Upon Senior Securities
None.
Item 4. Mine Safety Disclosures
Not applicable.
Item 5. Other Information
None.
61
Item 6. Exhibits
Incorporated by Reference | ||||||||||||
Exhibit Number | Description | Filed Herewith | Form | File No. | Exhibit | Filing Date | ||||||
3.1 | S-1 | 333-221455 | 3.1 | 11/9/2017 | ||||||||
3.2 | S-1 | 333-221455 | 3.2 | 11/9/2017 | ||||||||
4.1 | S-1 | 333-221455 | 4.1 | 11/9/2017 | ||||||||
Pursuant to Item 601(b) (4) (iii) (A) of Regulation S-K, copies of instruments defining the rights of holders of long-term debt and preferred securities are not filed. The Company agrees to furnish a copy thereof to the SEC upon request. | ||||||||||||
31.1 | X | |||||||||||
31.2 | X | |||||||||||
32.1 | X | |||||||||||
32.2 | X | |||||||||||
101 | Pursuant to Rule 405 of Regulation S-T, the following financial information from the Company’s Quarterly Report on Form 10-Q for the period ended March 31, 2020 is formatted in XBRL (Extensible Business Reporting Language) interactive data files: (i) the Consolidated Statements of Financial Condition (Unaudited), (ii) the Consolidated Statements of Income (Unaudited), (iii) the Consolidated Statements of Comprehensive Income (Unaudited), (iv) the Consolidated Statements of Changes in Stockholders' Equity (Unaudited), (v) the Consolidated Statements of Cash Flows (Unaudited), and (vi) the Notes to Unaudited Condensed Consolidated Financial Statements. | X | ||||||||||
(1) Not filed in accordance with the provision of Item 601(b)(4)(v) of Regulation S-K. The Company agrees to provide a copy of these documents to the Commission upon request. | ||||||||||||
62
SIGNATURES
Pursuant to the requirements of the Securities Exchange Act of 1934, the registrant has duly caused this report to be signed on its behalf by the undersigned thereunto duly authorized.
LUTHER BURBANK CORPORATION | |||
DATED: | MAY 8, 2020 | By: /s/ Simone Lagomarsino | |
Simone Lagomarsino | |||
President and Chief Executive Officer | |||
DATED: | MAY 8, 2020 | By: /s/ Laura Tarantino | |
Laura Tarantino | |||
Executive Vice President and Chief Financial Officer | |||
63