Attached files
| file | filename |
|---|---|
| EX-99.1 - EX-99.1 - BROADRIDGE FINANCIAL SOLUTIONS, INC. | ex991earningsrelease3q.htm |
| 8-K - 8-K - BROADRIDGE FINANCIAL SOLUTIONS, INC. | br-20200508.htm |

EXHIBIT 99.2 Q3 Earnings Webcast and Conference Call Third Quarter Fiscal Year 2020
Forward-Looking Statements This presentation and other written or oral statements made from time to time by representatives of Broadridge Financial Solutions, Inc. ("Broadridge" or the "Company") may contain “forward-looking statements” within the meaning of the Private Securities Litigation Reform Act of 1995. Statements that are not historical in nature, and which may be identified by the use of words such as “expects,” “assumes,” “projects,” “anticipates,” “estimates,” “we believe,” “could be” and other words of similar meaning, are forward-looking statements. In particular, information appearing in the “Fiscal Year 2020 Guidance” section are forward-looking statements. These statements are based on management’s expectations and assumptions and are subject to risks and uncertainties that may cause actual results to differ materially from those expressed. These risks and uncertainties include those risk factors discussed in Part I, “Item 1A. Risk Factors” of our Quarterly Report on Form 10-Q for the quarter ended March 31, 2020 (the “Quarterly Report”) and our Annual Report on Form 10-K for the fiscal year ended June 30, 2019 (the “2019 Annual Report”), as they may be updated in any future reports filed with the Securities and Exchange Commission. All forward-looking statements speak only as of the date of this presentation and are expressly qualified in their entirety by reference to the factors discussed in the Quarterly Report or the 2019 Annual Report. These risks include: • the potential impact and effects of the recent outbreak of the Covid-19 pandemic (“Covid-19”) on the business of Broadridge, Broadridge’s results of operations and financial performance, any measures Broadridge has and may take in response to Covid-19 and any expectations Broadridge may have with respect thereto; • the success of Broadridge in retaining and selling additional services to its existing clients and in obtaining new clients; • Broadridge’s reliance on a relatively small number of clients, the continued financial health of those clients, and the continued use by such clients of Broadridge’s services with favorable pricing terms; • a material security breach or cybersecurity attack affecting the information of Broadridge's clients; • changes in laws and regulations affecting Broadridge’s clients or the services provided by Broadridge; • declines in participation and activity in the securities markets; • the failure of Broadridge's key service providers to provide the anticipated levels of service; • a disaster or other significant slowdown or failure of Broadridge’s systems or error in the performance of Broadridge’s services; • overall market and economic conditions and their impact on the securities markets; • Broadridge’s failure to keep pace with changes in technology and demands of its clients; • Broadridge’s ability to attract and retain key personnel; • the impact of new acquisitions and divestitures; and • competitive conditions. Broadridge disclaims any obligation to update or revise forward-looking statements that may be made to reflect events or circumstances that arise after the date made or to reflect the occurrence of unanticipated events, other than as required by law. Use of Material Contained Herein The information contained in this presentation is being provided for your convenience and information only. This information is accurate as of the date of its initial presentation. If you plan to use this information for any purpose, verification of its continued accuracy is your responsibility. Broadridge assumes no duty to update or revise the information contained in this presentation. © 2020 | 2

Use of Non-GAAP Financial Measures Explanation and Reconciliation of the Company’s Use of Non-GAAP Financial Measures The Company’s results in this presentation are presented in accordance with U.S. generally accepted accounting principles ("GAAP") except where otherwise noted. In certain circumstances, results have been presented that are not generally accepted accounting principles measures (“Non-GAAP”). These Non-GAAP measures are Adjusted Operating income, Adjusted Operating income margin, Adjusted Net earnings, Adjusted earnings per share, Adjusted EBITDA, EBITDAR and Free cash flow. These Non-GAAP financial measures should be viewed in addition to, and not as a substitute for, the Company’s reported results. The Company believes our Non-GAAP financial measures help investors understand how management plans, measures and evaluates the Company’s business performance. Management believes that Non-GAAP measures provide consistency in its financial reporting and facilitates investors’ understanding of the Company’s operating results and trends by providing an additional basis for comparison. Management uses these Non-GAAP financial measures to, among other things, evaluate our ongoing operations, for internal planning, evaluating leverage, forecasting purposes and in the calculation of performance-based compensation. In addition, and as a consequence of the importance of these Non-GAAP financial measures in managing our business, the Company’s Compensation Committee of the Board of Directors incorporates Non-GAAP financial measures in the evaluation process for determining management compensation. Please see slides 24-29 for further explanation of our Non-GAAP Measures, the reasons we believe these Non-GAAP measures are helpful to our investors, and reconciliations of these Non-GAAP measures to the most directly comparable GAAP measures. © 2020 | 3
© 2020 | 4
Overview 1▪ The Covid-19 crisis has reinforced the essential nature of Broadridge’s work – what we do matters 2▪ The health and safety of our associates is our top priority 3▪ We have delivered strong operational performance 4▪ As a result, we are seeing continued growth and solid financial results despite the crisis 5▪ Long-term impact confirms Broadridge business model and supports future growth © 2020 | 5

Covid-19 Has Reinforced the Essential Nature of 1 Broadridge’s Work ▪ Supporting dynamic capital markets processing trillions of dollars of trading activity ▪ Providing investors key information about their investments in a time of high volatility and uncertainty ▪ Ensuring strong and timely corporate governance ▪ Deemed essential under federal guidelines and state orders ▪ Constant communication with regulators and clients © 2020 | 6
2 Ensuring the Health and Safety of our Associates ▪ Importance of the Service-Profit Chain ▪ Moved to 100% work-from-home for non-production associates • Began in January in Asia-Pacific • North America and Europe staff in early March • India staff starting in mid-March ▪ Strong measures to protect essential production associates • Masks, gloves, temperature checking required • Redistributed work through redundant production facilities • 50% staffing in most-impacted locations to maximize social distancing ▪ Supporting the communities in which we operate © 2020 | 7
3 Delivered Strong Operational Performance ▪ Our resilient and scalable technology successfully supported unprecedented market volumes ▪ Delivering an effective proxy season to support strong corporate governance ▪ Managed very strong spike in transactional communications driven by market volatility ▪ Scaling operations and technology to support a 4x increase in Virtual Shareholder Meetings © 2020 | 8
Expecting Continued Growth and 4 Solid Financial Results ▪ Broadridge reported solid third quarter results • Recurring fee revenue growth of 9% • 20% increase in Closed sales including stronger March ▪ Fiscal Year 2020 guidance calls for continued growth • 8 – 10% Recurring fee revenue growth, including organic growth of 4% • Continued Adjusted EPS growth tempered by significantly lower event-driven revenues • Remain on track to deliver strong Closed sales ▪ Broadridge remains on-track to deliver at or above the midpoint of our three year Adjusted EPS growth objective of 14-18% © 2020 | 9

Third Quarter Financial Summary Third Quarter Financial Highlights 2020 2019 Change 1.1 Solid results: 9% increase in Total revenues $1,250 $1,225 2% Recurring revenues and Adjusted Recurring fee revenues 835 767 9% EPS growth of 5% Event-driven fee revenues $39 $68 (43)% 2.2 Event-driven revenue weakness exacerbated by Covid-19 crisis Operating Income 226 234 (3)% 3.3 Strong Closed sales: 20% Margin 18.1% 19.1% increase in third quarter Adjusted Operating Income 262 256 3% 4.4 Strong balance sheet with $1.5B Margin 21.0% 20.9% of liquidity 5.5 FY20 Guidance highlights Diluted EPS $1.43 $1.45 (1)% resilience of Broadridge business Adjusted EPS $1.67 $1.59 5% • 8-10% Recurring revenue growth Closed Sales $44 $37 20% • 5-7% Adjusted EPS outlook Dollars in millions, except per share amounts © 2020 | 10
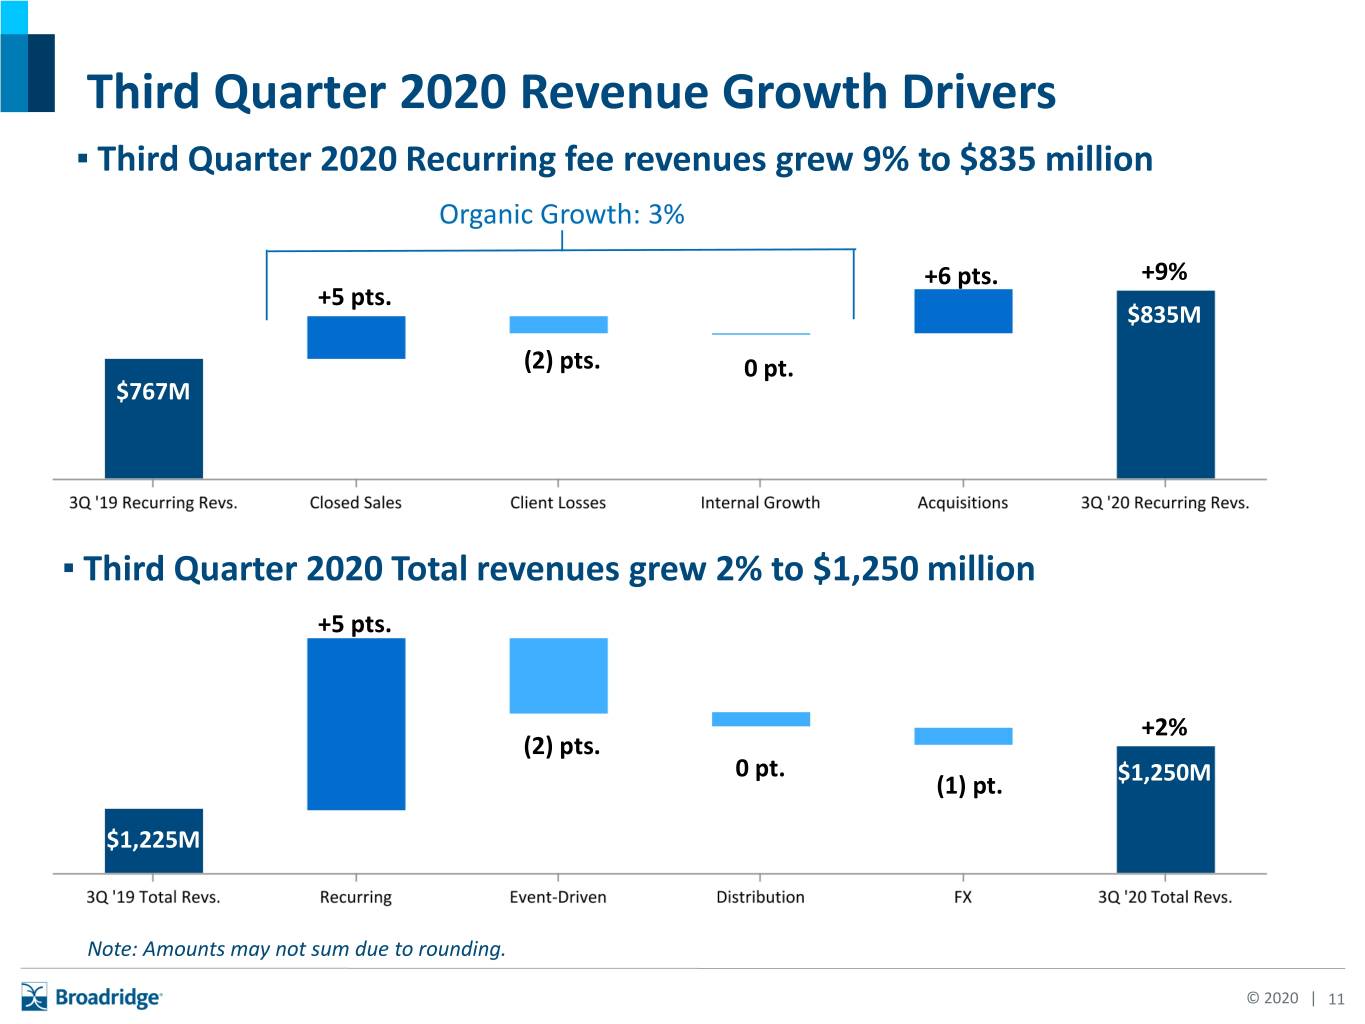
Third Quarter 2020 Revenue Growth Drivers ▪ Third Quarter 2020 Recurring fee revenues grew 9% to $835 million Organic Growth: 3% $623M +6 pts. +9% $576M +5 pts. $835M (2) pts. 0 pt. $767M ▪ Third Quarter 2020 Total revenues grew 2% to $1,250 million +5 pts. $1,225M +2% (2) pts. 0 pt. (1) pt. $1,250M $1,225M Note: Amounts may not sum due to rounding. © 2020 | 11

Third Quarter Fiscal 2020 ICS Results Total Revenues Recurring Revenues Highlights -3% +2% • Covid-19 related production shifts $1,006 $980 $520 $529 reduced Equity proxy revenues by $15- 20 million, offsetting impact of 7% stock $136 $153 record growth $520 $529 $87 $82 • Higher volumes led by post-sale prospectus drove customer $68 $39 $201 $208 communications growth $418 $412 • Continued strong growth in data & $84 $97 analytics products offset by lower interest rates and market impact on 2019 2020 2019 2020 assets under administration Recurring Revenues Equity Proxy Net New Business 3 pts Event Driven Mutual Fund and ETF interims Internal Growth (4) pts Distribution Customer Comms. & fulfillment Other ICS Organic Recurring Revenue Growth (1)% Acquisitions 3 pts Total Growth 2% Dollars in millions © 2020 | 12

Event-Driven Revenue: lowest Q3 since FY’14 Dollars in millions Q3 FY14-19 FY14 FY15 FY16 FY17 FY18 FY19 FY20 Average Equity & Other 16 16 17 18 40 35 22 24 Mutual Fund 22 32 32 43 27 33 17 31 Total 38 48 48 61 67 68 39 55 Year to Date FY14-19 FY14 FY15 FY16 FY17 FY18 FY19 FY20 Average Equity & Other 38 44 56 50 99 79 55 61 Mutual Fund 69 76 87 78 124 114 55 91 Total 107 120 143 128 223 193 110 152 Full Year FY14-19 FY14 FY15 FY16 FY17 FY18 FY19 FY20F Average Equity & Other 58 71 83 86 134 107 90 Mutual Fund 98 101 117 133 149 137 123 Total 156 173 199 219 284 244 ~$155 212 Note: Significant mutual fund proxy events were noted in FY17 Q4, FY18 Q2, and FY19 Q1. Note: Amounts may not sum due to rounding. © 2020 | 13
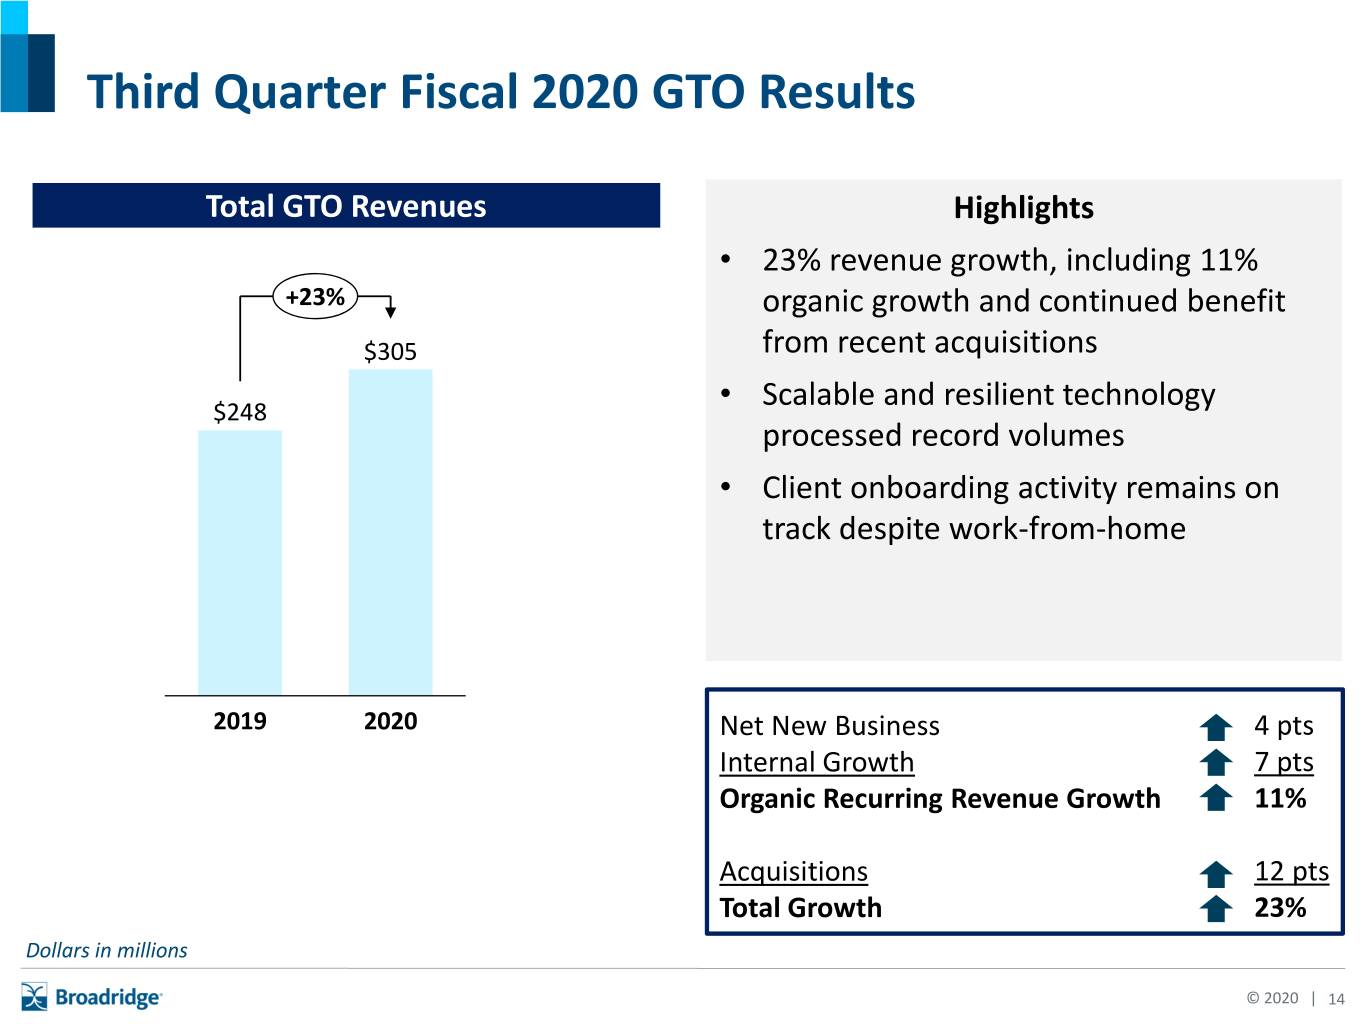
Third Quarter Fiscal 2020 GTO Results Total GTO Revenues Highlights • 23% revenue growth, including 11% +23% organic growth and continued benefit $305 from recent acquisitions • Scalable and resilient technology $248 processed record volumes • Client onboarding activity remains on track despite work-from-home 2019 2020 Net New Business 4 pts Internal Growth 7 pts Organic Recurring Revenue Growth 11% Acquisitions 12 pts Total Growth 23% Dollars in millions © 2020 | 14

Strong Balance Sheet BBB+ (S&P, Fitch) Investment-Grade Credit Ratings Baa1 (Moody’s) March 31, 2020 Cash and cash equivalents $402M Available Borrowing Capacity1 $1.1B Total Liquidity $1.5B Leverage Ratios (Non-GAAP) Net Debt2 1.9x Adjusted Gross Debt3 2.4x Next Maturity $400M in September 2020 (1) Committed $1.5B revolving credit facility. As of March 31, 2020, the Company had $1.1B of unused capacity of committed $1.5B revolving credit facility (2) Estimated current net leverage ratio for 3Q 2020 is 1.9x, calculated: Net Debt = total long term and short term debt, less cash and cash equivalents, reported as of March 31, 2020 divided by trailing 12 months Adjusted EBITDA as of March 31, 2020. Please see slides 24-29 for explanation and reconciliation of these Non-GAAP measures (3) Estimated current gross leverage ratio for 3Q 2020 is 2.4x, calculated: Gross Debt = total long term and short term debt plus present value of operating lease liabilities, reported as of March 31, 2020 divided by trailing 12 months EBITDAR as of March 31, 2020. Please see slides 24-29 for explanation and reconciliation of these Non-GAAP measures © 2020 | 15
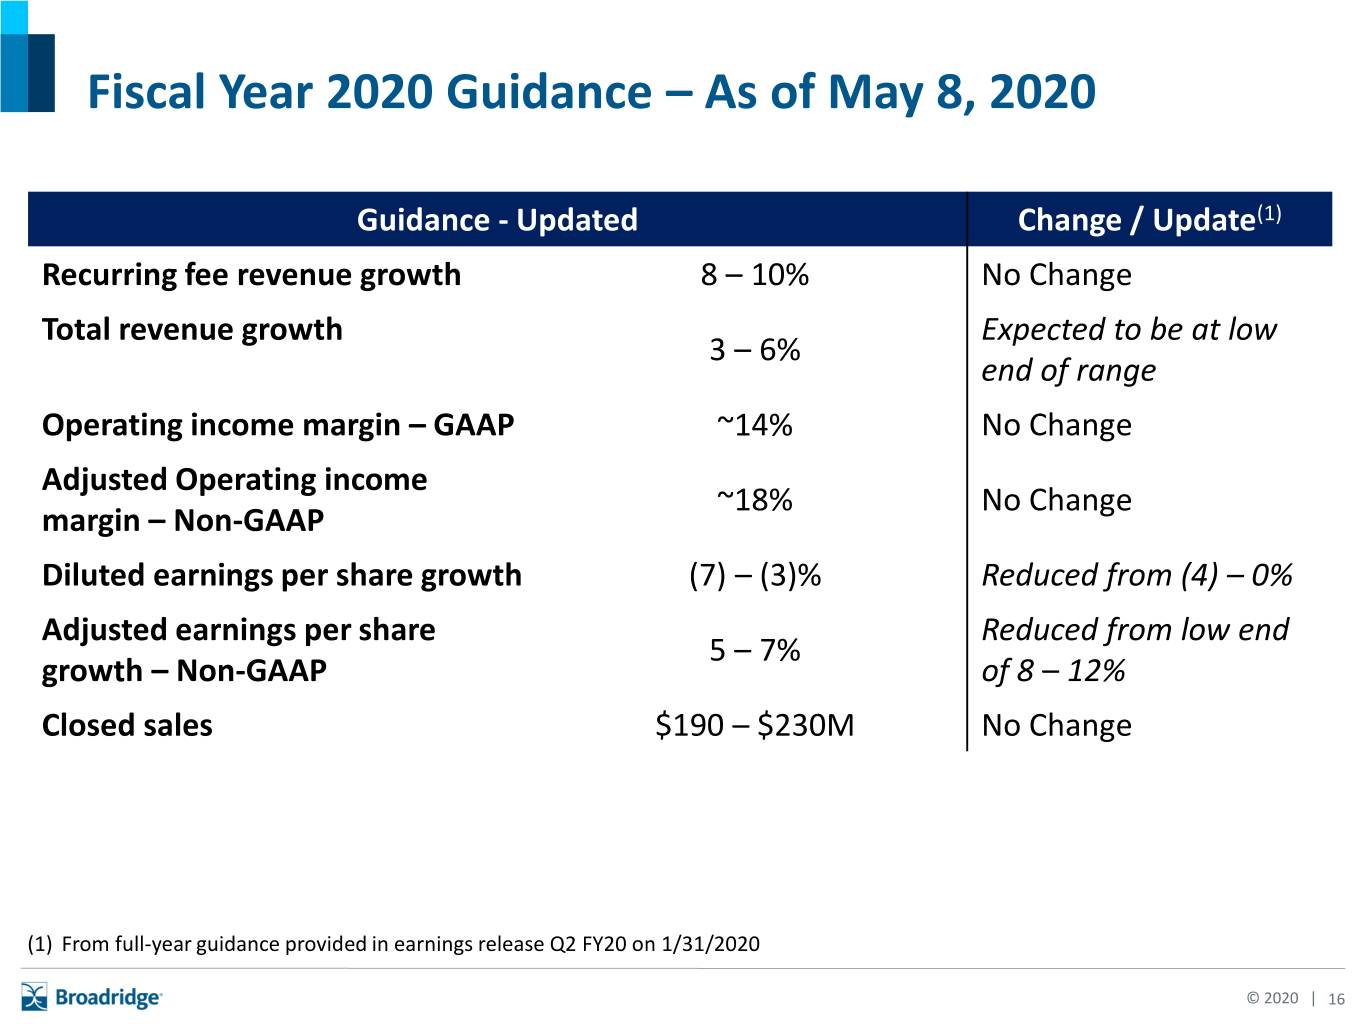
Fiscal Year 2020 Guidance – As of May 8, 2020 Guidance - Updated Change / Update(1) Recurring fee revenue growth 8 – 10% No Change Total revenue growth Expected to be at low 3 – 6% end of range Operating income margin – GAAP ~14% No Change Adjusted Operating income ~18% No Change margin – Non-GAAP Diluted earnings per share growth (7) – (3)% Reduced from (4) – 0% Adjusted earnings per share Reduced from low end 5 – 7% growth – Non-GAAP of 8 – 12% Closed sales $190 – $230M No Change (1) From full-year guidance provided in earnings release Q2 FY20 on 1/31/2020 © 2020 | 16

Recurring Revenue in 2008/09 Global Financial Crisis Total Recurring Fee Revenue Growth1 Organic Revenue Growth 12% Revenue Growth from Acquisitions 8% 5% 4% 1% 4% FY08 FY09 FY10 FY11 (1) Total recurring fee revenue growth %s, as reported © 2020 | 17
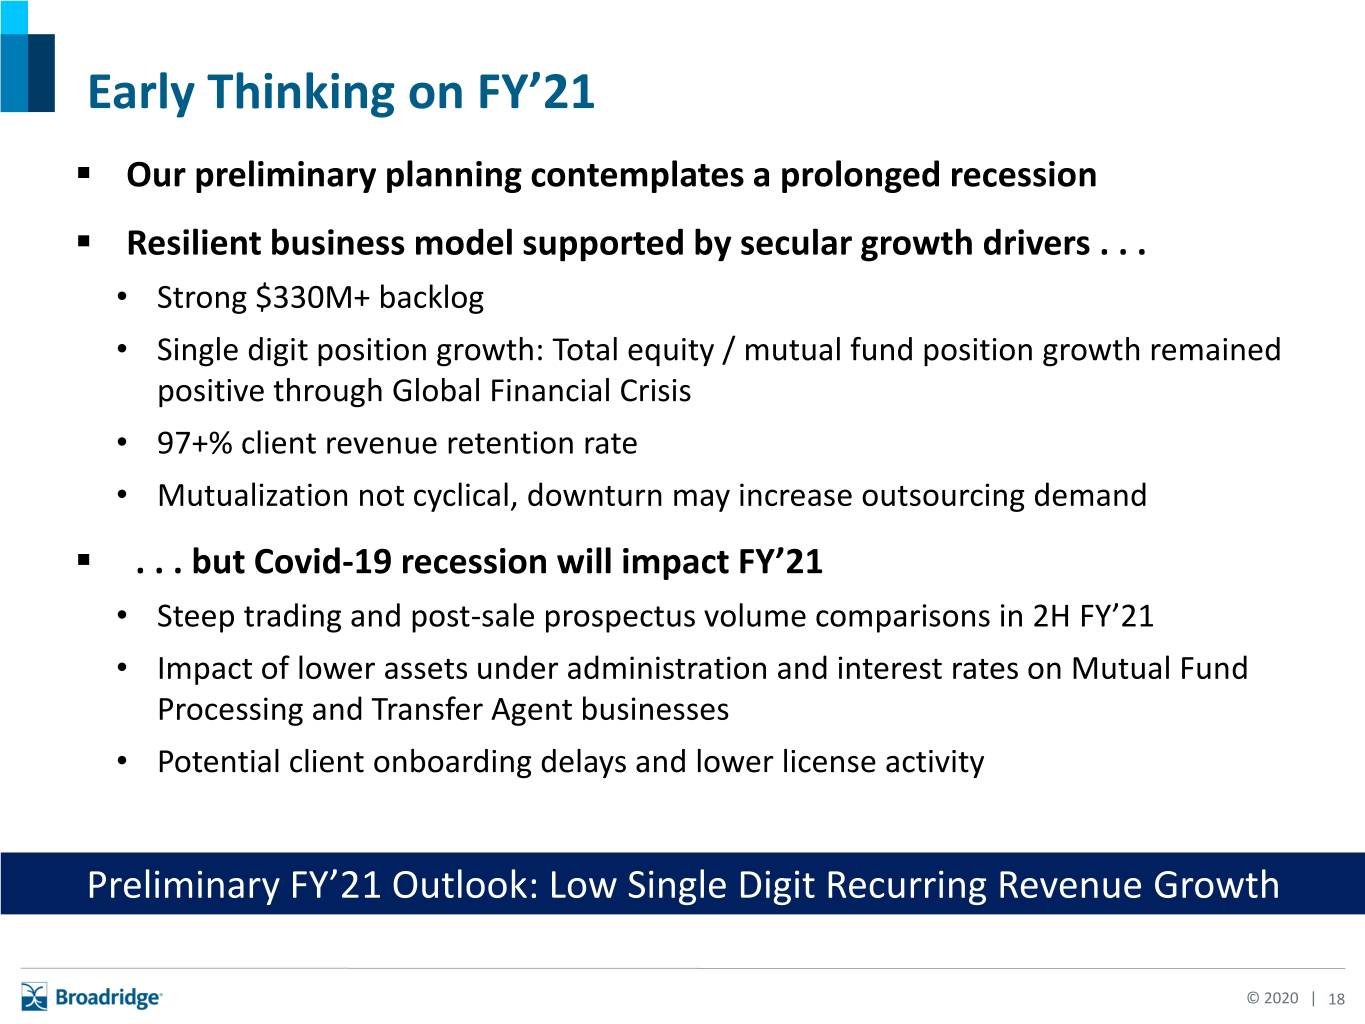
Early Thinking on FY’21 ▪ Our preliminary planning contemplates a prolonged recession ▪ Resilient business model supported by secular growth drivers . . . • Strong $330M+ backlog • Single digit position growth: Total equity / mutual fund position growth remained positive through Global Financial Crisis • 97+% client revenue retention rate • Mutualization not cyclical, downturn may increase outsourcing demand ▪ . . . but Covid-19 recession will impact FY’21 • Steep trading and post-sale prospectus volume comparisons in 2H FY’21 • Impact of lower assets under administration and interest rates on Mutual Fund Processing and Transfer Agent businesses • Potential client onboarding delays and lower license activity Preliminary FY’21 Outlook: Low Single Digit Recurring Revenue Growth © 2020 | 18

Long-Term Impact Confirms Broadridge Business Model and Supports Future Growth ▪ Broadridge will continue investing to support future growth ▪ Covid-19 crisis strengthens long-term trends on mutualization, digitization and data driving Broadridge’s growth ▪ New focus on resiliency and enhanced digital capabilities will be critical in a post-pandemic world ▪ Positive long-term outlook and strong business fundamentals leave Broadridge well-positioned © 2020 | 19

Nine Months Fiscal Year 2020 vs. Nine Months Fiscal Year 2019 © 2020 | 20

Nine Months 2020 Revenue Growth Drivers ▪ Nine Months Fiscal 2020 Recurring fee revenues grew 8% to $2,106 million Organic Growth: 2% $623M +6 pts. $1,272M+8% $576M +6 pts. $2,106M $1,179M (2) pts. (1) pt. $1,947M ▪ Nine Months Fiscal 2020 Total revenues grew by 1% to $3,167 million $576M +5 pts. +1% (3) pts. (1) pt. $3,151M (1) pt. $3,167M Note: Amounts may not sum due to rounding. © 2020 | 21

Nine Months 2020 Segment Revenue Growth and Drivers Dollars in millions 9M 2019 2020 Growth Investor Communication Solutions Revenues1 Recurring Fee Revenues $ 1,214 $ 1,246 3 % Event-Driven Fee Revenues 193 110 (43)% Distribution Revenues 1,082 1,042 (4)% Total ICS Revenues $ 2,489 $ 2,398 (4)% Global Technology and Operations Revenues1 $ 733 $ 860 17 % ICS GTO Nine Month 2020 Recurring Revenue Growth Drivers Net New Business 3 pts 4 pts Internal Growth (3) pts 2 pts Organic Recurring Fee Revenue Growth 0 pt 6 pts Acquisitions 3 pts 11 pts Recurring Fee Revenue Growth 3 % 17 % (1) FY2019 revenues have been revised to reflect the Broadridge Advisor Solutions organizational change. This change had the effect of transferring revenues previously reported in the ICS segment to the GTO segment. In aggregate, the Total revenues transferred for the nine months ended March 31, 2019 were $32.3 million. Note: Amounts may not sum due to rounding. © 2020 | 22

Supplemental Reporting Detail - Product Line Reporting1 (1) FY2019 revenues have been revised to reflect the Broadridge Advisor Solutions organizational change. This change had the effect of transferring revenues previously reported in the ICS segment to the GTO segment. In the aggregate, the Total revenues transferred in FY2019 were $42.8 million. Note: Amounts may not sum due to rounding. © 2020 | 23

Explanation of Non-GAAP Measures and Reconciliation of GAAP to Non- GAAP Measures © 2020 | 24

Non-GAAP Financial Measures Adjusted Operating Income, Adjusted Operating Income Margin, Adjusted Net Earnings and Adjusted Earnings Per Share, Adjusted EBITDA and EBITDAR Adjusted Operating income, Adjusted Operating income margin, Adjusted Net earnings and Adjusted earnings per share reflect Operating income, Operating income margin, Net earnings, and Diluted earnings per share, as adjusted to exclude the impact of certain costs, expenses, gains and losses and other specified items that management believes are not indicative of our ongoing operating performance. These adjusted measures exclude the impact of: (i) Amortization of Acquired Intangibles and Purchased Intellectual Property, (ii) Acquisition and Integration Costs, and (iii) IBM Private Cloud Charges. Amortization of Acquired Intangibles and Purchased Intellectual Property represents non-cash amortization expenses associated with the Company's acquisition activities. Acquisition and Integration Costs represent certain transaction and integration costs associated with the Company’s acquisition activities. IBM Private Cloud Charges represent a charge on the hardware assets to be transferred to International Business Machines Corporation ("IBM") and other charges related to the information technology agreement for private cloud services the Company entered into with IBM. Adjusted EBITDA reflects Net earnings before interest, taxes, other non-operating (income)/expenses net, depreciation, amortization, IBM Private Cloud Charges, and Acquisition and Integration Costs. EBITDAR reflects Adjusted EBITDA before facilities and equipment lease expenses, and software license agreement expenses. Our management uses Adjusted EBITDA and EBITDAR to better understand the Company’s pre-tax cash flow, adjusted for the impact of leverage. We exclude IBM Private Cloud Charges from our Adjusted Operating income and other earnings measures because excluding such information provides us with an understanding of the results from the primary operations of our business and this item does not reflect ordinary operations or earnings. We also exclude the impact of Amortization of Acquired Intangibles and Purchased Intellectual Property, as these non-cash amounts are significantly impacted by the timing and size of individual acquisitions and do not factor into the Company's capital allocation decisions, management compensation metrics or multi-year objectives. Furthermore, management believes that this adjustment enables better comparison of our results as Amortization of Acquired Intangibles and Purchased Intellectual Property will not recur in future periods once such intangible assets have been fully amortized. Although we exclude Amortization of Acquired Intangibles and Purchased Intellectual Property from our adjusted earnings measures, our management believes that it is important for investors to understand that these intangible assets contribute to revenue generation. Amortization of intangible assets that relate to past acquisitions will recur in future periods until such intangible assets have been fully amortized. Any future acquisitions may result in the amortization of additional intangible assets. Free Cash Flow In addition to the Non-GAAP financial measures discussed above, we provide Free cash flow information because we consider Free cash flow to be a liquidity measure that provides useful information to management and investors about the amount of cash generated that could be used for dividends, share repurchases, strategic acquisitions, other investments, as well as debt servicing. Free cash flow is a Non-GAAP financial measure and is defined by the Company as Net cash flows provided by operating activities less Capital expenditures as well as Software purchases and capitalized internal use software. Reconciliations of such Non-GAAP measures to the most directly comparable financial measures presented in accordance with GAAP can be found in the tables that are part of this presentation. © 2020 | 25

Reconciliation of GAAP to Non-GAAP Measures (Unaudited) (a) Calculated using the GAAP effective tax rate, adjusted to exclude $1.9 million and $9.9 million of excess tax benefits associated with stock-based compensation for the three and nine months ended March 31, 2020, and $1.3 million and $9.2 million of excess tax benefits associated with stock-based compensation for the three and nine months ended March 31, 2019, respectively. For purposes of calculating Adjusted earnings per share, the same adjustments were made on a per share basis. Note: Amounts may not sum due to rounding. © 2020 | 26
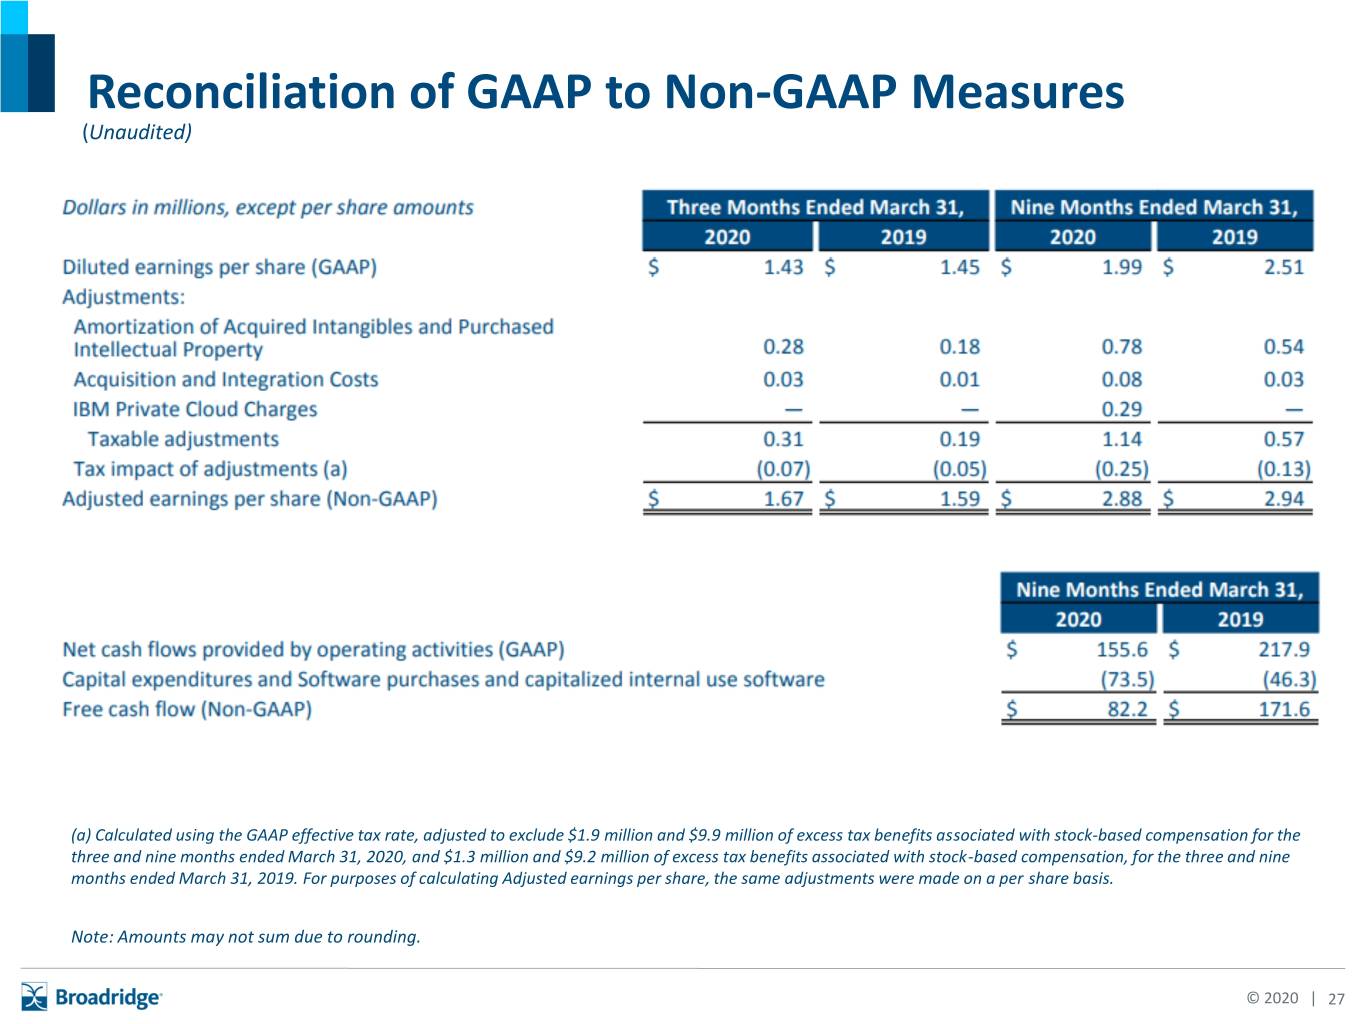
Reconciliation of GAAP to Non-GAAP Measures (Unaudited) (a) Calculated using the GAAP effective tax rate, adjusted to exclude $1.9 million and $9.9 million of excess tax benefits associated with stock-based compensation for the three and nine months ended March 31, 2020, and $1.3 million and $9.2 million of excess tax benefits associated with stock-based compensation, for the three and nine months ended March 31, 2019. For purposes of calculating Adjusted earnings per share, the same adjustments were made on a per share basis. Note: Amounts may not sum due to rounding. © 2020 | 27

Reconciliation of GAAP to Non-GAAP Measures (Unaudited) Note: Amounts may not sum due to rounding. © 2020 | 28
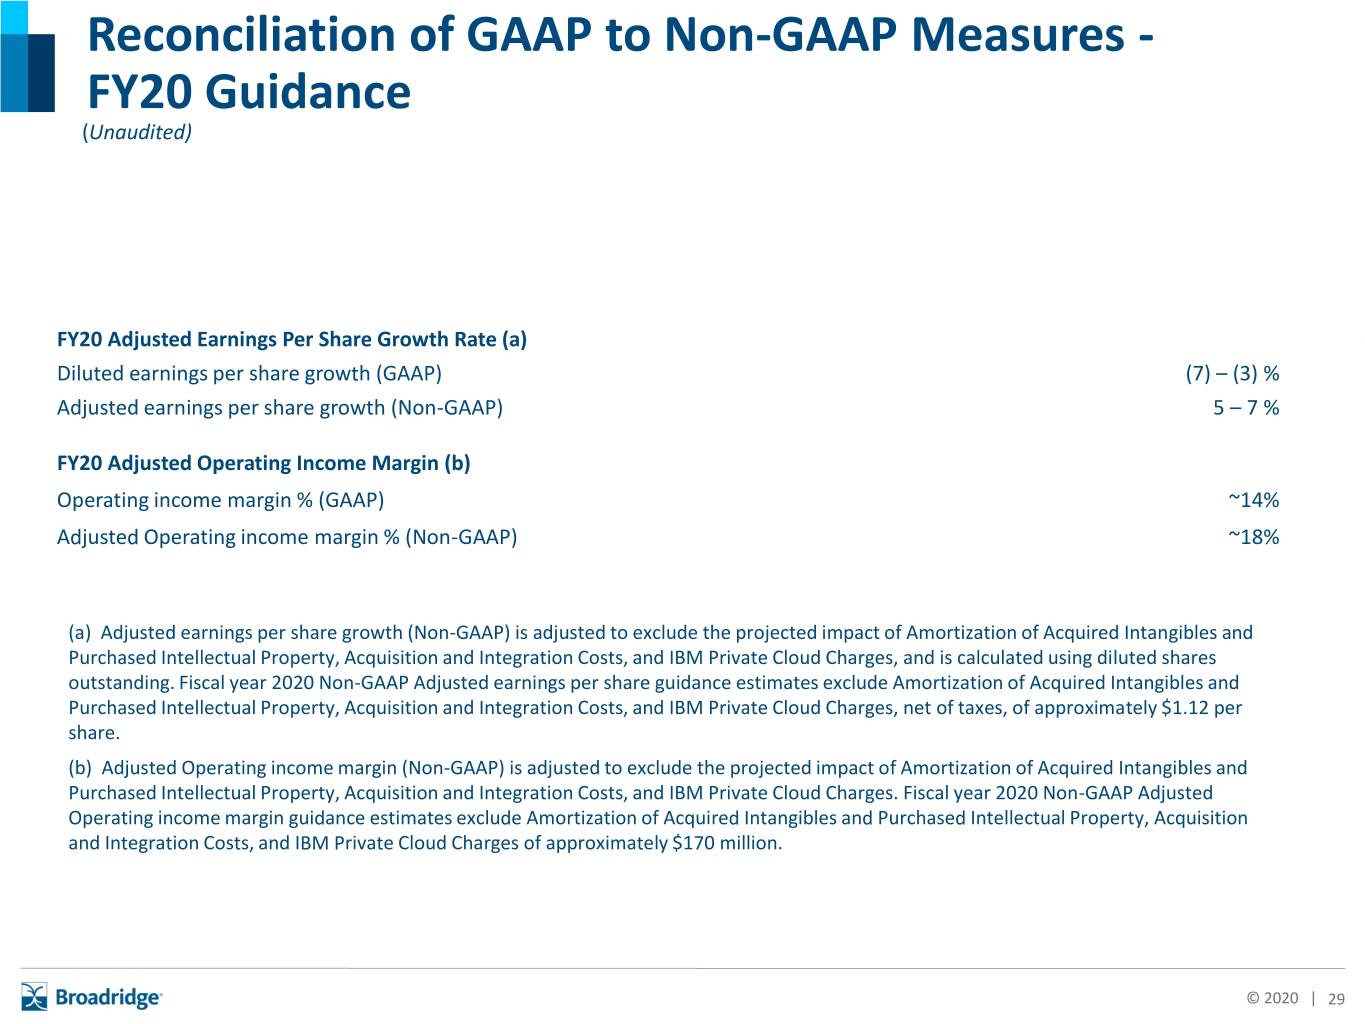
Reconciliation of GAAP to Non-GAAP Measures - FY20 Guidance (Unaudited) FY20 Adjusted Earnings Per Share Growth Rate (a) Diluted earnings per share growth (GAAP) (7) – (3) % Adjusted earnings per share growth (Non-GAAP) 5 – 7 % FY20 Adjusted Operating Income Margin (b) Operating income margin % (GAAP) ~14% Adjusted Operating income margin % (Non-GAAP) ~18% (a) Adjusted earnings per share growth (Non-GAAP) is adjusted to exclude the projected impact of Amortization of Acquired Intangibles and Purchased Intellectual Property, Acquisition and Integration Costs, and IBM Private Cloud Charges, and is calculated using diluted shares outstanding. Fiscal year 2020 Non-GAAP Adjusted earnings per share guidance estimates exclude Amortization of Acquired Intangibles and Purchased Intellectual Property, Acquisition and Integration Costs, and IBM Private Cloud Charges, net of taxes, of approximately $1.12 per share. (b) Adjusted Operating income margin (Non-GAAP) is adjusted to exclude the projected impact of Amortization of Acquired Intangibles and Purchased Intellectual Property, Acquisition and Integration Costs, and IBM Private Cloud Charges. Fiscal year 2020 Non-GAAP Adjusted Operating income margin guidance estimates exclude Amortization of Acquired Intangibles and Purchased Intellectual Property, Acquisition and Integration Costs, and IBM Private Cloud Charges of approximately $170 million. © 2020 | 29

Broadridge Investor Relations Contacts W. Edings Thibault Tel: 516-472-5129 Email: edings.thibault@broadridge.com Elsa Ballard Tel: 212-973-6197 Email: elsa.ballard@broadridge.com © 2020 | 30
