Attached files
| file | filename |
|---|---|
| 8-K - 8-K - Prestige Consumer Healthcare Inc. | pbh-20200507.htm |
| EX-99.1 - EX-99.1 - Prestige Consumer Healthcare Inc. | exhibit991fy20-q4earni.htm |

Exhibit 99.2
This presentation contains certain “forward-looking” statements within the meaning of the Private Securities Litigation Reform Act of 1995, such as statements regarding the Company’s expected financial performance, including revenue growth and free cash flow conversion; the Company’s ability to adapt to the current changing environment, including ensuring the health and safety of employees and maintain business continuity; the Company’s ability to de-lever and create long-term shareholder value; the expected growth and consumption trends for the Company’s brands; the impact of brand-building and product introductions on the Company’s financial results; and the Company’s disciplined capital allocation strategy. Words such as “trend,” “continue,” “will,” “expect,” “project,” “anticipate,” “likely,” “estimate,” “may,” “should,” “could,” “would,” and similar expressions identify forward-looking statements. Such forward-looking statements represent the Company’s expectations and beliefs and involve a number of known and unknown risks, uncertainties and other factors that may cause actual results to differ materially from those expressed or implied by such forward-looking statements. These factors include, among others, general economic and business conditions , regulatory matters, competitive pressures, consumer trends, retail management initiatives, disruptions to distribution and supply chain, unexpected costs or liabilities, the scope and duration of the COVID-19 pandemic, government actions and the consequences for the global economy, uncertainties regarding how distribution channels and consumer behaviors will evolve over time in response to the pandemic, and its impact on our business, operations, results of operations and financial condition, including, among others, manufacturing, distribution and supply chain disruptions, reduced demand for our products and services, and the financial condition of our suppliers and customers, including their ability to fund their operations and pay their invoices and other risks set forth in Part I, Item 1A. Risk Factors in the Company’s Annual Report on Form 10-K for the year ended March 31, 2019. You are cautioned not to place undue reliance on these forward-looking statements, which speak only as of the date this presentation. Except to the extent required by applicable law, the Company undertakes no obligation to update any forward-looking statement contained in this presentation, whether as a result of new information, future events, or otherwise. All adjusted GAAP numbers presented are footnoted and reconciled to their closest GAAP measurement in the attached reconciliation schedule or in our May 7, 2020 earnings release in the “About Non-GAAP Financial Measures” section.




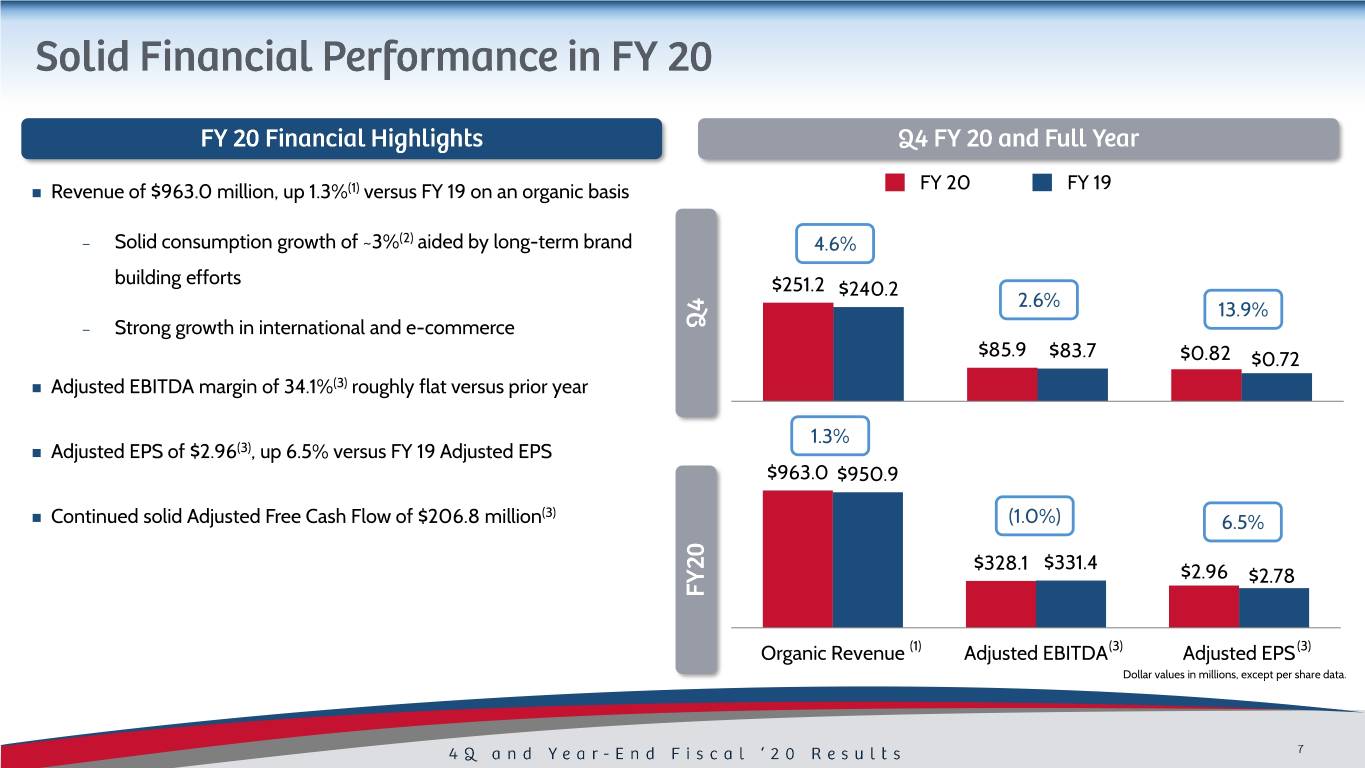
FY 20 FY 19 ◼ Revenue of $963.0 million, up 1.3%(1) versus FY 19 on an organic basis – Solid consumption growth of ~3%(2) aided by long-term brand 4.6% building efforts $251.2 $240.2 2.6% 13.9% – Strong growth in international and e-commerce $85.9 $83.7 $0.82 $0.72 ◼ Adjusted EBITDA margin of 34.1%(3) roughly flat versus prior year 1.3% ◼ Adjusted EPS of $2.96(3), up 6.5% versus FY 19 Adjusted EPS $963.0 $950.9 (3) ◼ Continued solid Adjusted Free Cash Flow of $206.8 million (1.0%) 6.5% $328.1 $331.4 $2.96 $2.78 Organic Revenue (1) Adjusted EBITDA(3) Adjusted EPS(3) Dollar values in millions, except per share data.
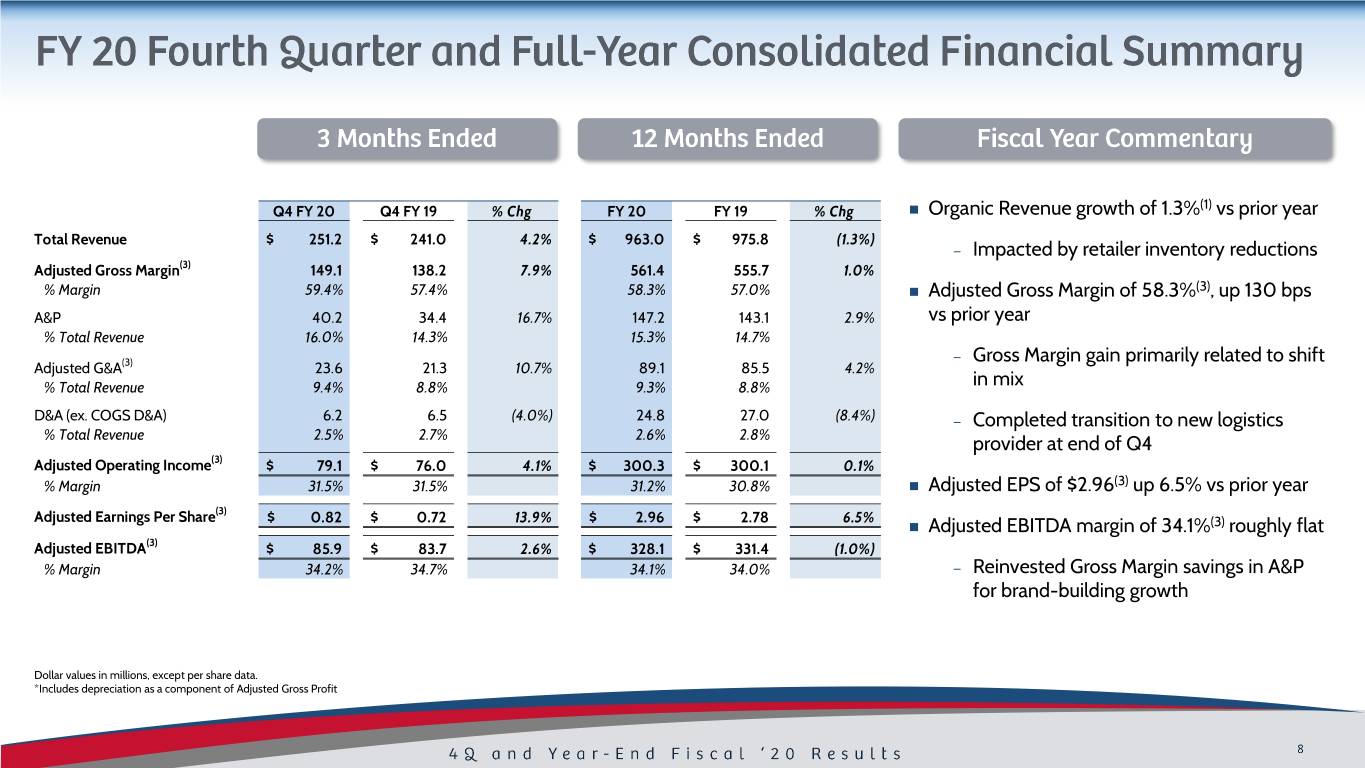
Q4 FY 20 Q4 FY 19 % Chg FY 20 FY 19 % Chg ◼ Organic Revenue growth of 1.3%(1) vs prior year Total Revenue $ 251.2 $ 241.0 4.2% $ 963.0 $ 975.8 (1.3%) – Impacted by retailer inventory reductions Adjusted Gross Margin(3) 149.1 138.2 7.9% 561.4 555.7 1.0% % Margin 59.4% 57.4% 58.3% 57.0% ◼ Adjusted Gross Margin of 58.3%(3), up 130 bps A&P 40.2 34.4 16.7% 147.2 143.1 2.9% vs prior year % Total Revenue 16.0% 14.3% 15.3% 14.7% – Gross Margin gain primarily related to shift Adjusted G&A(3) 23.6 21.3 10.7% 89.1 85.5 4.2% % Total Revenue 9.4% 8.8% 9.3% 8.8% in mix D&A (ex. COGS D&A) 6.2 6.5 (4.0%) 24.8 27.0 (8.4%) – Completed transition to new logistics % Total Revenue 2.5% 2.7% 2.6% 2.8% provider at end of Q4 Adjusted Operating Income(3) $ 79.1 $ 76.0 4.1% $ 300.3 $ 300.1 0.1% % Margin 31.5% 31.5% 31.2% 30.8% ◼ Adjusted EPS of $2.96(3) up 6.5% vs prior year Adjusted Earnings Per Share(3) $ 0.82 $ 0.72 13.9% $ 2.96 $ 2.78 6.5% ◼ Adjusted EBITDA margin of 34.1%(3) roughly flat Adjusted EBITDA(3) $ 85.9 $ 83.7 2.6% $ 328.1 $ 331.4 (1.0%) % Margin 34.2% 34.7% 34.1% 34.0% – Reinvested Gross Margin savings in A&P for brand-building growth Dollar values in millions, except per share data. *Includes depreciation as a component of Adjusted Gross Profit

Leverage Ratio ◼ FY20 Adjusted Free Cash Flow(3) of $206.8 million $208 $207 $197 $202 – Free Cash Flow conversion of 136% for FY20* ◼ Net Debt(3) at March 31 of ~$1.6 billion; leverage ratio of 4.7x(4) at end of FY20 – $107 million remaining availability on existing credit lines as of March 31st 5.7x 5.2x 5.0x – Proactively expanded cash balance to ~$95 4.7x million ◼ Reduced Net Debt(3) by $135.2 million in FY20 – Earliest debt instrument maturity January 2024 ◼ Completed $56.7 million in share repurchases in FY20 FY 17 FY 18 FY 19 FY 20 Dollar values in millions *Free Cash Flow Conversion defined as Non-GAAP Adjusted Free Cash Flow over Non-GAAP Adjusted Net Income


Invest for ◼ Brand building continued to drive consumption growth ◼ Successful new product launches across the portfolio Growth ✓ ◼ Continued solid results in International segment ◼ Strong & consistent adjusted free cash flow of Cash $207 million(3) Generation ◼ Execution resulting in capital allocation opportunities ✓ ◼ Reduced Net Debt(3) by $135 million Capital ◼ Executed share repurchases of $57 million Allocation ◼ Successfully transitioned to new logistics provider ✓


Prioritizing health & safety Working closely with Monitoring and while staffing appropriately suppliers to ensure maintaining ample continued supply inventory on critical items and brands

Total Sales by Category #1 Brands Represent Two-Thirds of Total Sales Oral Care Dermatologicals 10% 10% Women’s Health 26% Cough / Cold 11% 12% Eye & 18% Ear Care 12% GI Analgesics Note: Sales reflect FY 20; Excludes other OTC (less than 1%).

Lower Opportunity Higher Opportunity ◼ Usage rates likely ◼ Incidence rates will ◼ Increased interest impacted by stay- likely remain for cough & cold at-home guidance consistent treatments and feminine care products

◼ Reaching consumers at ◼ Highlighting at-home usage ◼ Thank you from Clear Eyes, the brand home opportunities that whitens more eyes
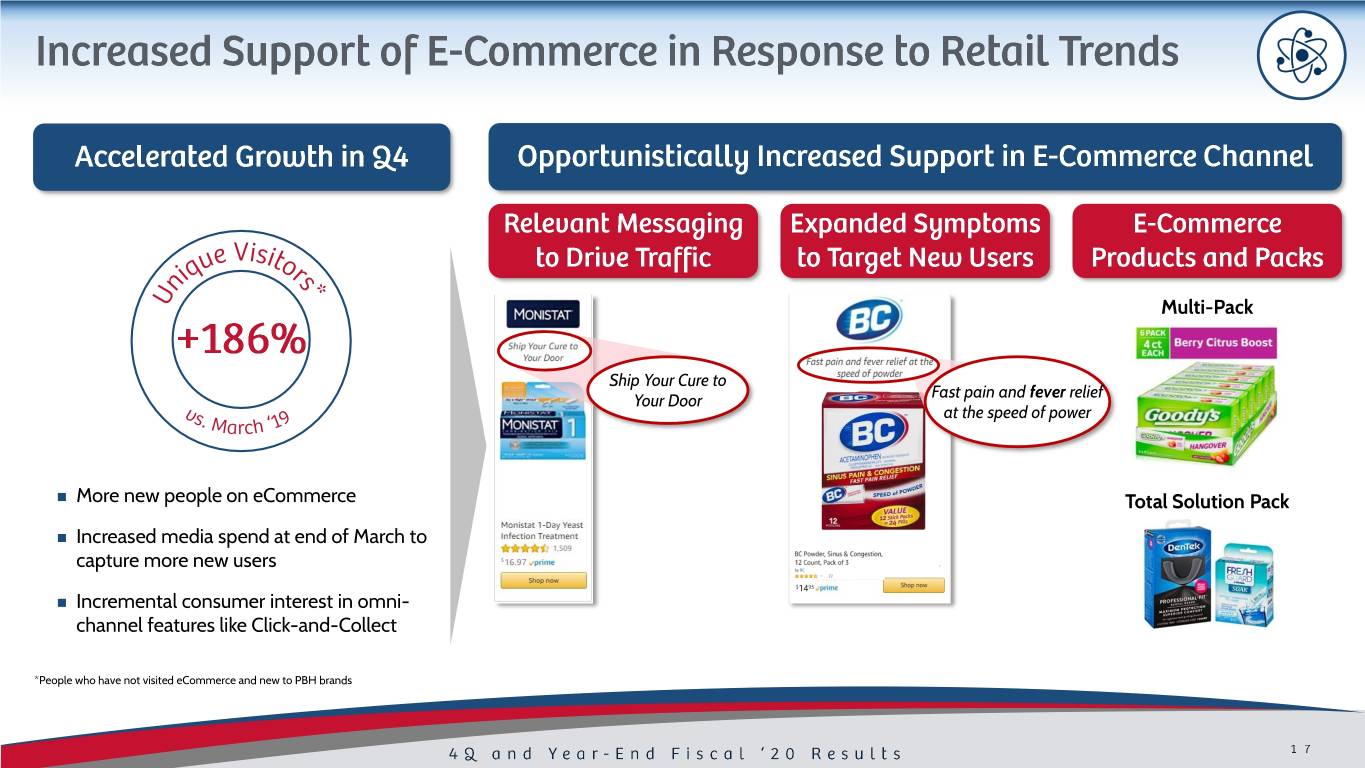
Multi-Pack Ship Your Cure to Fast pain and fever relief Your Door at the speed of power ◼ More new people on eCommerce Total Solution Pack ◼ Increased media spend at end of March to capture more new users ◼ Incremental consumer interest in omni- channel features like Click-and-Collect *People who have not visited eCommerce and new to PBH brands
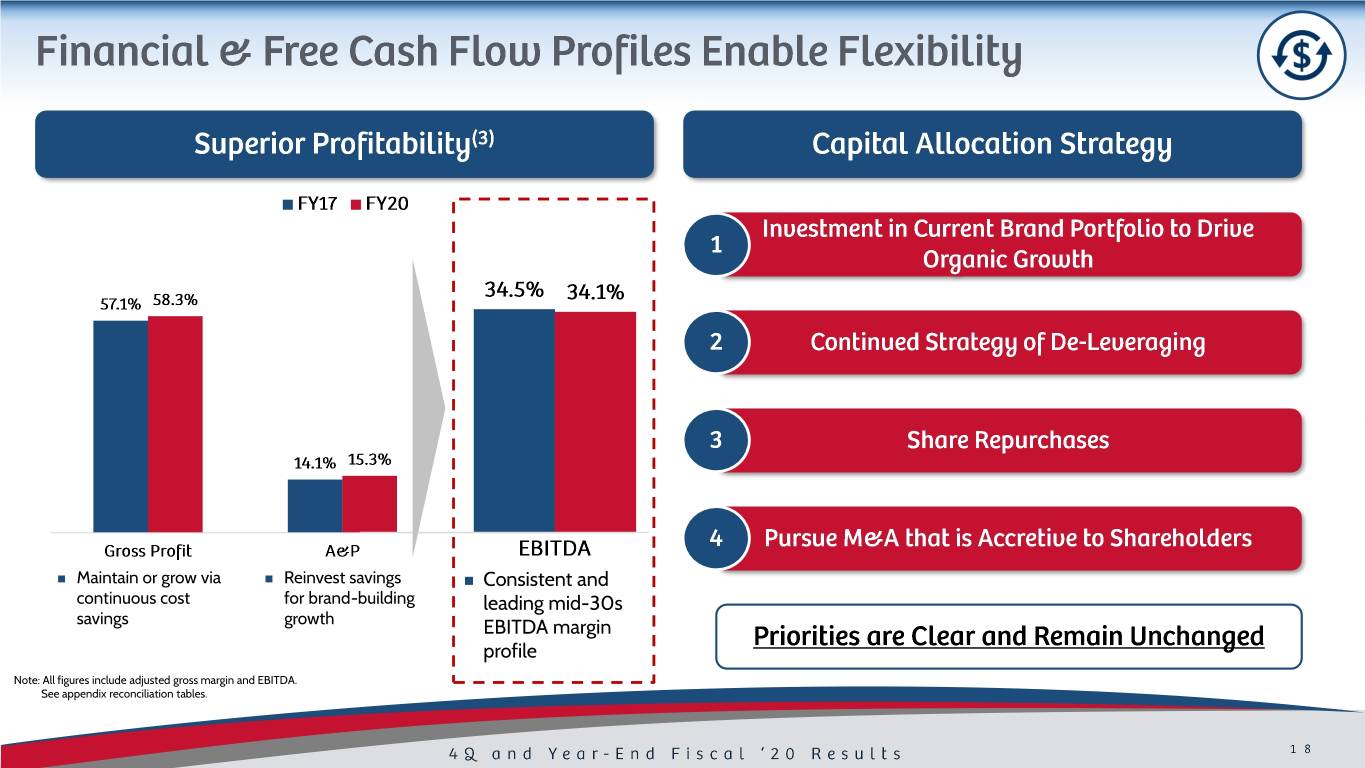
◼ Maintain or grow via ◼ Reinvest savings ◼ Consistent and continuous cost for brand-building leading mid-30s savings growth EBITDA margin profile Note: All figures include adjusted gross margin and EBITDA. See appendix reconciliation tables.


◼ Business and strategy are well-positioned to weather changing Time-Tested environment Playbook ◼ Focus on brand-building to drive growth ◼ Leverage business model to drive strong free cash flow conversion ◼ Business environment too fluid to enable full-year guidance − Early considerations include expected consumption declines and FX headwind, partially offset by retailer catch up Financial Outlook & − Q1 FY21 outlook: $220 million revenue or more, EPS of $0.70 Strategy or more, but admittedly challenging to predict ◼ Continue to focus on debt reduction ◼ Proactively manage liquidity in uncertain environment ◼ Maintain business continuity

(1) Organic Revenue is a Non-GAAP financial measure and is reconciled to the most closely related GAAP financial measure in the attached Reconciliation Schedules and / or our earnings release in the “About Non-GAAP Financial Measures” section. (2) Total company consumption is based on domestic IRI multi-outlet + C-Store retail sales for the period ending 3- 22-20, retail sales from other 3rd parties for certain untracked channels in North America for leading retailers, Australia consumption based on IMS data, and other international net revenues as a proxy for consumption. (3) Adjusted Gross Margin, Adjusted G&A, EBITDA, Adjusted EBITDA, Adjusted EBITDA Margin, Adjusted Operating Income, Adjusted Net Income, Adjusted EPS, Free Cash Flow, Adjusted Free Cash Flow and Net Debt are Non- GAAP financial measures and are reconciled to their most closely related GAAP financial measures in the attached Reconciliation Schedules and / or in our earnings release in the “About Non-GAAP Financial Measures” section. (4) Leverage ratio reflects net debt / covenant defined EBITDA.

Three Months Ended March 31, Year Ended March 31, 2020 2019 2020 2019 (In Thousands) GAAP Total Revenues $ 251,235 $ 241,026 $ 963,010 $ 975,777 Revenue Growth 4.2% (1.3%) Adjustments: Revenue associated with divestiture - - - (19,811) Allocated costs that remain after divestiture - - - (659) Impact of foreign currency exchange rates - (836) - (4,370) Total Adjustments $ - $ (836) $ - $ (24,840) Non-GAAP Organic Revenues $ 251,235 $ 240,190 $ 963,010 $ 950,937 Non-GAAP Organic Revenues Growth 4.6% 1.3%
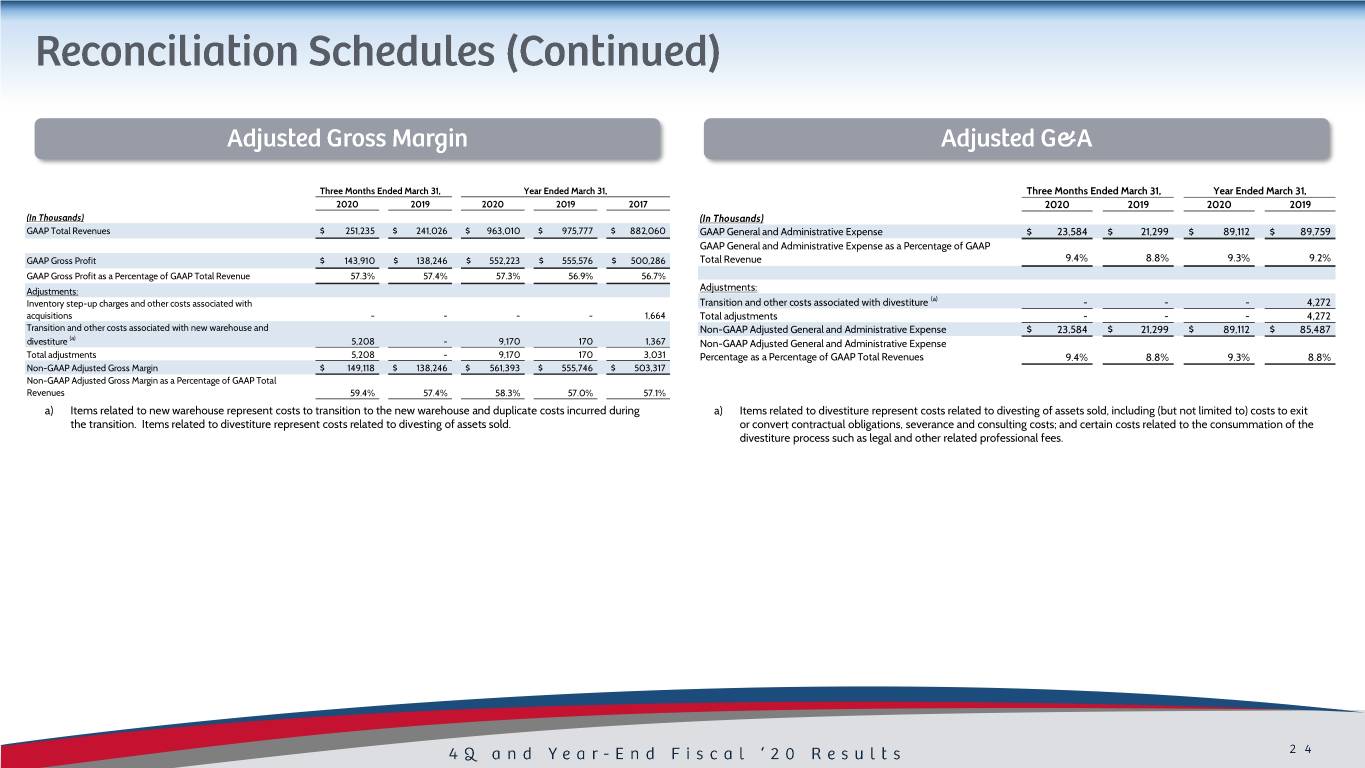
Three Months Ended March 31, Year Ended March 31, Three Months Ended March 31, Year Ended March 31, 2020 2019 2020 2019 2017 2020 2019 2020 2019 (In Thousands) (In Thousands) GAAP Total Revenues $ 251,235 $ 241,026 $ 963,010 $ 975,777 $ 882,060 GAAP General and Administrative Expense $ 23,584 $ 21,299 $ 89,112 $ 89,759 GAAP General and Administrative Expense as a Percentage of GAAP GAAP Gross Profit $ 143,910 $ 138,246 $ 552,223 $ 555,576 $ 500,286 Total Revenue 9.4% 8.8% 9.3% 9.2% GAAP Gross Profit as a Percentage of GAAP Total Revenue 57.3% 57.4% 57.3% 56.9% 56.7% Adjustments: Adjustments: (a) Inventory step-up charges and other costs associated with Transition and other costs associated with divestiture - - - 4,272 acquisitions - - - - 1,664 Total adjustments - - - 4,272 Transition and other costs associated with new warehouse and Non-GAAP Adjusted General and Administrative Expense $ 23,584 $ 21,299 $ 89,112 $ 85,487 (a) divestiture 5,208 - 9,170 170 1,367 Non-GAAP Adjusted General and Administrative Expense Total adjustments 5,208 - 9,170 170 3,031 Percentage as a Percentage of GAAP Total Revenues 9.4% 8.8% 9.3% 8.8% Non-GAAP Adjusted Gross Margin $ 149,118 $ 138,246 $ 561,393 $ 555,746 $ 503,317 Non-GAAP Adjusted Gross Margin as a Percentage of GAAP Total Revenues 59.4% 57.4% 58.3% 57.0% 57.1% a) Items related to new warehouse represent costs to transition to the new warehouse and duplicate costs incurred during a) Items related to divestiture represent costs related to divesting of assets sold, including (but not limited to) costs to exit the transition. Items related to divestiture represent costs related to divesting of assets sold. or convert contractual obligations, severance and consulting costs; and certain costs related to the consummation of the divestiture process such as legal and other related professional fees.

Three Months Ended March 31, Year Ended March 31, 2020 2019 2020 2019 2017 (In Thousands) GAAP Net Income (Loss) $ 37,046 $ (139,274) $ 142,281 $ (35,800) $ 69,395 Interest expense, net 22,452 25,745 96,224 105,082 93,343 Provision (benefit) for income taxes 13,489 (39,756) 48,870 (2,255) 41,455 Depreciation and amortization 7,331 7,526 28,995 31,779 25,792 Non-GAAP EBITDA 80,318 (145,759) 316,370 98,806 229,985 Non-GAAP EBITDA Margin 32.0% (60.5%) 32.9% 10.1% 26.1% Adjustments: Inventory step-up charges and other costs associated with acquisitions - - - - 1,664 Transition and other costs associated with new warehouse and divestiture in Cost of Goods Sold (a) 5,208 - 9,170 170 1,367 Transition and other costs associated with divestiture in Advertising and Promotion Expense - - - - 2,242 Transition and other costs associated with divestiture in General and Administrative Expense (b) - - - 4,272 16,015 Loss on disposal of assets 382 - 382 - - Goodwill and tradename impairment - 229,461 - 229,461 - Loss on extinguishment of debt - - 2,155 - 1,420 Loss (gain) on divestiture - - - (1,284) 51,820 Total adjustments 5,590 229,461 11,707 232,619 74,528 Non-GAAP Adjusted EBITDA $ 85,908 $ 83,702 $ 328,077 $ 331,425 $ 304,513 Non-GAAP Adjusted EBITDA Margin 34.2% 34.7% 34.1% 34.0% 34.5% a) Items related to new warehouse represent costs to transition to the new warehouse and duplicate costs incurred during the transition. Items related to divestiture represent costs related to divesting of assets sold. b) Items related to divestiture represent costs related to divesting of assets sold, including (but not limited to) costs to exit or convert contractual obligations, severance and consulting costs; and certain costs related to the consummation of the divestiture process such as legal and other related professional fees.

Three Months Ended March 31, Year Ended March 31, 2020 2019 2020 2019 Net Income EPS Net Income EPS Net Income EPS Net Income EPS (In Thousands, except per share data) GAAP Net Income (Loss) (a) $ 37,046 $ 0.73 $ (139,274) $ (2.67) $ 142,281 $ 2.78 $ (35,800) $ (0.68) Adjustments: Transition and other costs associated with new warehouse and divestiture in Cost of Goods Sold (b) 5,208 0.10 - - 9,170 0.18 170 - Transition and other costs associated with divestiture in General and Administrative Expense (c) - - - - - - 4,272 0.08 Loss on disposal of assets 382 0.01 - - 382 0.01 - - Accelerated amortization of debt origination costs - - - - - - 706 0.01 Goodwill and tradename impairment - - 229,461 4.40 - - 229,461 4.38 Loss on extinguishment of debt - - - - 2,155 0.04 - - Gain on divestiture - - - - - - (1,284) (0.02) Tax impact of adjustments (d) (1,420) (0.03) (58,283) (1.12) (2,974) (0.06) (57,863) (1.10) Normalized tax rate adjustment (e) 653 0.01 5,717 0.11 318 0.01 6,132 0.11 Total Adjustments 4,823 0.09 176,895 3.39 9,051 0.18 181,594 3.46 Non-GAAP Adjusted Net Income and Adjusted EPS $ 41,869 $ 0.82 $ 37,621 $ 0.72 $ 151,332 $ 2.96 $ 145,794 $ 2.78 Note: Amounts may not add due to rounding. a) Reported GAAP for loss periods is calculated using diluted shares outstanding. Diluted shares outstanding for the three and twelve months ended March 31, 2019 are 52,197 and 52,373, respectively. b) Items related to new warehouse represent costs to transition to the new warehouse and duplicate costs incurred during the transition. Items related to divestiture represent costs related to divesting of assets sold. c) Items related to divestiture represent costs related to divesting of assets sold, including (but not limited to) costs to exit or convert contractual obligations, severance and consulting costs; and certain costs related to the consummation of the divestiture process such as legal and other related professional fees. d) The income tax adjustments are determined using applicable rates in the taxing jurisdictions in which the above adjustments relate and includes both current and deferred income tax expense (benefit) based on the specific nature of the specific Non-GAAP performance measure. e) Income tax adjustment to adjust for discrete income tax items.
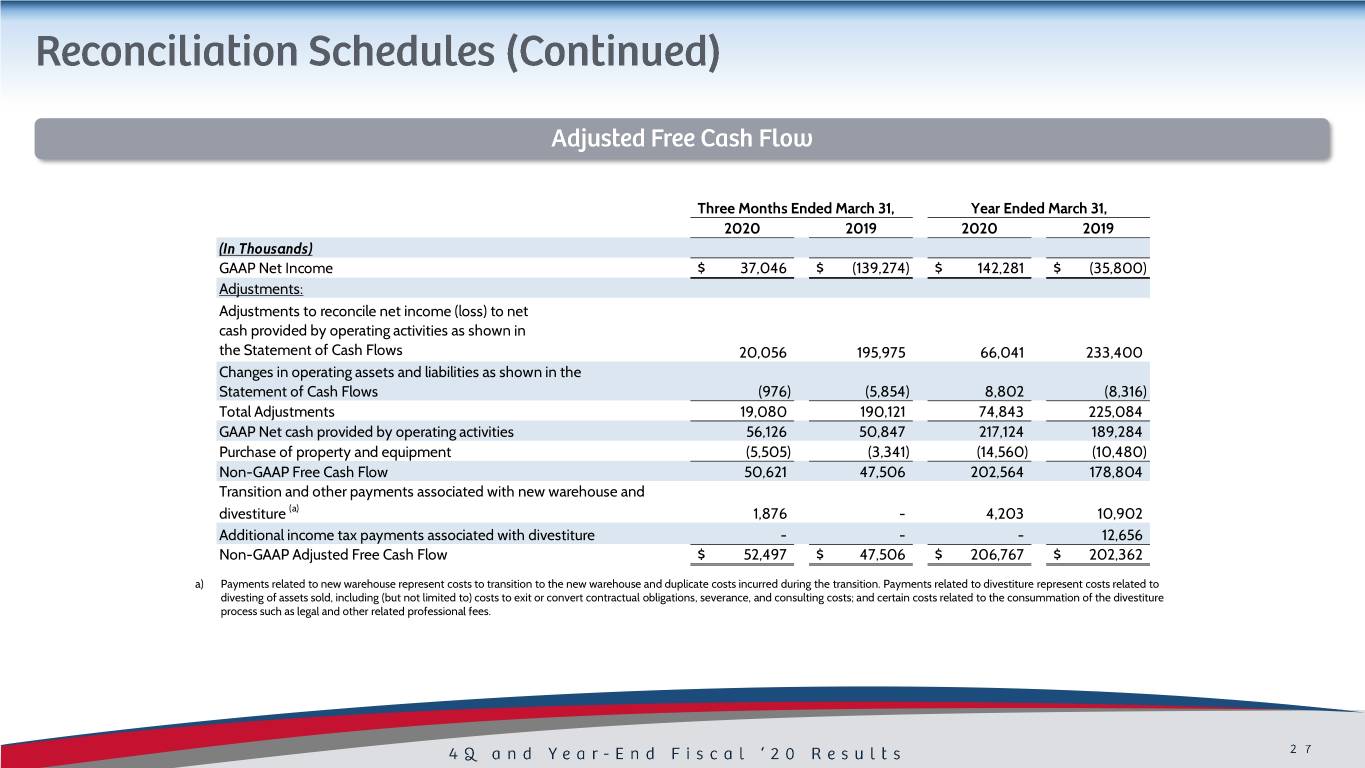
Three Months Ended March 31, Year Ended March 31, 2020 2019 2020 2019 (In Thousands) GAAP Net Income $ 37,046 $ (139,274) $ 142,281 $ (35,800) Adjustments: Adjustments to reconcile net income (loss) to net cash provided by operating activities as shown in the Statement of Cash Flows 20,056 195,975 66,041 233,400 Changes in operating assets and liabilities as shown in the Statement of Cash Flows (976) (5,854) 8,802 (8,316) Total Adjustments 19,080 190,121 74,843 225,084 GAAP Net cash provided by operating activities 56,126 50,847 217,124 189,284 Purchase of property and equipment (5,505) (3,341) (14,560) (10,480) Non-GAAP Free Cash Flow 50,621 47,506 202,564 178,804 Transition and other payments associated with new warehouse and divestiture (a) 1,876 - 4,203 10,902 Additional income tax payments associated with divestiture - - - 12,656 Non-GAAP Adjusted Free Cash Flow $ 52,497 $ 47,506 $ 206,767 $ 202,362 a) Payments related to new warehouse represent costs to transition to the new warehouse and duplicate costs incurred during the transition. Payments related to divestiture represent costs related to divesting of assets sold, including (but not limited to) costs to exit or convert contractual obligations, severance, and consulting costs; and certain costs related to the consummation of the divestiture process such as legal and other related professional fees.

2017 2018 2019 2020 GAAP Net Income $ 69,395 $ 339,570 $ (35,800) $ 142,281 Adjustments Adjustments to reconcile net income to net cash provided by operating activities as shown in the statement of cash flows 92,613 (113,698) 233,400 66,041 Changes in operating assets and liabilities, net of effects from acquisitions as shown in the statement of cash flows (13,336) (15,762) (8,316) 8,802 Total adjustments 79,277 (129,460) 225,084 74,843 GAAP Net cash provided by operating activities 148,672 210,110 189,284 217,124 Purchases of property and equipment (2,977) (12,532) (10,480) (14,560) Non-GAAP Free Cash Flow 145,695 197,578 178,804 202,564 Premium payment on 2010 Senior Notes - - - - Premium payment on extinguishment of 2012 Senior Notes - - - - Accelerated payments due to debt refinancing 9,184 182 - - Integration, transition and other payments associated with acquisitions 10,448 10,358 10,902 4,203 Pension contribution 6,000 - - - Additional income tax payments associated with divestitures 25,545 - 12,656 - Total adjustments 51,177 10,540 23,558 4,203 Non-GAAP Adjusted Free Cash Flow $ 196,872 $ 208,118 $ 202,362 $ 206,767
