Attached files
| file | filename |
|---|---|
| EX-99.1 - EX-99.1 - Oaktree Strategic Income Corp | d911831dex991.htm |
| 8-K - 8-K - Oaktree Strategic Income Corp | d911831d8k.htm |

Second Quarter Fiscal Year 2020 Earnings Presentation May 7, 2020 Nasdaq: OCSI Exhibit 99.2
Forward Looking Statements Some of the statements in this presentation constitute forward-looking statements because they relate to future events or our future performance or financial condition. The forward-looking statements contained in this presentation may include statements as to: our future operating results and distribution projections; the ability of Oaktree Fund Advisors, LLC (“Oaktree”) to reposition our portfolio and to implement Oaktree’s future plans with respect to our business; the ability of Oaktree to attract and retain highly talented professionals; our business prospects and the prospects of our portfolio companies; the impact of the investments that we expect to make; the ability of our portfolio companies to achieve their objectives; our expected financings and investments and additional leverage we may seek to incur in the future; the adequacy of our cash resources and working capital; the timing of cash flows, if any, from the operations of our portfolio companies; and the cost or potential outcome of any litigation to which we may be a party. In addition, words such as “anticipate,” “believe,” “expect,” “seek,” “plan,” “should,” “estimate,” “project” and “intend” indicate forward-looking statements, although not all forward-looking statements include these words. The forward-looking statements contained in this presentation involve risks and uncertainties. Our actual results could differ materially from those implied or expressed in the forward-looking statements for any reason, including the factors set forth in “Risk Factors” and elsewhere in our annual report on Form 10-K for the fiscal year ended September 30, 2019 and our quarterly report on Form 10-Q for the quarter ended March 31, 2020. Other factors that could cause actual results to differ materially include: changes or potential disruptions in our operations, the economy, financial markets or political environment; risks associated with possible disruption in our operations or the economy generally due to terrorism, natural disasters or the COVID-19 pandemic; future changes in laws or regulations (including the interpretation of these laws and regulations by regulatory authorities) and conditions in our operating areas, particularly with respect to business development companies or regulated investment companies; general considerations associated with the COVID-19 pandemic; and other considerations that may be disclosed from time to time in our publicly disseminated documents and filings. We have based the forward-looking statements included in this presentation on information available to us on the date of this presentation, and we assume no obligation to update any such forward-looking statements. Although we undertake no obligation to revise or update any forward-looking statements, whether as a result of new information, future events or otherwise, you are advised to consult any additional disclosures that we may make directly to you or through reports that we in the future may file with the SEC, including annual reports on Form 10-K, quarterly reports on Form 10-Q and current reports on Form 8-K. Unless otherwise indicated, data provided herein are dated as of March 31, 2020.
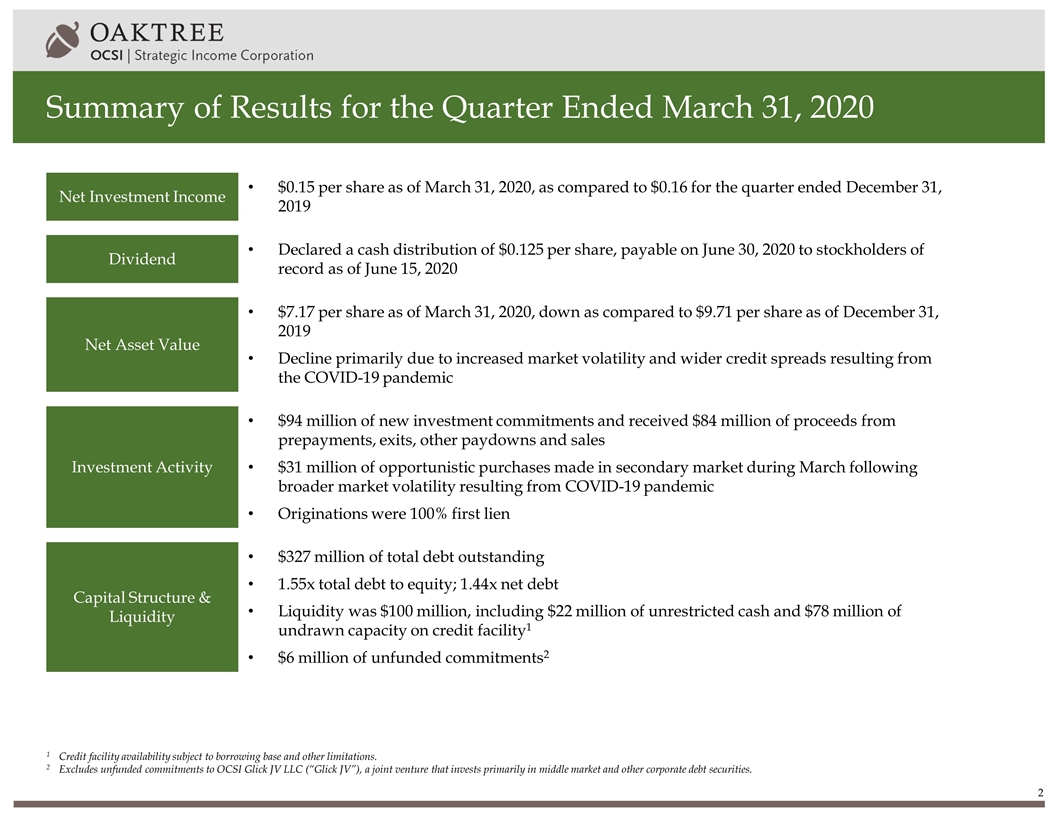
Summary of Results for the Quarter Ended March 31, 2020 Net Investment Income $0.15 per share as of March 31, 2020, as compared to $0.16 for the quarter ended December 31, 2019 Dividend Declared a cash distribution of $0.125 per share, payable on June 30, 2020 to stockholders of record as of June 15, 2020 Net Asset Value $7.17 per share as of March 31, 2020, down as compared to $9.71 per share as of December 31, 2019 Decline primarily due to increased market volatility and wider credit spreads resulting from the COVID-19 pandemic Investment Activity $94 million of new investment commitments and received $84 million of proceeds from prepayments, exits, other paydowns and sales $31 million of opportunistic purchases made in secondary market during March following broader market volatility resulting from COVID-19 pandemic Originations were 100% first lien Capital Structure & Liquidity $327 million of total debt outstanding 1.55x total debt to equity; 1.44x net debt Liquidity was $100 million, including $22 million of unrestricted cash and $78 million of undrawn capacity on credit facility1 $6 million of unfunded commitments2 1Credit facility availability subject to borrowing base and other limitations. 2Excludes unfunded commitments to OCSI Glick JV LLC (“Glick JV”), a joint venture that invests primarily in middle market and other corporate debt securities.
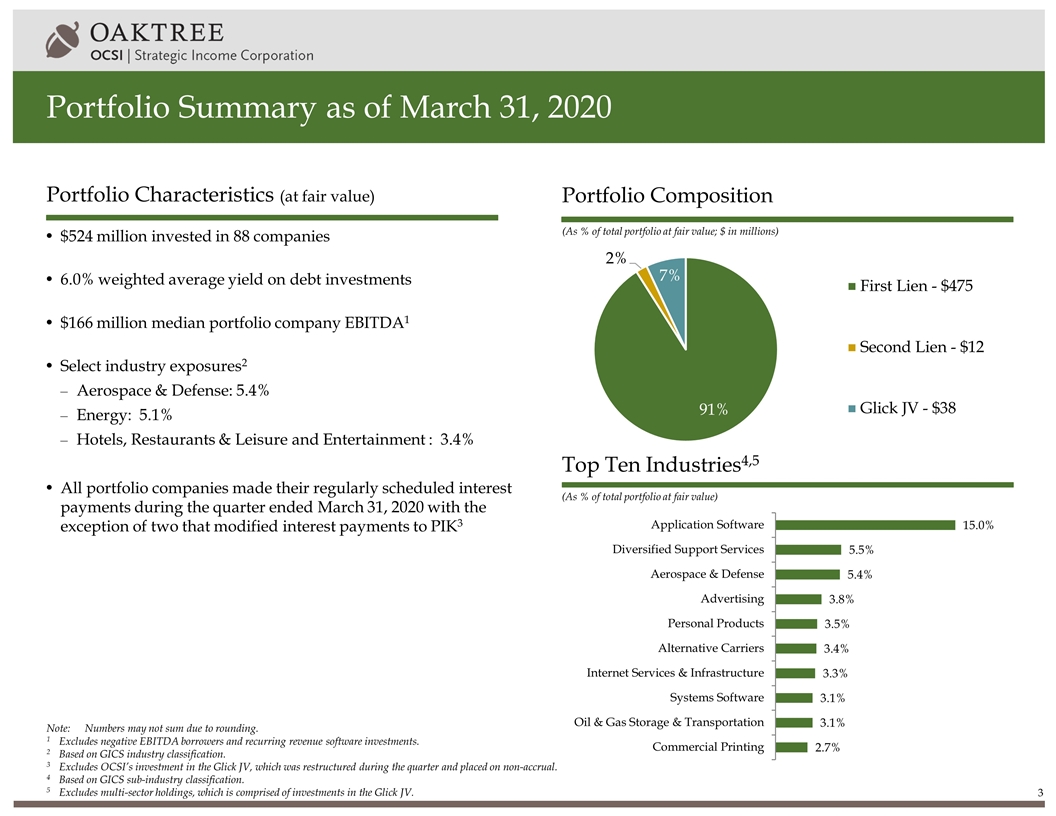
Portfolio Summary as of March 31, 2020 (As % of total portfolio at fair value; $ in millions) (As % of total portfolio at fair value) Portfolio Composition Top Ten Industries4,5 Portfolio Characteristics (at fair value) $524 million invested in 88 companies 6.0% weighted average yield on debt investments $166 million median portfolio company EBITDA1 Select industry exposures2 Aerospace & Defense: 5.4% Energy: 5.1% Hotels, Restaurants & Leisure and Entertainment : 3.4% All portfolio companies made their regularly scheduled interest payments during the quarter ended March 31, 2020 with the exception of two that modified interest payments to PIK3 Note:Numbers may not sum due to rounding. 1 Excludes negative EBITDA borrowers and recurring revenue software investments. 2Based on GICS industry classification. 3Excludes OCSI’s investment in the Glick JV, which was restructured during the quarter and placed on non-accrual. 4 Based on GICS sub-industry classification. 5Excludes multi-sector holdings, which is comprised of investments in the Glick JV.
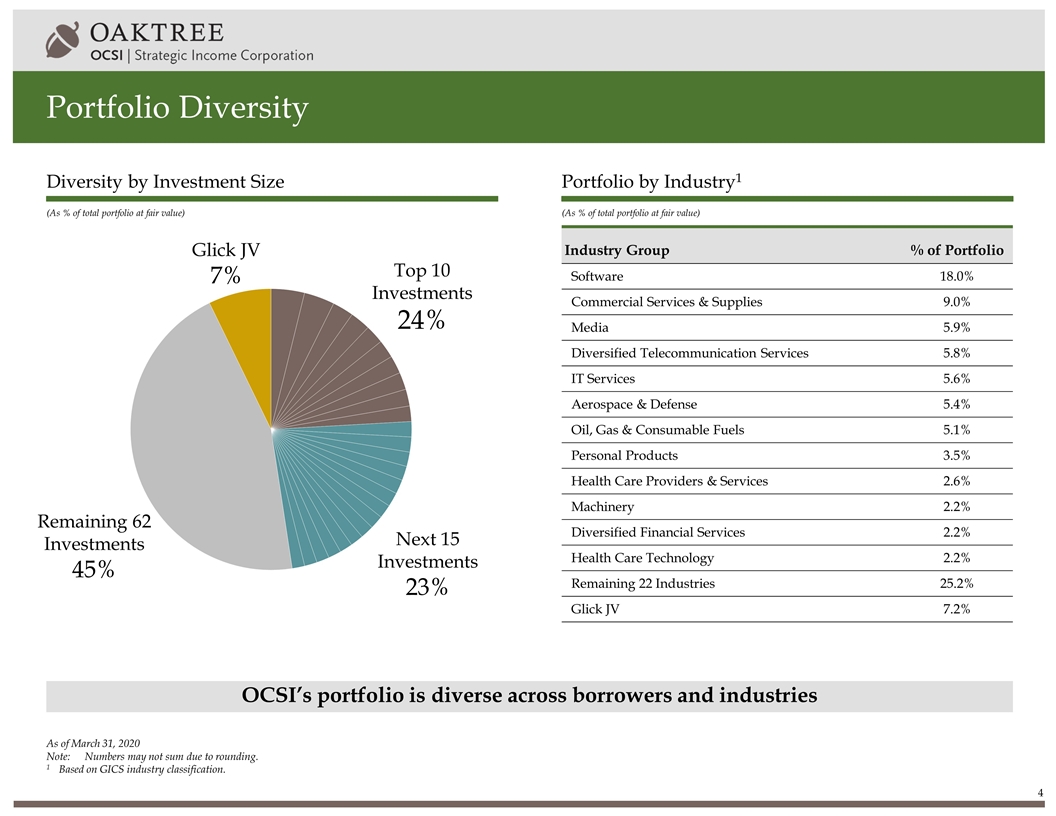
Portfolio Diversity OCSI’s portfolio is diverse across borrowers and industries (As % of total portfolio at fair value) (As % of total portfolio at fair value) Portfolio by Industry1 Diversity by Investment Size Top 10 Investments 24% Next 15 Investments 23% Remaining 62 Investments 45% Glick JV 7% Industry Group % of Portfolio Software 18.0% Commercial Services & Supplies 9.0% Media 5.9% Diversified Telecommunication Services 5.8% IT Services 5.6% Aerospace & Defense 5.4% Oil, Gas & Consumable Fuels 5.1% Personal Products 3.5% Health Care Providers & Services 2.6% Machinery 2.2% Diversified Financial Services 2.2% Health Care Technology 2.2% Remaining 22 Industries 25.2% Glick JV 7.2% As of March 31, 2020 Note:Numbers may not sum due to rounding. 1Based on GICS industry classification.
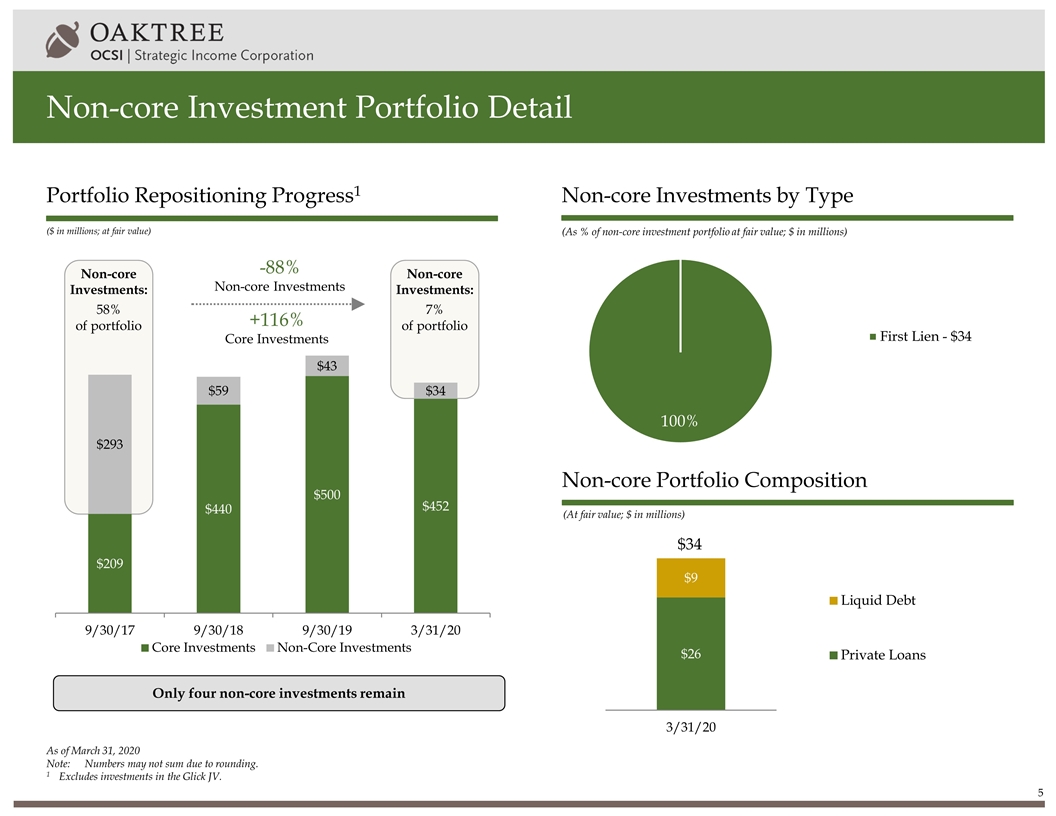
As of March 31, 2020 Note:Numbers may not sum due to rounding. 1Excludes investments in the Glick JV. Non-core Investment Portfolio Detail Portfolio Repositioning Progress1 (As % of non-core investment portfolio at fair value; $ in millions) Non-core Investments by Type (At fair value; $ in millions) Non-core Portfolio Composition $34 Non-core Investments: 7% of portfolio Non-core Investments: 58% of portfolio -88% Non-core Investments +116% Core Investments ($ in millions; at fair value) Only four non-core investments remain
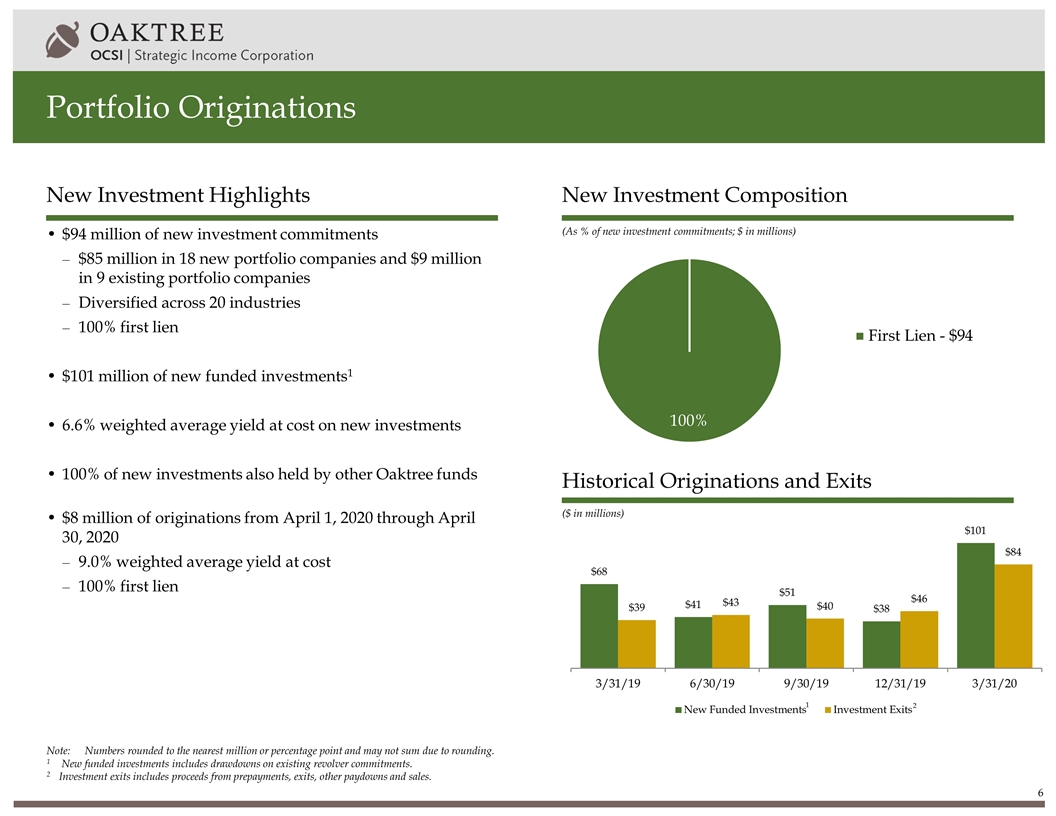
Portfolio Originations $94 million of new investment commitments $85 million in 18 new portfolio companies and $9 million in 9 existing portfolio companies Diversified across 20 industries 100% first lien $101 million of new funded investments1 6.6% weighted average yield at cost on new investments 100% of new investments also held by other Oaktree funds $8 million of originations from April 1, 2020 through April 30, 2020 9.0% weighted average yield at cost 100% first lien New Investment Highlights ($ in millions) Historical Originations and Exits (As % of new investment commitments; $ in millions) New Investment Composition Note:Numbers rounded to the nearest million or percentage point and may not sum due to rounding. 1 New funded investments includes drawdowns on existing revolver commitments. 2Investment exits includes proceeds from prepayments, exits, other paydowns and sales. 2 1
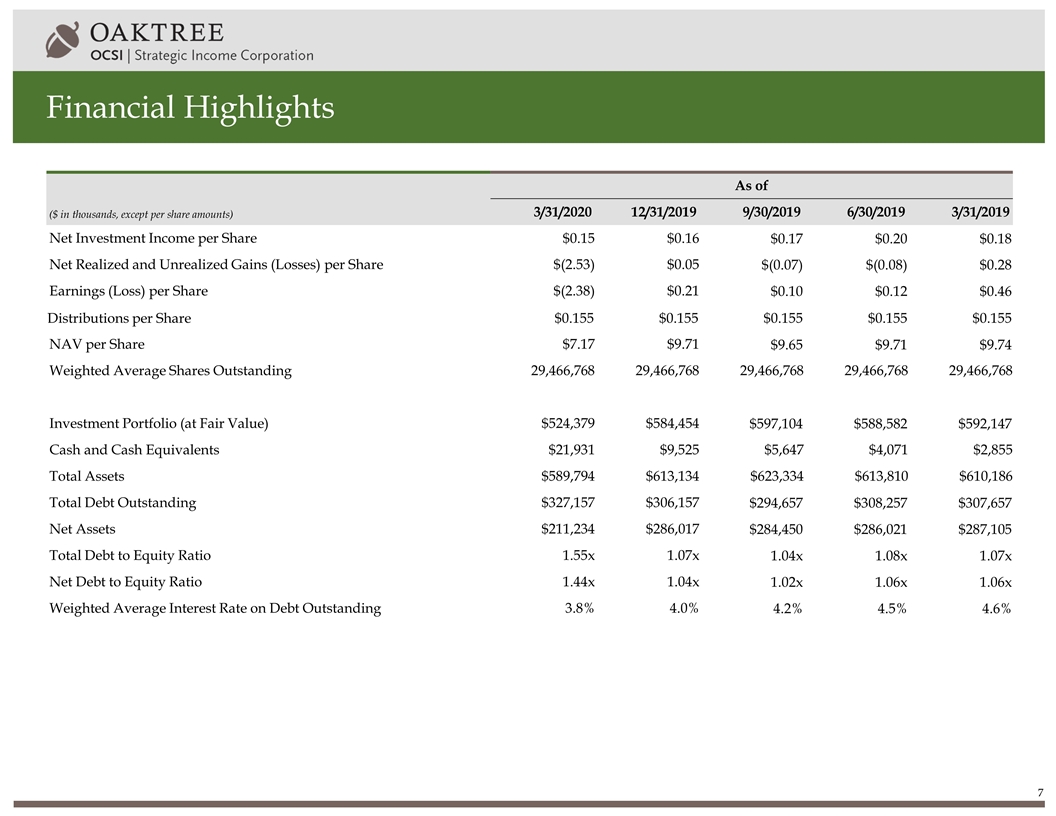
Financial Highlights ($ in thousands, except per share amounts) As of 3/31/2020 12/31/2019 9/30/2019 6/30/2019 3/31/2019 Net Investment Income per Share $0.15 $0.16 $0.17 $0.20 $0.18 Net Realized and Unrealized Gains (Losses) per Share $(2.53) $0.05 $(0.07) $(0.08) $0.28 Earnings (Loss) per Share $(2.38) $0.21 $0.10 $0.12 $0.46 Distributions per Share $0.155 $0.155 $0.155 $0.155 $0.155 NAV per Share $7.17 $9.71 $9.65 $9.71 $9.74 Weighted Average Shares Outstanding 29,466,768 29,466,768 29,466,768 29,466,768 29,466,768 Investment Portfolio (at Fair Value) $524,379 $584,454 $597,104 $588,582 $592,147 Cash and Cash Equivalents $21,931 $9,525 $5,647 $4,071 $2,855 Total Assets $589,794 $613,134 $623,334 $613,810 $610,186 Total Debt Outstanding $327,157 $306,157 $294,657 $308,257 $307,657 Net Assets $211,234 $286,017 $284,450 $286,021 $287,105 Total Debt to Equity Ratio 1.55x 1.07x 1.04x 1.08x 1.07x Net Debt to Equity Ratio 1.44x 1.04x 1.02x 1.06x 1.06x Weighted Average Interest Rate on Debt Outstanding 3.8% 4.0% 4.2% 4.5% 4.6%
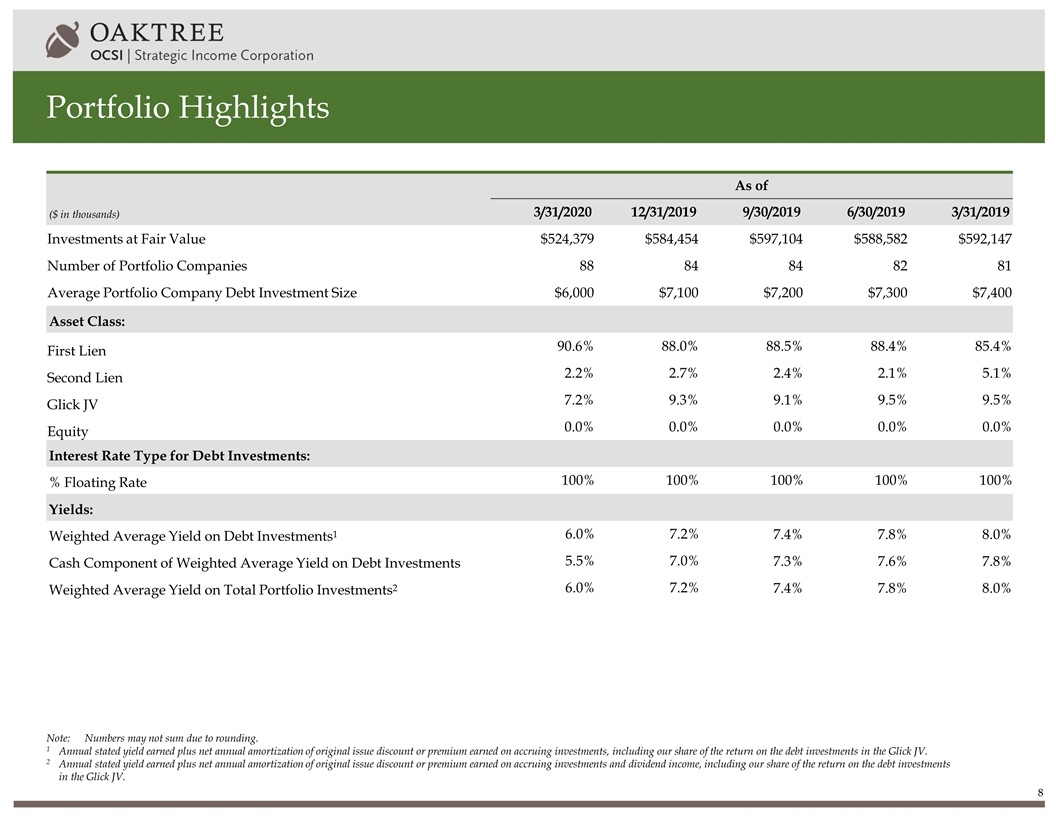
Portfolio Highlights ($ in thousands) As of 3/31/2020 12/31/2019 9/30/2019 6/30/2019 3/31/2019 Investments at Fair Value $524,379 $584,454 $597,104 $588,582 $592,147 Number of Portfolio Companies 88 84 84 82 81 Average Portfolio Company Debt Investment Size $6,000 $7,100 $7,200 $7,300 $7,400 Asset Class: First Lien 90.6% 88.0% 88.5% 88.4% 85.4% Second Lien 2.2% 2.7% 2.4% 2.1% 5.1% Glick JV 7.2% 9.3% 9.1% 9.5% 9.5% Equity 0.0% 0.0% 0.0% 0.0% 0.0% Interest Rate Type for Debt Investments: % Floating Rate 100% 100% 100% 100% 100% Yields: Weighted Average Yield on Debt Investments1 6.0% 7.2% 7.4% 7.8% 8.0% Cash Component of Weighted Average Yield on Debt Investments 5.5% 7.0% 7.3% 7.6% 7.8% Weighted Average Yield on Total Portfolio Investments2 6.0% 7.2% 7.4% 7.8% 8.0% Note:Numbers may not sum due to rounding. 1Annual stated yield earned plus net annual amortization of original issue discount or premium earned on accruing investments, including our share of the return on the debt investments in the Glick JV. 2Annual stated yield earned plus net annual amortization of original issue discount or premium earned on accruing investments and dividend income, including our share of the return on the debt investments in the Glick JV.
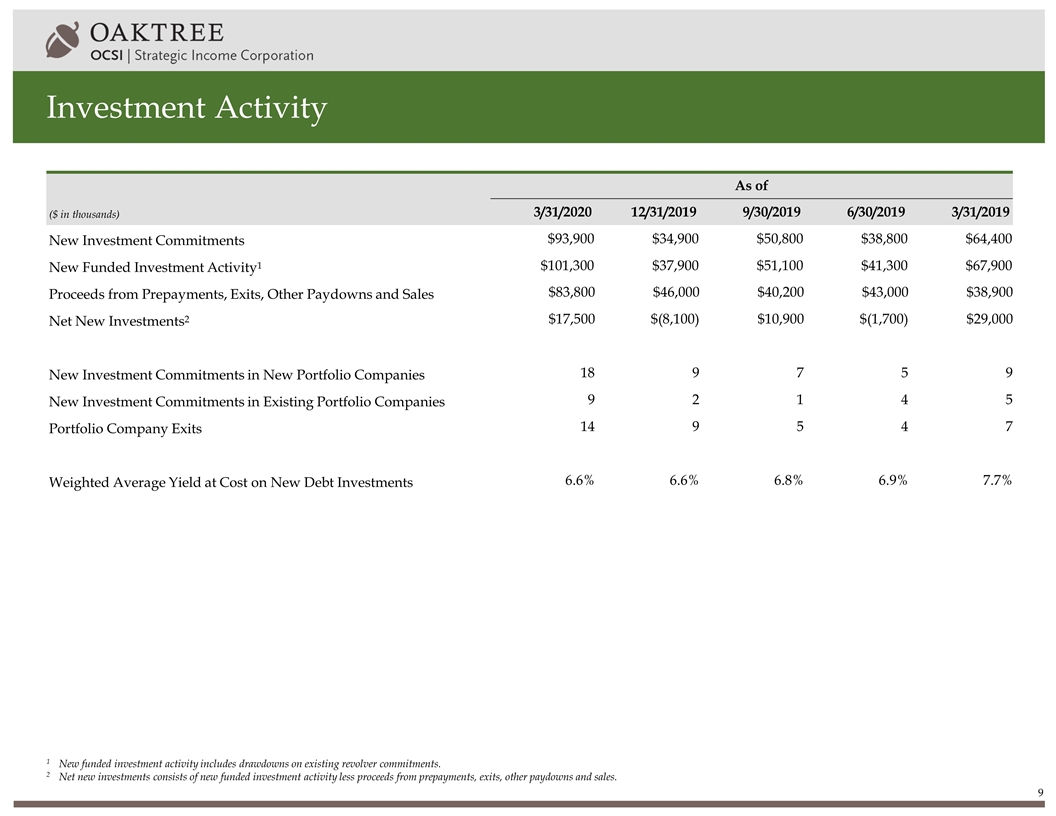
Investment Activity ($ in thousands) As of 3/31/2020 12/31/2019 9/30/2019 6/30/2019 3/31/2019 New Investment Commitments $93,900 $34,900 $50,800 $38,800 $64,400 New Funded Investment Activity1 $101,300 $37,900 $51,100 $41,300 $67,900 Proceeds from Prepayments, Exits, Other Paydowns and Sales $83,800 $46,000 $40,200 $43,000 $38,900 Net New Investments2 $17,500 $(8,100) $10,900 $(1,700) $29,000 New Investment Commitments in New Portfolio Companies 18 9 7 5 9 New Investment Commitments in Existing Portfolio Companies 9 2 1 4 5 Portfolio Company Exits 14 9 5 4 7 Weighted Average Yield at Cost on New Debt Investments 6.6% 6.6% 6.8% 6.9% 7.7% 1New funded investment activity includes drawdowns on existing revolver commitments. 2Net new investments consists of new funded investment activity less proceeds from prepayments, exits, other paydowns and sales.
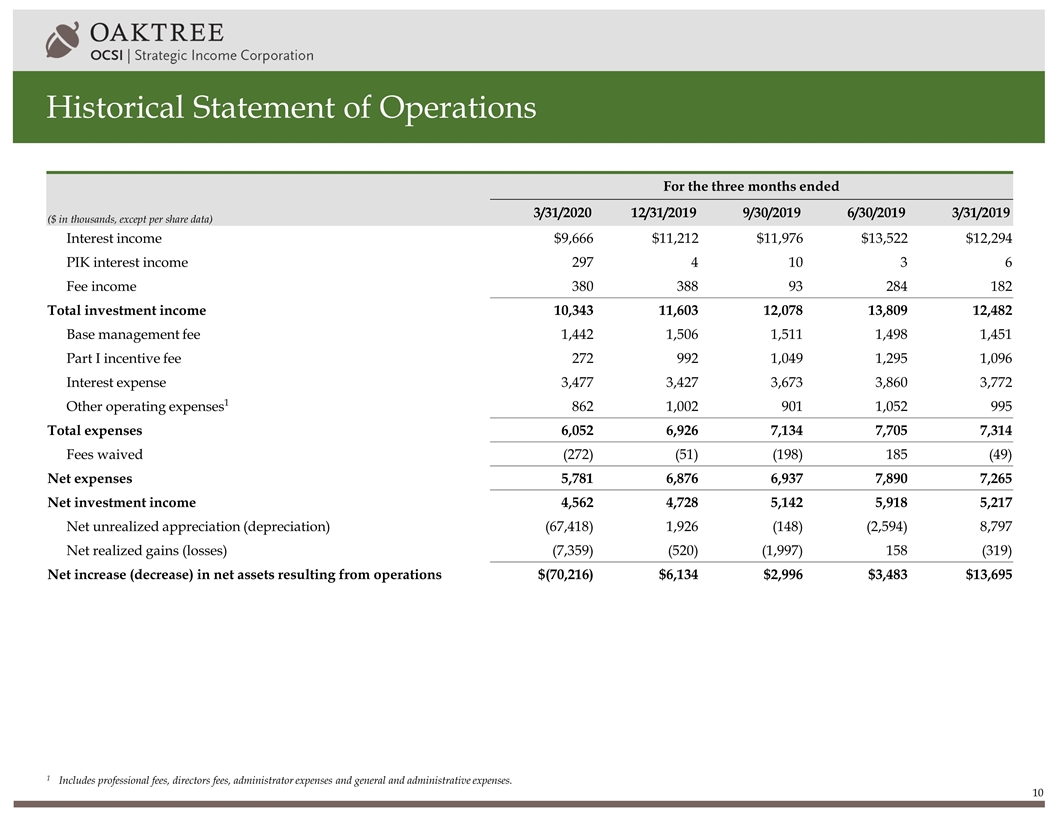
Historical Statement of Operations ($ in thousands, except per share data) For the three months ended 3/31/2020 12/31/2019 9/30/2019 6/30/2019 3/31/2019 Interest income $9,666 $11,212 $11,976 $13,522 $12,294 PIK interest income 297 4 10 3 6 Fee income 380 388 93 284 182 Total investment income 10,343 11,603 12,078 13,809 12,482 Base management fee 1,442 1,506 1,511 1,498 1,451 Part I incentive fee 272 992 1,049 1,295 1,096 Interest expense 3,477 3,427 3,673 3,860 3,772 Other operating expenses1 862 1,002 901 1,052 995 Total expenses 6,052 6,926 7,134 7,705 7,314 Fees waived (272) (51) (198) 185 (49) Net expenses 5,781 6,876 6,937 7,890 7,265 Net investment income 4,562 4,728 5,142 5,918 5,217 Net unrealized appreciation (depreciation) (67,418) 1,926 (148) (2,594) 8,797 Net realized gains (losses) (7,359) (520) (1,997) 158 (319) Net increase (decrease) in net assets resulting from operations $(70,216) $6,134 $2,996 $3,483 $13,695 1Includes professional fees, directors fees, administrator expenses and general and administrative expenses.
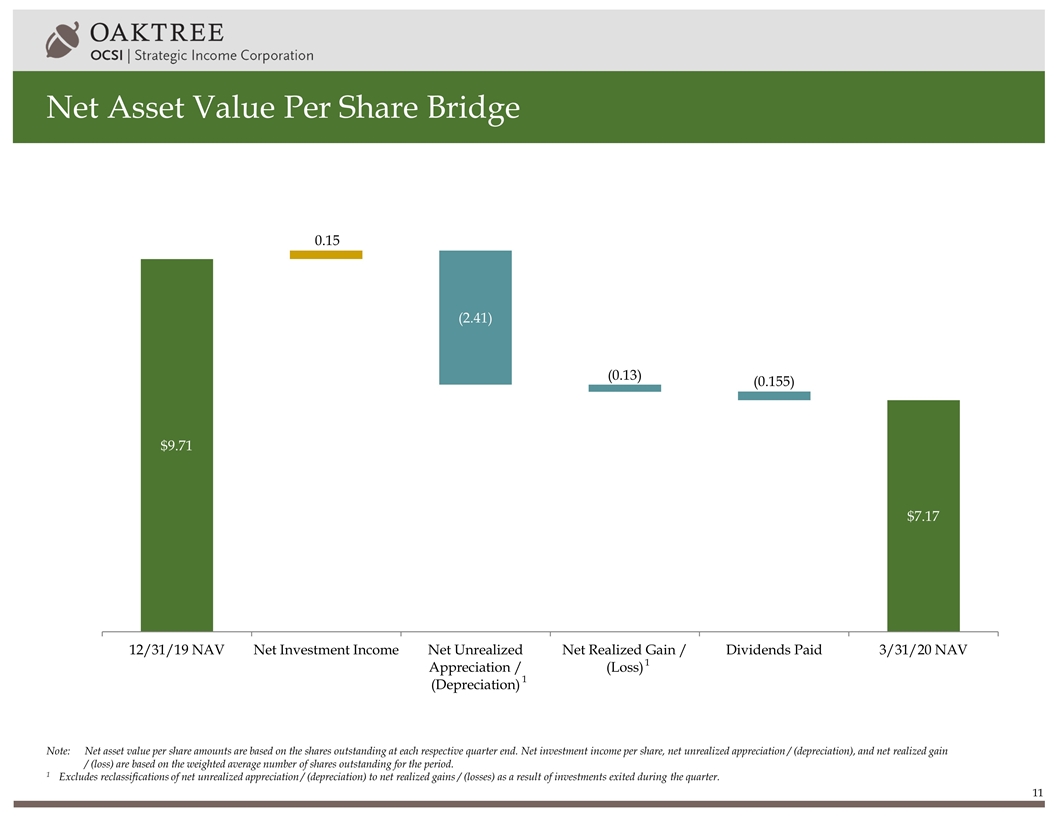
Net Asset Value Per Share Bridge Note:Net asset value per share amounts are based on the shares outstanding at each respective quarter end. Net investment income per share, net unrealized appreciation / (depreciation), and net realized gain / (loss) are based on the weighted average number of shares outstanding for the period. 1Excludes reclassifications of net unrealized appreciation / (depreciation) to net realized gains / (losses) as a result of investments exited during the quarter. 1 1
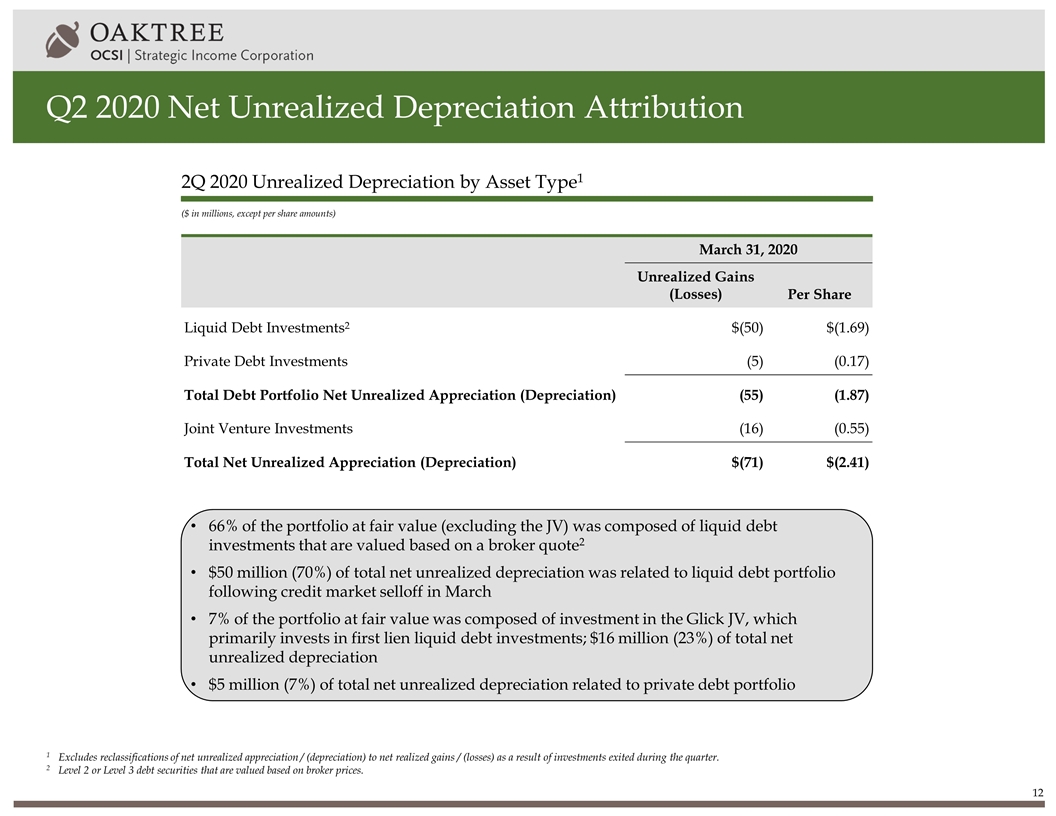
Q2 2020 Net Unrealized Depreciation Attribution ($ in millions, except per share amounts) 2Q 2020 Unrealized Depreciation by Asset Type1 March 31, 2020 Unrealized Gains (Losses) Per Share Liquid Debt Investments2 $(50) $(1.69) Private Debt Investments (5) (0.17) Total Debt Portfolio Net Unrealized Appreciation (Depreciation) (55) (1.87) Joint Venture Investments (16) (0.55) Total Net Unrealized Appreciation (Depreciation) $(71) $(2.41) 1 Excludes reclassifications of net unrealized appreciation / (depreciation) to net realized gains / (losses) as a result of investments exited during the quarter. 2Level 2 or Level 3 debt securities that are valued based on broker prices. 66% of the portfolio at fair value (excluding the JV) was composed of liquid debt investments that are valued based on a broker quote2 $50 million (70%) of total net unrealized depreciation was related to liquid debt portfolio following credit market selloff in March 7% of the portfolio at fair value was composed of investment in the Glick JV, which primarily invests in first lien liquid debt investments; $16 million (23%) of total net unrealized depreciation $5 million (7%) of total net unrealized depreciation related to private debt portfolio
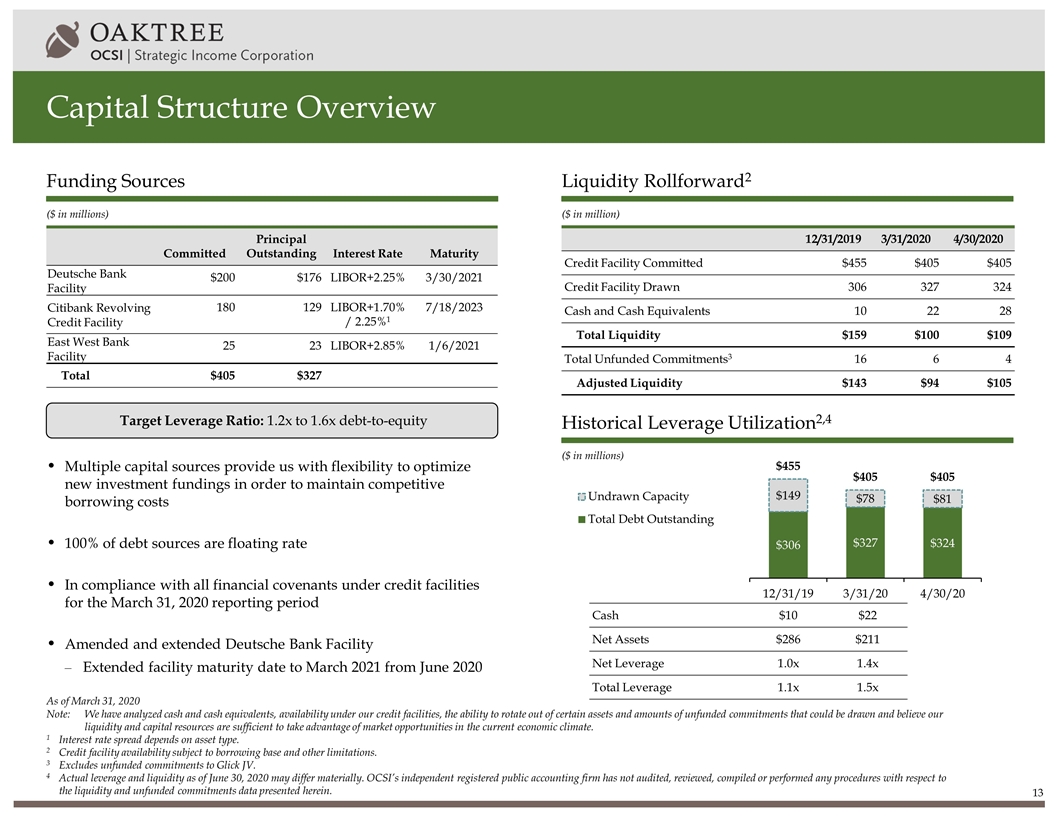
Capital Structure Overview ($ in millions) ($ in million) ($ in millions) Funding Sources Liquidity Rollforward2 Historical Leverage Utilization2,4 Committed Principal Outstanding Interest Rate Maturity Deutsche Bank Facility $200 $176 LIBOR+2.25% 3/30/2021 Citibank Revolving Credit Facility 180 129 LIBOR+1.70% / 2.25%1 7/18/2023 East West Bank Facility 25 23 LIBOR+2.85% 1/6/2021 Total $405 $327 As of March 31, 2020 Note:We have analyzed cash and cash equivalents, availability under our credit facilities, the ability to rotate out of certain assets and amounts of unfunded commitments that could be drawn and believe our liquidity and capital resources are sufficient to take advantage of market opportunities in the current economic climate. 1Interest rate spread depends on asset type. 2Credit facility availability subject to borrowing base and other limitations. 3 Excludes unfunded commitments to Glick JV. 4Actual leverage and liquidity as of June 30, 2020 may differ materially. OCSI’s independent registered public accounting firm has not audited, reviewed, compiled or performed any procedures with respect to the liquidity and unfunded commitments data presented herein. Target Leverage Ratio: 1.2x to 1.6x debt-to-equity Multiple capital sources provide us with flexibility to optimize new investment fundings in order to maintain competitive borrowing costs 100% of debt sources are floating rate In compliance with all financial covenants under credit facilities for the March 31, 2020 reporting period Amended and extended Deutsche Bank Facility Extended facility maturity date to March 2021 from June 2020 12/31/2019 3/31/2020 4/30/2020 Credit Facility Committed $455 $405 $405 Credit Facility Drawn 306 327 324 Cash and Cash Equivalents 10 22 28 Total Liquidity $159 $100 $109 Total Unfunded Commitments3 16 6 4 Adjusted Liquidity $143 $94 $105 Cash $10 $22 Net Assets $286 $211 Net Leverage 1.0x 1.4x Total Leverage 1.1x 1.5x
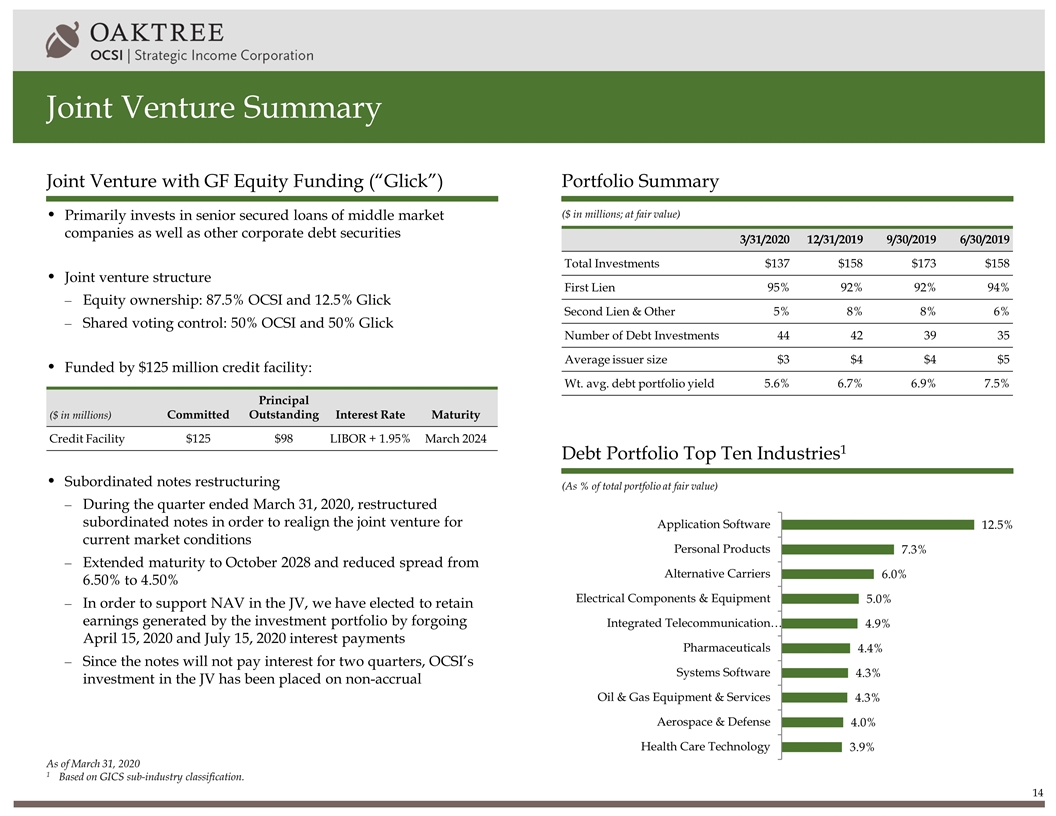
Joint Venture Summary ($ in millions; at fair value) (As % of total portfolio at fair value) Joint Venture with GF Equity Funding (“Glick”) Portfolio Summary Debt Portfolio Top Ten Industries1 As of March 31, 2020 1Based on GICS sub-industry classification. Primarily invests in senior secured loans of middle market companies as well as other corporate debt securities Joint venture structure Equity ownership: 87.5% OCSI and 12.5% Glick Shared voting control: 50% OCSI and 50% Glick Funded by $125 million credit facility: Subordinated notes restructuring During the quarter ended March 31, 2020, restructured subordinated notes in order to realign the joint venture for current market conditions Extended maturity to October 2028 and reduced spread from 6.50% to 4.50% In order to support NAV in the JV, we have elected to retain earnings generated by the investment portfolio by forgoing April 15, 2020 and July 15, 2020 interest payments Since the notes will not pay interest for two quarters, OCSI’s investment in the JV has been placed on non-accrual 3/31/2020 12/31/2019 9/30/2019 6/30/2019 Total Investments $137 $158 $173 $158 First Lien 95% 92% 92% 94% Second Lien & Other 5% 8% 8% 6% Number of Debt Investments 44 42 39 35 Average issuer size $3 $4 $4 $5 Wt. avg. debt portfolio yield 5.6% 6.7% 6.9% 7.5% ($ in millions) Committed Principal Outstanding Interest Rate Maturity Credit Facility $125 $98 LIBOR + 1.95% March 2024

Contact: Michael Mosticchio, Investor Relations ocsi-ir@oaktreecapital.com
