Attached files
| file | filename |
|---|---|
| EX-99.3 - EXHIBIT 99.3 - IRON MOUNTAIN INC | srpq12020final1.htm |
| EX-99.1 - EXHIBIT 99.1 - IRON MOUNTAIN INC | q12020earningspressrel.htm |
| 8-K - 8-K - IRON MOUNTAIN INC | irm8-kq12020earningsno.htm |

Q1 2020 Earnings Call May 7, 2020
Forward Looking Statements 2 Safe Harbor Statement Under the Private Securities Litigation Reform Act of 1995: This release contains certain forward-looking statements within the meaning of the Private Securities Litigation Reform Act of 1995 and other securities laws and is subject to the safe-harbor created by such Act. Forward-looking statements include, but are not, limited to statements concerning our operations, economic performance, financial condition, goals, beliefs, future growth strategies, plans and current expectations, such as outlook for 2020, statements about: the expected impact of COVID-19 on our operations and financial conditions; the expected benefits, costs and actions related to Project Summit; planned 2020 capital expenditures, M&A and other investments; leverage; our dividend policy, and longer term capital allocation goals, and other goals. When we use words such as "believes," "expects," "anticipates," "estimates" or similar expressions, we are making forward-looking statements. Although we believe that our forward looking statements are based on reasonable assumptions, our expected results may not be achieved, and actual results may differ materially from our expectations. These forward-looking statements are subject to various known and unknown risks, uncertainties and other factors. Important factors that could cause actual results to differ from expectations include the impact of COVID-19 on our operations, including: a decrease in revenue, particularly from our service operations as we and our customers have restricted movement and personal interaction to limit the spread of the virus and comply with regulations; risks to our business operations as a result of many employees working from home; a decrease is cash collections; our ability to meet our cash needs, raise capital and execute on our growth strategy; as well as our ability to meet our leverage and other covenants in our debt documents. Other risk factors include (i) our ability to remain qualified for taxation as a real estate investment trust for U.S. federal income tax purposes; (ii) the adoption of alternative technologies and shifts by our customers to storage of data through non-paper based technologies; (iii) changes in customer preferences and demand for our storage and information management services; (iv) the cost and our ability to comply with laws, regulations and customer demands relating to data security and privacy issues, as well as fire and safety standards; (v) our ability or inability to execute our strategic growth plan, expand internationally, complete acquisitions on satisfactory terms, and to integrate acquired companies efficiently; (vi) changes in the amount of our growth and recurring capital expenditures and our ability to raise capital and invest according to plan; (vii) the impact of litigation or disputes that may arise in connection with incidents in which we fail to protect our customers' information or our internal records or IT systems and the impact of such incidents on our reputation and ability to compete; (viii) our ability to execute on Project Summit and the potential impacts of Project Summit on our ability to retain and recruit employees and execute on our strategy (ix) changes in the price for our storage and information management services relative to the cost of providing such storage and information management services; (x) changes in the political and economic environments in the countries in which our international subsidiaries operate and changes in the global political climate; (xi) the impact of executing on our growth strategy through joint ventures; (xii) our ability to comply with our existing debt obligations and restrictions in our debt instruments or to obtain additional financing to meet our working capital needs; (xiii) the impact of service interruptions or equipment damage and the cost of power on our data center operations; (xiv) changes in the cost of our debt; (xv) the impact of alternative, more attractive investments on dividends; (xvi) the cost or potential liabilities associated with real estate necessary for our business; (xvii) the performance of business partners upon whom we depend for technical assistance or management expertise; (xiii) other trends in competitive or economic conditions affecting our financial condition or results of operations not presently contemplated; and (xix) other risks described more fully in our filings with the Securities and Exchange Commission, including under the caption “Risk Factors” in our periodic reports or incorporated therein. You should not rely upon forward-looking statements except as statements of our present intentions and of our present expectations, which may or may not occur. Except as required by law, we undertake no obligation to release publicly the result of any revision to these forward-looking statements that may be made to reflect events or circumstances after the date hereof or to reflect the occurrence of unanticipated events. "Reconciliation of Non-GAAP Measures: Throughout this presentation, Iron Mountain will discuss (1) Adjusted EBITDA, (2) Adjusted Earnings per Share (“Adjusted EPS”), (3) Funds from Operations (“FFO Nareit”), (4) FFO (Normalized) and (5) Adjusted Funds from Operations (“AFFO”). These measures do not conform to accounting principles generally accepted in the United States (“GAAP”). These non-GAAP measures are supplemental metrics designed to enhance our disclosure and to provide additional information that we believe to be important for investors to consider in addition to, but not as a substitute for, other measures of financial performance reported in accordance with GAAP, such as operating income, income (loss) from continuing operations, net income (loss) attributable to Iron Mountain Incorporated or cash flows from operating activities from continuing operations (as determined in accordance with GAAP). The reconciliation of these measures to the appropriate GAAP measure, as required by Regulation G under the Securities Exchange Act of 1934, as amended, and their definitions are included in the Supplemental Reporting Information.
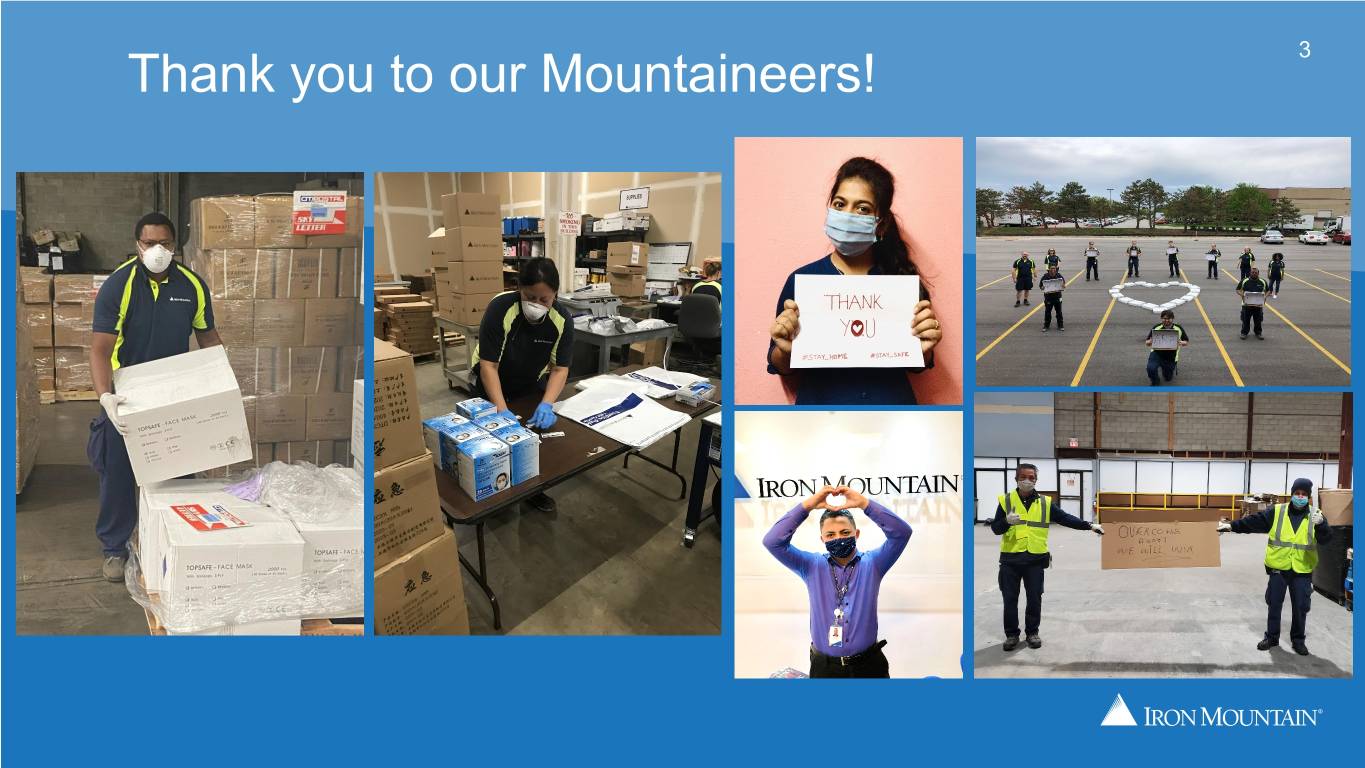
Thank you to our Mountaineers! 3
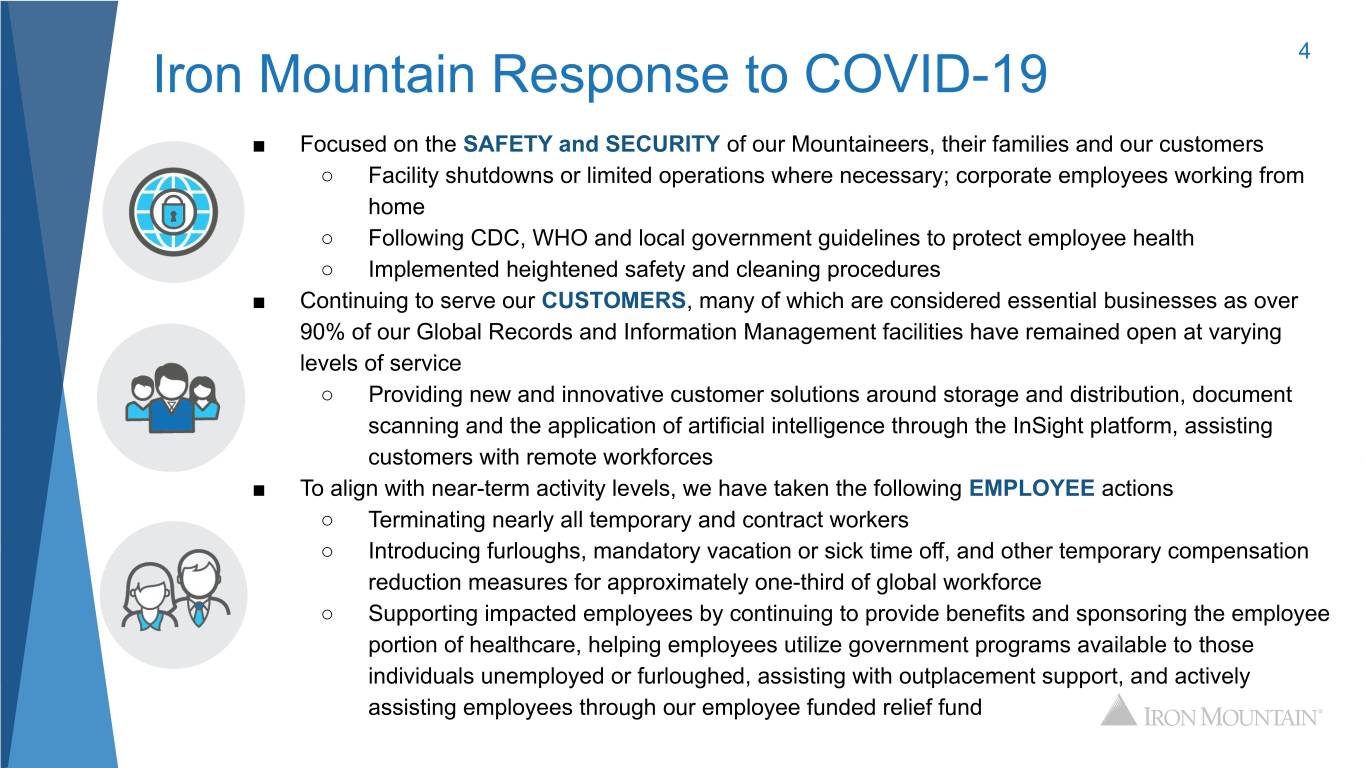
Iron Mountain Response to COVID-19 4 ■ Focused on the SAFETY and SECURITY of our Mountaineers, their families and our customers ○ Facility shutdowns or limited operations where necessary; corporate employees working from home ○ Following CDC, WHO and local government guidelines to protect employee health ○ Implemented heightened safety and cleaning procedures ■ Continuing to serve our CUSTOMERS, many of which are considered essential businesses as over 90% of our Global Records and Information Management facilities have remained open at varying levels of service ○ Providing new and innovative customer solutions around storage and distribution, document scanning and the application of artificial intelligence through the InSight platform, assisting customers with remote workforces ■ To align with near-term activity levels, we have taken the following EMPLOYEE actions ○ Terminating nearly all temporary and contract workers ○ Introducing furloughs, mandatory vacation or sick time off, and other temporary compensation reduction measures for approximately one-third of global workforce ○ Supporting impacted employees by continuing to provide benefits and sponsoring the employee portion of healthcare, helping employees utilize government programs available to those individuals unemployed or furloughed, assisting with outplacement support, and actively assisting employees through our employee funded relief fund
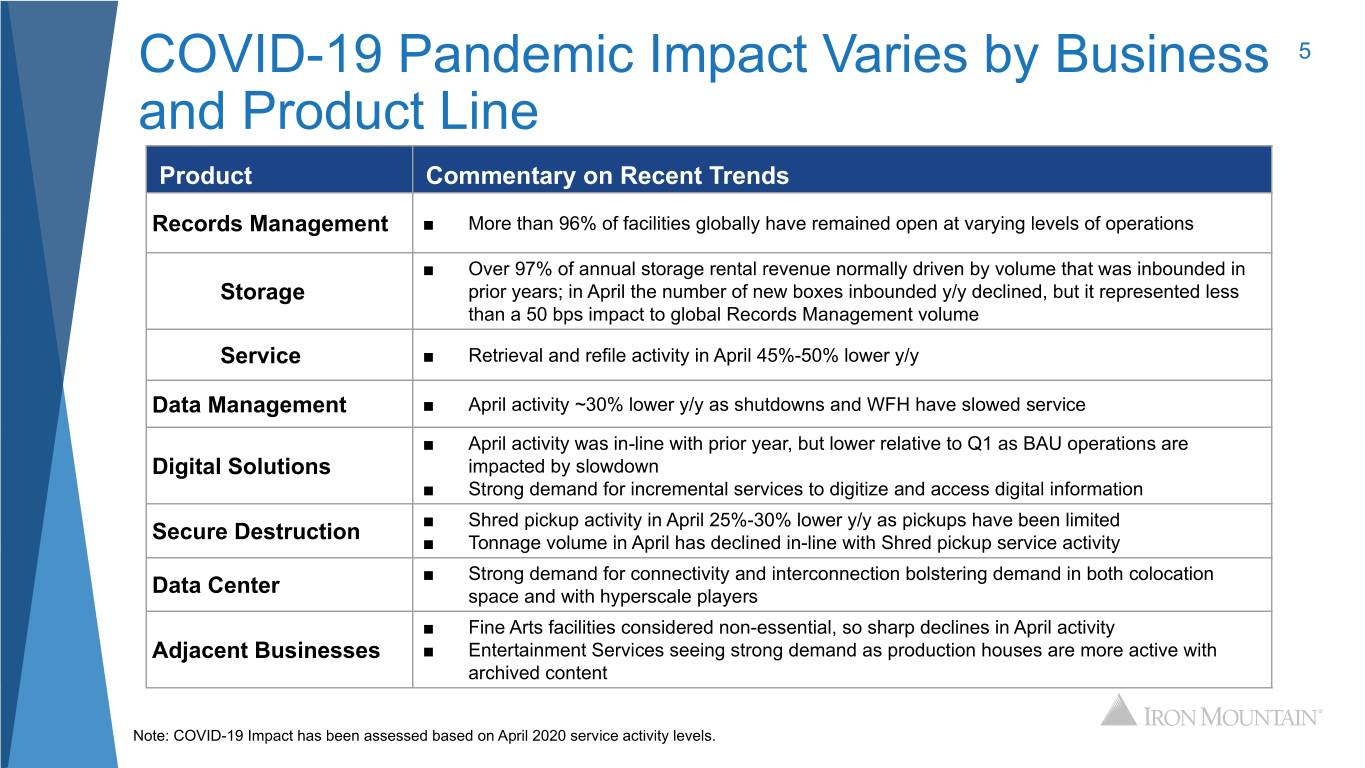
COVID-19 Pandemic Impact Varies by Business 5 and Product Line Product Commentary on Recent Trends Records Management ■ More than 96% of facilities globally have remained open at varying levels of operations ■ Over 97% of annual storage rental revenue normally driven by volume that was inbounded in Storage prior years; in April the number of new boxes inbounded y/y declined, but it represented less than a 50 bps impact to global Records Management volume Service ■ Retrieval and refile activity in April 45%-50% lower y/y Data Management ■ April activity ~30% lower y/y as shutdowns and WFH have slowed service ■ April activity was in-line with prior year, but lower relative to Q1 as BAU operations are Digital Solutions impacted by slowdown ■ Strong demand for incremental services to digitize and access digital information ■ Shred pickup activity in April 25%-30% lower y/y as pickups have been limited Secure Destruction ■ Tonnage volume in April has declined in-line with Shred pickup service activity ■ Strong demand for connectivity and interconnection bolstering demand in both colocation Data Center space and with hyperscale players ■ Fine Arts facilities considered non-essential, so sharp declines in April activity Adjacent Businesses ■ Entertainment Services seeing strong demand as production houses are more active with archived content Note: COVID-19 Impact has been assessed based on April 2020 service activity levels.
How We Are Serving Our Customers Today 6 Iron Mountain Image on Demand Secure Business Storage & Logistics InSight Essentials Digital Service supporting the needs of remote Store and quickly deploy the protective Capture, store and access your content in a workforces and enabling access to important equipment and medical supplies customers secure cloud repository. information need to protect staff and patients A government labor department maintaining critical Benefits: A national healthcare provider struggling with paper-based processes while enabling a surge in need for medical supplies and supply home-based workforce ➔ This service provides safe, contactless chain challenges digital delivery. Customer needs: ➔ Enhances the chain of custody security Customer needs: ➔ Enable home-based workers to process and provides a quick 24-hour ➔ Distribute critical PPE to 32,000 high volumes of unemployment claim turnaround online delivery. employees at 750+ sites in 36 US records, as quickly as possible ➔ Enables customers to be more effective states. ➔ Store physical records offsite until they by sharing information with those who ➔ A secure location to prep PPE kits need to be destroyed. need it while ensuring that information without taking up valuable space security and privacy are maintained needed for patients at facilities. Our Solution: InSight Essential. Receive and scan claim exceptions and serve up the images on Our Solution: Secure Business Storage & InSight application to over 800 named users. Store Logistics. Inbound and store pallets from the records until they need to be destroyed, then multiple suppliers, prepare PPE kits made up shred. of 12-15 items, and distribute to healthcare sites. Speaking to multiple US states about similar solutions for unemployment and Medicare claims. Also storing pallets for other medical and retail customers.
Q1 Performance 7 Strong financial execution • Revenue grew 3.2% Y/Y, ex FX, driven by Global Data Center, Global RIM, and revenue management • Adjusted EBITDA, ex FX, increased almost 14% Y/Y; margin expanded 320 bps • AFFO and Adjusted EPS grew 20% and 59% Y/Y, respectively Core storage business remains durable • Continue to benefit from deep and long-lasting customer relationships • Global organic storage revenue growth of 3.0% supported by strong revenue management contribution • Global organic volume flat Q/Q; Adjacent Businesses and Consumer growth of 8% and 5%, respectively Data Center leasing accelerated • 6.4 megawatts of new and expansion leases executed in Q1 as compared to full-year plan of 15-20 megawatts • Strong organic revenue growth of 9.9% • Continue to receive significant engagement and RFPs for both hyperscale, corporate and government requirements.
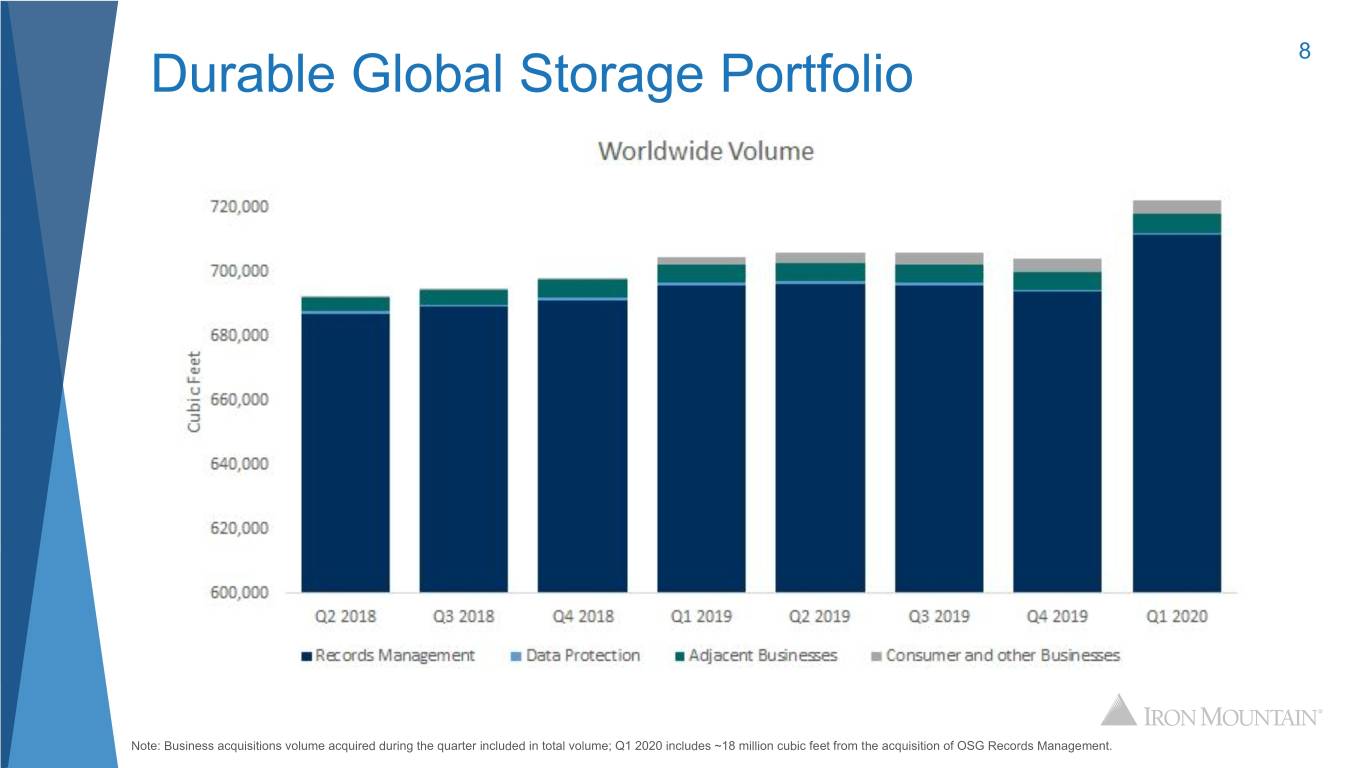
Durable Global Storage Portfolio 8 Note: Business acquisitions volume acquired during the quarter included in total volume; Q1 2020 includes ~18 million cubic feet from the acquisition of OSG Records Management.
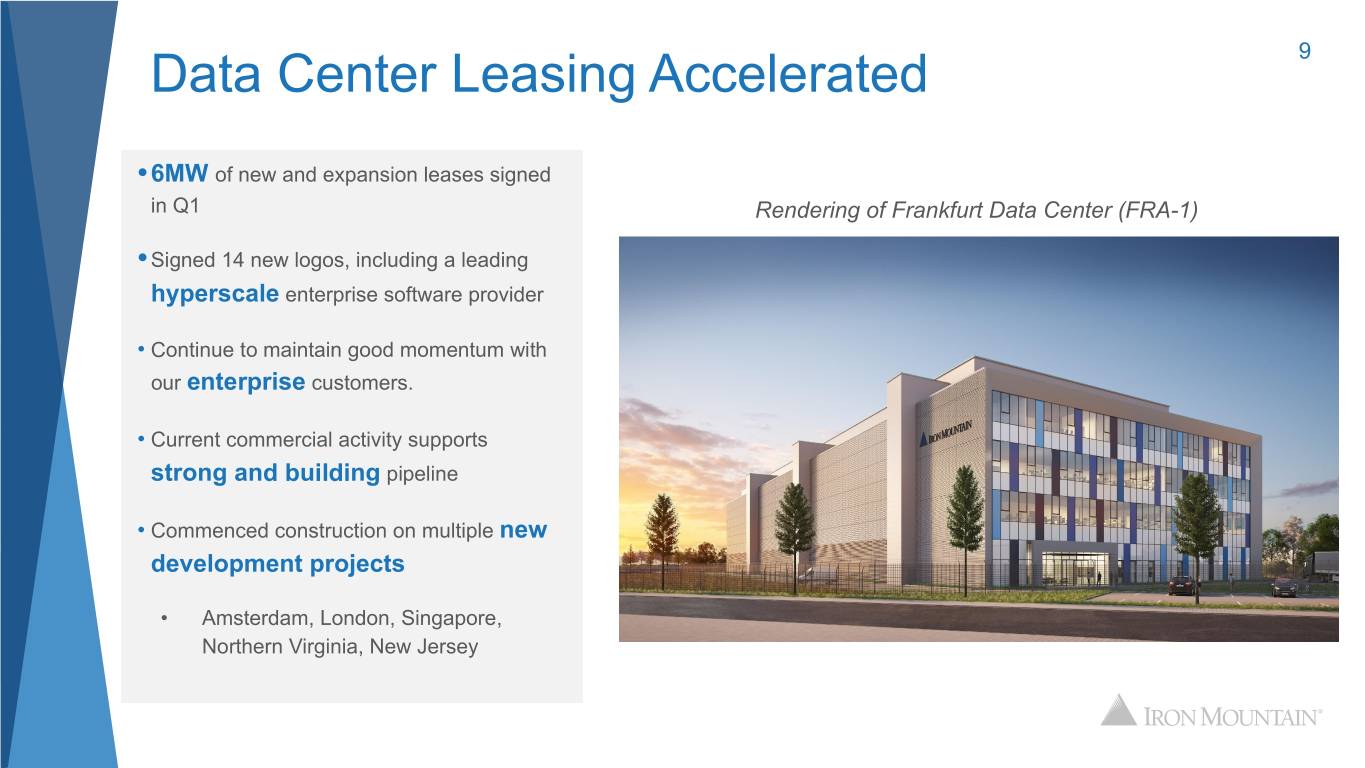
Data Center Leasing Accelerated 9 • 6MW of new and expansion leases signed in Q1 Rendering of Frankfurt Data Center (FRA-1) • Signed 14 new logos, including a leading hyperscale enterprise software provider • Continue to maintain good momentum with our enterprise customers. • Current commercial activity supports strong and building pipeline • Commenced construction on multiple new development projects • Amsterdam, London, Singapore, Northern Virginia, New Jersey
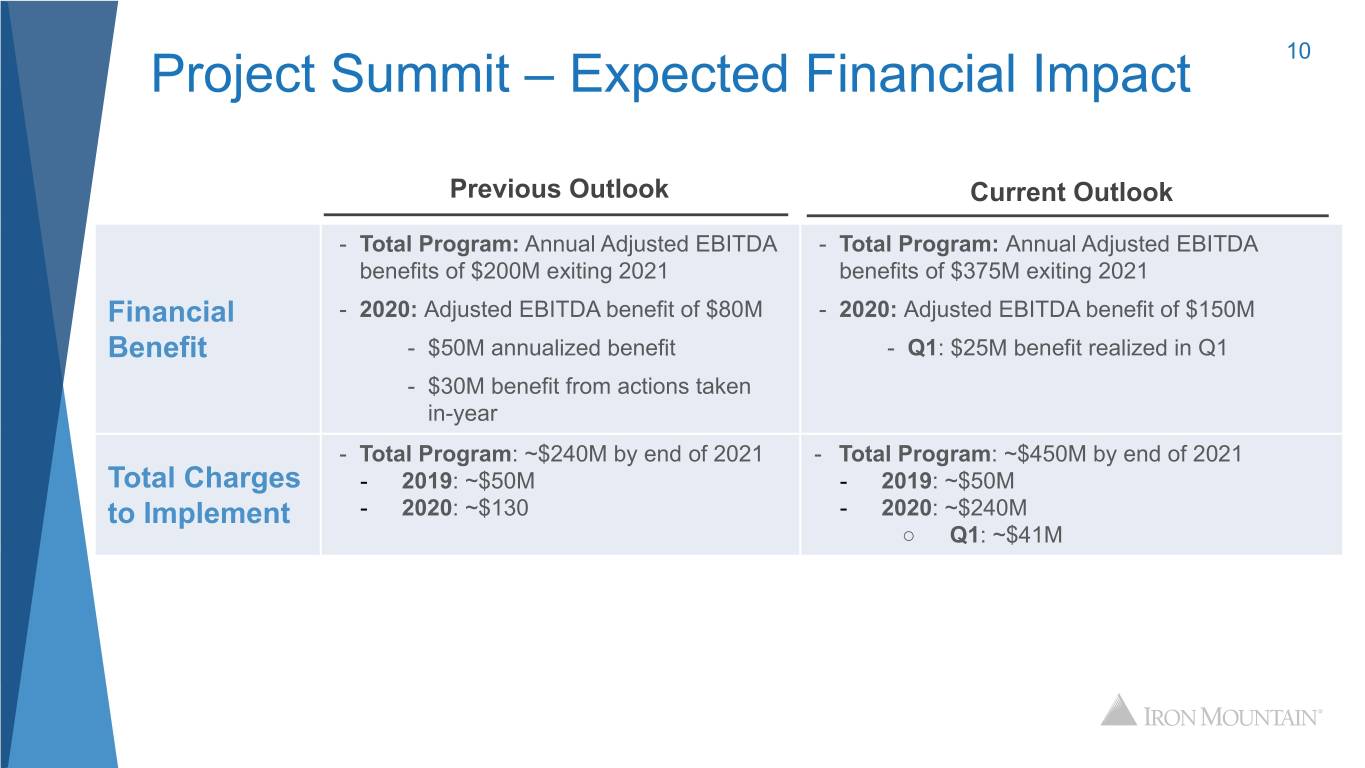
Project Summit – Expected Financial Impact 10 Previous Outlook Current Outlook - Total Program: Annual Adjusted EBITDA - Total Program: Annual Adjusted EBITDA benefits of $200M exiting 2021 benefits of $375M exiting 2021 Financial - 2020: Adjusted EBITDA benefit of $80M - 2020: Adjusted EBITDA benefit of $150M Benefit - $50M annualized benefit - Q1: $25M benefit realized in Q1 - $30M benefit from actions taken in-year - Total Program: ~$240M by end of 2021 - Total Program: ~$450M by end of 2021 Total Charges - 2019: ~$50M - 2019: ~$50M to Implement - 2020: ~$130 - 2020: ~$240M ○ Q1: ~$41M
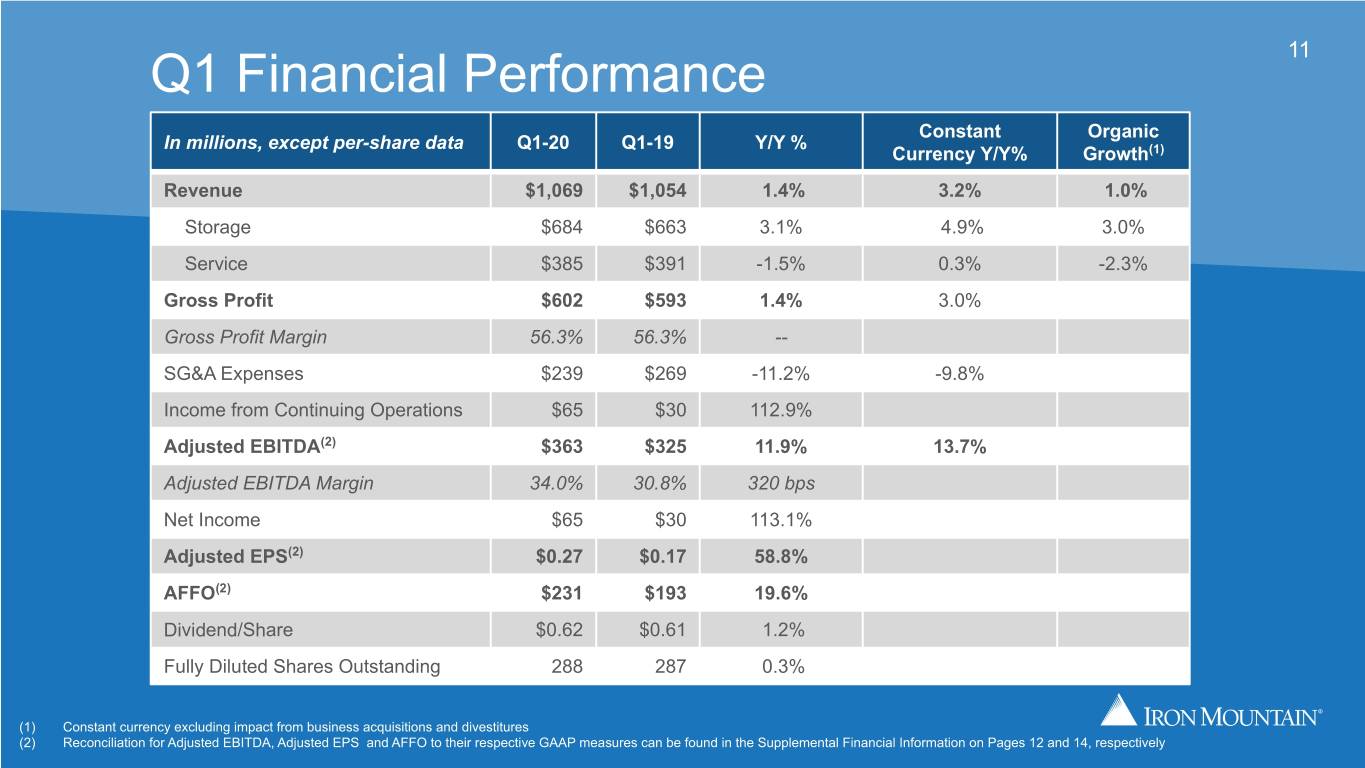
Q1 Financial Performance 11 Constant Organic In millions, except per-share data Q1-20 Q1-19 Y/Y % Currency Y/Y% Growth(1) Revenue $1,069 $1,054 1.4% 3.2% 1.0% Storage $684 $663 3.1% 4.9% 3.0% Service $385 $391 -1.5% 0.3% -2.3% Gross Profit $602 $593 1.4% 3.0% Gross Profit Margin 56.3% 56.3% -- SG&A Expenses $239 $269 -11.2% -9.8% Income from Continuing Operations $65 $30 112.9% Adjusted EBITDA(2) $363 $325 11.9% 13.7% Adjusted EBITDA Margin 34.0% 30.8% 320 bps Net Income $65 $30 113.1% Adjusted EPS(2) $0.27 $0.17 58.8% AFFO(2) $231 $193 19.6% Dividend/Share $0.62 $0.61 1.2% Fully Diluted Shares Outstanding 288 287 0.3% (1) Constant currency excluding impact from business acquisitions and divestitures (2) Reconciliation for Adjusted EBITDA, Adjusted EPS and AFFO to their respective GAAP measures can be found in the Supplemental Financial Information on Pages 12 and 14, respectively
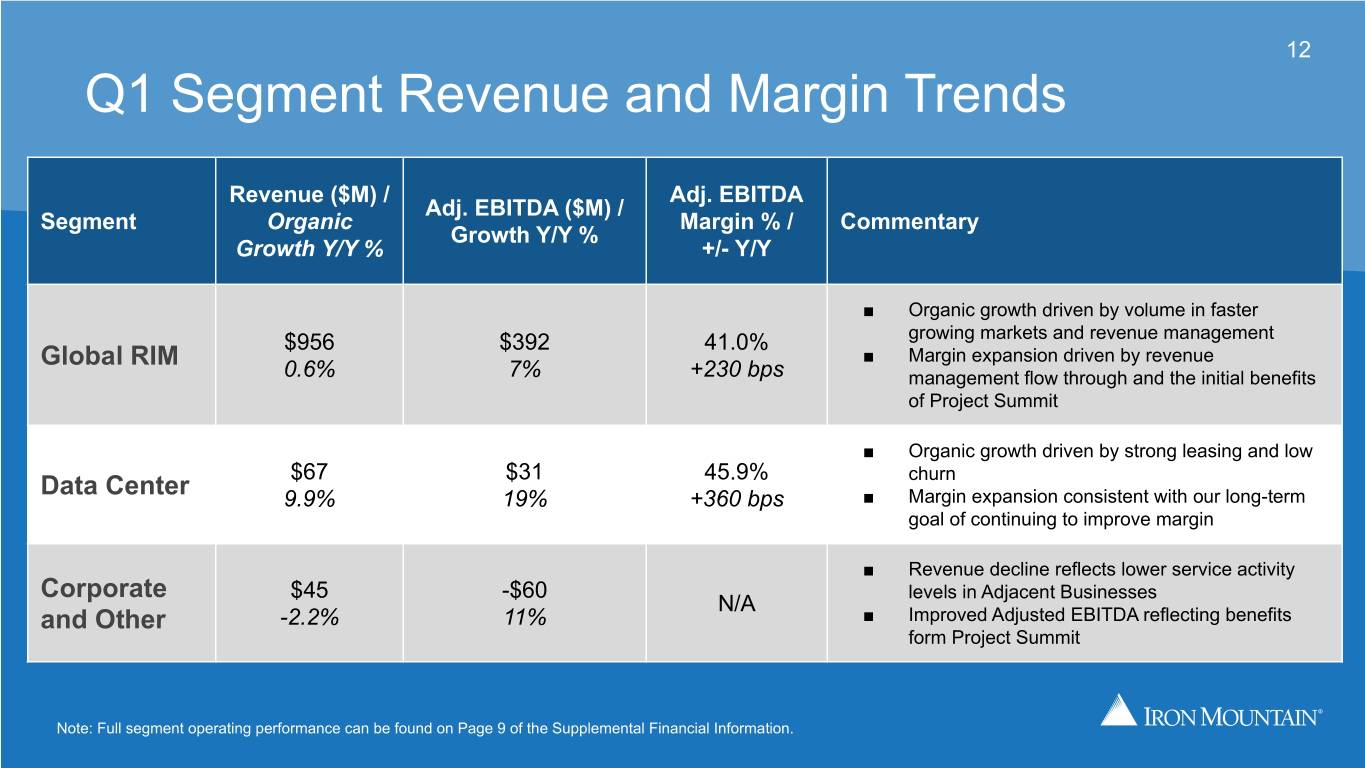
12 Q1 Segment Revenue and Margin Trends Revenue ($M) / Adj. EBITDA Adj. EBITDA ($M) / Segment Organic Margin % / Commentary Growth Y/Y % Growth Y/Y % +/- Y/Y ■ Organic growth driven by volume in faster $956 $392 41.0% growing markets and revenue management Global RIM ■ Margin expansion driven by revenue 0.6% 7% +230 bps management flow through and the initial benefits of Project Summit ■ Organic growth driven by strong leasing and low $67 $31 45.9% churn Data Center 9.9% 19% +360 bps ■ Margin expansion consistent with our long-term goal of continuing to improve margin ■ Revenue decline reflects lower service activity Corporate $45 -$60 levels in Adjacent Businesses N/A and Other -2.2% 11% ■ Improved Adjusted EBITDA reflecting benefits form Project Summit Note: Full segment operating performance can be found on Page 9 of the Supplemental Financial Information.
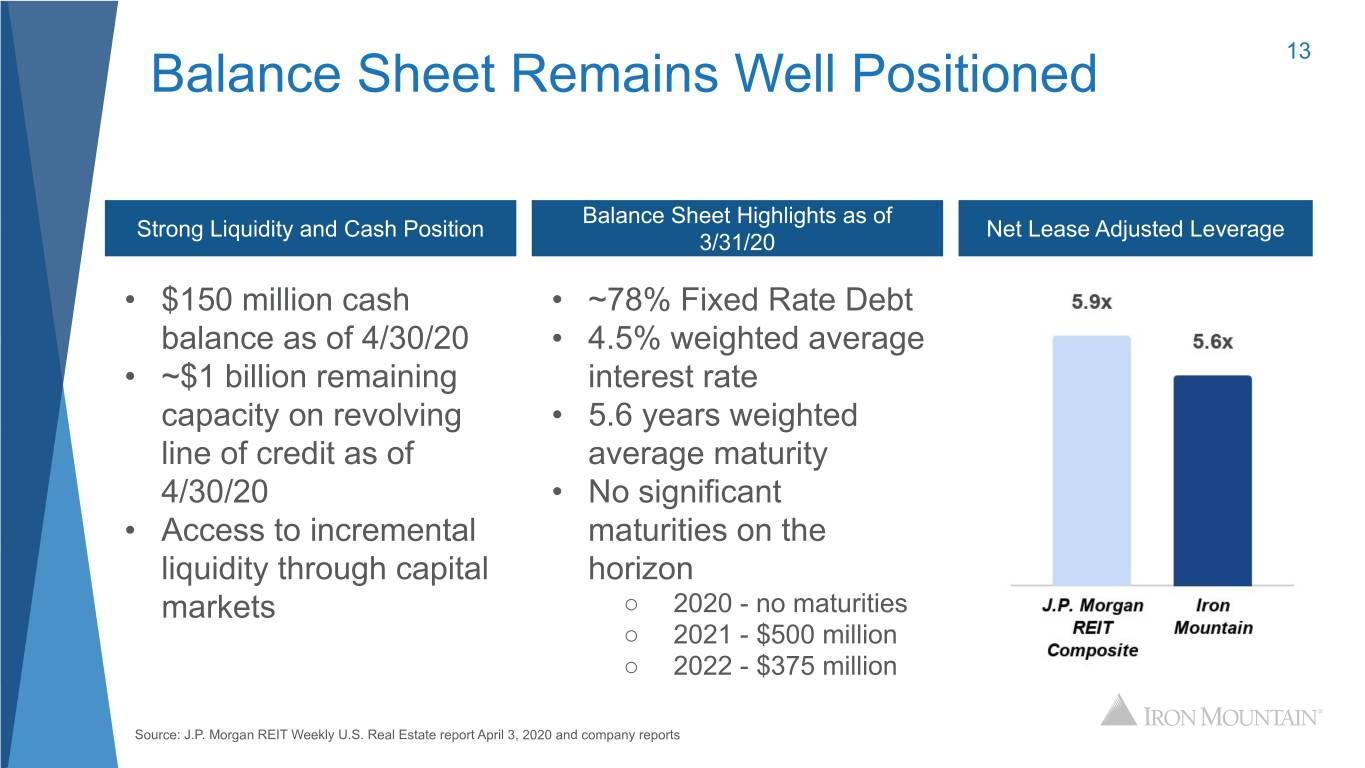
Balance Sheet Remains Well Positioned 13 Balance Sheet Highlights as of Strong Liquidity and Cash Position Net Lease Adjusted Leverage 3/31/20 • $150 million cash • ~78% Fixed Rate Debt balance as of 4/30/20 • 4.5% weighted average • ~$1 billion remaining interest rate capacity on revolving • 5.6 years weighted line of credit as of average maturity 4/30/20 • No significant • Access to incremental maturities on the liquidity through capital horizon markets ○ 2020 - no maturities ○ 2021 - $500 million ○ 2022 - $375 million Source: J.P. Morgan REIT Weekly U.S. Real Estate report April 3, 2020 and company reports
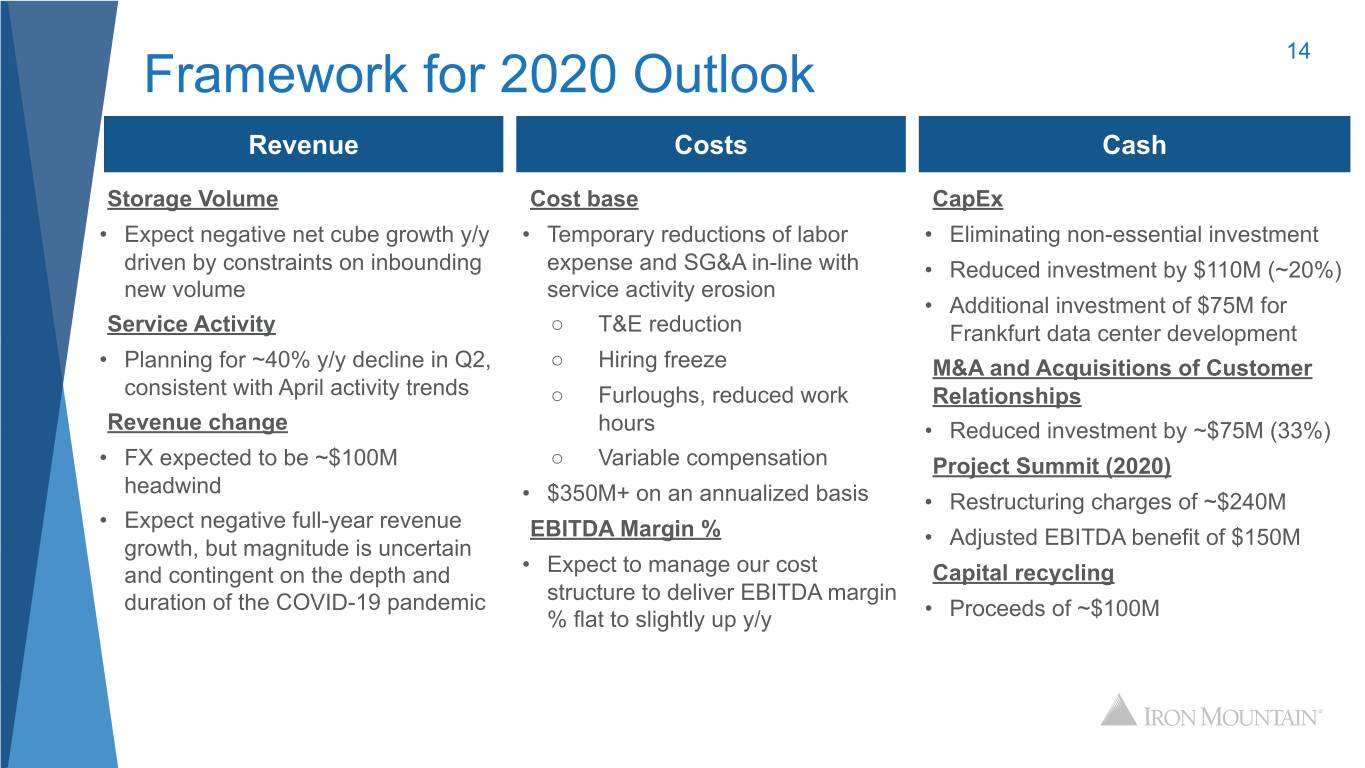
Framework for 2020 Outlook 14 Revenue Costs Cash Storage Volume Cost base CapEx • Expect negative net cube growth y/y • Temporary reductions of labor • Eliminating non-essential investment driven by constraints on inbounding expense and SG&A in-line with • Reduced investment by $110M (~20%) new volume service activity erosion • Additional investment of $75M for Service Activity ○ T&E reduction Frankfurt data center development • Planning for ~40% y/y decline in Q2, ○ Hiring freeze M&A and Acquisitions of Customer consistent with April activity trends ○ Furloughs, reduced work Relationships Revenue change hours • Reduced investment by ~$75M (33%) • FX expected to be ~$100M ○ Variable compensation Project Summit (2020) headwind • $350M+ on an annualized basis • Restructuring charges of ~$240M • Expect negative full-year revenue EBITDA Margin % growth, but magnitude is uncertain • Adjusted EBITDA benefit of $150M and contingent on the depth and • Expect to manage our cost Capital recycling duration of the COVID-19 pandemic structure to deliver EBITDA margin % flat to slightly up y/y • Proceeds of ~$100M
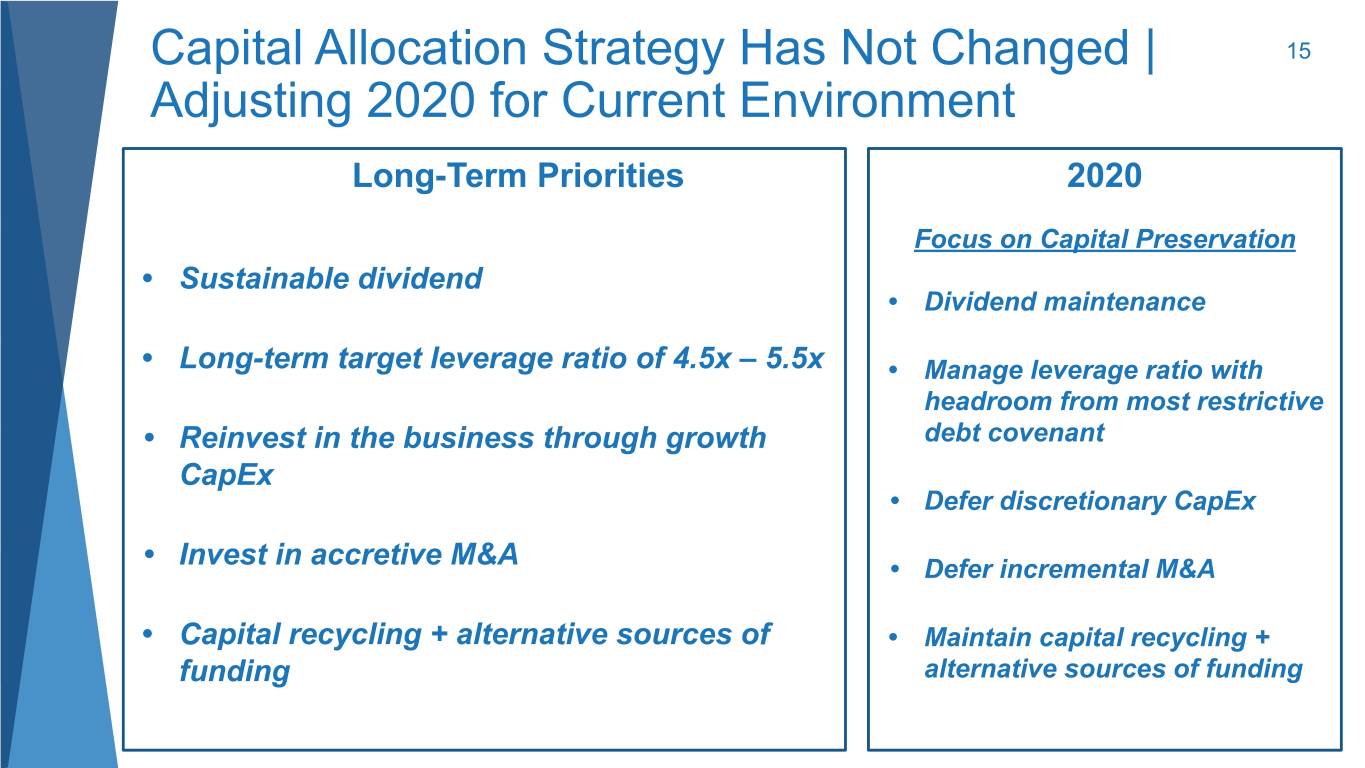
Capital Allocation Strategy Has Not Changed | 15 Adjusting 2020 for Current Environment Long-Term Priorities 2020 Focus on Capital Preservation • Sustainable dividend • Dividend maintenance • Long-term target leverage ratio of 4.5x – 5.5x • Manage leverage ratio with headroom from most restrictive • Reinvest in the business through growth debt covenant CapEx • Defer discretionary CapEx • Invest in accretive M&A • Defer incremental M&A • Capital recycling + alternative sources of • Maintain capital recycling + funding alternative sources of funding
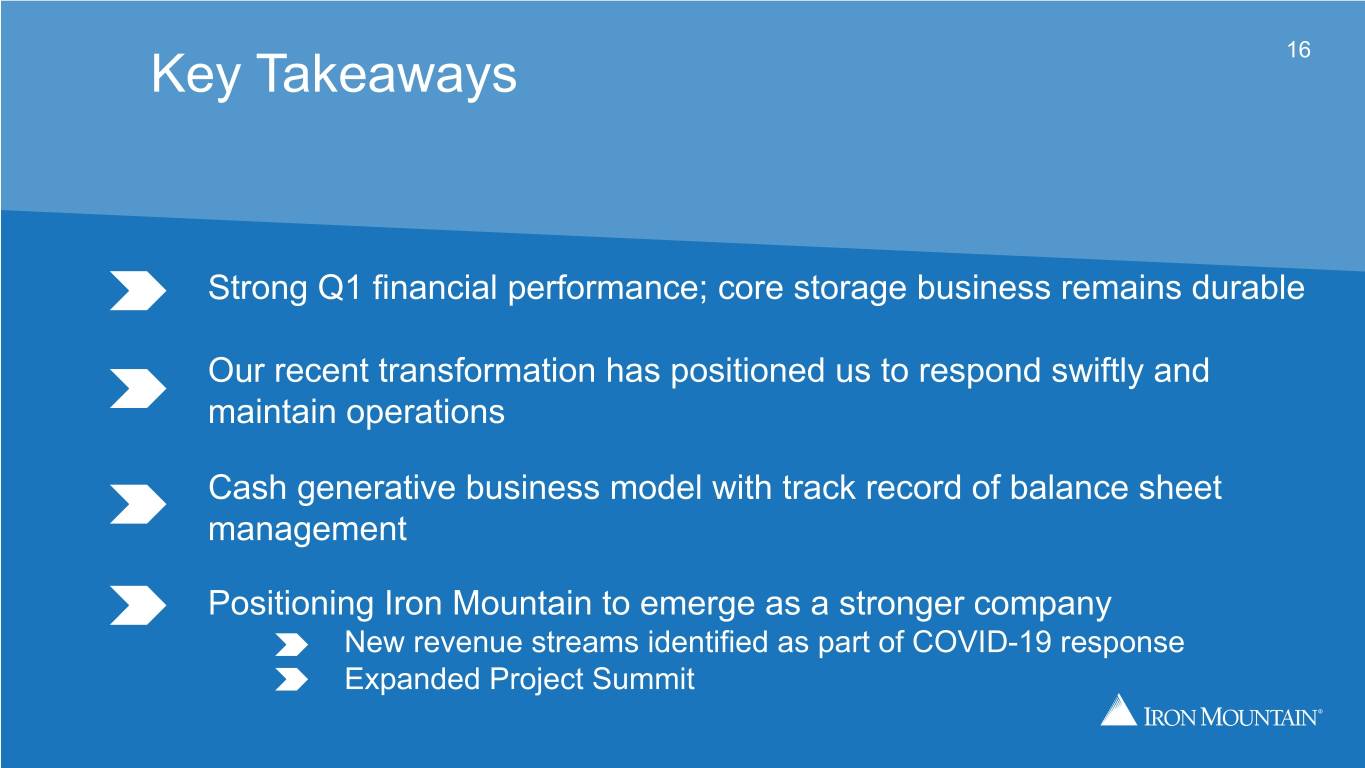
Key Takeaways 16 Strong Q1 financial performance; core storage business remains durable Our recent transformation has positioned us to respond swiftly and maintain operations Cash generative business model with track record of balance sheet management Positioning Iron Mountain to emerge as a stronger company New revenue streams identified as part of COVID-19 response Expanded Project Summit
