Attached files
| file | filename |
|---|---|
| EX-99.1 - EX-99.1 - BEACON ROOFING SUPPLY INC | becn-ex991_7.htm |
| 8-K - 8-K - 2020-Q2 EARNINGS RELEASE - BEACON ROOFING SUPPLY INC | becn-8k_20200507.htm |

May 7, 2020 2020 2nd quarter earnings call Exhibit 99.2
Disclosure notice This presentation contains information about management's view of the Company's future expectations, plans and prospects that constitute forward-looking statements for purposes of the safe harbor provisions under the Private Securities Litigation Reform Act of 1995. Actual results may differ materially from those indicated by such forward-looking statements as a result of various important factors, including, but not limited to, the impact of the COVID‑19 pandemic on the construction sector, in general, and the financial position and operating results of our Company, in particular, which cannot be predicted and could change rapidly, and those set forth in the "Risk Factors" section of the Company's latest Form 10-K. In addition, the forward-looking statements included in this presentation represent the Company's views as of the date of this presentation and these views could change. However, while the Company may elect to update these forward-looking statements at some point, the Company specifically disclaims any obligation to do so, other than as required by federal securities laws. These forward-looking statements should not be relied upon as representing the Company's views as of any date subsequent to the date of this presentation. This presentation contains references to certain financial measures that are not presented in accordance with United States Generally Accepted Accounting Principles (“GAAP"). The Company uses non-GAAP financial measures to evaluate financial performance, analyze underlying business trends and establish operational goals and forecasts that are used when allocating resources. The Company believes these non-GAAP financial measures permit investors to better understand changes over comparative periods by providing financial results that are unaffected by certain items that are not indicative of ongoing operating performance. While the Company believes these measures are useful to investors when evaluating performance, they are not prepared and presented in accordance with GAAP, and therefore should be considered supplemental in nature. The Company’s non-GAAP financial measures should not be considered in isolation or as a substitute for other financial performance measures presented in accordance with GAAP. These non-GAAP financial measures may have material limitations including, but not limited to, the exclusion of certain costs without a corresponding reduction of net income for the income generated by the assets to which the excluded costs are related. In addition, these non-GAAP financial measures may differ from similarly titled measures presented by other companies. A reconciliation of these non-GAAP financial measures to their most directly comparable GAAP financial measure can be found in the Appendix as well as Company’s latest Form 8-K, filed with the SEC on May 7, 2020.

Q2 Results, Strategic Review & COVID-19 Update Julian Francis, President & CEO Cost Actions and Financial Position Joe Nowicki, Executive Vice President & CFO Introduction to Beacon Analysts and Investors Frank Lonegro, Executive Vice President Q&A conference call agenda
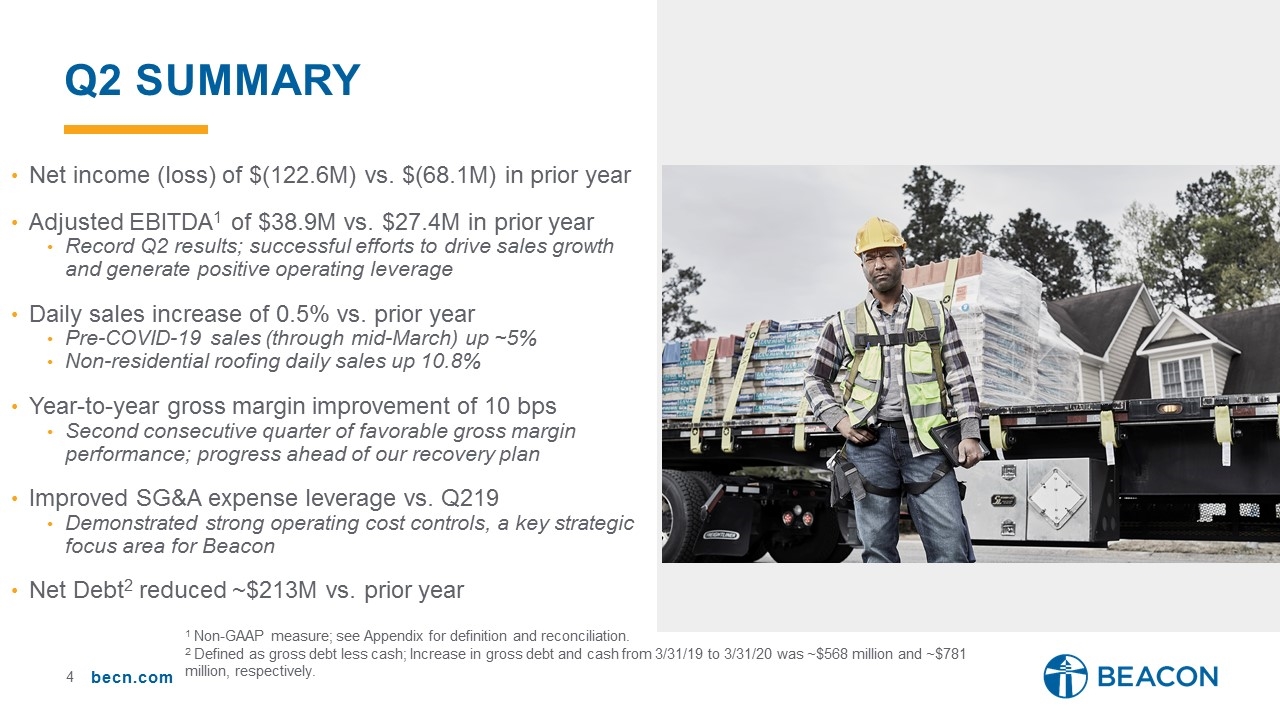
Net income (loss) of $(122.6M) vs. $(68.1M) in prior year Adjusted EBITDA1 of $38.9M vs. $27.4M in prior year Record Q2 results; successful efforts to drive sales growth and generate positive operating leverage Daily sales increase of 0.5% vs. prior year Pre-COVID-19 sales (through mid-March) up ~5% Non-residential roofing daily sales up 10.8% Year-to-year gross margin improvement of 10 bps Second consecutive quarter of favorable gross margin performance; progress ahead of our recovery plan Improved SG&A expense leverage vs. Q219 Demonstrated strong operating cost controls, a key strategic focus area for Beacon Net Debt2 reduced ~$213M vs. prior year Q2 SUMMARY 1 Non-GAAP measure; see Appendix for definition and reconciliation. 2 Defined as gross debt less cash; Increase in gross debt and cash from 3/31/19 to 3/31/20 was ~$568 million and ~$781 million, respectively.
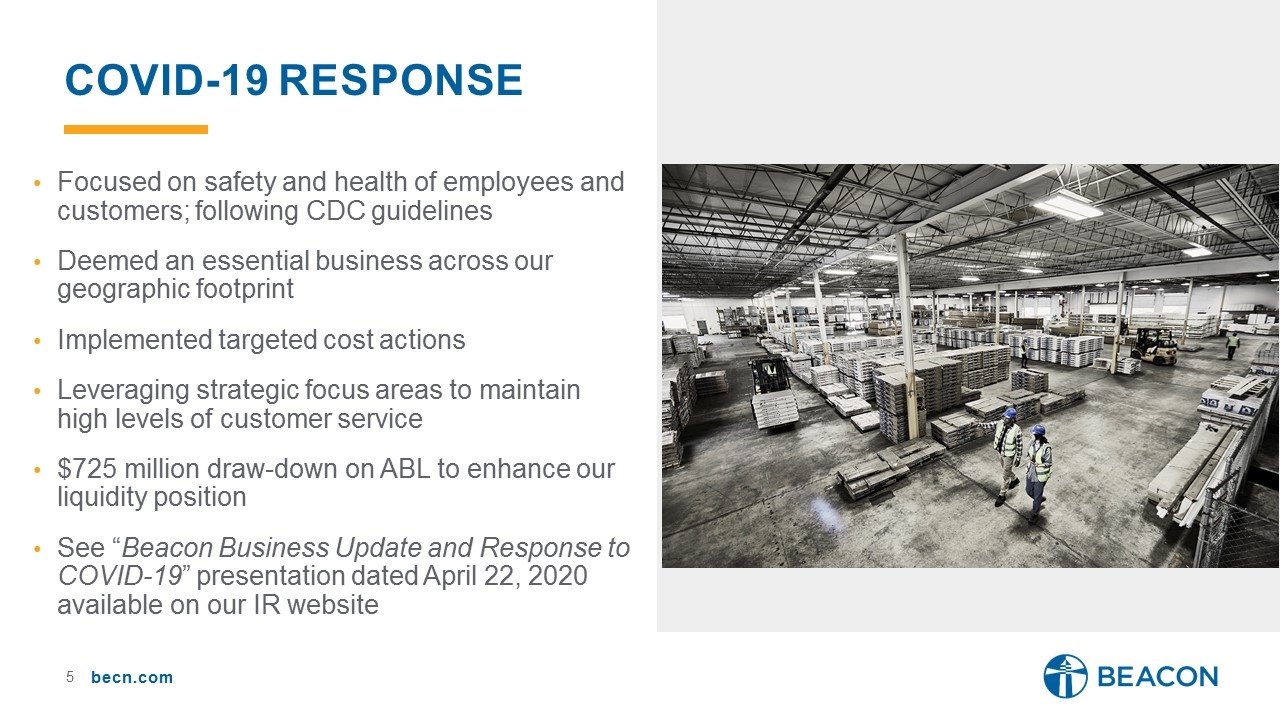
Focused on safety and health of employees and customers; following CDC guidelines Deemed an essential business across our geographic footprint Implemented targeted cost actions Leveraging strategic focus areas to maintain high levels of customer service $725 million draw-down on ABL to enhance our liquidity position See “Beacon Business Update and Response to COVID-19” presentation dated April 22, 2020 available on our IR website COVID-19 response
Pivot Focus to Organic Growth Sales force seeing revenue benefits from increased selling activity Positive Q2 sales growth; mid-single digit increase pre-COVID-19 Enhance Branch Operating Performance Beginning to see improvement at bottom-quintile branches Operationalize Market Model - Beacon OTC Network OTC network expected to produce higher service levels, operating cost efficiencies and cash flow benefits Q2 experienced mid- to high-single digit gains in delivery efficiency Denver hub brought online during quarter OTC network now includes 40+ markets and 200+ branches Expand Industry-Leading Digital Platform Beacon PRO+ suite supporting contractors’ social distancing Q2 sales growth of 50% vs. prior year strategic initiatives
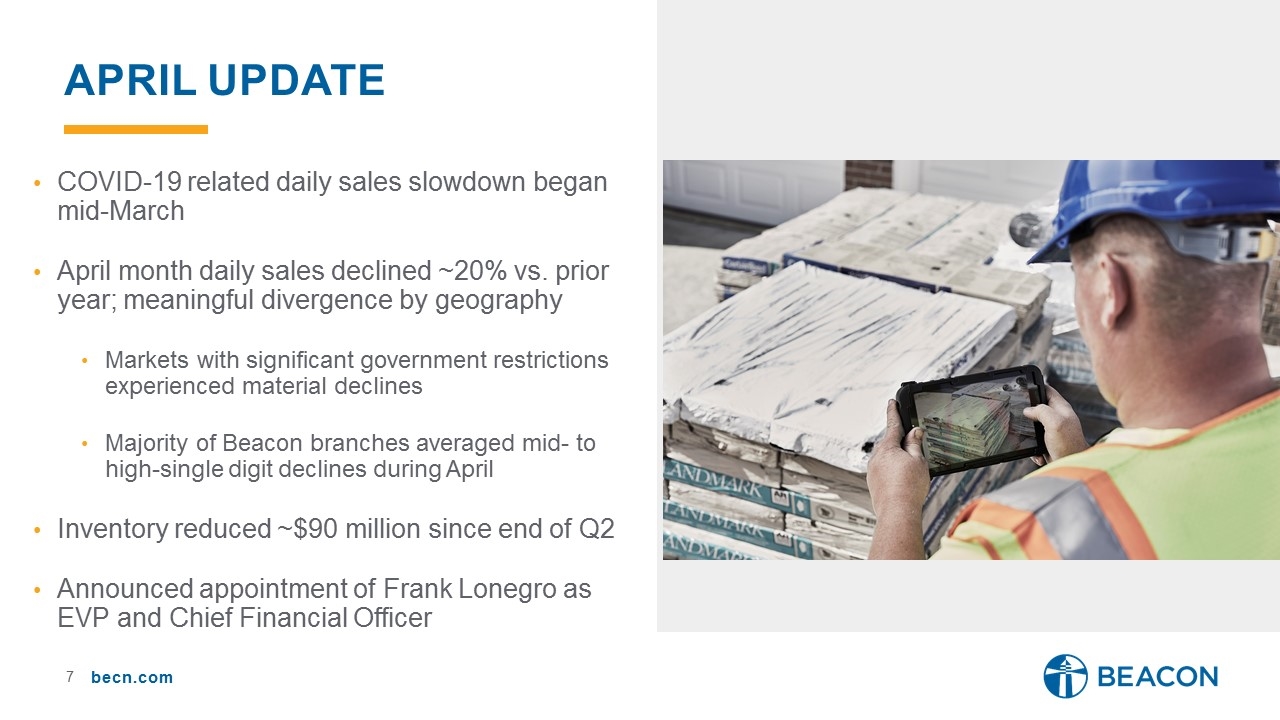
COVID-19 related daily sales slowdown began mid-March April month daily sales declined ~20% vs. prior year; meaningful divergence by geography Markets with significant government restrictions experienced material declines Majority of Beacon branches averaged mid- to high-single digit declines during April Inventory reduced ~$90 million since end of Q2 Announced appointment of Frank Lonegro as EVP and Chief Financial Officer APRIL update
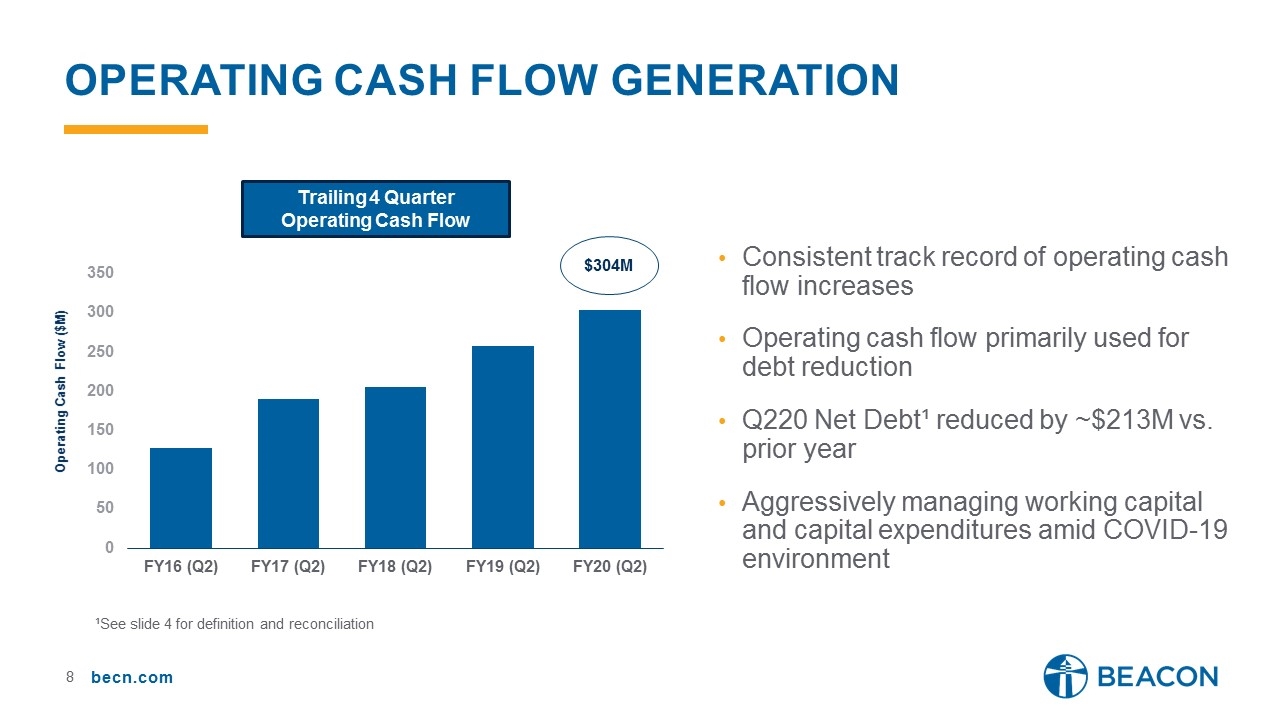
Operating Cash flow generation Operating Cash Flow ($M) Trailing 4 Quarter Operating Cash Flow Consistent track record of operating cash flow increases Operating cash flow primarily used for debt reduction Q220 Net Debt¹ reduced by ~$213M vs. prior year Aggressively managing working capital and capital expenditures amid COVID-19 environment $304M ¹See slide 4 for definition and reconciliation

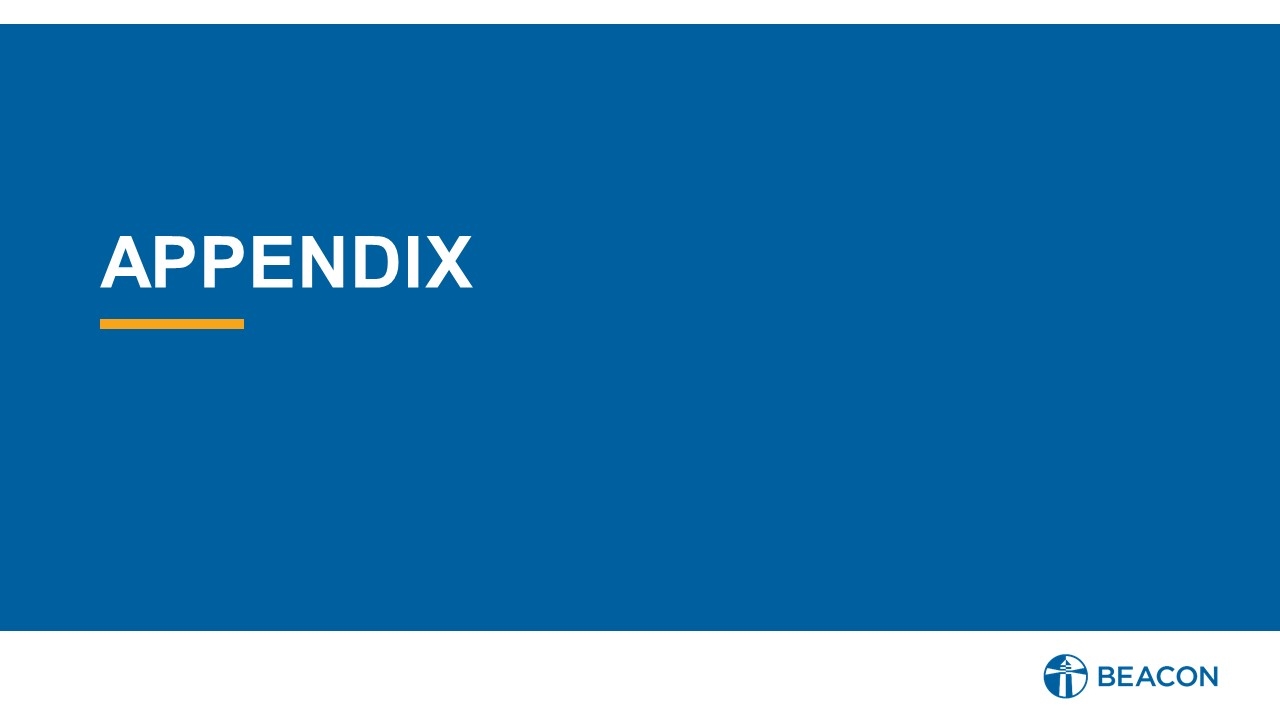
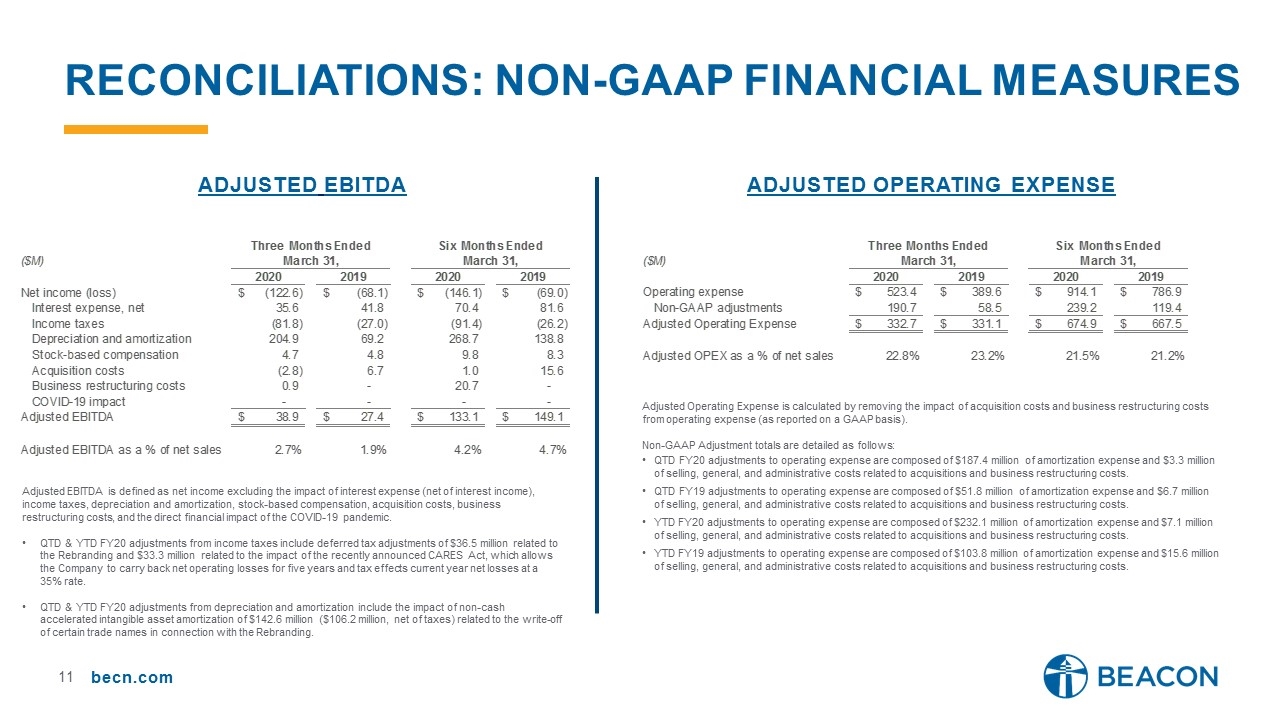
Reconciliations: non-gaap financial measures Adjusted EBITDA Adjusted Operating Expense Adjusted EBITDA is defined as net income excluding the impact of interest expense (net of interest income), income taxes, depreciation and amortization, stock-based compensation, acquisition costs, business restructuring costs, and the direct financial impact of the COVID-19 pandemic. QTD & YTD FY20 adjustments from income taxes include deferred tax adjustments of $36.5 million related to the Rebranding and $33.3 million related to the impact of the recently announced CARES Act, which allows the Company to carry back net operating losses for five years and tax effects current year net losses at a 35% rate. QTD & YTD FY20 adjustments from depreciation and amortization include the impact of non-cash accelerated intangible asset amortization of $142.6 million ($106.2 million, net of taxes) related to the write-off of certain trade names in connection with the Rebranding. Adjusted Operating Expense is calculated by removing the impact of acquisition costs and business restructuring costs from operating expense (as reported on a GAAP basis). Non-GAAP Adjustment totals are detailed as follows: QTD FY20 adjustments to operating expense are composed of $187.4 million of amortization expense and $3.3 million of selling, general, and administrative costs related to acquisitions and business restructuring costs. QTD FY19 adjustments to operating expense are composed of $51.8 million of amortization expense and $6.7 million of selling, general, and administrative costs related to acquisitions and business restructuring costs. YTD FY20 adjustments to operating expense are composed of $232.1 million of amortization expense and $7.1 million of selling, general, and administrative costs related to acquisitions and business restructuring costs. YTD FY19 adjustments to operating expense are composed of $103.8 million of amortization expense and $15.6 million of selling, general, and administrative costs related to acquisitions and business restructuring costs.
