Attached files
| file | filename |
|---|---|
| EX-99.1 - EXHIBIT 99.1 - Veritiv Corp | tm2018677d1_ex99-1.htm |
| 8-K - FORM 8-K - Veritiv Corp | tm2018677-1_8k.htm |
Exhibit 99.2

First Quarter 2020 Financial Results May 6, 2020 Exhibit 99.2

Tom Morabito Director of Investor Relations 2
Safe Harbor Provision Certain statements contained in this presentation regarding Veritiv Corporation’s (the "Company") future operating results, performance, business plans, including prospects, guidance, any restructuring, statements related to the impact of COVID - 19 and any other statements not constituting historical fact are "forward - looking statements" subject to the safe harbor created by the Private Securities Litigation Reform Act of 1995 . Where possible, the words "believe," "expect," "anticipate," "continue," "intend," "should," "will," "would," "planned," "estimated," "potential," "goal," "outlook," "may," "predicts," "could," or the negative of such terms, or other comparable expressions, as they relate to the Company or its business, have been used to identify such forward - looking statements . All forward - looking statements reflect only the Company’s current beliefs and assumptions with respect to future operating results, performance, business plans, prospects, guidance and other matters, and are based on information currently available to the Company . Accordingly, the statements are subject to significant risks, uncertainties and contingencies, which could cause the Company’s actual operating results, performance, business plans, prospects or guidance to differ materially from those expressed in, or implied by, these statements . Factors that could cause actual results to differ materially from current expectations include risks and other factors described under "Risk Factors" in our Annual Report on Form 10 - K and elsewhere in the Company’s publicly available reports filed with the Securities and Exchange Commission ("SEC"), which contain a discussion of various factors that may affect the Company’s business or financial results . Such risks and other factors, which in some instances are beyond the Company’s control, include : the industry - wide decline in demand for paper and related products ; adverse impacts of the COVID - 19 pandemic ; increased competition from existing and non - traditional sources ; adverse developments in general business and economic conditions as well as conditions in the global capital and credit markets impacting our Company and our customers ; foreign currency fluctuations ; our ability to attract, train and retain highly qualified employees ; the effects of work stoppages, union negotiations and labor disputes ; the loss of any of our significant customers ; changes in business conditions in our international operations ; procurement and other risks in obtaining packaging, facility products and paper from our suppliers for resale to our customers ; changes in prices for raw materials ; increases in the cost of fuel and third - party freight and the availability of third - party freight providers ; changes in trade policies and regulations ; inclement weather, widespread outbreak of an illness or responses thereto, anti - terrorism measures and other disruptions to our supply chain, distribution system and operations ; our dependence on a variety of information technology and telecommunications systems and the Internet ; our reliance on third - party vendors for various services ; cyber - security risks ; costs to comply with laws, rules and regulations, including environmental, health and safety laws, and to satisfy any liability or obligation imposed under such laws ; regulatory changes and judicial rulings impacting our business ; adverse results from litigation, governmental investigations or audits, or tax - related proceedings or audits ; our ability to adequately protect our material intellectual property and other proprietary rights, or to defend successfully against intellectual property infringement claims by third parties ; our pension and health care costs and participation in multi - employer pension, health and welfare plans ; increasing interest rates ; our ability to generate sufficient cash to service our debt ; our ability to comply with the covenants contained in our debt agreements ; our ability to refinance or restructure our debt on reasonable terms and conditions as might be necessary from time to time ; changes in accounting standards and methodologies ; uncertainties as to the structure, timing, benefits and costs of any restructuring and whether it will be completed at all and other events of which we are presently unaware or that we currently deem immaterial that may result in unexpected adverse operating results . The Company is not responsible for updating the information contained in this presentation beyond the published date, or for changes made to this document by wire services or Internet service providers . This presentation is being furnished to the SEC through a Form 8 - K . The Company’s Quarterly Report on Form 10 - Q for the three months ended March 31 , 2020 to be filed with the SEC may contain updates to the information included in this presentation . We reference non - GAAP financial measures in this presentation . Please see the appendix for reconciliations of non - GAAP measures to the most comparable United States ("U . S . ") GAAP measures . 3

Mary Laschinger Chairman & CEO 4
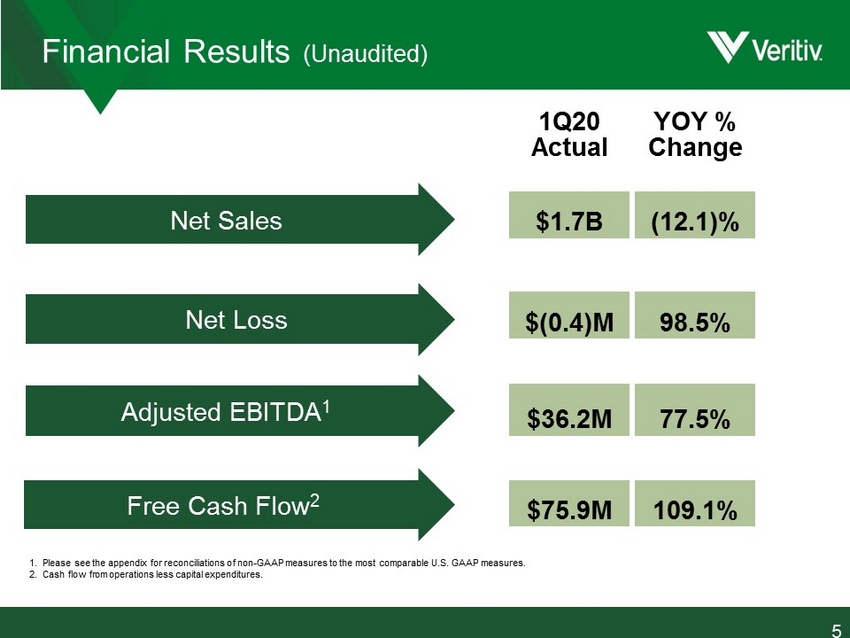
Financial Results (Unaudited) 1. Please see the appendix for reconciliations of non - GAAP measures to the most comparable U.S. GAAP measures. 2. Cash flow from operations less capital expenditures. Net Sales 5 Adjusted EBITDA 1 Net Loss Free Cash Flow 2 1Q20 Actual YOY % Change $1.7B (12.1)% $(0.4)M 98.5% $36.2M 77.5% $75.9M 109.1%

Sal Abbate Chief Operating Officer 6
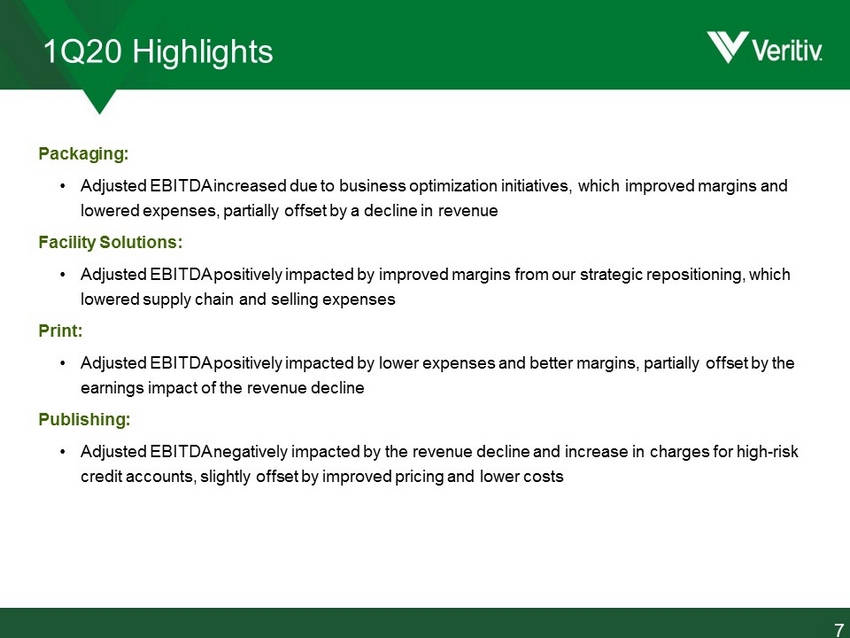
Packaging: • Adjusted EBITDA increased due to business optimization initiatives, which improved margins and lowered expenses, partially offset by a decline in revenue Facility Solutions: • Adjusted EBITDA positively impacted by improved margins from our strategic repositioning, which lowered supply chain and selling expenses Print: • Adjusted EBITDA positively impacted by lower expenses and better margins, partially offset by the earnings impact of the revenue decline Publishing: • Adjusted EBITDA negatively impacted by the revenue decline and increase in charges for high - risk credit accounts, slightly offset by improved pricing and lower costs 7 1Q20 Highlights

Mary Laschinger Chairman & CEO 8
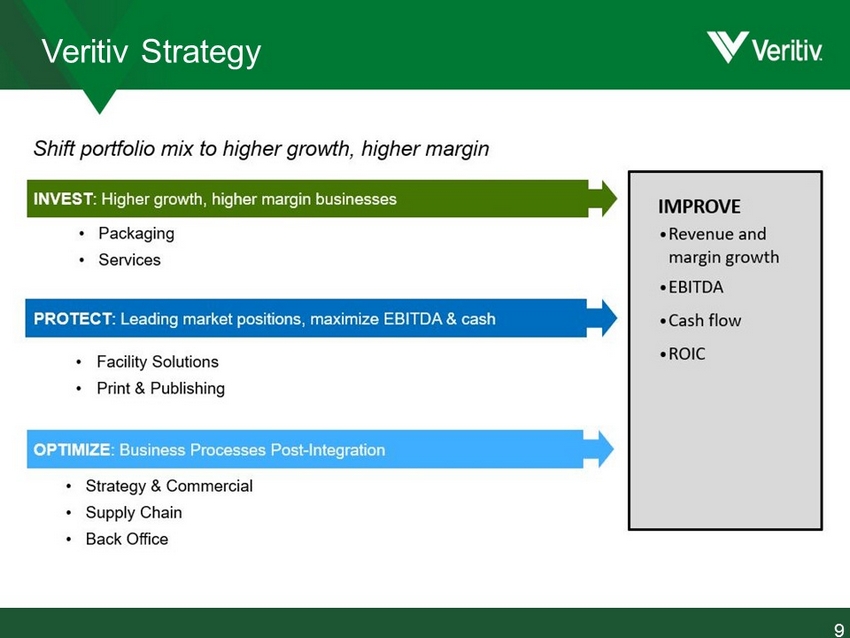
9 Veritiv Strategy
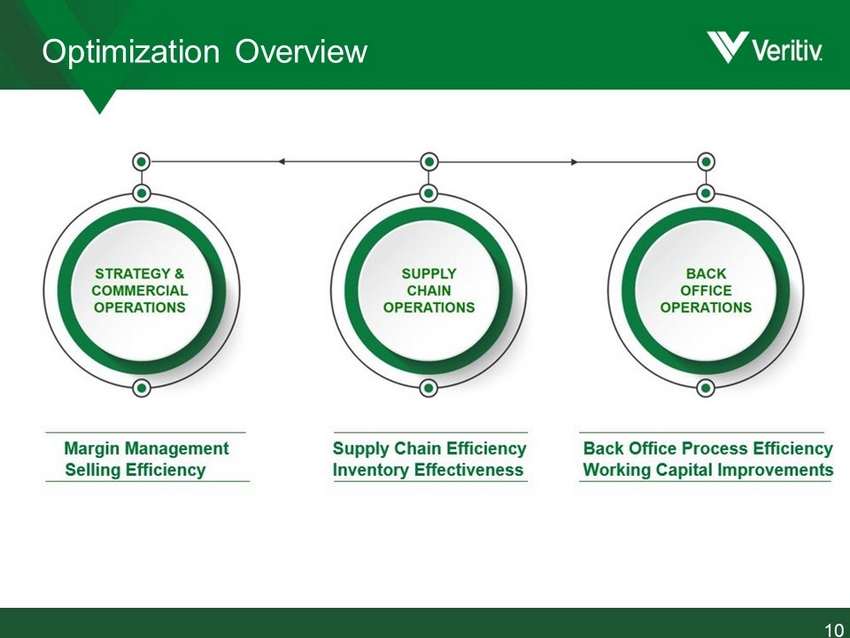
10 Optimization Overview
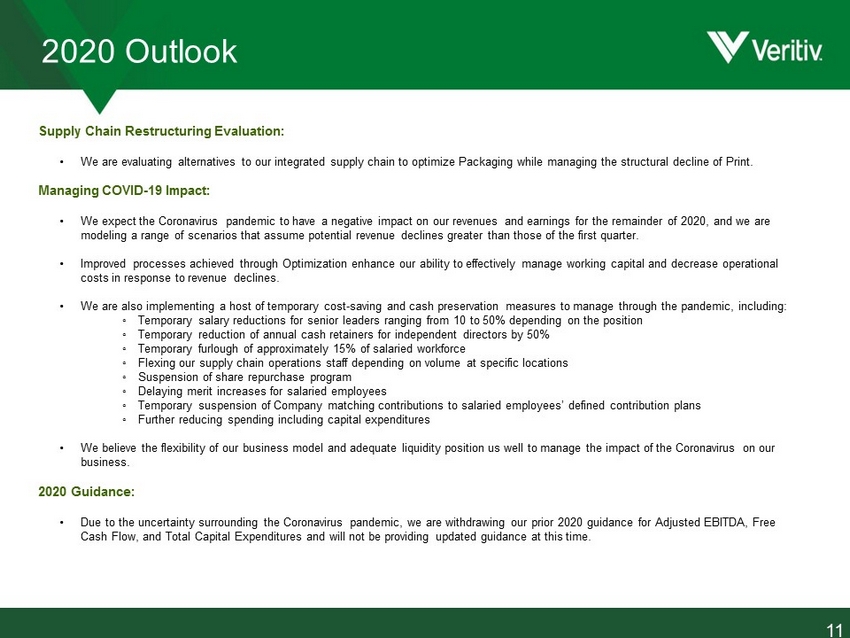
Supply Chain Restructuring Evaluation: • We are evaluating alternatives to our integrated supply chain to optimize Packaging while managing the structural decline of Pri nt. Managing COVID - 19 Impact: • We expect the Coronavirus pandemic to have a negative impact on our revenues and earnings for the remainder of 2020, and we a re modeling a range of scenarios that assume potential revenue declines greater than those of the first quarter. • Improved processes achieved through Optimization enhance our ability to effectively manage working capital and decrease opera tio nal costs in response to revenue declines. • We are also implementing a host of temporary cost - saving and cash preservation measures to manage through the pandemic, includin g: ◦ Temporary salary reductions for senior leaders ranging from 10 to 50% depending on the position ◦ Temporary reduction of annual cash retainers for independent directors by 50% ◦ Temporary furlough of approximately 15% of salaried workforce ◦ Flexing our supply chain operations staff depending on volume at specific locations ◦ Suspension of share repurchase program ◦ Delaying merit increases for salaried employees ◦ Temporary suspension of Company matching contributions to salaried employees’ defined contribution plans ◦ Further reducing spending including capital expenditures • We believe the flexibility of our business model and adequate liquidity position us well to manage the impact of the Coronavi rus on our business. 2020 Guidance: • Due to the uncertainty surrounding the Coronavirus pandemic, we are withdrawing our prior 2020 guidance for Adjusted EBITDA, Fre e Cash Flow, and Total Capital Expenditures and will not be providing updated guidance at this time. 11 2020 Outlook

Steve Smith Chief Financial Officer 12
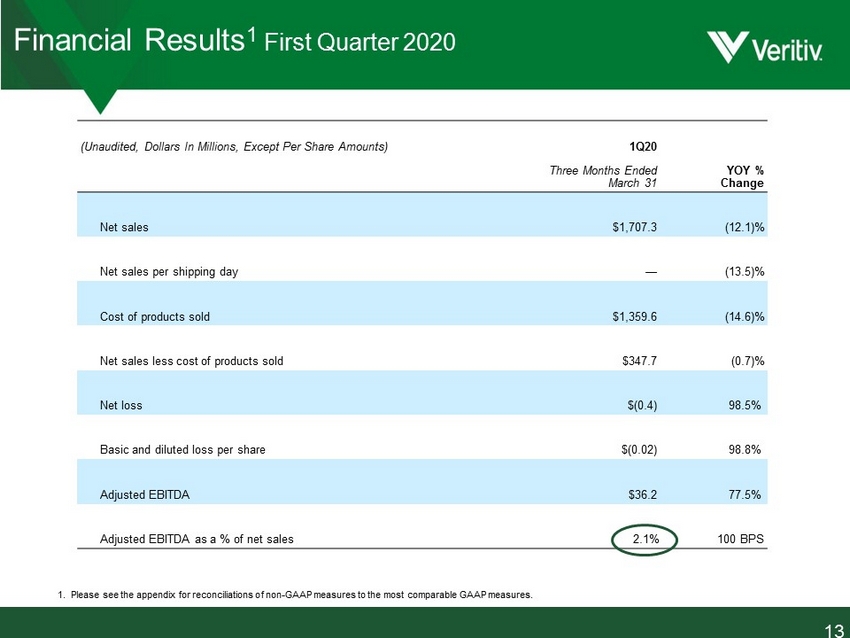
(Unaudited, Dollars In Millions, Except Per Share Amounts) 1Q20 YOY % Change Three Months Ended March 31 Net sales $1,707.3 (12.1 )% Net sales per shipping day — (13.5 )% Cost of products sold $1,359.6 (14.6 )% Net sales less cost of products sold $347.7 (0.7 )% Net loss $(0.4) 98.5 % Basic and diluted loss per share $(0.02) 98.8 % Adjusted EBITDA $36.2 77.5 % Adjusted EBITDA as a % of net sales 2.1 % 100 BPS 1. Please see the appendix for reconciliations of non - GAAP measures to the most comparable GAAP measures. Financial Results 1 First Quarter 2020 13
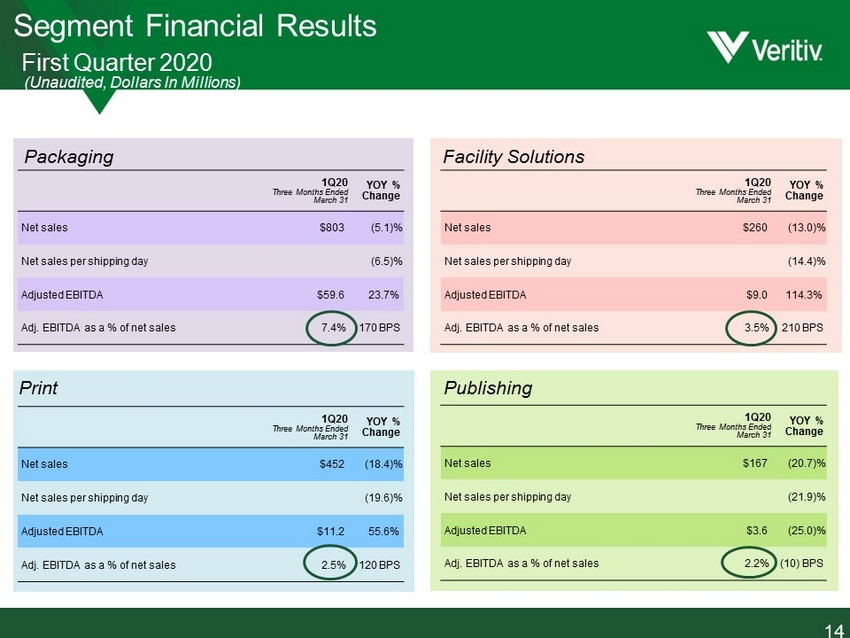
Segment Financial Results First Quarter 2020 14 Facility Solutions Publishing Print 1Q20 Three Months Ended March 31 YOY % Change Net sales $167 (20.7 )% Net sales per shipping day (21.9 )% Adjusted EBITDA $3.6 (25.0 )% Adj. EBITDA as a % of net sales 2.2 % (10) BPS 1Q20 Three Months Ended March 31 YOY % Change Net sales $803 (5.1 )% Net sales per shipping day (6.5 )% Adjusted EBITDA $59.6 23.7 % Adj. EBITDA as a % of net sales 7.4 % 170 BPS 1Q20 Three Months Ended March 31 YOY % Change Net sales $260 (13.0 )% Net sales per shipping day (14.4 )% Adjusted EBITDA $9.0 114.3 % Adj. EBITDA as a % of net sales 3.5 % 210 BPS 1Q20 Three Months Ended March 31 YOY % Change Net sales $452 (18.4 )% Net sales per shipping day (19.6 )% Adjusted EBITDA $11.2 55.6 % Adj. EBITDA as a % of net sales 2.5 % 120 BPS Packaging (Unaudited, Dollars In Millions)
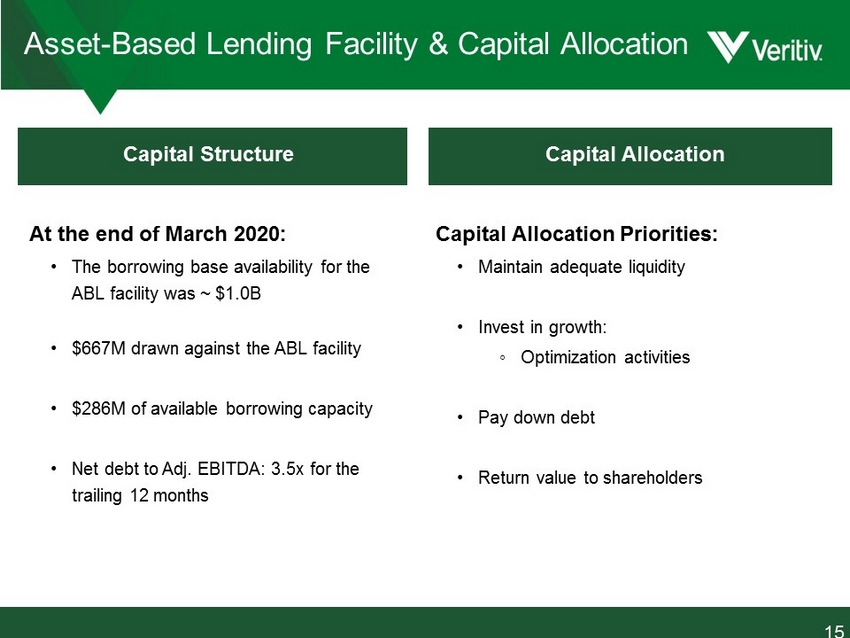
Capital Structure Capital Allocation Capital Allocation Priorities: • Maintain adequate liquidity • Invest in growth: ◦ Optimization activities • Pay down debt • Return value to shareholders At the end of March 2020: • The borrowing base availability for the ABL facility was ~ $1.0B • $667M drawn against the ABL facility • $286M of available borrowing capacity • Net debt to Adj. EBITDA: 3.5x for the trailing 12 months 15 Asset - Based Lending Facility & Capital Allocation

Questions 16

Mary Laschinger Chairman & CEO 17
Appendix: Reconciliation of Non - GAAP Financial Measures We supplement our financial information prepared in accordance with U . S . GAAP with certain non - GAAP measures including Adjusted EBITDA (earnings before interest, income taxes, depreciation and amortization, restructuring charges, net, integration and acquisition expenses and other similar charges including any severance costs, costs associated with warehouse and office openings or closings, consolidation, and relocation and other business optimization expenses, stock - based compensation expense, changes in the LIFO reserve, non - restructuring asset impairment charges, non - restructuring severance charges, non - restructuring pension charges, net, fair value adjustments related to contingent liabilities assumed in mergers and acquisitions and certain other adjustments) because we believe investors commonly use Adjusted EBITDA and these other non - GAAP measures as key financial metrics for valuing companies . In addition, the credit agreement governing our asset - based lending facility permits us to exclude the foregoing and other charges in calculating "Consolidated EBITDA", as defined in the facility . We approximate foreign currency effects by applying the foreign currency exchange rate for the prior period to the local currency results for the current period . Adjusted EBITDA and these other non - GAAP measures are not alternative measures of financial performance under U . S . GAAP . Non - GAAP measures do not have definitions under U . S . GAAP and may be defined differently by, and not be comparable to, similarly titled measures used by other companies . As a result, we consider and evaluate non - GAAP measures in connection with a review of the most directly comparable measure calculated in accordance with U . S . GAAP . We caution investors not to place undue reliance on such non - GAAP measures and to consider them with the most directly comparable U . S . GAAP measures . Adjusted EBITDA and these other non - GAAP measures have limitations as analytical tools and should not be considered in isolation or as a substitute for analyzing our results as reported under U . S . GAAP . Please see the following tables for reconciliations of non - GAAP measures to the most comparable U . S . GAAP measures . 18
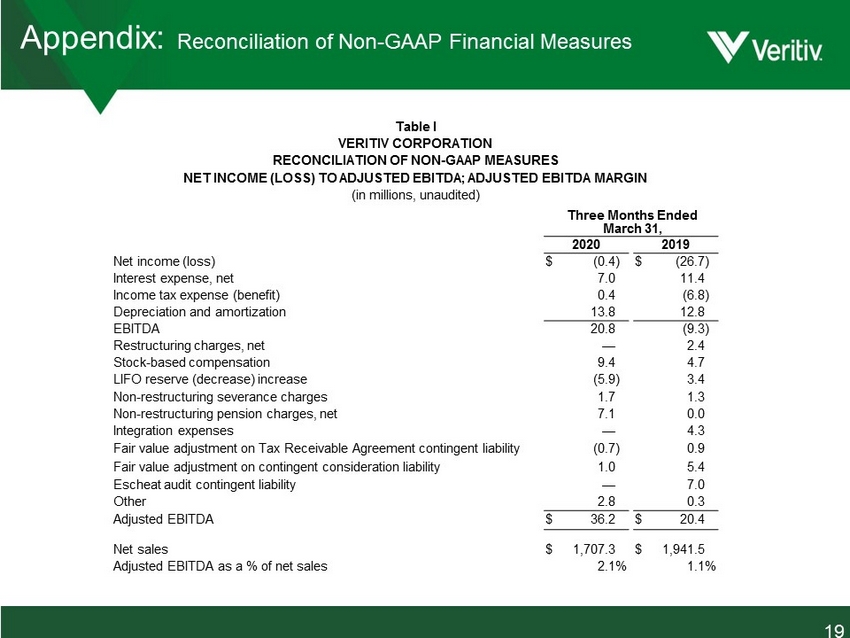
Table I VERITIV CORPORATION RECONCILIATION OF NON - GAAP MEASURES NET INCOME (LOSS) TO ADJUSTED EBITDA; ADJUSTED EBITDA MARGIN (in millions, unaudited) Three Months Ended March 31, 2020 2019 Net income (loss) $ (0.4 ) $ (26.7 ) Interest expense, net 7.0 11.4 Income tax expense (benefit) 0.4 (6.8 ) Depreciation and amortization 13.8 12.8 EBITDA 20.8 (9.3 ) Restructuring charges, net — 2.4 Stock - based compensation 9.4 4.7 LIFO reserve (decrease) increase (5.9 ) 3.4 Non - restructuring severance charges 1.7 1.3 Non - restructuring pension charges, net 7.1 0.0 Integration expenses — 4.3 Fair value adjustment on Tax Receivable Agreement contingent liability (0.7 ) 0.9 Fair value adjustment on contingent consideration liability 1.0 5.4 Escheat audit contingent liability — 7.0 Other 2.8 0.3 Adjusted EBITDA $ 36.2 $ 20.4 Net sales $ 1,707.3 $ 1,941.5 Adjusted EBITDA as a % of net sales 2.1 % 1.1 % Appendix: Reconciliation of Non - GAAP Financial Measures 19
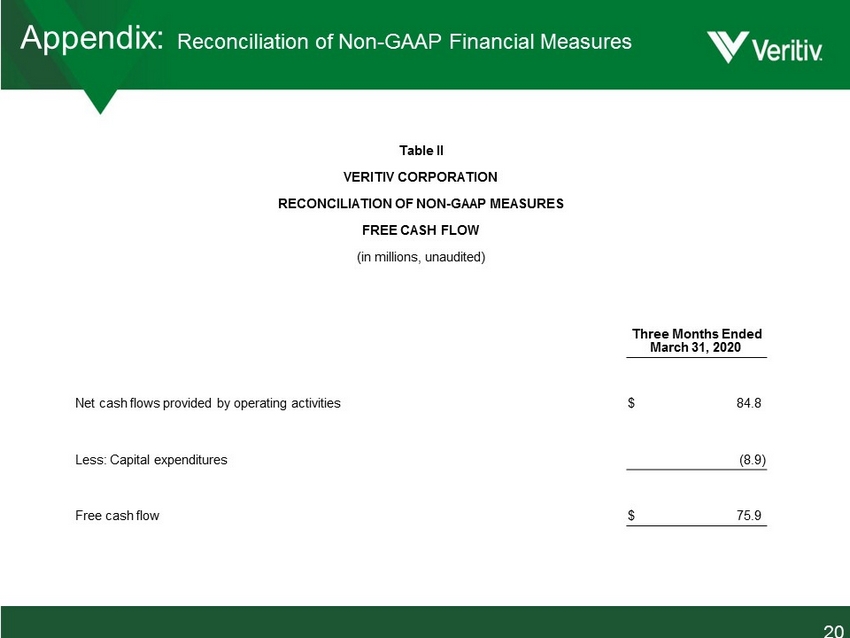
20 Appendix: Reconciliation of Non - GAAP Financial Measures Table II VERITIV CORPORATION RECONCILIATION OF NON - GAAP MEASURES FREE CASH FLOW (in millions, unaudited) Three Months Ended March 31, 2020 Net cash flows provided by operating activities $ 84.8 Less: Capital expenditures (8.9 ) Free cash flow $ 75.9
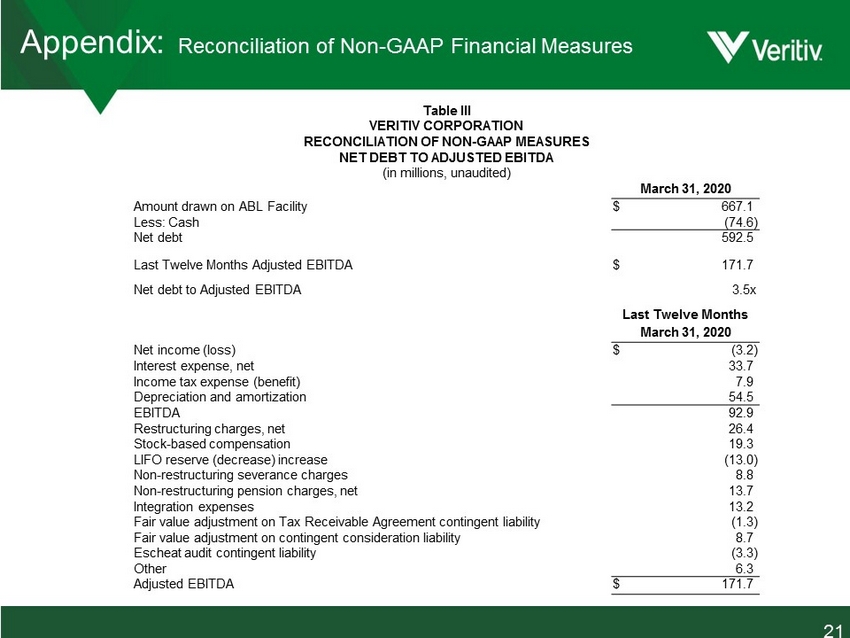
21 Appendix: Reconciliation of Non - GAAP Financial Measures Table III VERITIV CORPORATION RECONCILIATION OF NON - GAAP MEASURES NET DEBT TO ADJUSTED EBITDA (in millions, unaudited) March 31, 2020 Amount drawn on ABL Facility $ 667.1 Less: Cash (74.6 ) Net debt 592.5 Last Twelve Months Adjusted EBITDA $ 171.7 Net debt to Adjusted EBITDA 3.5x Last Twelve Months March 31, 2020 Net income (loss) $ (3.2 ) Interest expense, net 33.7 Income tax expense (benefit) 7.9 Depreciation and amortization 54.5 EBITDA 92.9 Restructuring charges, net 26.4 Stock - based compensation 19.3 LIFO reserve (decrease) increase (13.0 ) Non - restructuring severance charges 8.8 Non - restructuring pension charges, net 13.7 Integration expenses 13.2 Fair value adjustment on Tax Receivable Agreement contingent liability (1.3 ) Fair value adjustment on contingent consideration liability 8.7 Escheat audit contingent liability (3.3 ) Other 6.3 Adjusted EBITDA $ 171.7

First Quarter 2020 Financial Results May 6, 2020