Attached files
| file | filename |
|---|---|
| 8-K - 8-K - SOUTH JERSEY INDUSTRIES INC | sji-20200506.htm |

First Quarter 2020 Earnings Presentation May 7, 2020

Forward-Looking Statements and Use of Non-GAAP Measures Certain statements contained in this presentation may qualify as “forward-looking statements” within the meaning of Section 27A of the Securities Act of 1933 and Section 21E of the Securities Exchange Act of 1934. All statements other than statements of historical fact should be considered forward-looking statements made in good faith and are intended to qualify for the safe harbor from liability established by the Private Securities Litigation Reform Act of 1995. Words such as “anticipate”, “believe”, “expect”, “estimate”, “forecast”, “goal”, “intend”, “objective”, “plan”, “project”, “seek”, “strategy”, “target”, “will” and similar expressions are intended to identify forward-looking statements. Such forward-looking statements are subject to risks and uncertainties that could cause actual results to differ materially from those expressed or implied in the statements. These risks and uncertainties include, but are not limited to, the following: general economic conditions on an international, national, state and local level; weather conditions in our marketing areas; changes in commodity costs; changes in the availability of natural gas; “non-routine” or “extraordinary” disruptions in our distribution system; regulatory, legislative and court decisions; competition; the availability and cost of capital; costs and effects of legal proceedings and environmental liabilities; the failure of customers or suppliers to fulfill their contractual obligations; changes in business strategies; and public health crises and epidemics or pandemics, such as a novel coronavirus (COVID-19). These cautionary statements should not be construed by you to be exhaustive. While SJI believes these forward-looking statements to be reasonable, there can be no assurance that they will approximate actual experience. Further, SJI undertakes no obligation to update or revise any of its forward-looking statements, whether as a result of new information, future events or otherwise. This presentation includes certain non-GAAP financial measures, which the Company believes are useful in evaluating its performance. You should not consider the presentation of this additional information in isolation or as a substitute for results prepared in accordance with GAAP. The Company has provided reconciliations of comparable GAAP to non-GAAP measures in tables found later in this presentation. Investor Contact: Daniel Fidell 609-561-9000 x7027 dfidell@sjindustries.com 2

COVID-19 Business Update 3

COVID-19 | Business Update Business Operations Continue to Function Effectively During the Pandemic • WORKFORCE: Through proper planning and the innovative use of technology, all our employees are currently working -- from employees in the field to those working from home to assist in reducing the spread of the virus. • OPERATIONS: Operations and delivery of natural gas to customers has not been materially impacted. To date, SJI has not experienced significant reductions in sales volumes across our utility businesses and is closely monitoring potential impacts due to COVID-19 pandemic responses at the state and Federal level. • O&M: As expected, we have incurred operating costs for emergency supplies, cleaning services, enabling technology and other specific needs during this crisis which have traditionally been recognized as prudent expenditures by our regulators. SJI incurred costs during the three months ended March 31, 2020 of $0.6 million, with $0.4 million being recorded as Property, Plant & Equipment on the condensed consolidated balance sheets. • COLLECTIONS: To date, we have not seen a significant impact to accounts receivable but we continue to monitor this metric very closely. The impact to the collectability of accounts receivable has traditionally been included in rate recovery. • CAPEX: Our investment programs to replace and upgrade critical infrastructure continue, but some construction activity has ceased in accordance with directives from the Governor of New Jersey. Looking forward, we expect an uptick in construction activity once we emerge from this crisis. We remain on track with our timeline for investment in solar in support of the goals of the New Jersey Energy Master Plan (EMP). • LIQUIDITY: Total Credit Facilities: $1.25B; $470M available in revolving credit, uncommitted lines and cash. We completed steps in April to strengthen liquidity and ensure the funding of our 2020 capital program and feel confident in our ability to manage through the impacts of COVID-19. • PENSION: No near-term cash requirements, as our portfolios were deemed to have no minimum funding requirement as of December 31, 2019. • REGULATORY: NJ Board of Public Utilities (NJBPU) continues to hold regular commission agenda meetings via internet teleconference. Resolution on engineering and route proposal for SJG supply redundancy project estimated mid-2020. Resolution on SJG base rate case filing estimated Q4 2020. 4

First Quarter 2020 Financial Results 5

First Quarter 2020 Financial Results | Highlights FINANCIAL PERFORMANCE ✓ GAAP earnings of $1.09 per diluted share compared to $0.94 per diluted share in 2019 ✓ Economic Earnings of $1.15 per diluted share compared to $1.09 per diluted share in 2019 ✓ Capital spending of $114M; 99%+ allocated to growth, safety and reliability for SJG and ETG customers REGULATORY INITIATIVES ✓ ETG - $34M increase in base rates effective November 15, 2019 aided results ✓ SJG - Base rate case filed in March; Discovery has begun in line with expected timeline; Resolution expected Q4 2020 ✓ Engineering/route proposal to advance critical non-pipeline supply solution for SJG pending before NJBPU CUSTOMER GROWTH ✓ 9,500+ new customers added last 12 months, reflecting 1.5% annualized growth rate; 70%+ converted from heating oil or propane INFRASTRUCTURE MODERNIZATION ✓ SJG and ETG infrastructure modernization programs progressing; Next rate true-ups October 1 BUSINESS TRANSFORMATION ✓ Completed sale of Marina Thermal Facility (MTF) to DTE Energy Services for approximately $100M ✓ Advanced integration of ETG, embedding best practices for people, processes and technology ✓ Completed exit of transition-services agreement (TSA) with Southern ✓ Sale of Elkton Gas to Chesapeake Utilities for $15M progressing; Completion of transaction expected mid-2020 BALANCE SHEET ✓ Executed $200M 18-month term loan, with proceeds used to pay off short-term maturities ✓ Added additional liquidity at the SJI level through a $150M 364-day term loan ✓ $525M private placement at SJG: $400M to refinance maturing term loan; $125M on six-month delay supporting 2020 capital plan ✓ Launched $200M At-The-Market (ATM) program to provide flexibility in addressing 2020 equity needs 6

First Quarter 2020 Financial Results | Consolidated 1Q 2020 Three months ended March 31, 2020 Three months ended March 31, 2019 GAAP GAAP Economic Economic GAAP GAAP Economic Economic Earnings EPS Earnings EPS Earnings EPS Earnings EPS Utility $107.7 $1.16 $108.9 $1.18 $100.0 $1.09 $100.0 $1.09 Non-Utility $5.8 $0.06 $6.4 $0.07 ($1.6) ($0.02) $7.9 $0.08 Other ($12.4) ($0.13) ($8.5) ($0.09) ($12.8) ($0.13) ($8.5) ($0.08) Total - Continuing Operations $101.1 $1.09 $106.8 $1.15 $85.7 $0.94 $99.4 $1.09 Average Diluted Shares 92.6 92.6 91.4 91.4 *Non-GAAP, see "Explanation and Reconciliation of Non-GAAP Financial Measures." Note: Earnings and average shares outstanding are in millions. Amounts and/or EPS may not add due to rounding. 7

First Quarter 2020 Financial Results | Economic Earnings Bridge – Q1’19 to Q1’20 • UTILITY: SJG contribution $3.0 million and ETG contribution $5.9 million • NON-UTILITY: Energy Services contribution $0.7 million, Midstream contribution $0.1 million, and Energy Group contribution $(2.3) million • OTHER: Interest on debt, including ETG/ELK acquisition debt, contribution $0.1 million 8

First Quarter 2020 Financial Results | Capital Expenditures 99%+ of Capital Expenditures Supporting Growth, Safety and Reliability for SJG and ETG Customers First Quarter 2020 Capital Expenditures Description ($millions) 0% UTILITY $113 System Growth & Maintenance $54 Projects to enhance the safety and reliability of SJG/ETG systems 23% Infrastructure Modernization $33 Replacement of aging pipeline for SJG (AIRP, SHARP) and ETG (IIP) New Business $26 Addition of customers to SJG/ETG systems Redundancy Projects $0 Critical supply/system reliability investments for SJG/ETG customers NON-UTILITY $1 77% Midstream $1 Long-term contracted energy infrastructure projects (PennEast Pipeline) Energy Group $0 Investments supporting utilities, power generators and industrial customers Energy Services $0 Investments supporting goals of New Jersey Energy Master Plan (EMP) Total Capital Expenditures $114 Safety & Reliability New Business Other 9
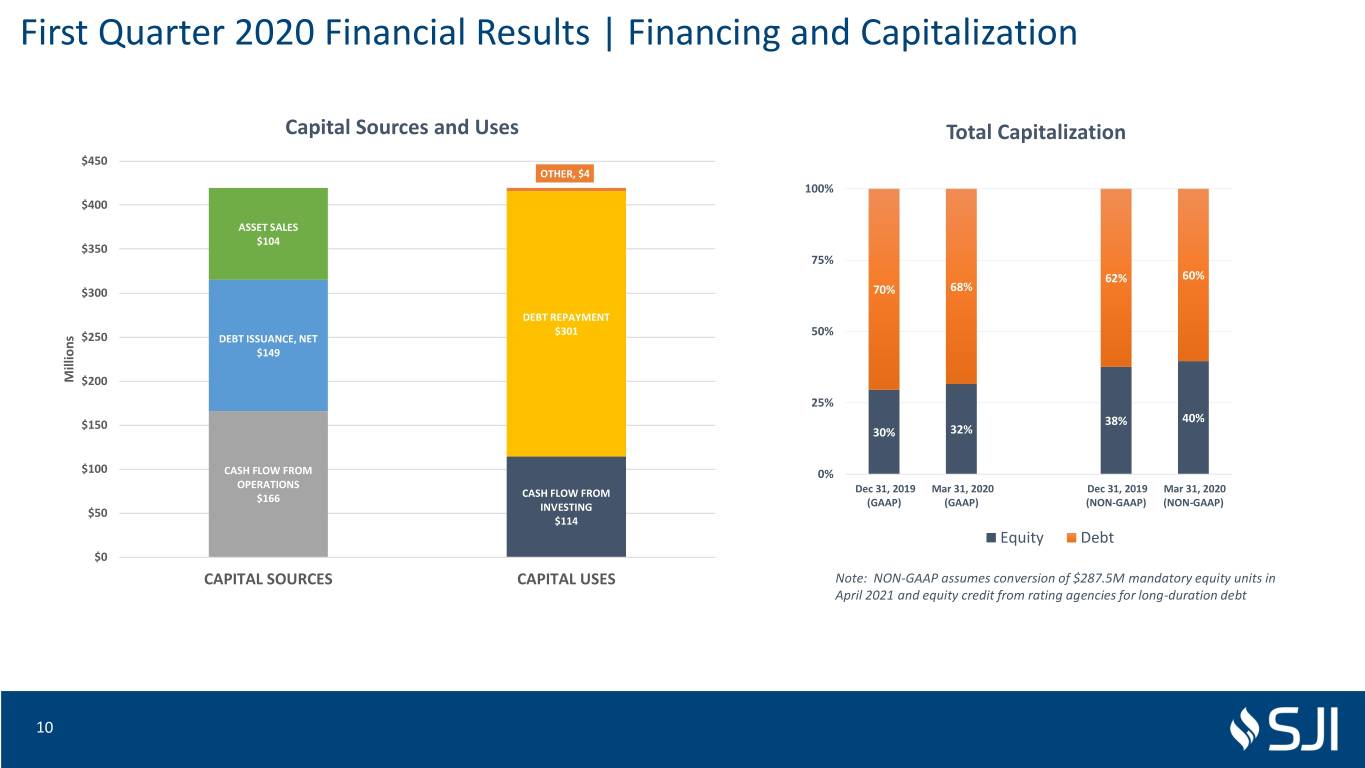
First Quarter 2020 Financial Results | Financing and Capitalization Capital Sources and Uses Total Capitalization $450 OTHER, $4 100% $400 ASSET SALES $104 $350 75% 62% 60% $300 70% 68% DEBT REPAYMENT $301 50% $250 DEBT ISSUANCE, NET $149 Millions $200 25% 40% $150 38% 30% 32% $100 CASH FLOW FROM 0% OPERATIONS CASH FLOW FROM Dec 31, 2019 Mar 31, 2020 Dec 31, 2019 Mar 31, 2020 $166 (GAAP) (GAAP) (NON-GAAP) (NON-GAAP) $50 INVESTING $114 Equity Debt $0 CAPITAL SOURCES CAPITAL USES Note: NON-GAAP assumes conversion of $287.5M mandatory equity units in April 2021 and equity credit from rating agencies for long-duration debt 10
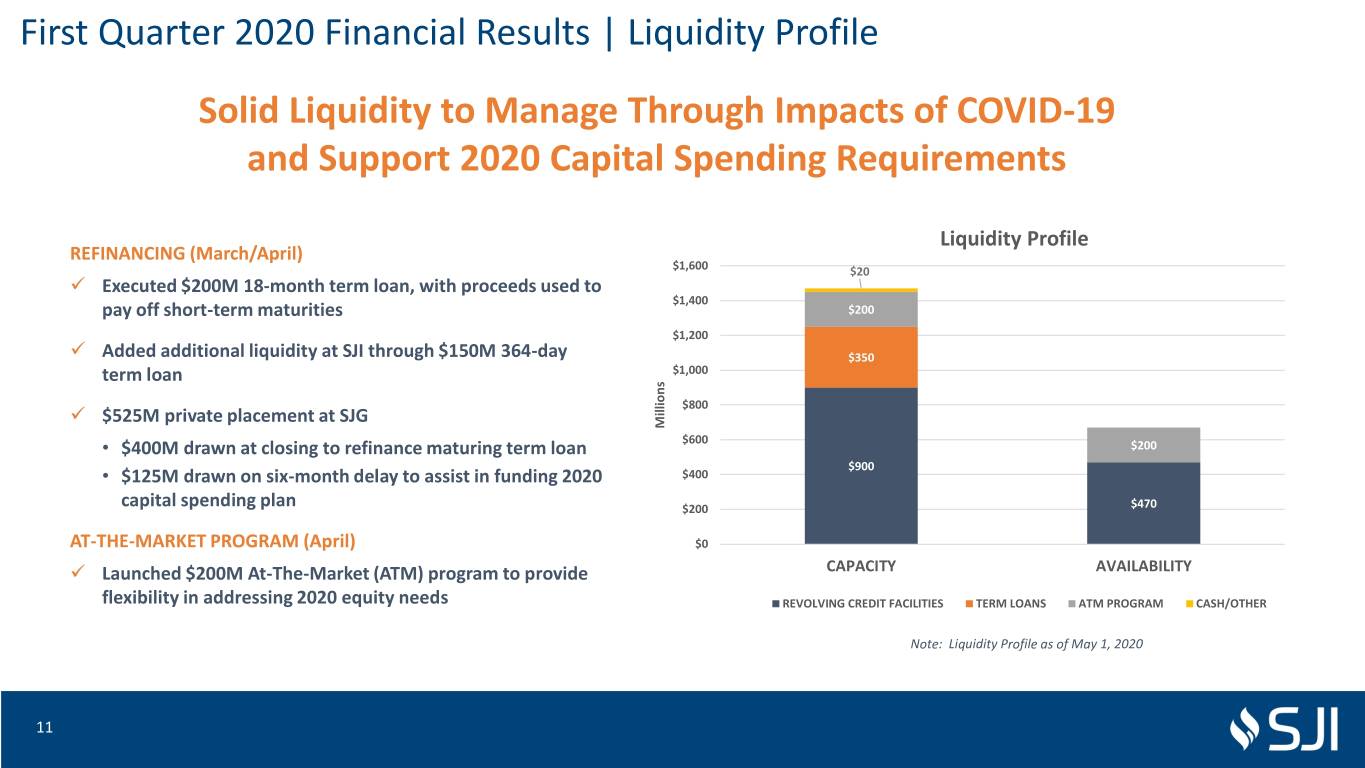
First Quarter 2020 Financial Results | Liquidity Profile Solid Liquidity to Manage Through Impacts of COVID-19 and Support 2020 Capital Spending Requirements Liquidity Profile REFINANCING (March/April) $1,600 $20 ✓ Executed $200M 18-month term loan, with proceeds used to $1,400 pay off short-term maturities $200 $1,200 ✓ Added additional liquidity at SJI through $150M 364-day $350 term loan $1,000 $800 ✓ $525M private placement at SJG Millions • $400M drawn at closing to refinance maturing term loan $600 $200 $900 • $125M drawn on six-month delay to assist in funding 2020 $400 capital spending plan $200 $470 AT-THE-MARKET PROGRAM (April) $0 ✓ Launched $200M At-The-Market (ATM) program to provide CAPACITY AVAILABILITY flexibility in addressing 2020 equity needs REVOLVING CREDIT FACILITIES TERM LOANS ATM PROGRAM CASH/OTHER Note: Liquidity Profile as of May 1, 2020 11

2020 Financial Outlook 12
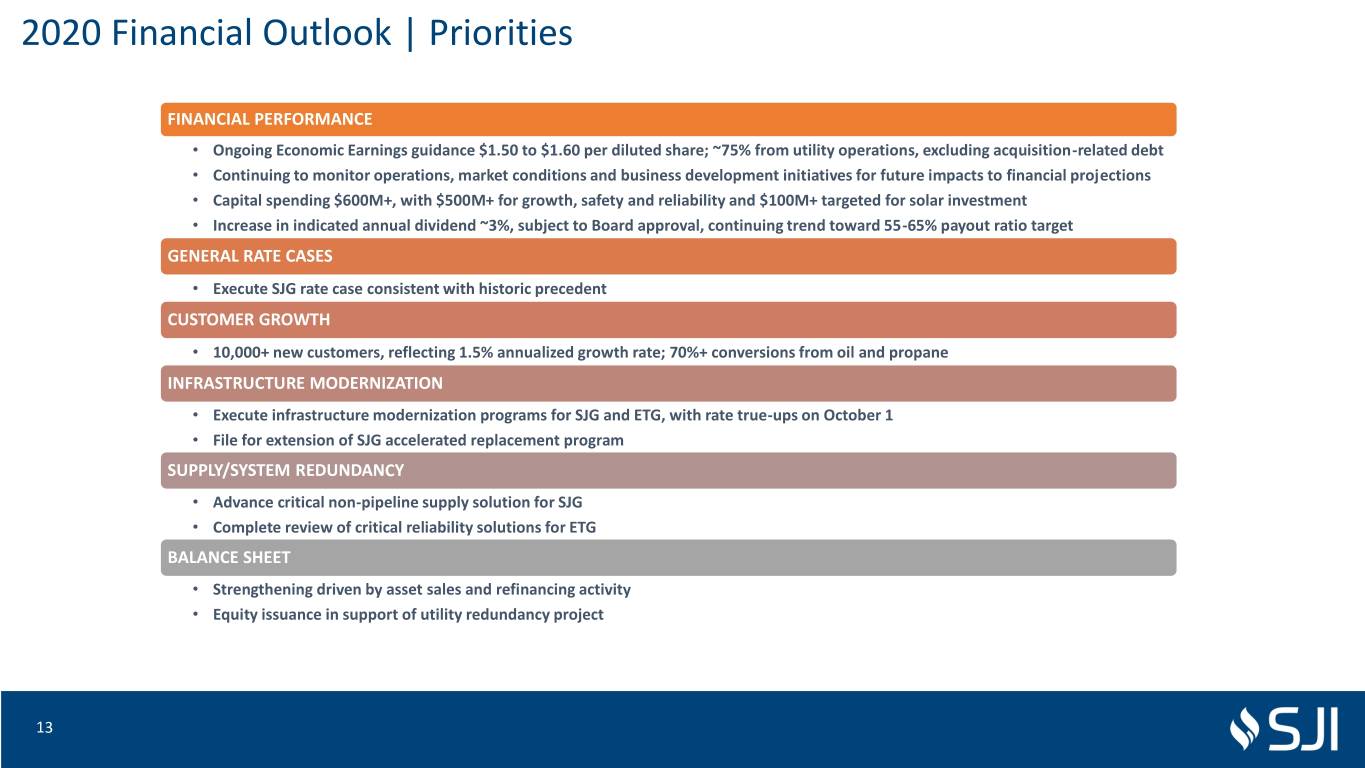
2020 Financial Outlook | Priorities FINANCIAL PERFORMANCE • Ongoing Economic Earnings guidance $1.50 to $1.60 per diluted share; ~75% from utility operations, excluding acquisition-related debt • Continuing to monitor operations, market conditions and business development initiatives for future impacts to financial projections • Capital spending $600M+, with $500M+ for growth, safety and reliability and $100M+ targeted for solar investment • Increase in indicated annual dividend ~3%, subject to Board approval, continuing trend toward 55-65% payout ratio target GENERAL RATE CASES • Execute SJG rate case consistent with historic precedent CUSTOMER GROWTH • 10,000+ new customers, reflecting 1.5% annualized growth rate; 70%+ conversions from oil and propane INFRASTRUCTURE MODERNIZATION • Execute infrastructure modernization programs for SJG and ETG, with rate true-ups on October 1 • File for extension of SJG accelerated replacement program SUPPLY/SYSTEM REDUNDANCY • Advance critical non-pipeline supply solution for SJG • Complete review of critical reliability solutions for ETG BALANCE SHEET • Strengthening driven by asset sales and refinancing activity • Equity issuance in support of utility redundancy project 13

2020 Financial Outlook | Regulatory Initiatives Company Filing Type Objective Filing/Submitted Date Expected Outcome Date Elizabethtown Gas Base Rate Case System Reliability and Growth Filed April 2019 Effective November 15, 2019 Engineering/Route Approval South Jersey Gas Supply Redundancy Filed December 2019 Q2 2020 For LNG Redundancy Project South Jersey Gas Base Rate Case System Reliability and Growth Filed March 2020 * Q4 2020 South Jersey Gas / Annual Recovery of Safety and Modernization Q2 2020 Q4 2020 Elizabethtown Gas Infrastructure Programs Extension of Infrastructure South Jersey Gas Safety and Modernization Q4 2020 Q2 2021 Replacement Program South Jersey Gas (SJG) Authorized Requested * New Rates Requested Jan 27, 2017 Mar 13, 2020 Rate Relief $39.5M $75.3M Rate Base $1.6B $2.2B Overall Rate of Return (ROR) 6.8% 7.3% Return on Equity (ROE) 9.6% 10.4% Equity Capital Structure 52.5% 54.2% Test Year Ending Aug 31, 2017 Jun 30, 2020 New Rates Effective Nov 1, 2017 Estimated Q4 2020 14

2020 Financial Outlook | Ongoing Economic Earnings: $1.50-$1.60 Per Diluted Share Ongoing Economic Earnings Guidance Primarily Reflects: 2020E ECONOMIC EARNINGS CONSOLIDATED Utility operations ~75% of earnings, excluding acquisition-related interest costs ($millions, except EPS) o ~$500 million capital spending on growth, safety and reliability for SJG/ETG customers UTILITY $130 - $140 o 10,000+ new gas utility customers, reflecting 1.5% customer growth, driven by accelerated pace at ETG NON-UTILITY $45 - $55 o Lower operating costs, driven by business transformation activities OTHER ($35) - ($45) o Infrastructure modernization at SJG/ETG under existing programs Total $140 - $150 o Execution of regulatory initiatives, including recovery of utility investment Non-Utility operations ~25% of earnings, excluding acquisition-related interest costs Average Diluted Shares 93.3 - 93.7 o Energy Services: $100+ million on renewable solar installations in support of EMP, and landfill exit Diluted EPS * $1.50 - $1.60 o Energy Group: Fuel management contracts, reshaped wholesale portfolio and contract expiration o Midstream: AFUDC associated with PennEast Pipeline project Capital Expenditures $625 - $655 Balance sheet strengthening, driven by asset sales and refinancing activities * Changes in events or other circumstances that the Company cannot currently anticipate could materially impact earnings and could result in earnings for 2020 Equity issuance in support of utility redundancy project significantly above or below this outlook 15
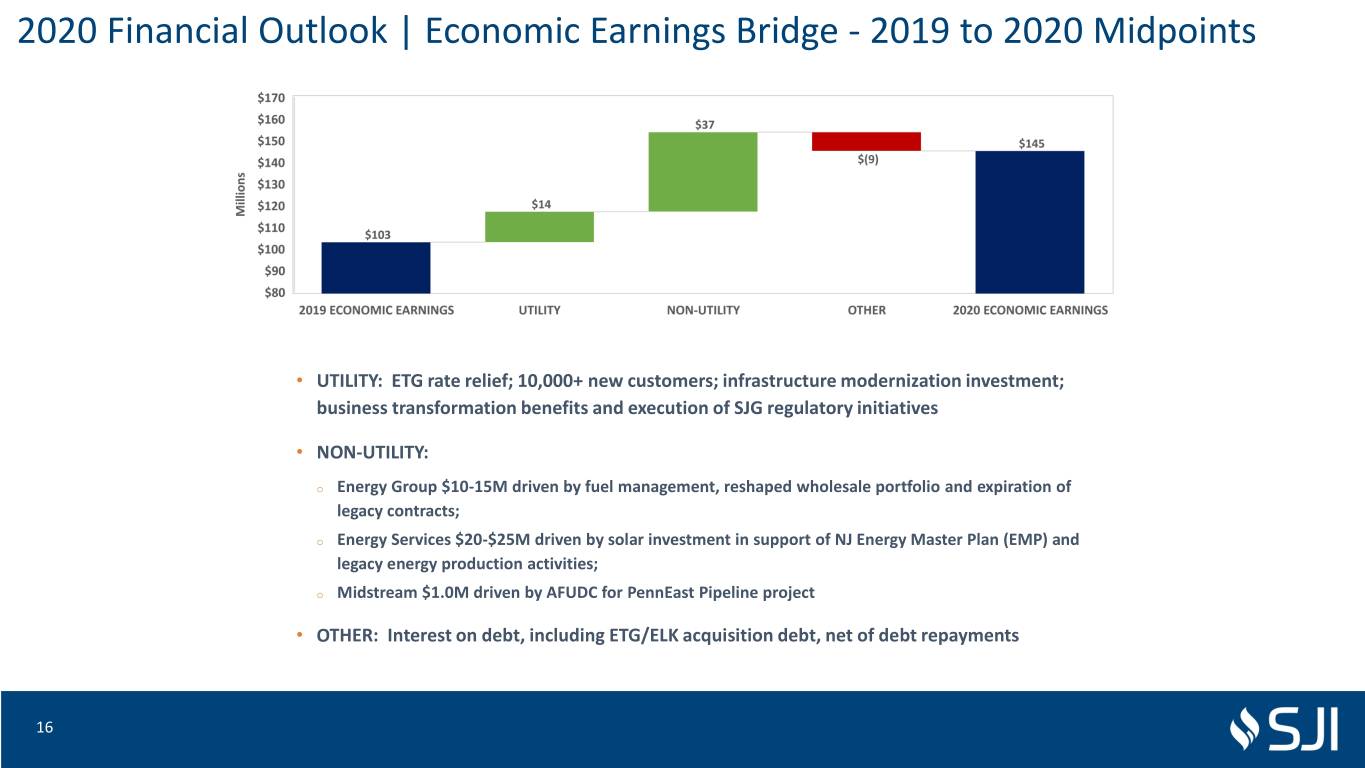
2020 Financial Outlook | Economic Earnings Bridge - 2019 to 2020 Midpoints • UTILITY: ETG rate relief; 10,000+ new customers; infrastructure modernization investment; business transformation benefits and execution of SJG regulatory initiatives • NON-UTILITY: o Energy Group $10-15M driven by fuel management, reshaped wholesale portfolio and expiration of legacy contracts; o Energy Services $20-$25M driven by solar investment in support of NJ Energy Master Plan (EMP) and legacy energy production activities; o Midstream $1.0M driven by AFUDC for PennEast Pipeline project • OTHER: Interest on debt, including ETG/ELK acquisition debt, net of debt repayments 16

2020 Financial Outlook | Capital Expenditures More Than 80% of Capital Expenditures Support Growth, Safety and Reliability for SJG and ETG Customers FY 2020 Capital Expenditures Description ($millions) UTILITY $480 - $500 System Growth & Maintenance $210 - $215 Projects to enhance the safety and reliability of SJG/ETG systems 19% Infrastructure Modernization $165 - $170 Replacement of aging pipeline for SJG (AIRP, SHARP) and ETG (IIP) New Business $85 - $90 Addition of customers to SJG/ETG systems Redundancy Projects $20 - $25 Critical supply/system reliability investments for SJG/ETG customers 14% 67% NON-UTILITY $145 - $155 Midstream $25 - $30 Long-term contracted energy infrastructure projects (PennEast Pipeline) Energy Group $10 - $10 Investments supporting utilities, power generators and industrial customers Energy Services $110 -$115 Investments supporting goals of New Jersey Energy Master Plan (EMP) Safety & Reliability Total Capital Expenditures $625 - $655 New Business Other 17

2020 Financial Outlook | Capital Sources & Uses Financing Plans are Reflected in Earnings and EPS Growth Estimates and Expected to Support Current Credit Metrics Capital Sources and Uses $0.8 ASSET SALES DIVIDENDS $0.7 $0.1 $0.1 $0.6 EQUITY ISSUANCE (ATM) $0.2 $0.5 $0.4 DEBT ISSUANCE, NET CASH FLOW FROM Billions $0.2 INVESTING $0.3 $0.7 $0.2 CASH FLOW FROM OPERATIONS $0.1 $0.3 $0.0 CAPITAL SOURCES CAPITAL USES Note: All amounts reflect ongoing guidance and are rounded 18

Appendix 19
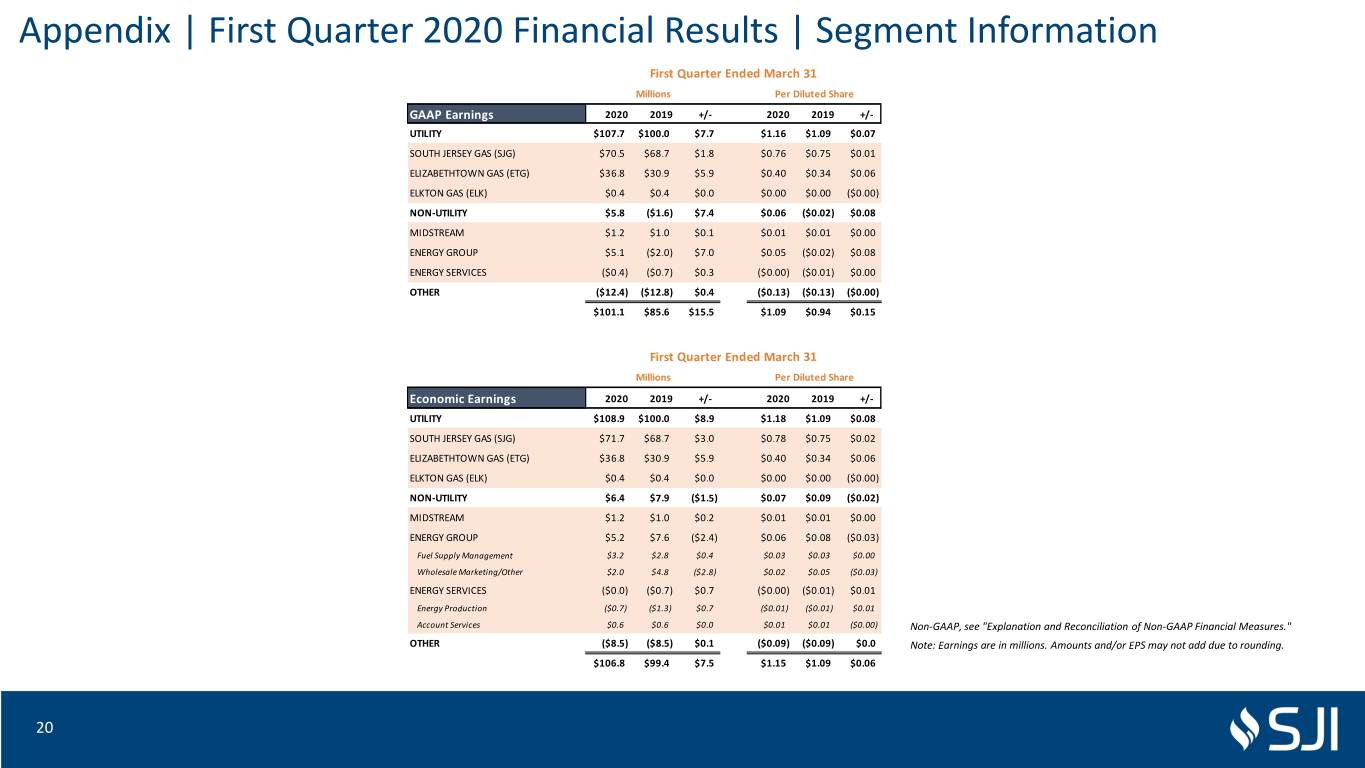
Appendix | First Quarter 2020 Financial Results | Segment Information First Quarter Ended March 31 Millions Per Diluted Share GAAP Earnings 2020 2019 +/- 2020 2019 +/- UTILITY $107.7 $100.0 $7.7 $1.16 $1.09 $0.07 SOUTH JERSEY GAS (SJG) $70.5 $68.7 $1.8 $0.76 $0.75 $0.01 ELIZABETHTOWN GAS (ETG) $36.8 $30.9 $5.9 $0.40 $0.34 $0.06 ELKTON GAS (ELK) $0.4 $0.4 $0.0 $0.00 $0.00 ($0.00) NON-UTILITY $5.8 ($1.6) $7.4 $0.06 ($0.02) $0.08 MIDSTREAM $1.2 $1.0 $0.1 $0.01 $0.01 $0.00 ENERGY GROUP $5.1 ($2.0) $7.0 $0.05 ($0.02) $0.08 ENERGY SERVICES ($0.4) ($0.7) $0.3 ($0.00) ($0.01) $0.00 OTHER ($12.4) ($12.8) $0.4 ($0.13) ($0.13) ($0.00) $101.1 $85.6 $15.5 $1.09 $0.94 $0.15 First Quarter Ended March 31 Millions Per Diluted Share Economic Earnings 2020 2019 +/- 2020 2019 +/- UTILITY $108.9 $100.0 $8.9 $1.18 $1.09 $0.08 SOUTH JERSEY GAS (SJG) $71.7 $68.7 $3.0 $0.78 $0.75 $0.02 ELIZABETHTOWN GAS (ETG) $36.8 $30.9 $5.9 $0.40 $0.34 $0.06 ELKTON GAS (ELK) $0.4 $0.4 $0.0 $0.00 $0.00 ($0.00) NON-UTILITY $6.4 $7.9 ($1.5) $0.07 $0.09 ($0.02) MIDSTREAM $1.2 $1.0 $0.2 $0.01 $0.01 $0.00 ENERGY GROUP $5.2 $7.6 ($2.4) $0.06 $0.08 ($0.03) Fuel Supply Management $3.2 $2.8 $0.4 $0.03 $0.03 $0.00 Wholesale Marketing/Other $2.0 $4.8 ($2.8) $0.02 $0.05 ($0.03) ENERGY SERVICES ($0.0) ($0.7) $0.7 ($0.00) ($0.01) $0.01 Energy Production ($0.7) ($1.3) $0.7 ($0.01) ($0.01) $0.01 Account Services $0.6 $0.6 $0.0 $0.01 $0.01 ($0.00) Non-GAAP, see "Explanation and Reconciliation of Non-GAAP Financial Measures." OTHER ($8.5) ($8.5) $0.1 ($0.09) ($0.09) $0.0 Note: Earnings are in millions. Amounts and/or EPS may not add due to rounding. $106.8 $99.4 $7.5 $1.15 $1.09 $0.06 20

Appendix | Utility Economic Earnings Bridge – Q1’19 to Q1’20 • MARGIN: Customer growth, infrastructure modernization investment, and ETG rate relief • OPERATION EXPENSES: O&M, bad debt, business transformation, regulatory riders, and energy and other taxes • DEPRECIATION: Utility investment in property, plant and equipment • OTHER INCOME: Investment income and AFUDC from IT projects • NET INTEREST: Variance in debt balances • INCOME TAX: Effective income tax rate * We define utility margin, a non-GAAP measure, as natural gas revenues less natural gas costs, regulatory rider expenses and volumetric and revenue-based energy taxes. 21

Appendix | Non-Utility Economic Earnings Bridge – Q1’19 to Q1’20 • ENERGY PRODUCTION: Sale of non-core assets and lower expenses • FUEL MANAGEMENT: Contracts that became operational over last twelve months • MIDSTREAM: AFUDC for PennEast Pipeline project • WHOLESALE MARKETING: Impact of low spreads and warmer weather on asset optimization 22

Appendix | New Jersey Energy Master Plan (EMP) SJI Supports the Clean Energy Goals of the EMP PAST ACTIONS AND INVESTMENTS ❖ REDUCING ENERGY CONSUMPTION/EMISSIONS ✓ Replacement of aging infrastructure, improving safety and reliability for customers and reducing greenhouse gas emissions (GHG) from fugitive emissions; On track for expected reduction of 500 tons of carbon emissions at current replacement rate ✓ Conservation incentive program (CIP) severed the tie between volumes and margins, encouraging reductions in consumption ❖ DEPLOYMENT OF RENEWABLE ENERGY ✓ Sizable investments in solar, combined heat-and-power (CHP), and landfill-to-electric generation ❖ MAXIMIZING ENERGY EFFICIENCY ✓ Energy Efficiency program (EE) designed to reduce consumption ❖ MODERNIZING VIA TECHNOLOGY ✓ Developed enterprise level environmental policy and management system FUTURE INVESTMENT OPPORTUNITIES ❖ REDUCING ENERGY CONSUMPTION/EMISSIONS • Acceleration/extension of NJBPU-approved infrastructure modernization programs ❖ DEPLOYMENT OF RENEWABLE ENERGY • Solar Installations: SJI corporate facilities, landfill properties, community solar and other development projects • Renewable Natural Gas (RNG): Investment opportunities including repurposing existing landfills ❖ MAXIMIZING ENERGY EFFICIENCY • Expansion of existing NJBPU-approved energy efficiency programs to reduce consumption ❖ MODERNIZING VIA TECHNOLOGY • Smart Meter pilot program for 700,000 utility customers to reduce consumption 23

Appendix | PennEast Pipeline ➢ Project Description • 20% equity owner in 1.1 Bcf/d, 120-mile interstate pipeline from Marcellus region of Pennsylvania into NJ • Access to low cost supply; benefits customers and local economies • $200M+ investment withFERC level returns projected • 100% subscribed; 80%+capacity under 15-year agreements ➢ Recent Actions • On January 30, the FERC granted, in part, PennEast’s petition for a Declaratory Order requesting the Commission’s interpretation of the Natural Gas Act, in light of the Third Circuit’s decision that PennEast was barred from bringing an eminent domain lawsuit in federal court against the state of New Jersey or its agencies. • On January 31, PennEast filed with the FERC a request for an amendment of the certificate to allow the Project to proceed on a phased basis. o Phase One would consist of 68-miles of 36-inch pipe, constructed entirely within Pennsylvania and ready to deliver natural gas by November 2021. o Phase Two portion would include the remaining route in Pennsylvania and New Jersey, with a targeted completion of 2023. • On February 18, PennEast filed a Petition for Certiorari with the US Supreme Court to review the Third Circuit’s decision. ➢ Current Status • The PennEast member companies remain fully committed to the project and the affordable, reliable service it will bring to the region, including nine million Garden State residents 24

Appendix | Fuel Supply Management Contracts Fuel Supply Management Contracts Capacity Volume Current Term Counterparty Location In Service Start Date End Date (MW) (Dth/Day) (Yrs) Starwood Marcus Hook, PA 750 80,000 2004 2035 17 LS Power West Deptford, NJ 738 76,700 2014 2029 15 Moxie - Liberty Bradford Co, PA 825 137,655 2016 2021 5 Moxie - Patriot Lycoming Co, PA 825 137,655 2016 2020 4 Panda - Stonewall Leesburg, VA 750 110,000 2017 2022 5 Moxie - Freedom Luzerne Co, PA 1,029 157,000 2018 2028 10 Lordstown Trumball County, OH 1,025 160,000 2018 2024 5 Invenergy Lackawanna, PA 1,480 210,000 2018 2029 10 Sunoco Refinery Marcus Hook, PA NA 13,000 2020 2022 2 TYR Energy (Hickory Run) Lawrence Co, PA 1,000 162,000 2020 2025 5 25

Non-GAAP Financial Measures Management uses the non-GAAP financial measures of Economic Earnings and Economic Earnings per share when evaluating its results of operations. These non-GAAP financial measures should not be considered as an alternative to GAAP measures, such as net income, operating income, earnings per share from continuing operations or any other GAAP measure of financial performance. We define Economic Earnings as: Income from continuing operations, (i) less the change in unrealized gains and plus the change in unrealized losses on all derivative transactions; and (ii) less the impact of transactions, contractual arrangements or other events where management believes period to period comparisons of SJI's operations could be difficult or potentially confusing. With respect to part (ii) of the definition of Economic Earnings, several items are excluded from Economic Earnings for the three months ended March 31, 2020 and 2019, including the impact of pricing disputes with third parties, costs to acquire ETG and ELK, costs to prepare to exit the TSA, costs incurred and gains recognized on sales of solar, MTF/ACB, and ELK, severance and other employee separation costs, and a one-time tax adjustment resulting from SJG's Stipulation of Settlement with the BPU. Economic Earnings is a significant financial measure used by our management to indicate the amount and timing of income from continuing operations that we expect to earn after taking into account the impact of derivative instruments on the related transactions, as well as the impact of contractual arrangements and other events that management believes make period to period comparisons of SJI's operations difficult or potentially confusing. Management uses Economic Earnings to manage its business and to determine such items as incentive/compensation arrangements and allocation of resources. Specifically regarding derivatives, we believe that this financial measure indicates to investors the profitability of the entire derivative-related transaction and not just the portion that is subject to mark-to-market valuation under GAAP. We believe that considering only the change in market value on the derivative side of the transaction can produce a false sense as to the ultimate profitability of the total transaction as no change in value is reflected for the non-derivative portion of the transaction. Please refer to our annual report on form 10-K and other SEC filings where the reconciliations to GAAP earnings can be found. 26

