Attached files
| file | filename |
|---|---|
| 8-K - 8-K - Mueller Water Products, Inc. | form8-k05x06x2020xinve.htm |

Where Intelligence Meets Infrastructure® Oppenheimer 15th Annual Industrial Growth Conference May 6, 2020

NON-GAAP Financial Measures In an effort to provide investors with additional information regarding the Company’s results as determined under GAAP, the Company also provides non-GAAP information that management believes is useful to investors. These non-GAAP measures have limitations as analytical tools, and securities analysts, investors and other interested parties should not consider any of these non-GAAP measures in isolation or as a substitute for analysis of the Company’s results as reported under GAAP. These non-GAAP measures may not be comparable to similarly titled measures used by other companies. The Company presents adjusted net income, adjusted net income per diluted share, adjusted operating income, adjusted operating margin, adjusted EBITDA and adjusted EBITDA margin as performance measures because management uses these measures in evaluating the Company’s underlying performance on a consistent basis across periods and in making decisions about operational strategies. Management also believes these measures are frequently used by securities analysts, investors and other interested parties in the evaluation of the Company’s recurring performance. The Company presents net debt and net debt leverage as performance measures because management uses them in evaluating its capital management, and the investment community commonly uses them as measures of indebtedness. The Company presents free cash flow because management believes it is commonly used by the investment community to measure the Company’s ability to create liquidity. The calculations of these non-GAAP measures and reconciliations to GAAP results are included as an attachment to this presentation and have been posted online at www.muellerwaterproducts.com. 2

Forward-Looking Statements This presentation release contains certain statements that may be deemed “forward-looking statements” within the meaning of the Private Securities Litigation Reform Act of 1995. All statements that address activities, events or developments that the Company intends, expects, plans, projects, believes or anticipates will or may occur in the future are forward-looking statements, including, without limitation, statements regarding outlooks, projections, forecasts, trend descriptions, the COVID-19 pandemic, go-to-market strategies, operational excellence, acceleration of new product development, end market performance, net sales performance, organic adjusted operating income and adjusted EBITDA performance, margins, capital expenditure plans, litigation outcomes, capital allocation and growth strategies, and future warranty charges. Forward-looking statements are based on certain assumptions and assessments made by the Company in light of the Company’s experience and perception of historical trends, current conditions and expected future developments. Actual results and the timing of events may differ materially from those contemplated by the forward-looking statements due to a number of factors, including the extent, duration and severity of the impact of the COVID-19 pandemic on the Company’s operations and results, including effects on the financial health of customers (including collections), the Company and the financial/capital markets, government-mandated facility closures, COVID-19 related facility closures and other manufacturing restrictions, logistical challenges and supply chain interruptions, potential litigation and claims emanating from the COVID-19 pandemic, and health, safety and employee/labor issues in Company facilities around the world; regional, national or global political, economic, market and competitive conditions; cyclical and changing demand in core markets such as municipal spending; government monetary or fiscal policies; residential and non-residential construction, and natural gas distribution; manufacturing and product performance; expectations for changes in volumes, continued execution of cost productivity initiatives and improved pricing; warranty exposures (including the adequacy of warranty reserves); the Company’s ability to successfully resolve significant legal proceedings, claims, lawsuits or government investigations; compliance with environmental, trade and anti-corruption laws and regulations; changing regulatory, trade and tariff conditions; failure to achieve expected cost savings, net sales expectations, profitability expectations and manufacturing efficiencies from our large capital projects in Chattanooga and Kimball, Tennessee and Decatur, Illinois; the failure to integrate and/or realize any of the anticipated benefits of recent acquisitions or divestitures; and other factors that are described in the section entitled “RISK FACTORS” in Item 1A of the Company’s most recently filed Quarterly Reports on Form 10-Q and Annual Report on Form 10-K (all of which risks may be amplified by the COVID-19 outbreak). Forward-looking statements do not guarantee future performance and are only as of the date they are made. The Company undertakes no duty to update its forward-looking statements except as required by law. Undue reliance should not be placed on any forward-looking statements. You are advised to review any further disclosures the Company makes on related subjects in subsequent Forms 10-K, 10-Q, 8-K and other reports filed with the U.S. Securities and Exchange Commission. 3

Mueller Water Products at a Glance HISTORY LTM FINANCIALS END MARKETS* FISCAL YEAR 2019 • Founded 160 years ago as of March 31, 2020 <10% Natural gas utilities • Spun off from Walter % of Industries in 2006 $ in millions Total • Listed on NYSE (MWA) June Net sales $1,011.5 60-65% Repair and replacement 1, 2006 Infrastructure $918.0 90.8% of municipal water systems • Divested U.S. Pipe (April Technologies $93.5 9.2% 2012) and Anvil (Jan. 2017) 25-30% % of Residential • Acquired Singer Valve (Feb. construction 2017) and Krausz Industries Net Sales (Dec. 2018) Adjusted operating income $154.0 15.2% • Paid and settled Walter Tax Adjusted EBITDA $211.5 20.9% Liability for $22.2 million with no future obligations (Nov. 2019) * End market data based on company estimates and includes all sales for Infrastructure and Technologies segments. 4

Investment Highlights • Leading brand and municipal market specification positions • Large installed base of iron gate valves and fire hydrants STRONG COMPETITIVE POSITION • Comprehensive distribution network and strong end-user relationships • Low-cost manufacturing operations using lost foam process • Favorable market dynamics in municipal and residential end-markets FUNDAMENTALLY SOUND • Aging infrastructure with increasing public awareness driving need for investment requiring LONG-TERM DYNAMICS a $1.7 trillion investment, according to the American Water Works Association(1) • End-markets served by limited number of suppliers MODERNIZING MANUFACTURING AND • Enhanced operational excellence initiatives delivering ongoing productivity improvements DRIVING OPERATIONAL EXCELLENCE • Prioritizing capital investments to modernize manufacturing facilities, equipment and TO DELIVER MARGIN EXPANSION processes to drive margin expansion and continued investment in product development LEVERAGING STRENGTHS TO • Intelligent Water TechnologyTM solutions helping utilities actively diagnose, monitor and control the delivery of drinking water INCREASE TECHNOLOGY-ENABLED • Proprietary fixed leak detection, pipe condition assessment, smart metering and software PRODUCTS offerings for utilities to have flexible and scalable platform for infrastructure monitoring STRONG BALANCE SHEET AND • Strong balance sheet and cash flow driving balanced and disciplined capital allocation • Enabling growth through capital investments and acquisitions, while returning cash to CASH FLOW shareholders through dividends and share repurchases (1) American Water Works Association, Buried No Longer: Confronting America’s Water Infrastructure Challenge 2012 5

COVID-19 Update* • COVID-19 response team utilizing daily communication to share information and make quick decisions • Eliminated non-essential travel for all employees and executed remote work procedures Employees • Enhanced procedures for disinfection including reinforcing hand washing at all facilities • Established processes for physical distancing • Increased frequency of communication to employees • Products and services defined as essential business in accordance with the Critical Infrastructure Guidance • Implemented preparedness plans including physical distancing measures focused on safe distancing procedures and processes and usage of additional personal protective equipment Operations • All facilities are operational as of May 5, 2020, and able to fill orders and teams have worked effectively to address the few temporary closures we have experienced • Continue to proactively monitor supply chain and have not experienced any material supply chain issues since the temporary closure of our Jingmen facility, which is located near Wuhan in the Hubei Province • Commercial teams focused on providing customer service, maintaining contact with direct customers and Customers working closely with distributors and • Leveraging digital channels and processes to fill orders as required by physical distancing Communities • Albertville product engineering team producing 3D-printed face shields for frontline medical professionals caring for patients in support of the Marshall Medical Center South in Boaz, Alabama * Update provided with Q2FY20 earnings press release and call on May 4 & 5, 2020. 6
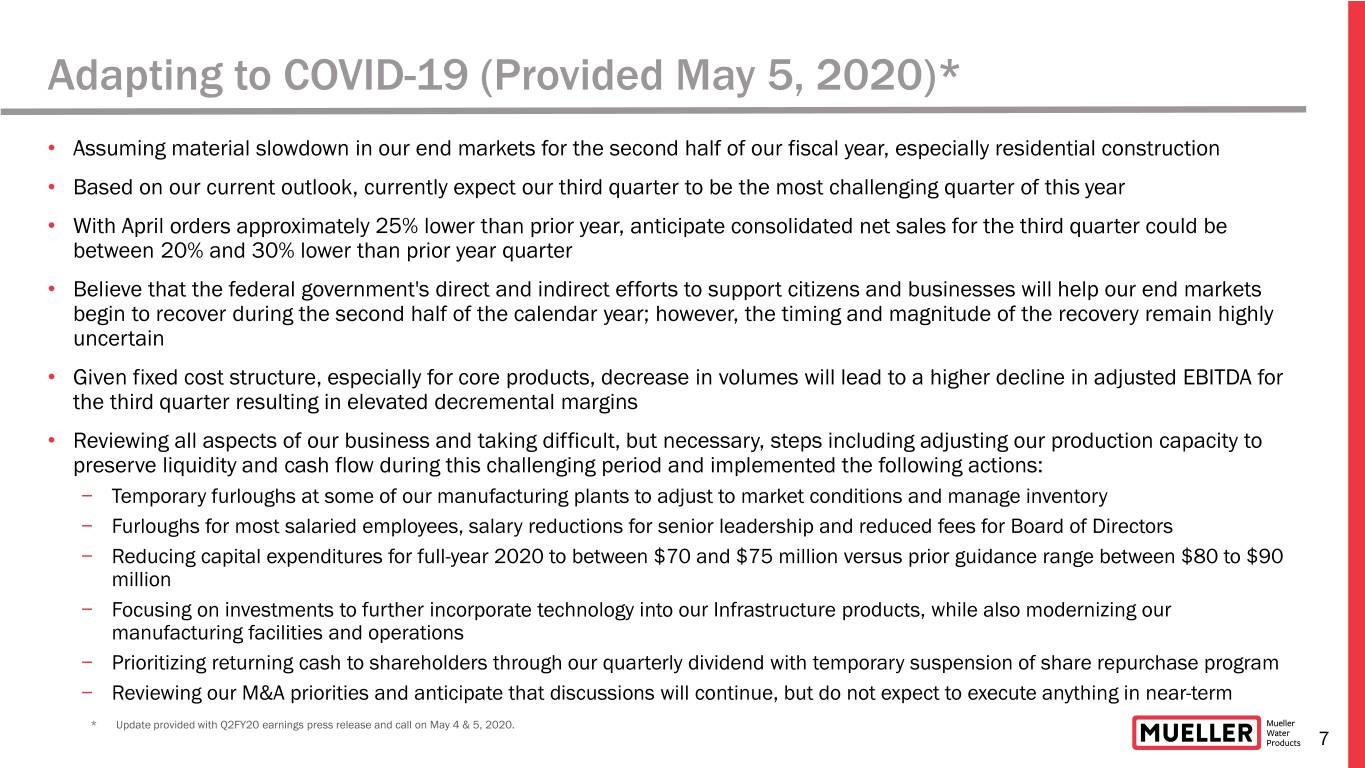
Adapting to COVID-19 (Provided May 5, 2020)* • Assuming material slowdown in our end markets for the second half of our fiscal year, especially residential construction • Based on our current outlook, currently expect our third quarter to be the most challenging quarter of this year • With April orders approximately 25% lower than prior year, anticipate consolidated net sales for the third quarter could be between 20% and 30% lower than prior year quarter • Believe that the federal government's direct and indirect efforts to support citizens and businesses will help our end markets begin to recover during the second half of the calendar year; however, the timing and magnitude of the recovery remain highly uncertain • Given fixed cost structure, especially for core products, decrease in volumes will lead to a higher decline in adjusted EBITDA for the third quarter resulting in elevated decremental margins • Reviewing all aspects of our business and taking difficult, but necessary, steps including adjusting our production capacity to preserve liquidity and cash flow during this challenging period and implemented the following actions: − Temporary furloughs at some of our manufacturing plants to adjust to market conditions and manage inventory − Furloughs for most salaried employees, salary reductions for senior leadership and reduced fees for Board of Directors − Reducing capital expenditures for full-year 2020 to between $70 and $75 million versus prior guidance range between $80 to $90 million − Focusing on investments to further incorporate technology into our Infrastructure products, while also modernizing our manufacturing facilities and operations − Prioritizing returning cash to shareholders through our quarterly dividend with temporary suspension of share repurchase program − Reviewing our M&A priorities and anticipate that discussions will continue, but do not expect to execute anything in near-term * Update provided with Q2FY20 earnings press release and call on May 4 & 5, 2020. 7
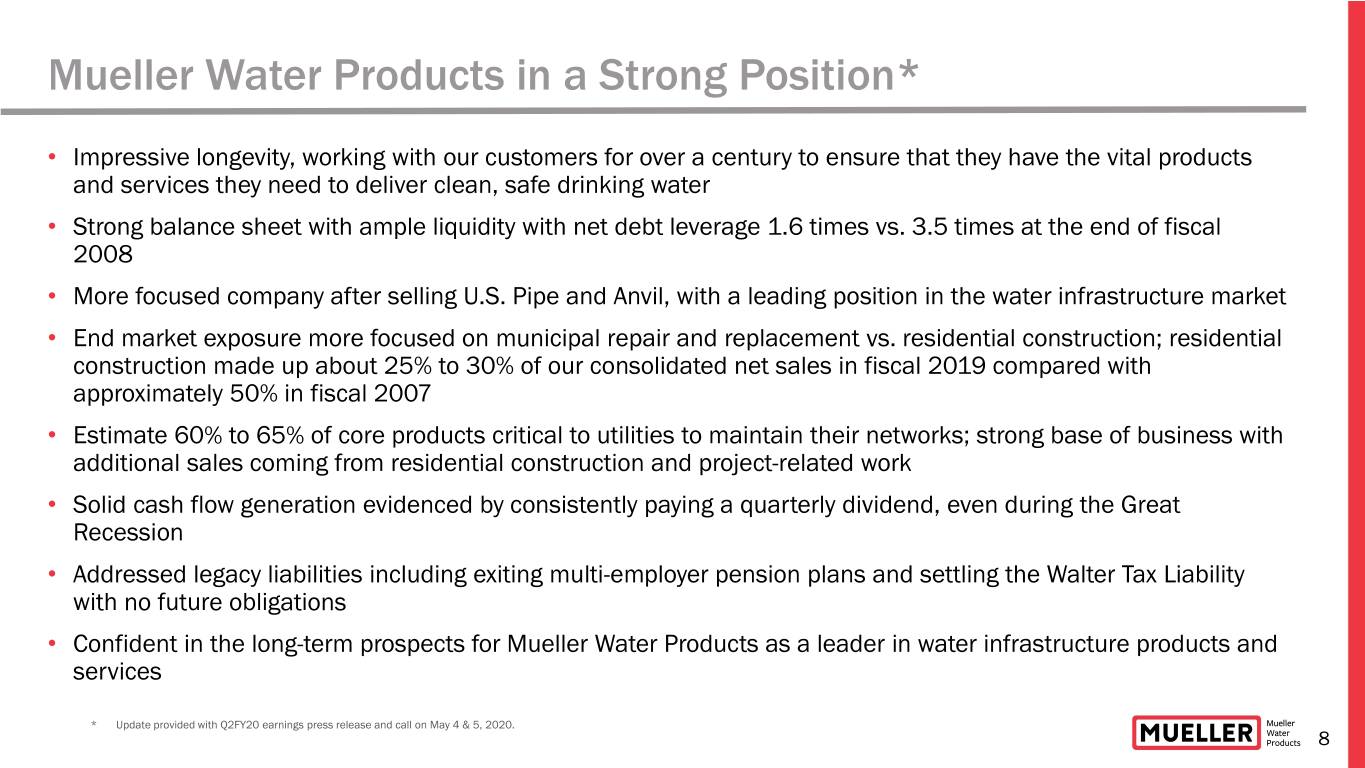
Mueller Water Products in a Strong Position* • Impressive longevity, working with our customers for over a century to ensure that they have the vital products and services they need to deliver clean, safe drinking water • Strong balance sheet with ample liquidity with net debt leverage 1.6 times vs. 3.5 times at the end of fiscal 2008 • More focused company after selling U.S. Pipe and Anvil, with a leading position in the water infrastructure market • End market exposure more focused on municipal repair and replacement vs. residential construction; residential construction made up about 25% to 30% of our consolidated net sales in fiscal 2019 compared with approximately 50% in fiscal 2007 • Estimate 60% to 65% of core products critical to utilities to maintain their networks; strong base of business with additional sales coming from residential construction and project-related work • Solid cash flow generation evidenced by consistently paying a quarterly dividend, even during the Great Recession • Addressed legacy liabilities including exiting multi-employer pension plans and settling the Walter Tax Liability with no future obligations • Confident in the long-term prospects for Mueller Water Products as a leader in water infrastructure products and services * Update provided with Q2FY20 earnings press release and call on May 4 & 5, 2020. 8

Keeping Eye on Long-term Strategies with Core Values Providing Foundation for Navigating the Crisis 9

Products and Markets
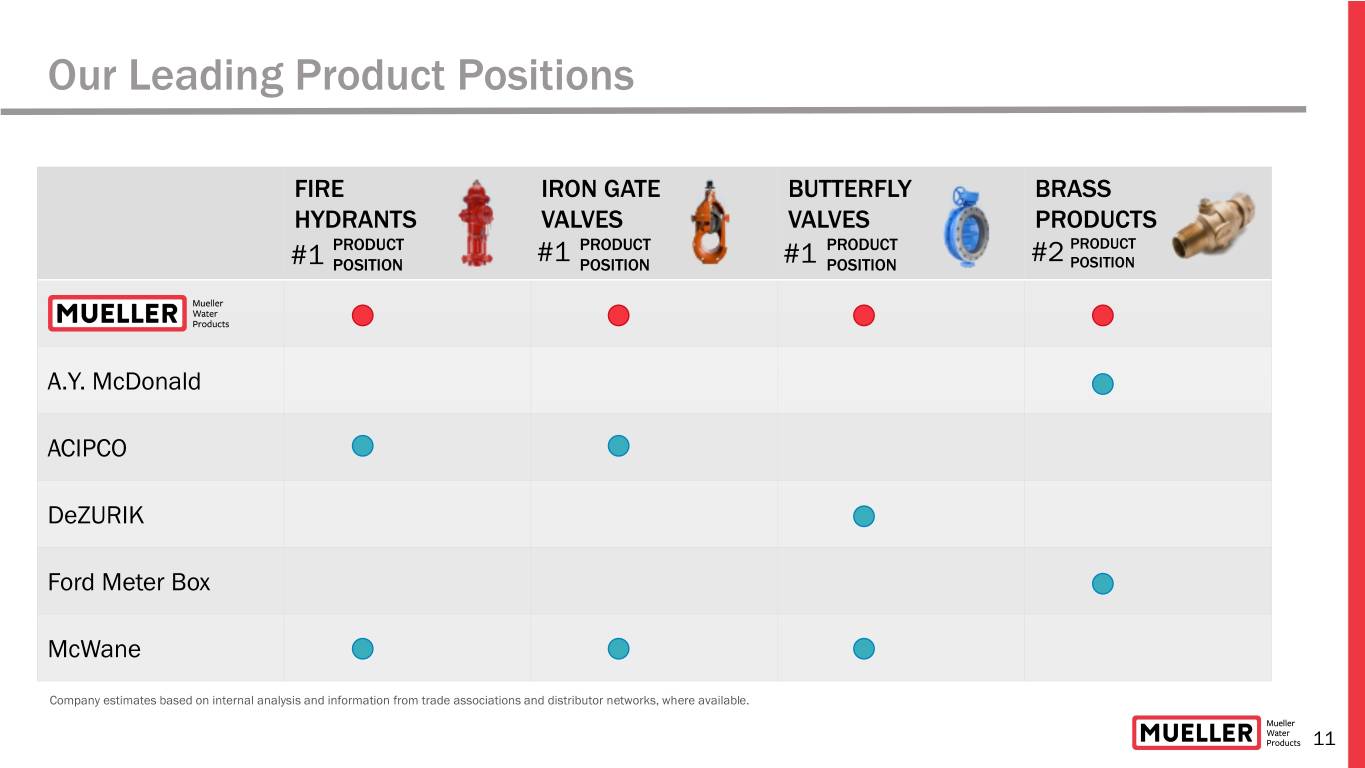
Our Leading Product Positions FIRE IRON GATE BUTTERFLY BRASS HYDRANTS VALVES VALVES PRODUCTS PRODUCT PRODUCT PRODUCT PRODUCT #1 POSITION #1 POSITION #1 POSITION #2 POSITION A.Y. McDonald ACIPCO DeZURIK Ford Meter Box McWane Company estimates based on internal analysis and information from trade associations and distributor networks, where available. 11

Mueller is Uniquely Positioned to Address Opportunities with Utilities with its Leading Infrastructure Products and Installed Base 12
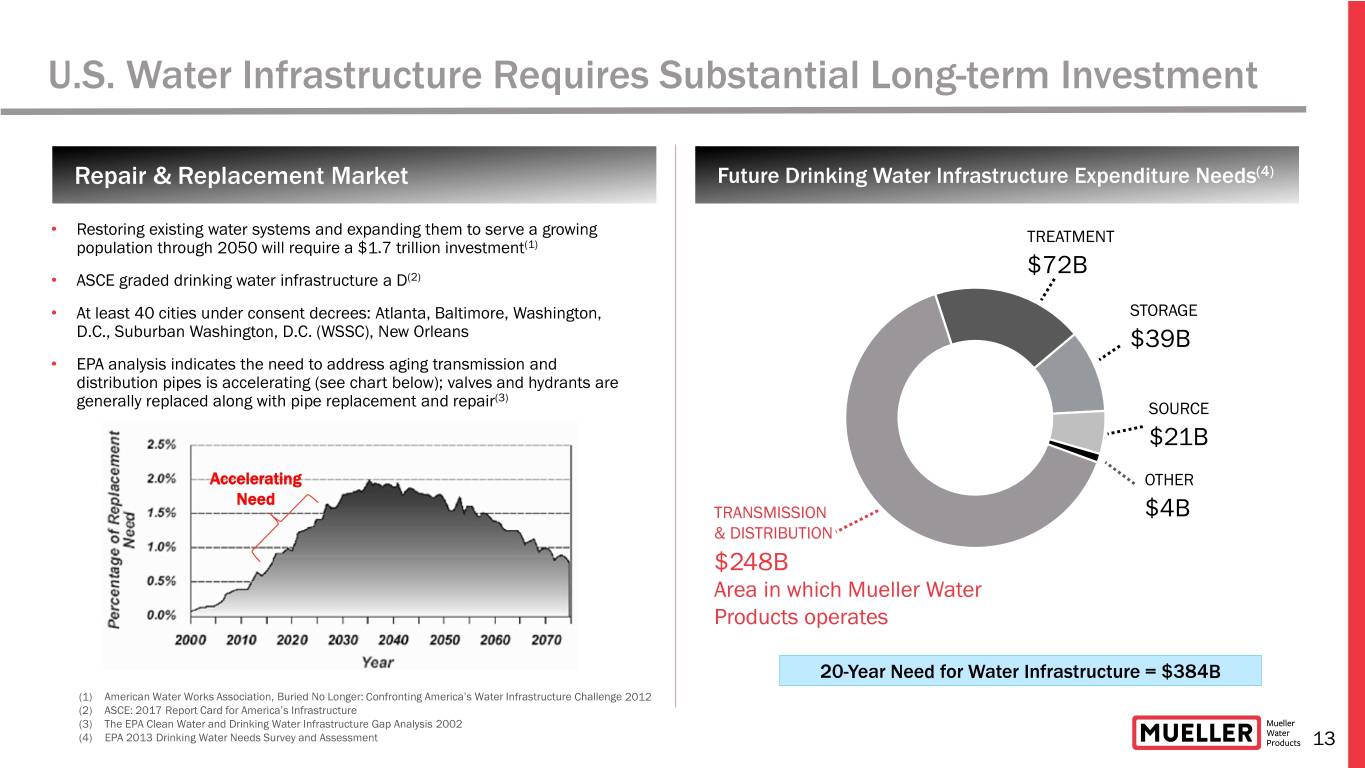
U.S. Water Infrastructure Requires Substantial Long-term Investment Repair & Replacement Market Future Drinking Water Infrastructure Expenditure Needs(4) • Restoring existing water systems and expanding them to serve a growing TREATMENT population through 2050 will require a $1.7 trillion investment(1) $72B • ASCE graded drinking water infrastructure a D(2) • At least 40 cities under consent decrees: Atlanta, Baltimore, Washington, STORAGE D.C., Suburban Washington, D.C. (WSSC), New Orleans $39B • EPA analysis indicates the need to address aging transmission and distribution pipes is accelerating (see chart below); valves and hydrants are (3) generally replaced along with pipe replacement and repair SOURCE $21B Accelerating OTHER Need TRANSMISSION $4B & DISTRIBUTION $248B Area in which Mueller Water Products operates 20-Year Need for Water Infrastructure = $384B (1) American Water Works Association, Buried No Longer: Confronting America’s Water Infrastructure Challenge 2012 (2) ASCE: 2017 Report Card for America’s Infrastructure (3) The EPA Clean Water and Drinking Water Infrastructure Gap Analysis 2002 (4) EPA 2013 Drinking Water Needs Survey and Assessment 13

Funding Water Infrastructure Repair Water Utilities in North America Sources of Funding for U.S. Utilities • >50,000 water utilities and >14,000 wastewater utilities in U.S. • For U.S. utilities, 96% funded at state and local government level(2) (1) and Canada • Majority of utilities have service connection fees and/or capital recovery charges, with median fees of about $6,400(3) • Around 1,100 water utilities, <2.5% of the total, serve (1) • CPI for water and sewerage maintenance increased 3.1% for 12 months ended approximately 60% of the estimated population served (>200M) March 2020(4) • U.S. Federal government provides incentives for water utility projects such as Drinking Water State Revolving Funds (DWSRF) and Water Infrastructure Distribution of Water Utilities in North America(1) Finance and Innovation Act (WIFIA) administered by the Environmental Protection Agency (EPA) Estimated % of (4) Market Tier # Water % of Total Population Population Historical Water Rates vs. Other Utilities (by population served) Utilities Utilities Served Served >250,000 158 0.3% 109.3M 32.1% CPI Utilities 500 (NSA 1982-1984 = 100) 50,000 – 250,000 981 1.9% 93.3M 27.4% 400 3,300 – 50,000 8,725 17.2% 109.9M 32.3% 300 <3,300 40,889 80.6% 27.7M 8.1% 200 100 0 1955 1960 1965 1970 1975 1980 1985 1990 1995 2000 2005 2010 2015 2020 CPI Water CPI Nat Gas CPI Postage CPI Electricity CPI All Items (1) Bluefield Research 2019, Water Industry 4.0 Focus Report (2) RAND Corporation 2017 Report titled “Not Everything is Broken” (3) American Water Works Association 2016 Water and Wastewater Rate Survey (4) Bureau of Labor Statistics as of March 2020 14

After Crisis Need for Digital Water Solutions Expected to Accelerate Bluefield Research April 2020 Note “COVID-19 is an inflection point for long-term resilience, digital transformation of water sector. The U.S. & Canada digital water market is expected to sustain sizeable top-line losses in the immediate aftermath of the COVID-19 outbreak, but the pandemic is ultimately expected to drive greater demand for digital solutions going forward.” Key Drivers for Digital Water Solutions Aging Infrastructure and Non-Revenue Water In this COVID- • Average age of water pipes has increased to 45 years in 2020 from 25 years in 1970 (2) Accelerated scenario, • 240,000 water main breaks per year with 27% increase in break rates since 2012 (3,4) • Up to 30% of treated water is lost or unaccounted for in the water system (5) digital spend grows at a • Growing number of states requiring water loss audits (6) 12-year CAGR of 8.7%, Water Scarcity and Sustainability compared to 6.5%. In • Increased frequency of extreme climate events elevating importance of infrastructure other words, the COVID- resiliency and water management 19 crisis is projected to • 29% of U.S. experiencing drought or abnormally dry conditions (7) • Water scarcity awareness has increased conservation and use of low-flow appliances advance the U.S. &. pressuring utility budgets Canada digital water Population Growth and Consumer Awareness market by at least two to three years by the • Population growth and migration trends leading to increased urbanization (1) • Increasing consumer awareness and demand for water quality and usage information late 2020s. • Need for ongoing monitoring outside of treatment plants and pump stations (1) Bluefield Research Note from April 15, 2020, “Pandemic Represents Watershed Moment for U.S. & Canada Digital Water Market” (2) Bluefield Research 2019, Water Industry 4.0 Focus Report (3) EPA Aging Water Infrastructure Research Program (4) “Water Main Break Rates in the USA and Canada: A Comprehensive Study,” March 2018, Steven Folkman at Utah State University. “Between 2012 and 2018, overall water main break rates increased by 27% from 11.0 to 14.0 breaks/(100 miles)/year (5) Navigant Research (6) National Resource Defense Council 15 (7) U.S. Drought Monitor as of April 28, 2020 (includes contiguous 48 states)

Broad-line of Technology-enabled Products • Currently have a number of products addressing these segments, including Echologics' pipe condition assessment services and fixed leak detection solutions, advanced meters and communication equipment, smart hydrants, pressure and water quality monitors, and most recently, our Sentryx™ software platform Growth vs. Total Digital Current Product Offerings Digital Water Category Water Market (1) Metering & Customer Management − AMR, AMI, Remote Disconnect Meters, Communications Network Management ++ Work & Asset Management + Acoustic Fixed Leak Detection & Pressure Monitoring & Water Quality Pipe Condition Assessment Control Monitoring Plant Management − − − − SentryxTM Information Management ++++ Infrastructure Monitoring Software (1) Bluefield Research 2019, Water Industry 4.0 Focus Report. Estimated CAGR of 6.5% for North American Digital Water Market between 2019 and 2030. 16

Modernizing Manufacturing Facilities • Major projects driving capital spending above historical levels to deliver above-market sales growth by broadening our product capabilities and expand gross margins as we modernize facilities, equipment and processes − In addition to operational efficiencies, modernization efforts will improve our environmental impact as we look to continue to lower the use of resources and manufacturing waste − Three transformational projects forecasted to account for approximately $130 million of capital spending and expected to drive approximately $30 million of annualized incremental gross profit through combination of efficiencies and sales growth, after all are completed Capital Expenditures* ($ in millions) Three Large Projects $120 10.0% Expected 8.9% Project Location Completion( 1) $100 Large Casting Chattanooga, 8.0% 2020 $87 Foundry TN 6.1% $80 $70 - $75 Brass Foundry Decatur, IL >2022 6.0% 4.9% Specialty Valve $60 $56 Kimball, TN 2023 3.9% Manufacturing 4.0% 3.4% Capital Expenditures Capital $40 $41 Expect capital expenditures as a % of We are pushing out some of the capital spending associated with completion of the Decatur brass $32 consolidated net sales to decrease to less than 4% after the completion of 2.0% $20 $27 Sales Net Consolidated of % foundry, which could impact the completion date the new brass foundry in Decatur, IL as well as the timing of the benefits** $0 0.0% FY15 FY16 FY17 FY18 FY19 FY20** (1) Represents timing of full project completion and not timing of full annualized benefit from efficiencies and sales from new products * Consolidated capital expenditures includes Infrastructure, Technologies and Corporate segments. Periods prior to FY18 exclude Anvil. ** Provided with Q2FY20 earnings press release and call on May 4 & 5, 2020. 17

Financial Performance

History of Strong Financial Performance • Over last three years (FY16 to FY19), delivered 6.5% net sales CAGR with 8.3% adjusted EBITDA CAGR • Adjusted EBITDA margin improved 100 bps. over the last three years (FY16 to FY19) Consolidated Net Sales Consolidated Adjusted EBITDA (1) and ($ in millions) Adjusted EBITDA Margin ($ in millions) $1,200 $400 25.0% 20.5% $968 $350 19.5% 19.8% 19.7% $1,000 $916 18.1% 20.0% $793 $801 $826 $300 16.2% $800 14.0% $250 15.0% $198 $180 $600 $200 $164 $143 $156 $150 $127 10.0% $400 $102 $100 $200 5.0% $50 $0 $0 0.0% FY15 FY16 FY17 FY18 FY19 FY13 FY14 FY15 FY16 FY17 FY18 FY19 NOTE: See SEC Filings for Segment Results and Reconciliation of Non-GAAP to GAAP Performance Measures (1) Adjusted EBITDA excludes other charges of $23.8 million in FY2016, $21.2 million in FY2017, $19.7 million in FY2018 and $43.4 million in FY2019. 19
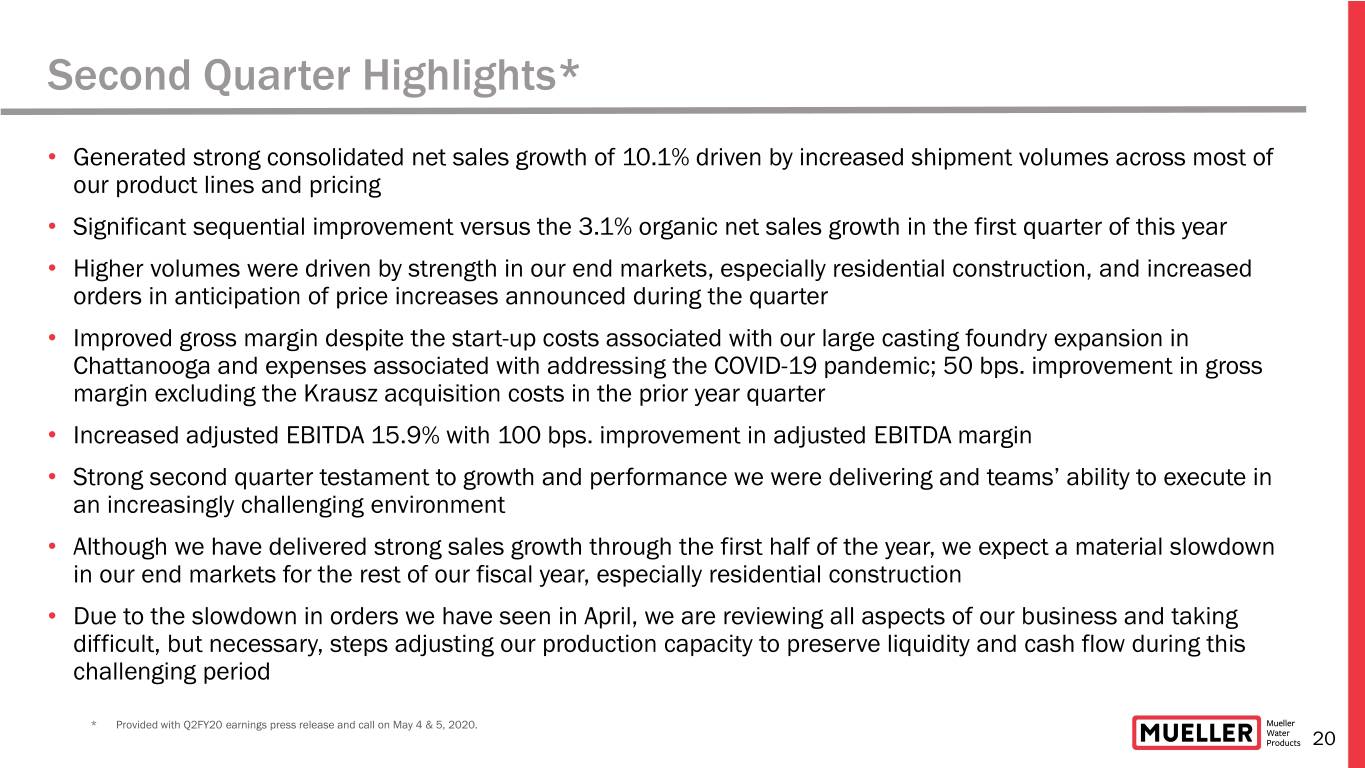
Second Quarter Highlights* • Generated strong consolidated net sales growth of 10.1% driven by increased shipment volumes across most of our product lines and pricing • Significant sequential improvement versus the 3.1% organic net sales growth in the first quarter of this year • Higher volumes were driven by strength in our end markets, especially residential construction, and increased orders in anticipation of price increases announced during the quarter • Improved gross margin despite the start-up costs associated with our large casting foundry expansion in Chattanooga and expenses associated with addressing the COVID-19 pandemic; 50 bps. improvement in gross margin excluding the Krausz acquisition costs in the prior year quarter • Increased adjusted EBITDA 15.9% with 100 bps. improvement in adjusted EBITDA margin • Strong second quarter testament to growth and performance we were delivering and teams’ ability to execute in an increasingly challenging environment • Although we have delivered strong sales growth through the first half of the year, we expect a material slowdown in our end markets for the rest of our fiscal year, especially residential construction • Due to the slowdown in orders we have seen in April, we are reviewing all aspects of our business and taking difficult, but necessary, steps adjusting our production capacity to preserve liquidity and cash flow during this challenging period * Provided with Q2FY20 earnings press release and call on May 4 & 5, 2020. 20
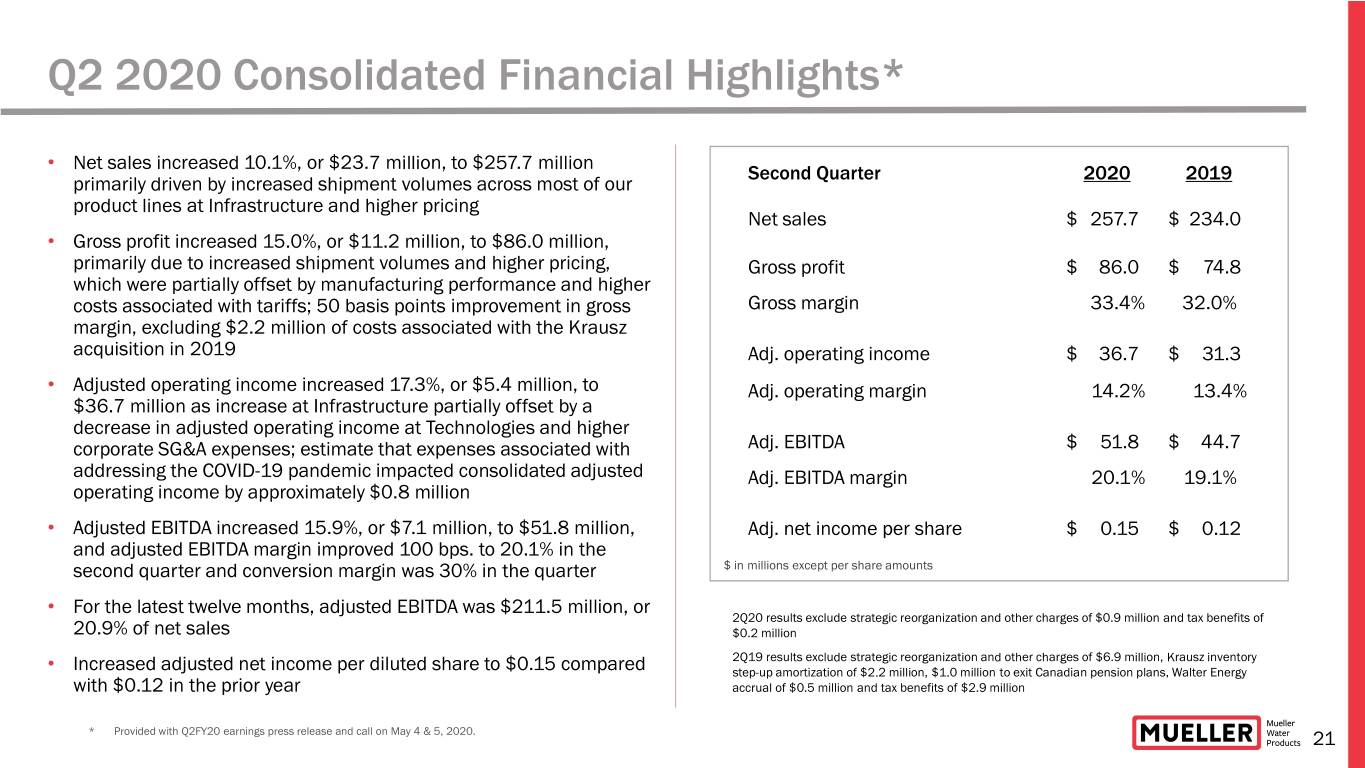
Q2 2020 Consolidated Financial Highlights* • Net sales increased 10.1%, or $23.7 million, to $257.7 million Second Quarter 2020 2019 primarily driven by increased shipment volumes across most of our product lines at Infrastructure and higher pricing Net sales $ 257.7 $ 234.0 • Gross profit increased 15.0%, or $11.2 million, to $86.0 million, primarily due to increased shipment volumes and higher pricing, Gross profit $ 86.0 $ 74.8 which were partially offset by manufacturing performance and higher costs associated with tariffs; 50 basis points improvement in gross Gross margin 33.4% 32.0% margin, excluding $2.2 million of costs associated with the Krausz acquisition in 2019 Adj. operating income $ 36.7 $ 31.3 • Adjusted operating income increased 17.3%, or $5.4 million, to Adj. operating margin 14.2% 13.4% $36.7 million as increase at Infrastructure partially offset by a decrease in adjusted operating income at Technologies and higher corporate SG&A expenses; estimate that expenses associated with Adj. EBITDA $ 51.8 $ 44.7 addressing the COVID-19 pandemic impacted consolidated adjusted Adj. EBITDA margin 20.1% 19.1% operating income by approximately $0.8 million • Adjusted EBITDA increased 15.9%, or $7.1 million, to $51.8 million, Adj. net income per share $ 0.15 $ 0.12 and adjusted EBITDA margin improved 100 bps. to 20.1% in the second quarter and conversion margin was 30% in the quarter $ in millions except per share amounts • For the latest twelve months, adjusted EBITDA was $211.5 million, or 2Q20 results exclude strategic reorganization and other charges of $0.9 million and tax benefits of 20.9% of net sales $0.2 million 2Q19 results exclude strategic reorganization and other charges of $6.9 million, Krausz inventory • Increased adjusted net income per diluted share to $0.15 compared step-up amortization of $2.2 million, $1.0 million to exit Canadian pension plans, Walter Energy with $0.12 in the prior year accrual of $0.5 million and tax benefits of $2.9 million * Provided with Q2FY20 earnings press release and call on May 4 & 5, 2020. 21
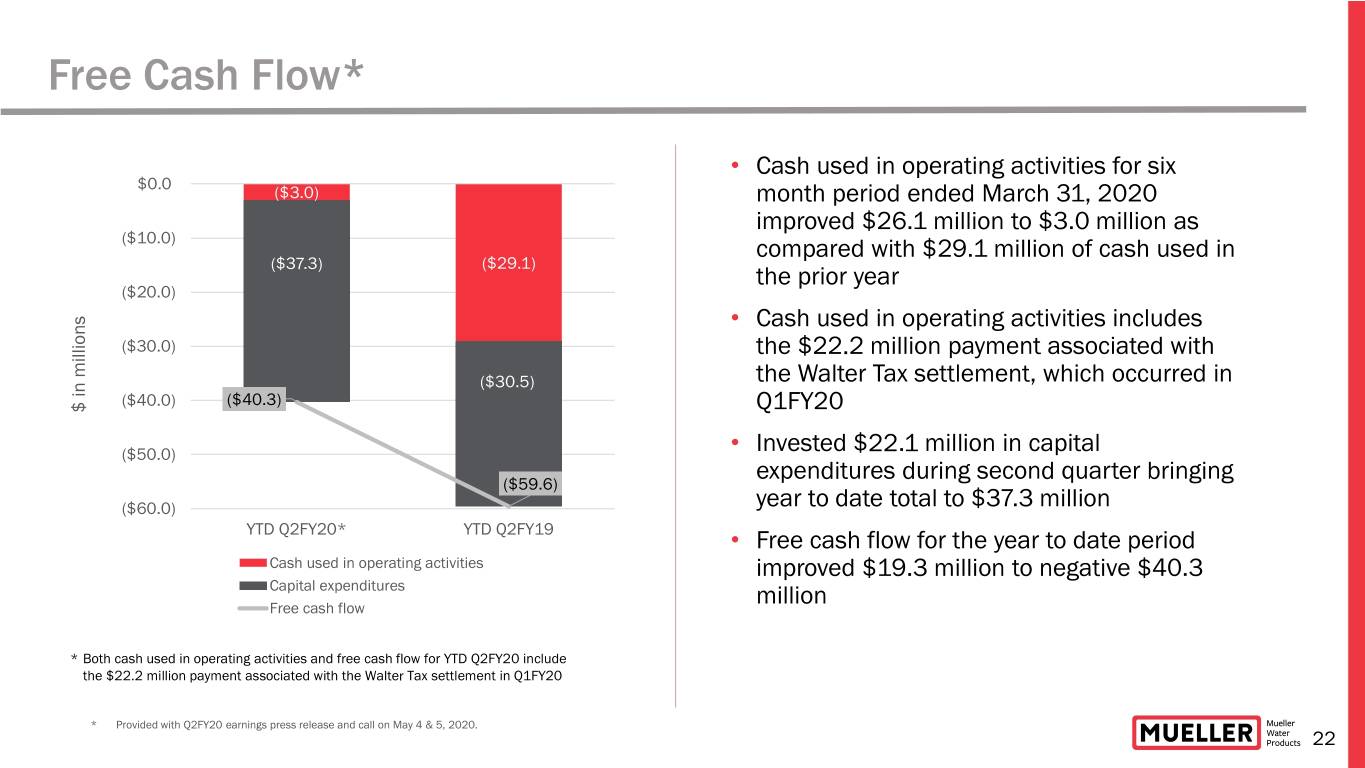
Free Cash Flow* • Cash used in operating activities for six $0.0 ($3.0) month period ended March 31, 2020 improved $26.1 million to $3.0 million as ($10.0) compared with $29.1 million of cash used in ($37.3) ($29.1) the prior year ($20.0) • Cash used in operating activities includes ($30.0) the $22.2 million payment associated with ($30.5) the Walter Tax settlement, which occurred in ($40.0) ($40.3) $ in millions$ in Q1FY20 ($50.0) • Invested $22.1 million in capital ($59.6) expenditures during second quarter bringing ($60.0) year to date total to $37.3 million YTD Q2FY20* YTD Q2FY19 • Free cash flow for the year to date period Cash used in operating activities improved $19.3 million to negative $40.3 Capital expenditures Free cash flow million * Both cash used in operating activities and free cash flow for YTD Q2FY20 include the $22.2 million payment associated with the Walter Tax settlement in Q1FY20 * Provided with Q2FY20 earnings press release and call on May 4 & 5, 2020. 22

Strong Balance Sheet and Liquidity* • Moody’s: Ba2 Corporate Rating, Ba3 Notes Rating, Stable Outlook Credit Rating • S&P: BB Corporate and Notes Ratings, Stable Outlook Debt • $450M of 5.5% Senior Unsecured Notes** • Asset based lending agreement (“ABL”) provides up to $175M revolving credit facility subject to borrowing base Structure (LIBOR + 125 basis points) with none outstanding Net Debt • $336.0M net debt with total debt of $447.3M with cash and cash equivalents of $111.3M Leverage • Net debt leverage was 1.6x at March 31, 2020 • No debt repayments prior to June 2026 Maturities • ABL agreement terminates in July 2021 • Senior Unsecured Notes mature June 2026 • No financial maintenance covenants on Senior Unsecured Notes Financial • ABL agreement not subject to any financial maintenance covenants unless excess availability is less than the Covenants greater of $17.5M and 10% of the Loan Cap; consolidated Fixed Charge Ratio required permitted to be <1x unless threshold is triggered • $111.3M of cash and cash equivalents as of March 31, 2020 Liquidity • $159.0 million of excess availability under the ABL based on March 31, 2020 data Believe We Are Well-Positioned to Face COVID-19 Pandemic Impacts * Provided with Q2FY20 earnings press release and call on May 4 & 5, 2020. ** 5.5% Senior Unsecured Notes include $5.3M of deferred debt issuance costs 23

Balanced and Disciplined Capital Allocation • Given liquidity position on our balance sheet, Cash Allocation since December 31, 2016 our capital allocation priorities, continue to END MARKETS* focus on capital investments and returning $198M to Shareholders cash to shareholders through our quarterly - $98M dividends dividend - $100M share repurchases − Recently approved our quarterly dividend which is Shareholders payable in May 29% • Temporarily suspending our share repurchase program to provide additional flexibility Strategic Investments (1) Balance − Allocated $5 million towards share repurchases 57% Sheet (2) in February prior to the pandemic 14% • Reviewing M&A priorities and anticipate that discussions will continue, but do not expect to $389M to Strategic Investments execute anything in the near term - $216M capital expenditures - $173M acquisitions • Continue to review our overall approach to (1) Includes consolidated capital expenditures and cash paid for acquisition of Krausz Industries and Singer (excludes capital allocation as we learn more about the proceeds from sales of assets) (2) Includes debt retirement and pension plan payments ($35 million pension settlement in Q4FY17 and $2 million to exit length, severity and recovery of the crisis Canadian and multiemployer plans), and includes $22.2 million payment for Walter Tax Settlement 24
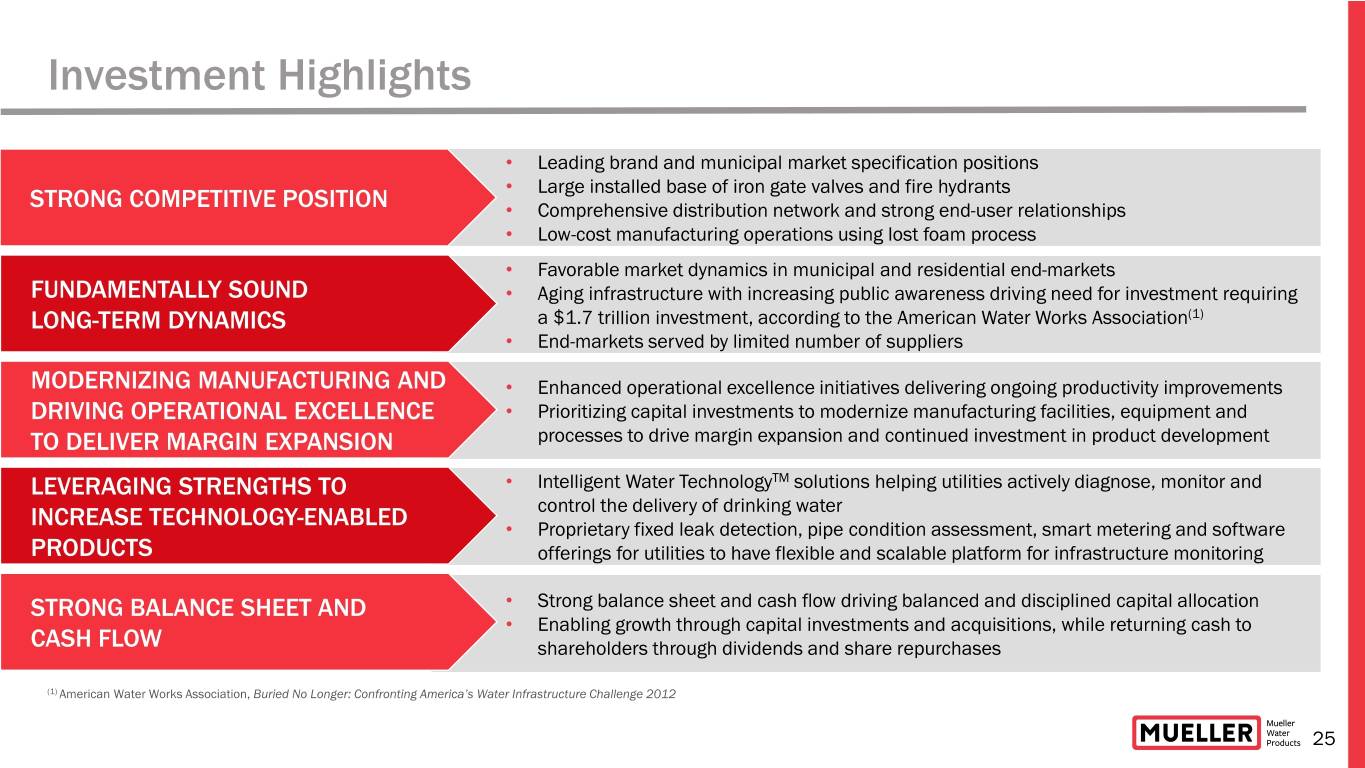
Investment Highlights • Leading brand and municipal market specification positions • Large installed base of iron gate valves and fire hydrants STRONG COMPETITIVE POSITION • Comprehensive distribution network and strong end-user relationships • Low-cost manufacturing operations using lost foam process • Favorable market dynamics in municipal and residential end-markets FUNDAMENTALLY SOUND • Aging infrastructure with increasing public awareness driving need for investment requiring LONG-TERM DYNAMICS a $1.7 trillion investment, according to the American Water Works Association(1) • End-markets served by limited number of suppliers MODERNIZING MANUFACTURING AND • Enhanced operational excellence initiatives delivering ongoing productivity improvements DRIVING OPERATIONAL EXCELLENCE • Prioritizing capital investments to modernize manufacturing facilities, equipment and TO DELIVER MARGIN EXPANSION processes to drive margin expansion and continued investment in product development LEVERAGING STRENGTHS TO • Intelligent Water TechnologyTM solutions helping utilities actively diagnose, monitor and control the delivery of drinking water INCREASE TECHNOLOGY-ENABLED • Proprietary fixed leak detection, pipe condition assessment, smart metering and software PRODUCTS offerings for utilities to have flexible and scalable platform for infrastructure monitoring STRONG BALANCE SHEET AND • Strong balance sheet and cash flow driving balanced and disciplined capital allocation • Enabling growth through capital investments and acquisitions, while returning cash to CASH FLOW shareholders through dividends and share repurchases (1) American Water Works Association, Buried No Longer: Confronting America’s Water Infrastructure Challenge 2012 25
Supplemental Data

Strong Balance Sheet with Significant Flexibility • Reduced debt by $1.1 billion since March 31, 2006 and $650 million since September 30, 2008 • Capital structure and net leverage position provide flexibility to support capital investments, quarterly dividend and acquisitions • Total debt of $447.3 million and cash and cash equivalents of $111.3 million leading to net debt leverage of 1.6x at March 31, 2020 with $159.0 million of excess availability under the ABL based on March 31, 2020 data Total Debt $1,800 ($ in millions) $1,600 $1,549 $1,400 $1,200 $1,127 $1,101 $1,096 $1,000 $740 $800 $692 $678 $623 $601 $541 $600 $489 $484 $481 $445 $446 $447 $400 $200 $0 Mar-06 FY06 FY07 FY08 FY09 FY10 FY11 FY12 FY13 FY14 FY15 FY16 FY17 FY18 FY19 Q2FY20 27
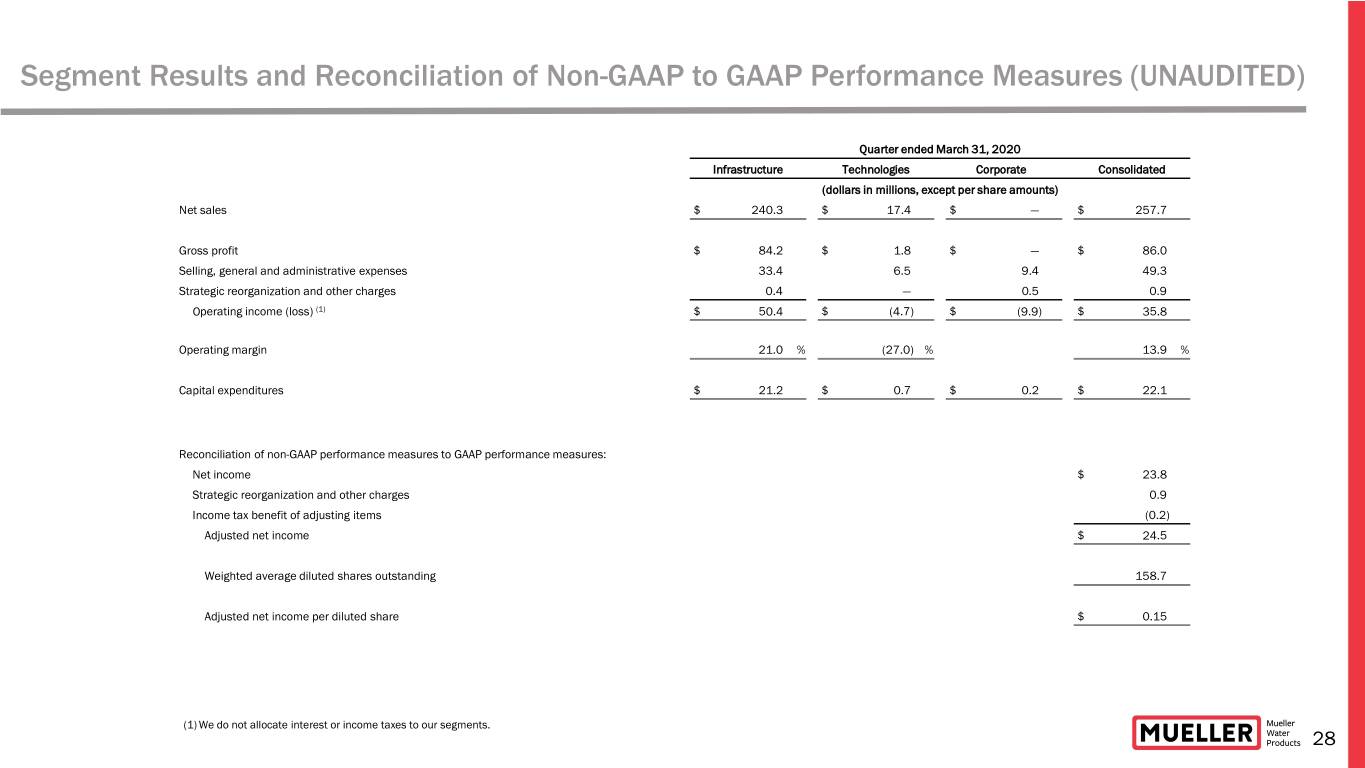
Segment Results and Reconciliation of Non-GAAP to GAAP Performance Measures (UNAUDITED) Quarter ended March 31, 2020 Infrastructure Technologies Corporate Consolidated (dollars in millions, except per share amounts) Net sales $ 240.3 $ 17.4 $ — $ 257.7 Gross profit $ 84.2 $ 1.8 $ — $ 86.0 Selling, general and administrative expenses 33.4 6.5 9.4 49.3 Strategic reorganization and other charges 0.4 — 0.5 0.9 Operating income (loss) (1) $ 50.4 $ (4.7) $ (9.9) $ 35.8 Operating margin 21.0 % (27.0) % 13.9 % Capital expenditures $ 21.2 $ 0.7 $ 0.2 $ 22.1 Reconciliation of non-GAAP performance measures to GAAP performance measures: Net income $ 23.8 Strategic reorganization and other charges 0.9 Income tax benefit of adjusting items (0.2) Adjusted net income $ 24.5 Weighted average diluted shares outstanding 158.7 Adjusted net income per diluted share $ 0.15 (1) We do not allocate interest or income taxes to our segments. 28

Segment Results and Reconciliation of Non-GAAP to GAAP Performance Measures (UNAUDITED) Quarter ended March 31, 2020 Infrastructure Technologies Corporate Consolidated (dollars in millions, except per share amounts) Net income $ 23.8 Income tax expense (1) 6.8 Interest expense, net (1) 6.0 Pension benefit other than service (0.8) Operating income (loss) $ 50.4 $ (4.7) $ (9.9) 35.8 Strategic reorganization and other charges 0.4 — 0.5 0.9 Adjusted operating income (loss) 50.8 (4.7) (9.4) 36.7 Pension benefit other than service — — 0.8 0.8 Depreciation and amortization 12.1 2.1 0.1 14.3 Adjusted EBITDA $ 62.9 $ (2.6) $ (8.5) $ 51.8 Adjusted operating margin 21.1 % (27.0) % 14.2 % Adjusted EBITDA margin 26.2 % (14.9) % 20.1 % Adjusted EBITDA $ 62.9 $ (2.6) $ (8.5) $ 51.8 Three prior quarters’ adjusted EBITDA 185.1 2.6 (28.0) 159.7 Trailing twelve months’ adjusted EBITDA $ 248.0 $ — $ (36.5) $ 211.5 Reconciliation of net debt to total debt (end of period): Current portion of long-term debt $ 1.1 Long-term debt 446.2 Total debt 447.3 Less cash and cash equivalents 111.3 Net debt $ 336.0 Net debt leverage (net debt divided by trailing twelve months’ adjusted EBITDA) 1.6x (1) We do not allocate interest or income taxes to our segments. 29

Segment Results and Reconciliation of Non-GAAP to GAAP Performance Measures (UNAUDITED) Quarter ended March 31, 2019 Infrastructure Technologies Corporate Consolidated (dollars in millions, except per share amounts) Net sales $ 214.1 $ 19.9 $ — $ 234.0 Gross profit $ 71.9 $ 2.9 $ — $ 74.8 Selling, general and administrative expenses 30.7 6.5 8.5 45.7 Strategic reorganization and other charges 1.1 — 5.8 6.9 Operating income (loss) (1) $ 40.1 $ (3.6) $ (14.3) $ 22.2 Operating margin 18.7 % (18.1) % 9.5 % Capital expenditures $ 13.0 $ 1.6 $ — $ 14.6 Reconciliation of non-GAAP performance measures to GAAP performance measures: Net income $ 10.9 Walter Energy Accrual 0.5 Strategic reorganization and other charges 6.9 Exit of pension plan 1.0 Krausz inventory step-up amortization 2.2 Income tax benefit of adjusting items (2.9) Adjusted net income $ 18.6 Weighted average diluted shares outstanding 159.2 Adjusted net income per diluted share $ 0.12 (1) We do not allocate interest or income taxes to our segments. 30

Segment Results and Reconciliation of Non-GAAP to GAAP Performance Measures (UNAUDITED) Quarter ended March 31, 2019 Infrastructure Technologies Corporate Consolidated (dollars in millions, except per share amounts) Net income $ 10.9 Income tax expense (1) 3.9 Interest expense, net (1) 5.9 Walter Energy Accrual 0.5 Pension costs other than service 1.0 Operating income (loss) $ 40.1 $ (3.6) $ (14.3) 22.2 Krausz inventory step-up amortization 2.2 — — 2.2 Strategic reorganization and other charges 1.1 — 5.8 6.9 Adjusted operating income (loss) 43.4 (3.6) (8.5) 31.3 Depreciation and amortization 11.4 1.9 0.1 13.4 Adjusted EBITDA $ 54.8 $ (1.7) $ (8.4) $ 44.7 Adjusted operating margin 20.3 % (18.1) % 13.4 % Adjusted EBITDA margin 25.6 % (8.5) % 19.1 % Adjusted EBITDA $ 54.8 $ (1.7) $ (8.4) $ 44.7 Three prior quarters’ adjusted EBITDA 167.0 (0.2) (23.9) 142.9 Trailing twelve months’ adjusted EBITDA $ 221.8 $ (1.9) $ (32.3) $ 187.6 Reconciliation of net debt to total debt (end of period): Current portion of long-term debt $ 0.8 Long-term debt 444.9 Total debt 445.7 Less cash and cash equivalents 134.3 Net debt $ 311.4 Net debt leverage (net debt divided by trailing twelve months’ adjusted EBITDA) 1.7x (1) We do not allocate interest or income taxes to our segments. 31

Segment Results and Reconciliation of Non-GAAP to GAAP Performance Measures (UNAUDITED) Six months ended March 31, 2020 Infrastructure Technologies Corporate Consolidated (dollars in millions, except per share amounts) Net sales $ 433.1 $ 37.2 $ — $ 470.3 Gross profit 152.4 6.2 — 158.6 Selling, general and administrative expenses 65.9 12.9 20.4 99.2 Strategic reorganization and other charges 0.4 — 2.9 3.3 Operating income (loss) (1) $ 86.1 $ (6.7) $ (23.3) $ 56.1 Operating margin 19.9 % (18.0) % 11.9 % Capital expenditures $ 35.7 $ 1.3 $ 0.3 $ 37.3 Reconciliation of non-GAAP performance measures to GAAP performance measures: Net income $ 34.1 Strategic reorganization and other charges 3.3 Walter Energy Accrual 0.2 Income tax benefit of adjusting items (0.8) Adjusted net income $ 36.8 Weighted average diluted shares outstanding 158.7 Adjusted net income per diluted share $ 0.23 (1) We do not allocate interest or income taxes to our segments. 32

Segment Results and Reconciliation of Non-GAAP to GAAP Performance Measures (UNAUDITED) Six months ended March 31, 2020 Infrastructure Technologies Corporate Consolidated (dollars in millions, except per share amounts) Net income $ 34.1 Income tax expense (1) — Interest expense, net (1) 9.9 Walter Energy Accrual 13.4 Pension benefit other than service 0.2 Operating income (loss) (1.5) Strategic reorganization and other charges $ 86.1 $ (6.7) $ (23.3) 56.1 Adjusted operating income (loss) 0.4 — 2.9 3.3 Pension benefit other than service 86.5 (6.7) (20.4) 59.4 Depreciation and amortization — — 1.5 1.5 Adjusted EBITDA 24.1 4.1 0.1 28.3 $ 110.6 $ (2.6) $ (18.8) $ 89.2 Adjusted operating margin 20.0 % (18.0) % 12.6 % Adjusted EBITDA margin 25.5 % (7.0) % 19.0 % Reconciliation of free cash flow to net cash used in operating activities: Net cash used in operating activities $ (3.0) Less capital expenditures (37.3) Free cash flow $ (40.3) (1) We do not allocate interest or income taxes to our segments. 33

Segment Results and Reconciliation of Non-GAAP to GAAP Performance Measures (UNAUDITED) Six months ended March 31, 2019 Infrastructure Technologies Corporate Consolidated (dollars in millions, except per share amounts) Net sales $ 386.1 $ 40.7 $ — $ 426.8 Gross profit $ 128.7 $ 6.2 $ — $ 134.9 Selling, general and administrative expenses 56.6 13.5 16.6 86.7 Strategic reorganization and other charges 1.1 — 9.0 10.1 Operating income (loss) (1) $ 71.0 $ (7.3) $ (25.6) $ 38.1 Operating margin 18.4 % (17.9) % 8.9 % Capital expenditures $ 27.8 $ 2.7 $ — $ 30.5 Reconciliation of non-GAAP performance measures to GAAP performance measures: Net loss $ (10.1) Walter Energy Accrual 37.9 Strategic reorganization and other charges 10.1 Transition tax benefit (0.6) Discrete tax benefit of Walter Energy Accrual (7.7) Exit of pension plans 1.0 Krausz inventory step-up amortization 2.2 Income tax benefit of adjusting items (2.6) Adjusted net income $ 30.2 Weighted average diluted shares outstanding 157.9 Adjusted net income per diluted share $ 0.19 (1) We do not allocate interest or income taxes to our segments. 34
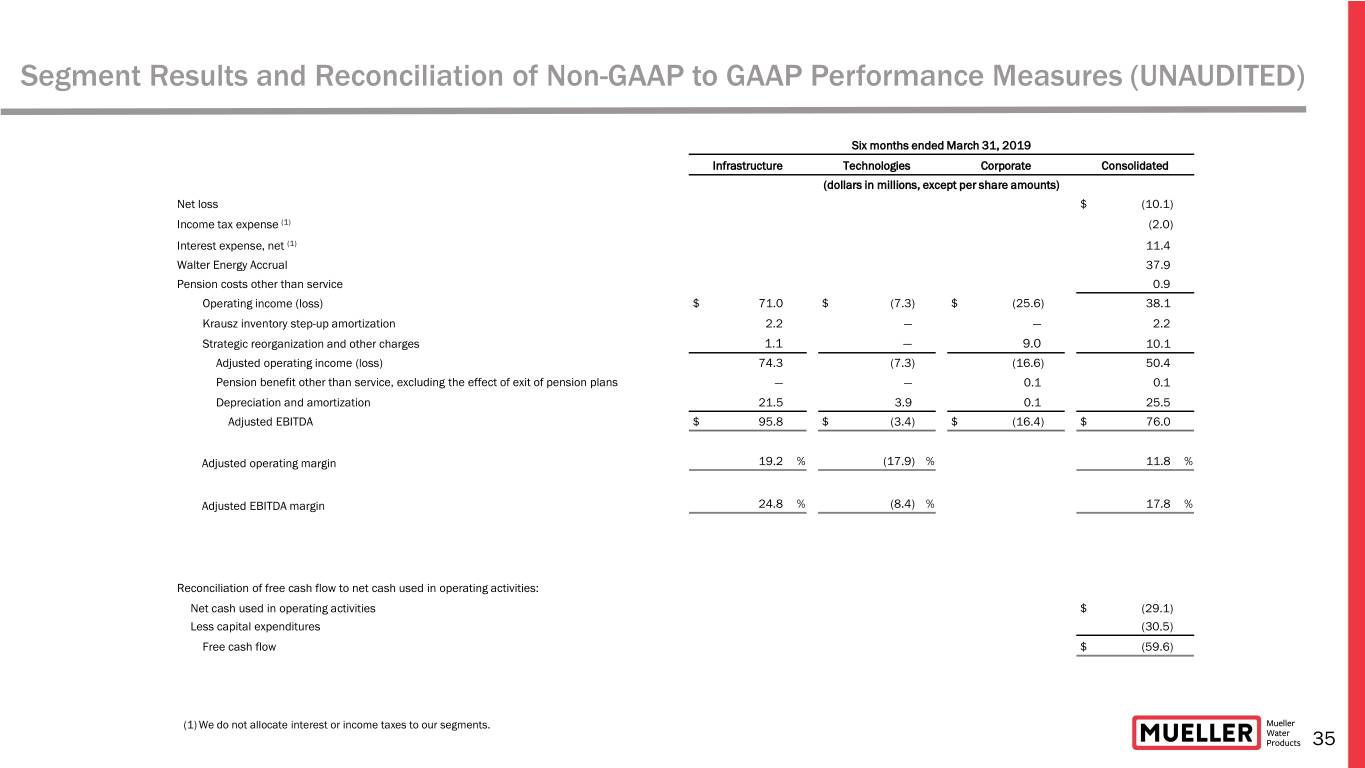
Segment Results and Reconciliation of Non-GAAP to GAAP Performance Measures (UNAUDITED) Six months ended March 31, 2019 Infrastructure Technologies Corporate Consolidated (dollars in millions, except per share amounts) Net loss $ (10.1) Income tax expense (1) (2.0) Interest expense, net (1) 11.4 Walter Energy Accrual 37.9 Pension costs other than service 0.9 Operating income (loss) $ 71.0 $ (7.3) $ (25.6) 38.1 Krausz inventory step-up amortization 2.2 — — 2.2 Strategic reorganization and other charges 1.1 — 9.0 10.1 Adjusted operating income (loss) 74.3 (7.3) (16.6) 50.4 Pension benefit other than service, excluding the effect of exit of pension plans — — 0.1 0.1 Depreciation and amortization 21.5 3.9 0.1 25.5 Adjusted EBITDA $ 95.8 $ (3.4) $ (16.4) $ 76.0 Adjusted operating margin 19.2 % (17.9) % 11.8 % Adjusted EBITDA margin 24.8 % (8.4) % 17.8 % Reconciliation of free cash flow to net cash used in operating activities: Net cash used in operating activities $ (29.1) Less capital expenditures (30.5) Free cash flow $ (59.6) (1) We do not allocate interest or income taxes to our segments. 35

Where Intelligence Meets Infrastructure®
