Attached files
| file | filename |
|---|---|
| 8-K - FORM 8-K - First Northwest Bancorp | fnwb-050520x8k.htm |

2020 ANNUAL MEETING

SAFE HARBOR STATEMENT This presentation contains forward-looking statements within the meaning of the Private Securities Litigation Reform Act of 1995. These statements are based on the current beliefs and expectations of First Northwest Bancorp’s management and on information available to First Northwest Bancorp as of the date of this presentation. It is important to note that these forward-looking statements are not guarantees of future performance and are subject to significant risks and uncertainties, including, but not limited to, the ability of First Northwest Bancorp to implement its business strategy. Actual results may differ from those set forth in the forward-looking statements. Factors that could cause First Northwest Bancorp’s actual results to differ materially from those described in the forward-looking statements can be found in First Northwest Bancorp’s Annual Report on Form 10-K for the year ended December 31, 2018, which has been filed with the Securities and Exchange Commission and is available on the Securities and Exchange Commission’s website (www.sec.gov). First Northwest Bancorp does not undertake to update the forward-looking statements to reflect the impact of circumstances or events that may arise after the date of the forward-looking statements. 2

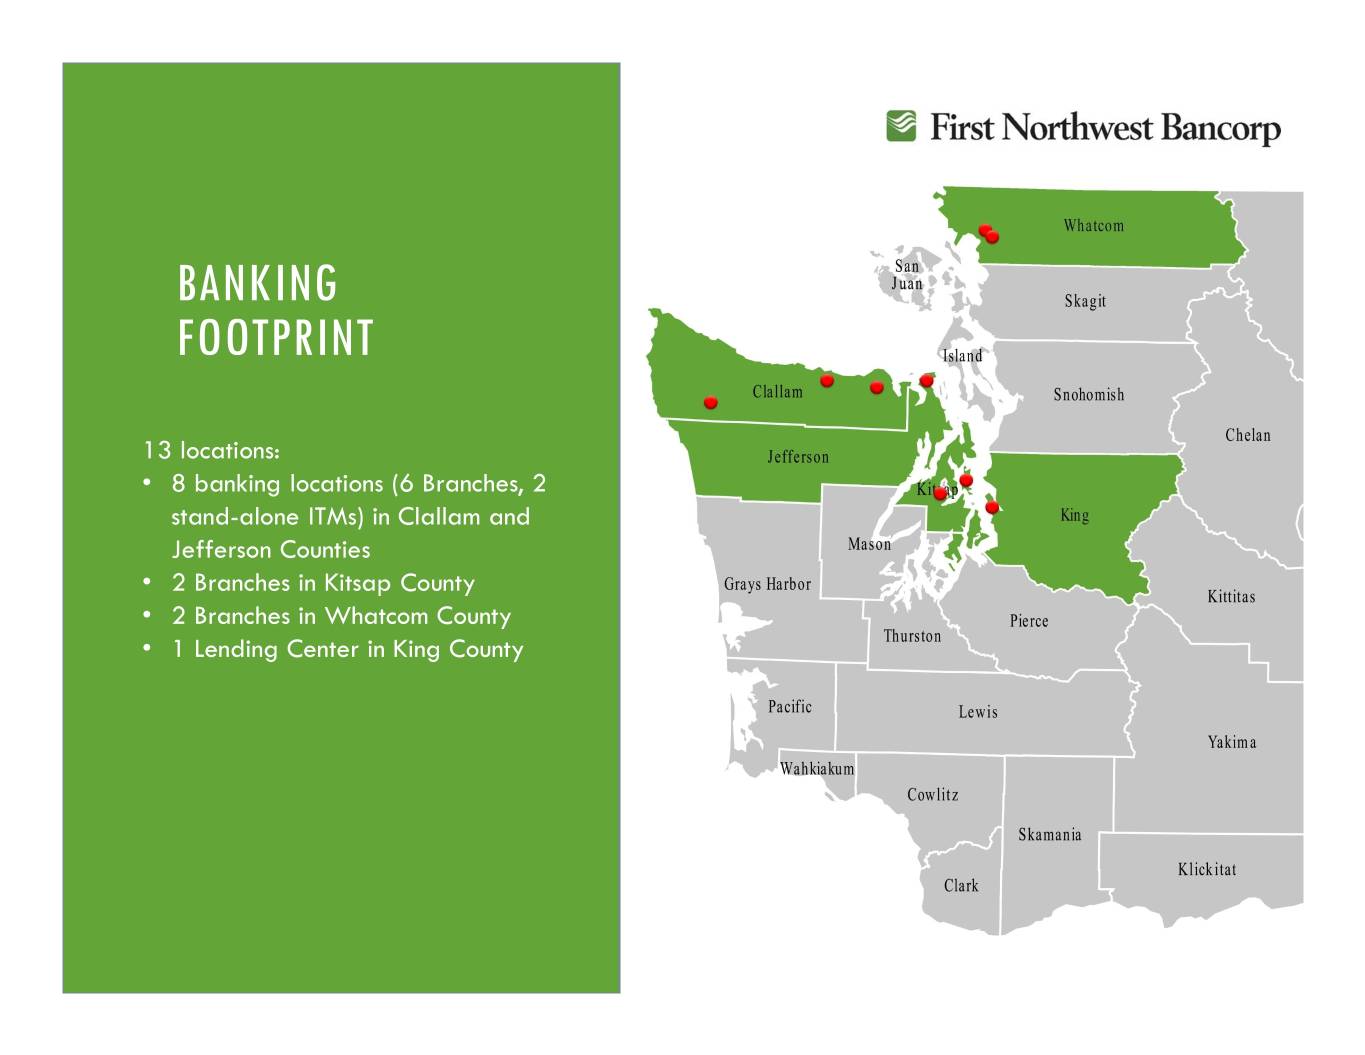
ABOUT FIRST NORTHWEST BANCORP “FNWB” Bank holding company for First Federal, a growing $1.3 billion asset bank headquartered in Port Angeles, Washington First Federal is a Washington state-chartered savings bank, founded in 1923 NASDAQ ticker symbol “FNWB” 13 locations strong: 8 banking locations (including 6 Branches, and 2 stand- alone ITMs) in Clallam and Jefferson Counties, 2 Branches in Kitsap County, 2 Branches in Whatcom County, and a Lending Center in King County # 1 in Deposit Market Share in Clallam and Jefferson Counties Full-service community bank offering consumer, mortgage and commercial solutions 3

EXPERIENCED, BUT #YOUNG, MGMT. TEAM Matt Deines (age 46) • President & CEO of the Bank since August 2019, and President & CEO of the President and Company since December 2019. Former EVP/CFO of Liberty Bank and SFBC Chief Executive Officer • Over 20 years of banking experience (MBA, inactive CPA) Terry Anderson (age 51) • Chief Credit Officer since 2018. Formerly Chief Credit Officer for South Sound Bank EVP/Chief Credit Officer • Over 20 years banking experience (MBA, PCBS Graduate) • Chief HR and Marketing Officer since 2015 Derek Brown (age 49) • EVP/Chief HR & Marketing Officer Over 20 years of banking experience including as an HR and business leader with Citibank (MBA, PCBS Graduate) Geri Bullard (age 55) • Chief Financial Officer since 2020 EVP/Chief Financial Officer • Over 20 years of financial experience as CFO and Controller (CPA, PCBS Graduate) Kelly Liske (age 43) • Chief Banking Officer since 2013 EVP/Chief Banking Officer • Over 20 year of banking experience, including 14 years with FF (PCBS Graduate) • General Counsel and Corporate Secretary since 2017, and Chief Operating Officer Chris Riffle (age 45) since 2018 EVP/Chief Operating Officer/ • Corp. Counsel/Corp. Secretary More than 13 years practicing law (JD), and representing First Federal as outside counsel since 2009 • Chief Lending Officer since 2020. Formerly worked for Key Bank and as CCO of Randy Riffle (age 44) community bank. EVP/Chief Lending Officer • Over 20 years of Community Banking Sales and Credit experience (PCBS Graduate) 4

BANKING BRANCHFOOTPRINT FOOTPRINT •136 locations: branches in Clallam and Jefferson • counties8 banking locations (6 Branches, 2 • 2stand-alone branches in KitsapITMs) Countyin Clallam and • 2 branches in Whatcom county • LendingJefferson center Counties in King county • Total2 Branches of 11 locations in Kitsap County • 2 Branches in Whatcom County • 1 Lending Center in King County 5

COVID – 19 RESPONSE EMPLOYEES CONSUMER/BUSINESS CONSUMER/BUSINESS COMMUNITY Increased Support and New and Existing Credit Meeting Customer Needs: Community Donations: Resources: Programs: Staff redeployed to call Support of state and Daily meetings between CEO SBA PPP loans for businesses centers to support increased community food bank networks and Bank Divisions adversely impacted by call volumes in communities we serve Increased regular pay by $3 COVID-19 All drive-up facilities are open Board, management and per hour for non-exempt Unsecured loans up to $2,500 regular hours employees individually employees for consumers adversely All ITMs/ATMs are accessible contributing as well Provided $500 bonuses for impacted by COVID-19 All lobbies are open by Contribution to Full Circle non-executive exempt Limited underwriting appointment Meals project supporting employees All existing Lines of Credit Digital banking services are veterans and small businesses Flexible employee schedules remain available available 24/7 Contributions to many other Extended employee leave Staff available for customer non-profit organizations in the Reviewed CDC guidelines Forbearance and Modifications: contact via email, chat, mobile communities we serve weekly Follow CARES Act guidelines phone, text messaging Aligned with state and local For both serviced and Work with deposit customers Facilities and ATMs: leaders of communities we portfolio loans to provide access All 10 full-service branches serve Reviewed each request on Increased remote deposit and drive-ups are open an individual basis and card transaction limits regular hours or by Increased Work Flexibility: Offer up to 6 months Relaxed overdraft appointment No reduction in pay or forbearance / collection efforts; provide All 24/7 ATMs fully stocked benefits for the inability to modification options for individual and functioning work due to COVID-19 issues: Leveraging our unique No foreclosures or customer circumstances community banking model to Lack of child-care evictions until further notice Suspended early provide timely and better High-risk health conditions Late charges not assessed withdrawal fees on CDs Flexible with accruals and service to all customers and No adverse credit activity and excess debit fees limits on benefit time communities reported to credit bureaus through June 30, 2020 Work from home available to Follow eligible hardship Other fee refunds over 70% of employees guidelines and directives of considered Cross trained and redeployed Freddie Mac & Fannie Mae Reopen previously closed staff Respond to customer calls / accounts for those No furloughs or layoffs emails within 24 hours receiving federal emergency payments 6

CAPITAL AND LIQUIDITY Tier 1 Common Capital Ratio 15.0% 14.0% 14.2% 14.0% 13.6% 13.5% 13.0% March 31, 2020 12.0% 12.0% 11.0% On Balance Sheet Liquidity 10.0% Cash $ 107,164 9.0% 1Q19 2Q19 3Q19 4Q19 1Q20 Investments $ 317,520 Encumbered ($ 105,613) Tangible Book Value Per Share Unencumbered $ 211,907 $16.60 $16.42 $16.48 $16.40 $16.15 Off Balance Sheet Liquidity $16.20 $16.02 $16.00 FHLB Lines Available $223,663 $15.78 $15.80 FRB of SF Available $ 48,578 $15.60 $15.40 1Q19 2Q19 3Q19 4Q19 1Q20 7

HIGH RISK INDUSTRY CONCENTRATIONS Outstanding Total % of Gross Average Balance Commitment Loans LTV Hospitality $ 49,286,863 $ 53,146,948 5.44% 61.36% Restaurant 2,119,448 2,218,841 0.23% 59.84% Gaming 3,962,884 5,999,994 0.44% 80.00% Travel/Tourism 657,406 687,406 0.07% 43.09% Oil & Gas 216,072 437,572 0.02% 30.10% Total $ 56,242,673 $ 62,490,761 6.21% 62.28% 8

PAYCHECK PROTECTION PROGRAM AND LOAN MODIFICATIONS As of May 4, 2020 First Federal processed approvals for 350 loans through the SBA’s Payroll Protection Program. Total dollars of loans approved were $23.4 million. The average loan amount was $81,000. Through the application process, companies which were approved disclosed over 3,000 jobs which were impacted by the COVID – 19 shutdown. Loan Modifications as of May 4, 2020 Type $ Amount Count Consumer $ 8,734,119 169 Commercial 55,904,227 42 One-to-Four Mortgage 9,939,949 44 Total Modifications $ 74,578,295 255 % of Gross Loans 8.23% 9

STRATEGIES FOR THE COMPANY TODAY Strategic Goals Financial Goals • Enhance Digital Offerings • Leverage/Scale current fixed costs and excess capital • Expand in existing Markets • Generate organic and wholesale growth to increase • Invest in Human Capital NIM and reduce efficiency ratio • Leverage Data to • Increase Return on Equity and Manage Risk and Drive Growth Earnings per Share 10

Will be a 13.5% 88% Loan to three pronged TCE/Assets* Deposit ratio* approach OPPORTUNITY TO LEVERAGE Relationship Digital Wholesale *As of December 31, 2019 11

2019 FINANCIAL HIGHLIGHTS 2019 net income totaled $9.0 million, up from the record of $7.1 million generated in 2018; Basic and diluted earnings per share was $0.91 in 2019, compared to $0.68 for 2018, and $0.46 for 2017; Originated $199.8 million of new loans in 2019, including $58.0 million of one-to-four family mortgage loans which were sold on the secondary market. This compares to $253.4 million originated in 2018. Loans receivable increased 1.7% to $878.4 million at December 31, 2019, compared to $863.9 million at December 31, 2018, primarily due to increases in commercial business loans; Deposits increased 6.5% during the year ended December 31, 2019, reaching $1.0 billion, reflecting growth in various deposit markets; Repurchased 477,837 shares at an average price of $16.36 per share during the year, under its 2017 stock repurchase plan. There were 25,209 shares authorized for repurchase under this plan as of December 31, 2019; and The board of directors approved a new stock repurchase plan of up to 535,097 shares, or approximately 5% of shares outstanding, to commence in 2020 upon completion of the 2017 plan. 12

$1,400 $1,200 $1,000 $800 BALANCE SHEET $600 $400 $200 $- 12/31/15 12/31/16 12/31/17 12/31/18 12/31/19 $ in millions Net Loans Total Deposits Total Assets 13

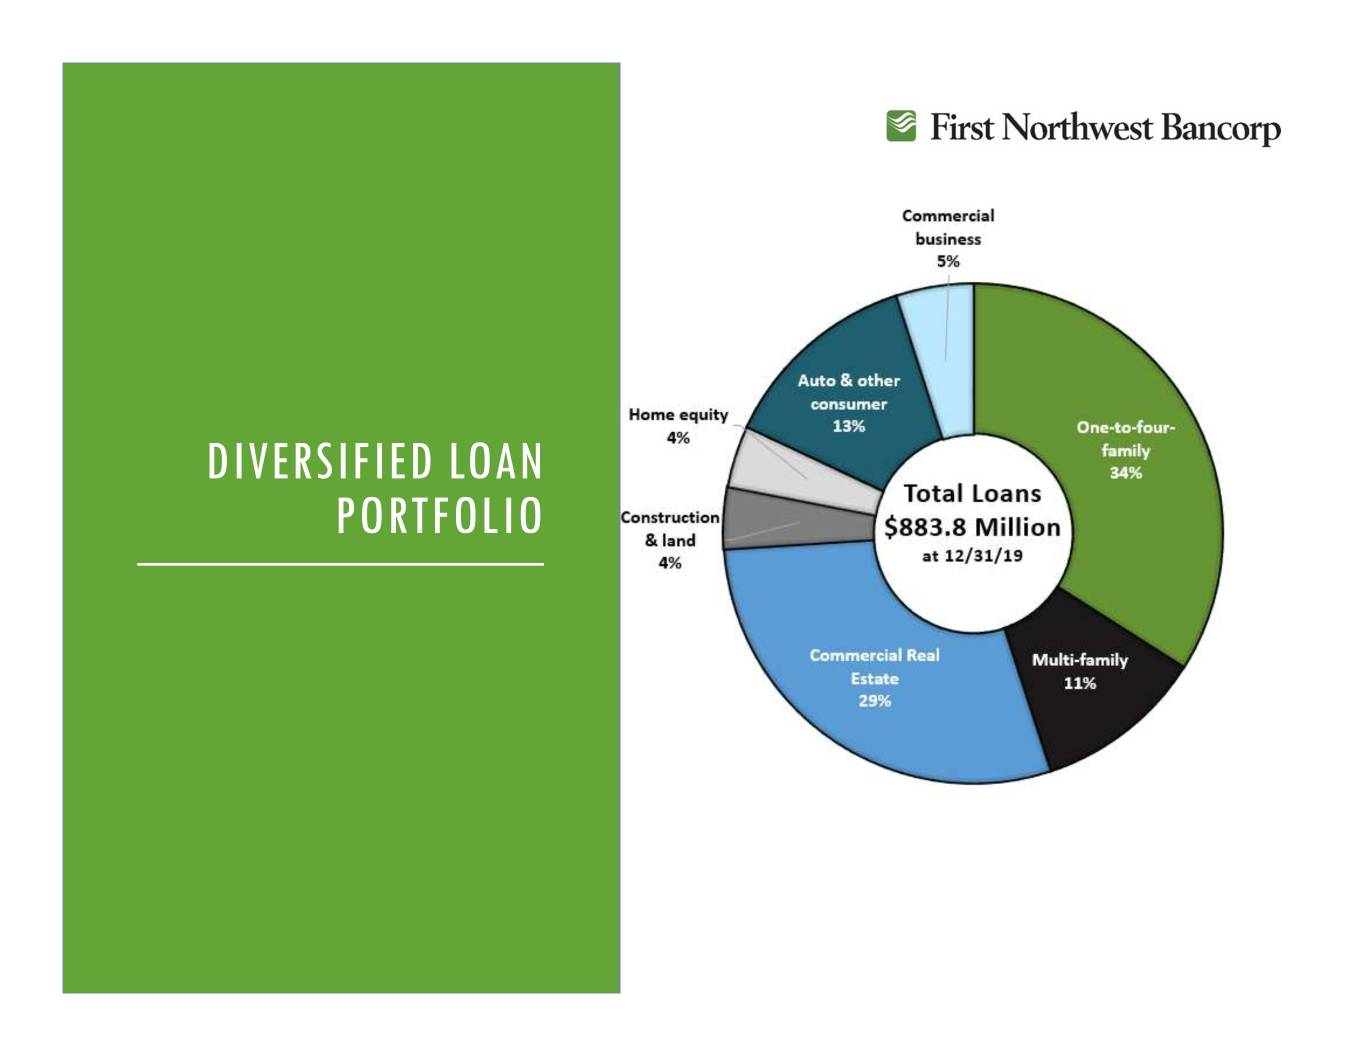
DIVERSIFIED LOAN PORTFOLIO 14

Savings 17% Certificates of Deposit DEPOSIT 31% Total Deposits PORTFOLIO $1.0 Billion at 12/31/19 Transaction Accounts 27% Money Market Accounts 25% 15

DEPOSIT MARKET SHARE Clallam and Jefferson Counties Clallam County 2019 Market RankInstitution (ST) Branches Deposits ($) Share (%) 1 First Northwest Bancorp (WA) 7 661967 35.09 2 Sound Financial Bancorp Inc. (WA) 2 334,492 17.73 3 FS Bancorp Inc. (WA) 2 161,663 8.57 4 Wells Fargo & Co. (CA) 2 149,143 7.91 5 JPMorgan Chase & Co. (NY) 2 140,348 7.44 6 U.S. Bancorp (MN) 2 128,780 6.83 7 Umpqua Holdings Corp. (OR) 2 95,755 5.08 8 KeyCorp (OH) 2 92,288 4.89 9 Olympic Bancorp Inc. (WA) 2 68,593 3.64 10 Washington Federal Inc. (WA) 1 53,654 2.84 Total For Institutions In Market 24$ 1,886,683 Jefferson County 2019 Market Rank Institution (ST) Branches Deposits ($) Share (%) 1First Northwest Bancorp (WA) 1 131,182 21.90 2 Olympic Bancorp Inc. (WA) 3 107,958 18.03 3 FS Bancorp Inc. (WA) 2 103,926 17.35 4 JPMorgan Chase & Co. (NY) 1 73,291 12.24 5 U.S. Bancorp (MN) 2 72,299 12.07 6Wells Fargo & Co. (CA) 1 63,788 10.65 7 Sound Financial Bancorp Inc. (WA) 1 46,457 7.76 Total For Institutions In Market 11$ 598,901 Note: Deposit market share data as of June 30, 2019 16 Source: S&P Global Market Intelligence

DEPOSIT MARKET SHARE Kitsap and Whatcom Counties Kitsap County 2019 Market Rank Institution (ST) Branches Deposits Share (%) 1 Bank of America Corporation (NC) 5 795,492 23.78 2 Olympic Bancorp Inc. (WA) 11 678,868 20.29 3 JPMorgan Chase & Co. (NY) 6 453,154 13.55 4 Wells Fargo & Co. (CA) 5 384,849 11.50 5 Columbia Banking System Inc. (WA) 6 259,135 7.75 6 KeyCorp (OH) 5 145,358 4.35 7 U.S. Bancorp (MN) 4 117,346 3.51 8 Liberty Bay Bank (WA) 1 93,501 2.79 9 Mitsubishi UFJ Financial 1 92,115 2.75 10First Northwest Bancorp (WA) 2 78,755 2.35 Total For Institutions In Market 55$ 3,345,395 Whatcom County 2019 Market RankInstitution (ST) Branches Deposits ($) Share (%) 1 Peoples Bancorp (WA) 9 901,572 21.98 2 Bank of America Corporation (NC) 2 525,304 12.80 3 U.S. Bancorp (MN) 5 382,378 9.32 4 Washington Federal Inc. (WA) 7 375,356 9.15 5 Wells Fargo & Co. (CA) 3 362,855 8.84 6 JPMorgan Chase & Co. (NY) 5 327,011 7.97 7 Banner Corp. (WA) 6 312,517 7.62 8 KeyCorp (OH) 5 285,760 6.97 9 Pacific Financial Corp. (WA) 3 159,442 3.89 10 Heritage Financial Corp. (WA) 2 157,649 3.84 12First Northwest Bancorp (WA) 2 70,562 1.72 Total For Institutions In Market 54$ 4,102,631 Note: Deposit market share data as of June 30, 2019 17 Source: S&P Global Market Intelligence

21.00% 19.77% TANGIBLE 20.00% COMMON EQUITY 19.00% 18.00% 16.95% 17.00% RATIO 16.00% 15.00% 14.56% 14.00% 13.69% 13.53% 13.00% 12.00% 11.00% 10.00% 9.00% 2015 2016 2017 2018 2019 18

TANGIBLE BOOK VALUE PER SHARE 19

RETURN ON ASSETS AND RETURN ON EQUITY ROAA ROAE 0.80% 6.00% 0.72% 5.13% 0.70% 5.00% 0.58% 0.60% 4.09% 4.00% 0.50% 0.41% 0.43% 0.40% 3.00% 2.78% 0.30% 2.09% 2.00% 0.20% 1.00% 0.10% 0.00% 0.00% 2016 2017 2018 2019 2016 2017 2018 2019 20

TRENDS FOR DILUTED EARNINGS PER SHARE (EPS) AND RETURN ON AVERAGE EQUITY (ROAE) EPS ROAE CALENDAR YEAR CALENDAR YEAR 21

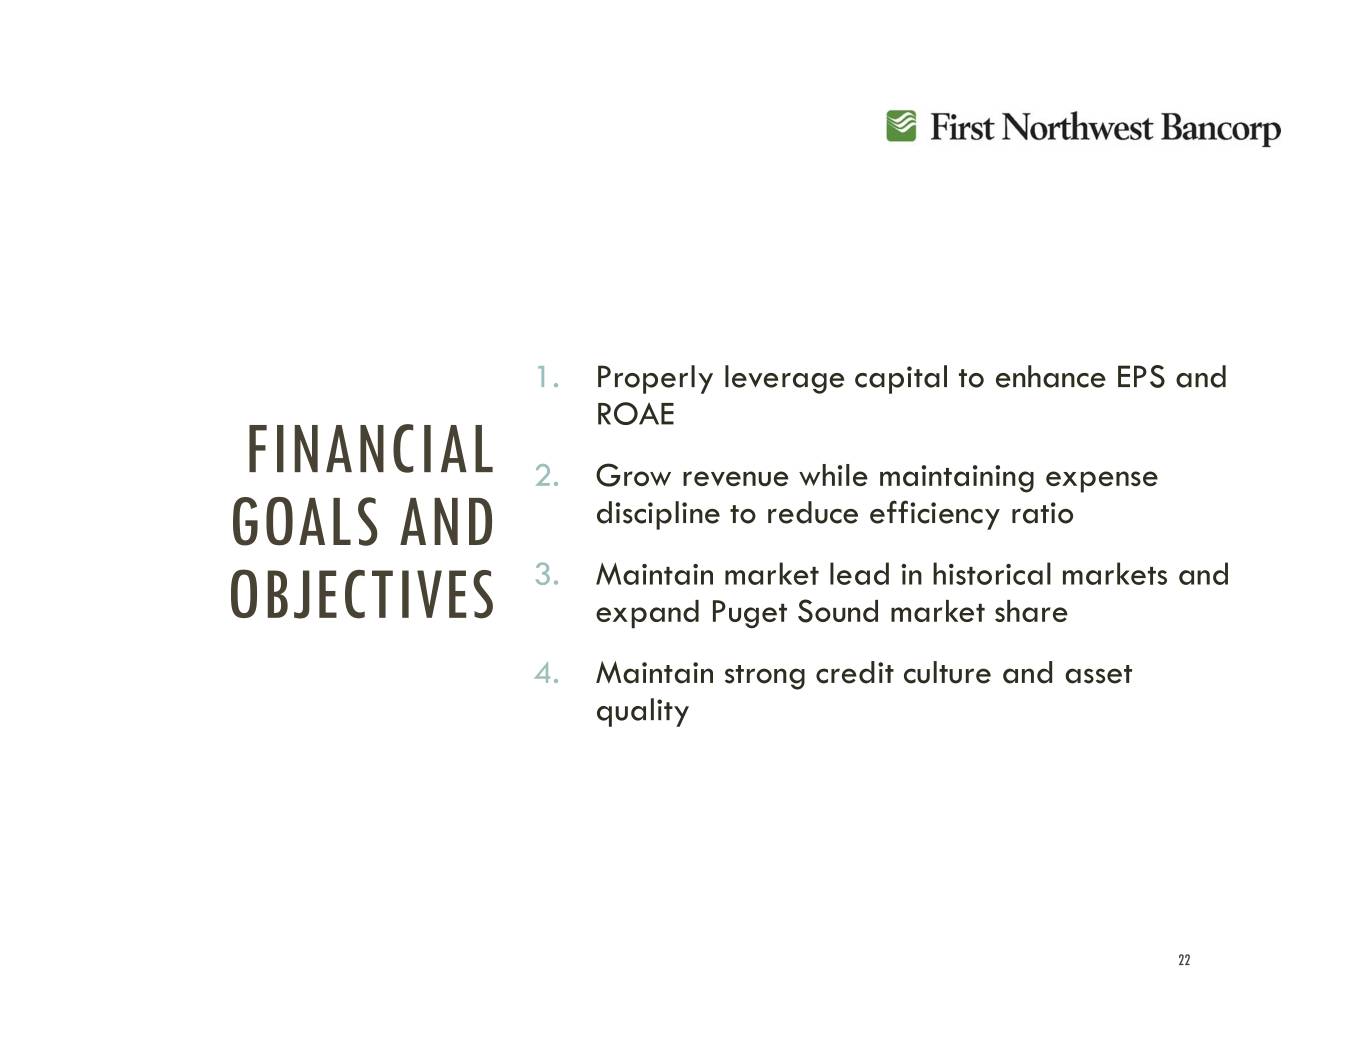
1. Properly leverage capital to enhance EPS and ROAE FINANCIAL 2. Grow revenue while maintaining expense GOALS AND discipline to reduce efficiency ratio 3. Maintain market lead in historical markets and OBJECTIVES expand Puget Sound market share 4. Maintain strong credit culture and asset quality 22

SAFE HARBOR STATEMENT This presentation contains forward-looking statements within the meaning of the Private Securities Litigation Reform Act of 1995. These statements are based on the current beliefs and expectations of First Northwest Bancorp’s management and on information available to First Northwest Bancorp as of the date of this presentation. It is important to note that these forward-looking statements are not guarantees of future performance and are subject to significant risks and uncertainties, including, but not limited to, the abilityQUESTIONS? of First Northwest Bancorp to implement its business strategy. Actual results may differ from those set forth in the forward-looking statements. Factors that could cause First Northwest Bancorp’s actual results to differ materially from those described in the forward-looking statements can be found in First Northwest Bancorp’s Annual Report on Form 10-K for the year ended December 31, 2018, which has been filed with the Securities and Exchange Commission and is available on the Securities and Exchange Commission’s website (www.sec.gov). First Northwest Bancorp does not undertake to update the forward-looking statements to reflect the impact of circumstances or events that may arise after the date of the forward-looking statements. 23
