Attached files
| file | filename |
|---|---|
| EX-99.2 - EXHIBIT 99.2 - Fastly, Inc. | ex992-fslypressrelease33120.htm |
| 8-K - 8-K - Fastly, Inc. | fsly-8xkx33120.htm |
Exhibit 99.1

Exhibit 99.1
Strong Business Fundamentals Supplemented by High Internet Usage
Revenue up 38% Year-over-Year; Raised Guidance
Q1 2020 Highlights:
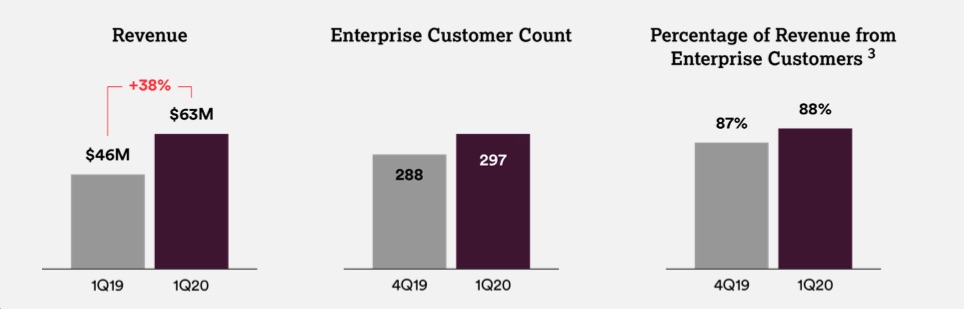
• | Strong top-line growth with revenue of $63 million, up 38% year-over-year |
• | Dollar-Based Net Expansion Rate (DBNER) of 133%1 |
• | Net Retention Rate (NRR), which includes the impact of churn, of 130%2 |
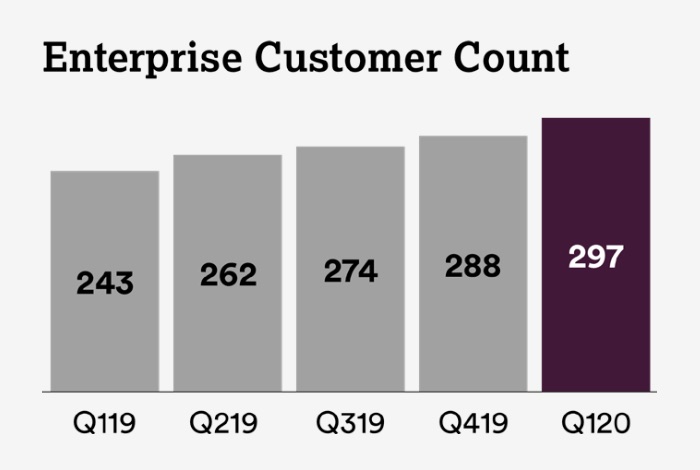
• | Total enterprise customer count of 297, up from 288 in Q4 2019 |
• | Average enterprise customer spend of approximately $642,000, up from $607,000 in Q4 20193 |
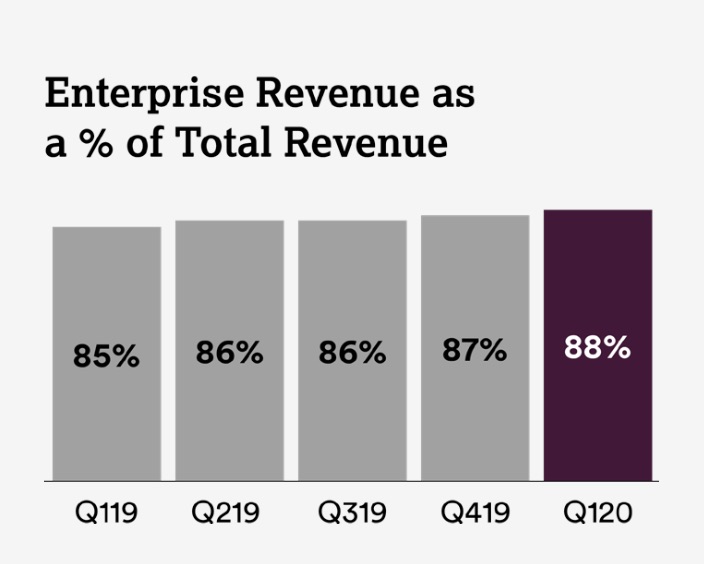
• | Enterprise customers generated 88% of our trailing twelve-month total revenue, up from 87% in Q4 2019 |
• | GAAP gross margin of 56.7%, consistent with Q1 2019; non-GAAP gross margin, which excludes stock-based compensation, of 57.6% up from 57.0% in Q1 20194 |
• | GAAP operating loss of $12 million, compared to GAAP operating loss of $8 million for Q1 2019; non-GAAP operating loss of $6 million, compared to non-GAAP operating loss of $7 million for Q1 20194 |
• | GAAP basic and diluted net loss per share of $0.13, compared to GAAP basic and diluted net loss per share of $0.38 for Q1 2019; non-GAAP basic and diluted net loss per share of $0.064, compared to $0.30 for Q1 2019 |
• | Capital expenditures5 of $11.7 million, or 19% of revenue |
• | Raised full-year 2020 guidance |
__________
1We calculate Dollar Based Net Expansion Rate by dividing the revenue for a given period from customers who remained customers as of the last day of the given period (the “current” period) by the revenue from the same customers for the same period measured one year prior (the “base” period). The revenue included in the current period excludes revenue from (i) customers that churned after the end of the base period and (ii) new customers that entered into a customer agreement after the end of the base period.
2 Net Retention Rate measures the net change in monthly revenue from existing customers in the last month of the period (the “current" period month) compared to the last month of the same period one year prior (the “prior" period month”). The revenue included in the current period month includes revenue from (i) revenue contraction due to billing decreases or customer churn, (ii) revenue expansion due to billing increases, but excludes revenue from new customers. We calculate Net Retention Rate by dividing the revenue from the current period month by the revenue in the prior period month.
Our LTM Net Retention Rate, intended to be supplemental to our Net Retention Rate, was 129% for the period ended March 31, 2020. We calculate LTM Net Retention Rate by dividing the total customer revenue for the prior twelve month period (“prior 12-month period”) ending at the beginning of the last twelve month period (“LTM period”) minus revenue contraction due to billing decreases or customer churn, plus revenue expansion due to billing increases during the LTM period from the same customers by the total prior 12-month period revenue. We believe the LTM Net Retention Rate is supplemental as it removes some of the volatility that is inherent in a usage-based business model.
3 Calculated based on trailing twelve-months.
4 For a reconciliation of non-GAAP financial measures to their corresponding GAAP measures, please refer to the reconciliation table at the end of this letter.
5 Capital Expenditures are defined as cash used for purchases of property and equipment and capitalized internal-use software, as reflected in our statement of cash flows.
Exhibit 99.1
To Our Shareholders,
Q1 2020 marks my first quarter as CEO of Fastly – and what a quarter it has been. I stepped into the role in February, in somewhat different times, with a very different view of how these first few months would play out. Since then, the COVID-19 pandemic has changed a great deal throughout the U.S. and the world. I want to start by saying that our thoughts are with those dealing directly with COVID-19, including the health care workers, those directly impacted and those who provide essential services. These are truly unprecedented times and it’s heartwarming to see the world come together to take widespread, drastic action to slow the spread of the virus.
At Fastly, we continue to monitor the situation closely and are focused on the health and safety of our customers, employees, partners, and communities. Our number one priority is to continue to provide scalable, reliable and secure digital experiences to our customers who are relying on us now more than ever, while also providing a safe work environment for our employees and supporting those around us.
• | We protected our employees and community by shifting to a fully remote workforce on March 1, and suspended all non-essential travel. Due to our existing flexible work policy, a large portion of our global workforce was already working remotely, which allowed a seamless transition; |
• | We applied additional resources toward ensuring the health and reliability of our network by increasing monitoring, refining capacity planning, and adding redundancy to our supply chain; and |
• | We are actively supporting our communities by doubling our Open Source and Nonprofit program to provide $50 million of free Fastly services to organizations doing good around the world, and contributed to public health organizations fighting the virus. |
Our platform plays an important role in providing stability and support to tens of thousands of websites that deliver news, connections, commerce, and entertainment for billions of users around the world. We are standing behind the best of the web, supporting and securing the websites and content of our communities, our families, and our economy. And while there is still much to do, I'm incredibly proud of the efforts across the entire company, as we continue to build and maintain our infrastructure and provide frictionless services to all our customers. Our network is designed to handle spikes in traffic and continues to perform well with no impact on its security and performance. Beyond that, as we collectively navigate these uncertain times, we are humbled that our technology also supports our customers, partners, and friends that are stepping up for their communities. They show us what it means to be the web at its best.
Turning to the quarter -- we delivered solid results. We generated $63 million in revenue, up 38% year-over-year, and increased our enterprise customer count to 297 from 288 in the previous quarter. We continued to drive expansion within our customer base with a DBNER of 133% and our average enterprise customer spend continued to increase to $642,000 from $607,0001 in the previous quarter. These results were primarily driven by continued strong business fundamentals and further adoption of our edge cloud platform by enterprise organizations across multiple verticals and geographies, including high margin verticals such as FinTech and ecommerce. Additionally, this momentum was supplemented by increased internet usage as social distancing measures were implemented in the second half of March. Suffice it to say, the internet and our business are thriving, in part due to our ability to serve as a trustworthy partner for innovative enterprises around the globe.
Fastly is the platform of choice for innovators. We partner with the most technologically advanced and creative companies who we believe will not only weather this storm, but will continue to thrive in this environment. Companies are increasingly recognizing the importance of digital transformation, not only to survive during these uncertain times, but also for long-term success. As we are seeing this trend accelerate and evolve, we believe we are best positioned to partner and grow with these companies as they look for a trustworthy and modern platform. For these reasons, we are even more inspired as we continue building and investing in our network and offerings.
__________
1Calculated based on trailing twelve-months.
Exhibit 99.1
Despite the current global economic uncertainty, we remain confident in the demand for our mission-critical services and the continued growth of our business in 2020 and the years to come. As such, we have raised guidance for 2020 and expect to make further progress on our path to profitability.
Exhibit 99.1
Learning about Innovation on Compute@Edge
More of our customers are using Compute@Edge through our beta program, and developing remarkable new use cases for serverless technology. We are on track and expect to expand its availability in the second half of the year. The majority of serverless use cases previously were batch processing-focused, while Compute@Edge finally provides a near real-time data path serverless solution for mission-critical and performance-sensitive applications.
Through our beta program, we’ve been learning from our customers as they experiment with a whole new area of serverless applications, and it’s been inspiring to see the host of innovative use cases that we’re enabling. Some customers are building elaborate content transformation solutions at the edge, including digital encryption and signing for more advanced cryptographic use cases. Some are starting to build edge authentication/ authorization and identity enforcement solutions to enhance their single- sign on deployments. One of our ecommerce customers is developing an enterprise wide data loss and protection solution for all of their web applications and API’s. Compute@Edge is enabling one of our high-tech customers to run advanced machine learning models at the edge. We’re extremely excited about what the Compute@Edge beta program has accomplished thus far, and we look forward to providing more updates next quarter.
Driving Sustainable Growth by Focusing on Enterprise
Enterprise customers continue to be our primary revenue and growth driver, generating 88% of our trailing twelve-month revenue for the calendar year. We are focused on partnering with large companies that have the capability and available budget to increase engagement on our platform, and ultimately transition into enterprise customer status (defined as customers that spend $100,000 or more in a twelve month period). In addition to these customers having the quickest ramp in usage and the highest demand for ancillary products and features, they’re also more likely to provide us with a certain degree of visibility and stability relative to other market segments in uncertain times.
During the first quarter of 2020, our enterprise customer count increased to 297, up from 288 in the previous quarter. This increase was driven by new large customers, as well as existing customers that expanded their usage of the platform. While enterprise customer count can be impacted by a number of factors that affect their level of spending, including customer consolidation and usage variations, we were pleased to see a net increase in the number of customers that achieved enterprise status.
Exhibit 99.1
We’ve continued to attract and win new enterprise business across multiple verticals and geographies, especially in higher margin verticals such as FinTech and ecommerce. For example, in the first quarter we signed a new deal with Affirm, a fast-growing FinTech company. They chose our high performance WAF offering to protect payment APIs and leverage Fastly’s Shielding, which includes origin offload features, and high-performance delivery to ensure great customer experience during payment transactions.
We are beginning to witness a digital transformation acceleration across various industries due to secular trends and impacts from events such as COVID-19. Our superior, modern cloud platform plays an even more important role than before as companies look to transform their business models for growth and viability. For example, we recently signed a new deal with Neiman Marcus, a major luxury retailer. They chose Fastly to provide security and edge delivery for all five of their online properties and brands. As they accelerate their digital transformation, they are relying on Fastly to deliver meaningful digital shopping experiences to their luxury customers.
Many of our enterprise customers have numerous subsidiaries, which offer significant land and expand opportunities. For example, in Q1 2020, we won additional business with one of the world's largest ecommerce platforms. This customer is leveraging Fastly's edge application delivery and Instant Purge capabilities to increase performance on several key properties. In addition to our many Edge Features, this customer chose Fastly because of our unique approach to edge compute.
In addition to expanding our enterprise customer base, we are also focused on expanding our existing enterprise customers’ engagement. For the first quarter, average enterprise customer spend increased to $642,000 from $607,0001 in the previous quarter. The increase in spending is driven by usage on our platform and further adoption of optimization and security products such as Media Shield, Cloud Optimizer, WAF, and our TLS services.
In Q1 2020, our total customer count also increased to 1,837, up from 1,743 in the previous quarter. We are seeing the results of our investments that were made in 2019 in our demand generation, sales, and marketing teams.
__________
1Calculated based on trailing twelve-months.
Exhibit 99.1
Continued Strong Customer Base Expansion
Our customer base continues to expand its usage of our platform which is reflected in our strong Dollar-Based Net Expansion Rate1 (DBNER) of 133% in Q1 2020. DBNER measures the change in revenue from existing customers on our platform over a twelve-month period, excluding the effect of new and churned customers. As we’ve said in the past, we expect DBNER to decrease over time as customers continue to expand their usage and become a larger portion of both our total customer base and the revenue that we use to calculate DBNER, which is what we saw this quarter. As we continue to deliver strong revenue growth, we are pleased with the strong continued expansion of our growing customer base as well as the accelerated usage ramp among newer customers.
In Q1 2020, many of our platform partners providing SaaS and PaaS services have continued to build on Fastly. They continued to add new products and services to their portfolios leveraging Fastly's edge application logic and security products to accelerate their time to market and customer adoption. Specifically, partners such as Mux, an API driven video analytics and products company, Pantheon, a web operations platform designed to give marketers and developers the agility and control to win in the dynamic world of digital marketing, and GitHub, a community of 40 million developers, continue to drive adoption by increasing velocity for their customers, enabling digital transformation and empowering developers with greater agility and efficiency. We’re also seeing social media, streaming, and news sites increase their reliance on our platform as the global pandemic resulted in people sheltering in place and therefore, consuming and sharing more content over the internet.
We further demonstrated the stickiness of our edge cloud platform with a Net Retention Rate2 (NRR) of 130% in Q1 2020. NRR measures the net change in monthly revenue from existing customers in the last month of the period compared to the last month of the same period one year prior, and includes revenue contraction due to billing decreases or customer churn, revenue expansion due to billing increases, but excludes revenue from new customers.
__________
1We calculate Dollar Based Net Expansion Rate by dividing the revenue for a given period from customers who remained customers as of the last day of the given period (the “current” period) by the revenue from the same customers for the same period measured one year prior (the “base” period). The revenue included in the current period excludes revenue from (i) customers that churned after the end of the base period and (ii) new customers that entered into a customer agreement after the end of the base period.
2 Net Retention Rate measures the net change in monthly revenue from existing customers in the last month of the period (the “current" period month) compared to the last month of the same period one year prior (the “prior" period month”). The revenue included in the current period month includes revenue from (i) revenue contraction due to billing decreases or customer churn, (ii) revenue expansion due to billing increases, but excludes revenue from new customers. We calculate Net Retention Rate by dividing the revenue from the current period month by the revenue in the prior period month.
Our LTM Net Retention Rate, intended to be supplemental to our Net Retention Rate, was 129% for the period ended March 31, 2020. We calculate LTM Net Retention Rate by dividing the total customer revenue for the prior twelve month period (“prior 12-month period”) ending at the beginning of the last twelve month period (“LTM period”) minus revenue contraction due to billing decreases or customer churn, plus revenue expansion due to billing increases during the LTM period from the same customers by the total prior 12-month period revenue. We believe the LTM Net Retention Rate is supplemental as it removes some of the volatility that is inherent in a usage-based business model.
Exhibit 99.1
Investing in Our Edge Cloud Platform
Unlike legacy CDNs that focus on delivering only basic functions, content, and network volume, we believe the modern architecture of our edge cloud platform allows us to meet the compute and performance requirements of today’s data-rich applications and the demands of the agile developers who build them.
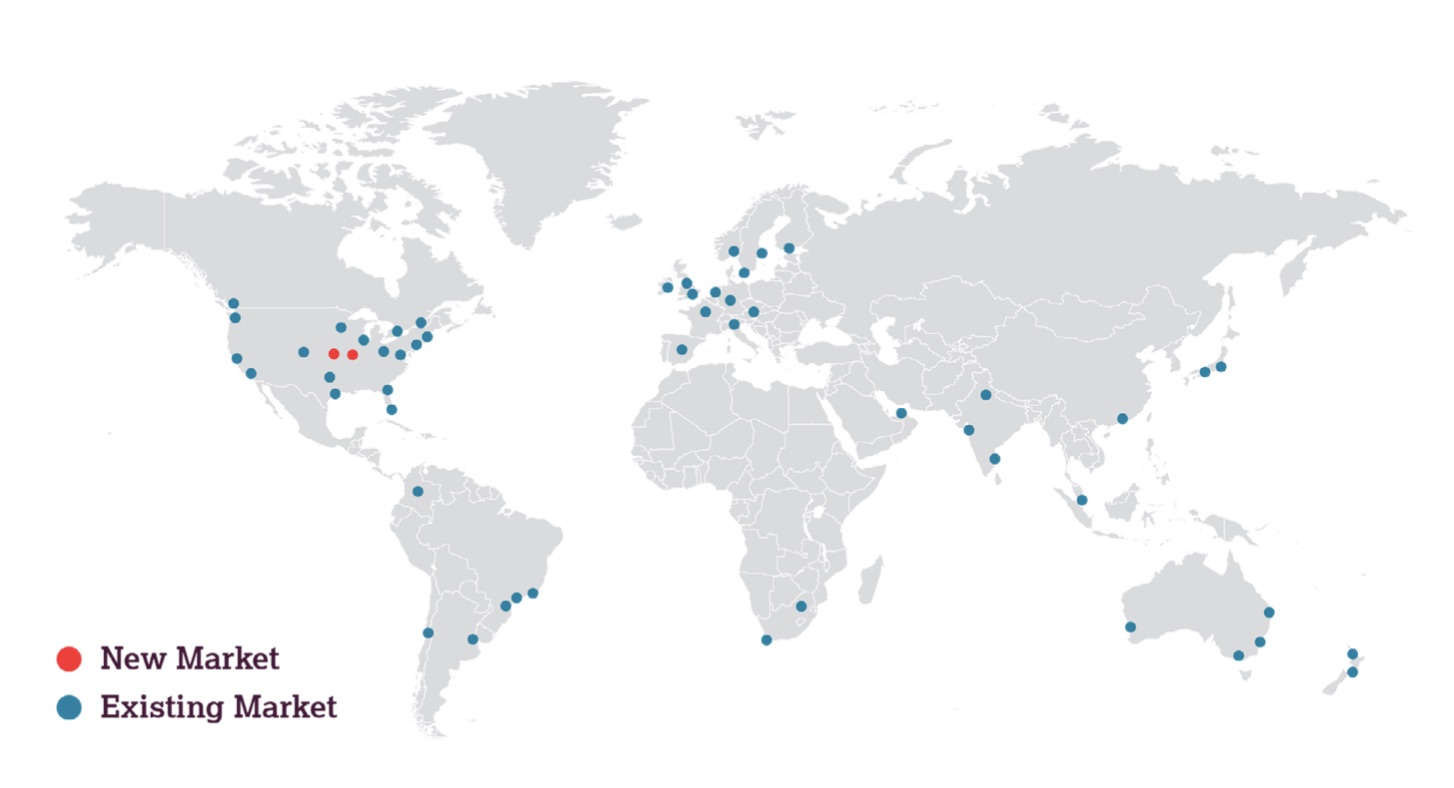
We remain focused on innovating and scaling our network efficiently and will continue to strategically expand, upgrade, and augment it based on the needs of our enterprise customers. As we recently published on our blog1, we work with our supply chain partners so that we have multiple rack and loose build stock available to us at any time. This provides increased flexibility to promptly dispatch racks of capacity to their final deployment as country and travel restrictions allow. As I mentioned at the beginning of this letter, we’re closely monitoring the global COVID-19 pandemic, including the impact on infrastructure deployment. While we did not experience any negative supply chain impacts during the first quarter, we are prepared to and will make the necessary adjustments should these challenging times continue for an extended period of time. This quarter, we entered two new markets, Kansas City and St. Louis, and continued to upgrade and add new POPs in existing markets. As of Q1 2020, we were in 55 markets, providing access to 88 Tb/sec. of global network capacity.
__________
1https://www.fastly.com/blog/remote-first-capacity-planning-network-expansion
Exhibit 99.1
Driving Operating Leverage
We remain confident in our path to profitability over time despite the current economic uncertainty. Our results and guidance reflect the benefits of our efficient platform and modern network design. We expect to deliver further operating leverage, primarily driven by incremental revenue with healthy gross margin from continuous edge cloud and security product releases as well as increased utilization of the network.
In terms of operating expenses, we will continue to invest in generating demand, producing new innovative technologies, and driving automation and optimization internally as we scale our business. We also remain focused on improving our network by enhancing system efficiency and utilization through software improvements and innovation. We expect these efficiencies to reduce computing requirements for common workloads overtime, ultimately increasing the amount of revenue generated by each server.
Exhibit 99.1
Financial Discussion
Revenue
Total revenue for Q1 2020 increased 38% year-over-year to $63 million and was primarily driven by further adoption of our modern edge platform and products by new and existing enterprise organizations across multiple geographies and verticals, including high-tech and FinTech. Additionally, revenue was supplemented by increased internet usage as social distancing measures were implemented in the second half of March.
Customer Count
As of Q1 2020, 297 of our 1,837 customers were enterprise customers. These enterprise customers drove the majority of our revenue growth and accounted for 88% of our trailing twelve-month revenue.
Gross Margin
GAAP gross margin was 56.7% for Q1 2020, which remains consistent with Q1 2019. Excluding stock-based compensation, non-GAAP gross margin in Q1 2020 at 57.6%, up from 57.0% in Q1 2019.
Expenses
Research and development expense was $14 million in Q1 2020, or 23% of revenue, up from $10 million, or 22% of revenue in Q1 2019. The increase was primarily driven by investments in new products and features to produce next-generation edge computing solutions.
Sales and marketing expenses were $19 million in Q1 2020, representing 30% of revenue, up from $15 million, or 33% of revenue in Q1 2019. The increase was primarily driven by augmenting our talent to drive future enterprise customer acquisition growth as well as encourage further use of our platform by existing customers.
General and administrative expense was $14 million in Q1 2020, or 23% of revenue, up from $9 million, or 19% of revenue in Q1 2019. The higher expense was primarily driven by an increase in headcount and increased service provider expense.
In total, our operating expenses for Q1 2020 were $48 million, or 76% of revenue, compared to $34 million, or 74% of revenue in Q1 2019.
We generated a GAAP operating loss for Q1 2020 of $12 million, or 19% of revenue, compared to GAAP operating loss of $8 million, or 18% of revenue in Q1 2019. Non-GAAP operating loss for Q1 2020 was $6 million, or 9% of revenue, compared to non-GAAP operating loss of $7 million, or 15% of revenue in Q1 2019.
Net Loss
Net loss for Q1 2020 was $12 million, or $0.13 loss per basic and diluted shares, compared to net loss of $10 million and $0.38 per basic and diluted in Q1 2019. Non-GAAP basic and diluted net loss per share for Q1 2020 was $0.06, compared to non-GAAP basic and diluted net loss per share of $0.30 in Q1 2019. For a reconciliation of non-GAAP financial measures to their corresponding GAAP measures, please refer to the reconciliation table at the end of this letter.
Exhibit 99.1
Balance Sheet, Capital Expenditures, and Cash Flow
We ended Q1 2020 with $187 million in cash, restricted cash, and investments in marketable securities. In this uncertain economic environment, we're pleased to have a strong balance sheet and liquidity. Cash used in operations was $7 million in the quarter. Capital expenditures, or cash used for purchases of property and equipment and capitalized internal-use software, were $12 million in Q1 2020, representing 19% of total revenue, up from $6 million or 10% of total revenue last quarter. This increase was primarily related to timing of cash payments for infrastructure that was purchased in 2019. Free Cash Flow was ($19) million in Q1 2020. For additional context, please refer to the free cash flow table at the end of this letter.
Exhibit 99.1
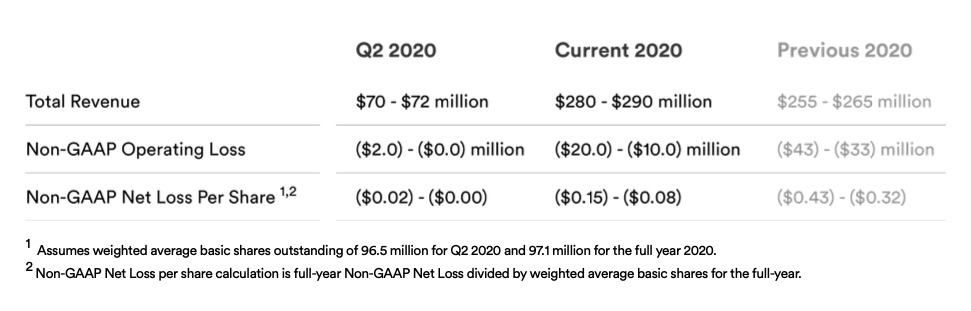
Q2 and Full-Year 2020 Guidance
As we mentioned earlier, we saw continued customer expansion on our platform which was bolstered by increased internet traffic from social distancing measures in Q1. We expect this trend to continue into Q2 and future periods. Despite the current global economic uncertainty, we remain optimistic about the demand for our mission-critical services and the underlying growth of our business. Accordingly, we raised guidance for the full-year 2020.
Gross margin will continue to be affected by the timing of personnel and infrastructure investments, along with the seasonal fluctuations of platform usage by our customers. Despite the uncertain economic environment, we remain confident in our ability to deliver incremental annual gross margin expansion as we continue to scale and deliver innovative security and edge computing solutions.
Additionally, as we continue to invest in the business in 2020 through global network expansion, we continue to expect annual capital expenditures as a percentage of revenue to be approximately 13% to 14% of revenue — similar to full-year 2018. Long-term, we expect capital expenditures to approach 10% of revenue on a calendar year basis.
A reconciliation of non-GAAP guidance measures to corresponding GAAP measures for our Q2 and Full-Year 2020 Guidance is not available on a forward-looking basis without unreasonable effort due to the uncertainty regarding, and the potential variability of, many of these costs and expenses that may be incurred in the future. We have provided a reconciliation of GAAP to non-GAAP financial measures for Q1 2020 in the reconciliation table at the end of this letter.
Exhibit 99.1
Quarterly Conference Call
We will host a live Q&A session at 2:00 p.m. PT / 5:00 p.m. ET on Wednesday, May 6, 2020 to discuss these financial results. To participate in the live call, please dial (866) 211-4110 (U.S. / Canada) or (647) 689-6608 (international) and provide conference ID 7459647. A live webcast of the call will be available at https://investors.fastly.com and will be archived on our site following the call.
Finally, I want to close by reiterating how incredibly proud I am of this company and the work we’re doing to create a trustworthy internet where good thrives. In a time when stability is needed most, our team is helping deliver news, connections, commerce, and entertainment to billions of end users around the world who depend on it. We are acutely aware of the trust our customers place in us, and I know that I speak for everyone at Fastly when I say that it’s an honor to continue to deliver for our customers, particularly during these challenging times. Every day I am inspired by the creativity, kindness, and resilience of my fellow Fastlyans, and I am especially grateful for those qualities during this time when the world is facing monumental challenges.
Thank you for taking the time to read our letter, and we look forward to your questions on our call this afternoon.
Sincerely,
Joshua Bixby
CEO
Exhibit 99.1
Forward-Looking Statements
This letter to shareholders contains forward-looking statements within the meaning of Section 27A of the Securities Act of 1933, as amended (the “Securities Act”), and Section 21E of the Securities Exchange Act of 1934, as amended, about us and our industry that involve substantial risks and uncertainties. Forward-looking statements generally relate to future events or Fastly’s future financial or operating performance. In some cases, you can identify forward-looking statements because they contain words such as “may,” “will,” “should,” “expects,” “plans,” “anticipates,” “going to,” “could,” “intends,” “target,” “projects,” “contemplates,” “believes,” “estimates,” “predicts,” “potential,” or “continue,” or the negative of these words or other similar terms or expressions that concern Fastly’s expectations, strategy, priorities, plans, or intentions. Forward-looking statements in this letter to shareholders include, but are not limited to, statements regarding Fastly’s future financial and operating performance, including its outlook and guidance; Fastly’s strategies, product and business plans, including its ability to scale and assist its customers to grow; statements regarding Fastly’s investments in revenue, marketing and demand generation, and the impact of such investments on its business; statements regarding the performance of Fastly’s platform; and Fastly’s expectations regarding the expansion of its customer base, including anticipated enterprise customer deals, the growth and usage of its customers, and the effects of the COVID-19 pandemic. Fastly’s expectations and beliefs regarding these matters may not materialize, and actual results in future periods are subject to risks and uncertainties that could cause actual results to differ materially from those projected. These risks include the possibility that: Fastly is unable to attract and retain customers; Fastly’s existing customers and partners do not maintain or increase usage of Fastly’s platform; Fastly’s platform and product features do not meet expectations, including due to interruptions, security breaches, delays in performance or other similar problems; Fastly is unable to adapt to meet evolving market and customer demands and rapid technological change; Fastly is unable to comply with modified or new industry standards, laws and regulations; Fastly is unable to generate sufficient revenues to achieve or sustain profitability; Fastly’s limited operating history makes it difficult to evaluate its prospects and future operating results; Fastly is unable to effectively manage its growth; and Fastly is unable to compete effectively. The forward-looking statements contained in this shareholder letter are also subject to other risks and uncertainties, including those more fully described in Fastly’s Annual Report on Form 10-K for the year ended December 31, 2019, our Quarterly Reports on Form 10-Q, and other filings and reports that we may file from time to time with the SEC. The forward-looking statements in this letter to shareholders are based on information available to Fastly as of the date hereof, and Fastly disclaims any obligation to update any forward-looking statements, except as required by law.
Exhibit 99.1
Non-GAAP Financial Measures
To supplement our condensed consolidated financial statements, which are prepared and presented in accordance with accounting principles generally accepted in the United States (“GAAP”), the Company uses the following non-GAAP measures of financial performance: non-GAAP gross profit, non-GAAP net loss, non-GAAP basic and diluted net loss per common share, non-GAAP research and development, non-GAAP sales and marketing, non-GAAP general and administrative, and adjusted EBITDA. The presentation of this additional financial information is not intended to be considered in isolation from, as a substitute for, or superior to, the financial information prepared and presented in accordance with GAAP. These non-GAAP measures have limitations in that they do not reflect all of the amounts associated with our results of operations as determined in accordance with GAAP. In addition, these non-GAAP financial measures may be different from the non-GAAP financial measures used by other companies. These non-GAAP measures should only be used to evaluate our results of operations in conjunction with the corresponding GAAP measures. Management compensates for these limitations by reconciling these non-GAAP financial measures to the most comparable GAAP financial measures within our earnings releases.
Non-GAAP gross profit, non-GAAP research and development, non-GAAP sales and marketing, and non-GAAP general and administrative differ from GAAP in that they exclude stock-based compensation expense. Non-GAAP net loss and non-GAAP basic and diluted net loss per common share differ from GAAP in that they exclude stock- based compensation expense, interest expense related to the acceleration of deferred debt issuance costs due to the early repayment of debt, and other expense related to the mark-to-market of our convertible preferred warrant liability immediately prior to our initial public offering (“IPO”).
Adjusted EBITDA: Adjusted EBITDA excludes stock-based compensation expense, depreciation and amortization expense, interest income, interest expense, other expense, net, and income taxes.
Capital Expenditures: cash used for purchases of property and equipment and capitalized internal-use software, as reflected in our statement of cash flows.
Depreciation and Amortization Expense: consists of non-cash charges that can be affected by the timing and magnitude of asset purchases. Depreciation and amortization expense is included in the following cost and expense line items of our GAAP presentation: cost of revenue, research and development, sales and marketing, and general and administrative. Management considers its operating results without amortization expense when evaluating its ongoing non-GAAP performance and without depreciation and amortization expense when evaluating its ongoing adjusted EBITDA performance because these charges are non-cash expenses that can be affected by the timing and magnitude of asset purchases and may not be reflective of our core business, ongoing operating results, or future outlook.
Free Cash Flow: calculated as net cash used in operating activities less capital expenditures.
Interest Expense: consists primarily of interest expense related to our debt instruments. Management considers its operating results without interest expense associated with the acceleration of deferred debt issuance costs associated with early repayment of debt when evaluating its ongoing non-GAAP performance and without total interest expense when evaluating its ongoing adjusted EBITDA performance because it is not believed by management to be reflective of our core business, ongoing operating results or future outlook.
Interest Income: consists primarily of interest income related to our marketable securities. Management considers its adjusted EBITDA results without this activity when evaluating its ongoing performance because it is not believed by management to be reflective of our core business, ongoing operating results or future outlook.
Income Taxes: consists of expenses recognized related to state and foreign income taxes. Management considers its adjusted EBITDA results without these charges when evaluating its ongoing performance because it is not believed by management to be reflective of our core business, ongoing operating results or future outlook.
Exhibit 99.1
Non-GAAP Operating Loss: calculated as GAAP revenue less non-GAAP cost of revenue and non-GAAP operating expenses.
Other Income (Expense), Net: consists primarily of other expenses related to mark- to-market adjustments of our convertible preferred stock warrant liabilities. Upon the closing of the IPO, the warrants to purchase shares of preferred stock were converted into warrants to purchase shares of our common stock. As a result, the warrant liability was remeasured a final time immediately prior to the IPO and reclassified to additional paid in capital within stockholders’ deficit. Management considers its operating results without other expense associated with the mark-to-market adjustments included in other expense, net, when evaluating its ongoing non-GAAP performance and without total other expense, net when evaluating its ongoing adjusted EBITDA performance because it is not believed by management to be reflective of our core business, ongoing operating results or future outlook.
Stock-based Compensation Expense: consists of expenses for stock options, restricted stock units, and Employee Stock Purchase Plan (“ESPP”) under our equity incentive plans. Stock-based compensation is included in the following cost and expense line items of our GAAP presentation: cost of revenue, research and development, sales and marketing, and general and administrative.
Although stock-based compensation is an expense for the Company and is viewed as a form of compensation, management excludes stock-based compensation from our non- GAAP measures and adjusted EBITDA results for purposes of evaluating our continuing operating performance primarily because it is a non-cash expense not believed by management to be reflective of our core business, ongoing operating results, or future outlook. In addition, the value of stock-based instruments is determined using formulas that incorporate variables, such as market volatility, that are beyond our control.
Management believes these non-GAAP financial measures and adjusted EBITDA serve as useful metrics for our management and investors because they enable a better understanding of the long-term performance of our core business and facilitate comparisons of our operating results over multiple periods and to those of peer companies, and when taken together with the corresponding GAAP financial measures and our reconciliations, enhance investors’ overall understanding of our current financial performance.
In the financial tables below, the Company provides a reconciliation of the most comparable GAAP financial measure to the historical non-GAAP financial measures used in this shareholder letter.
Exhibit 99.1
Condensed Consolidated Statements of Operations
(in thousands, except per share amounts, unaudited)
Three months ended March 31, | ||||||||
2020 | 2019 | |||||||
Revenue | $ | 62,924 | $ | 45,556 | ||||
Cost of revenue(1) | 27,265 | 19,718 | ||||||
Gross profit | 35,659 | 25,838 | ||||||
Operating expenses: | ||||||||
Research and development(1) | 14,298 | 10,176 | ||||||
Sales and marketing(1) | 19,168 | 15,039 | ||||||
General and administrative(1) | 14,169 | 8,700 | ||||||
Total operating expenses | 47,635 | 33,915 | ||||||
Loss from operations | (11,976 | ) | (8,077 | ) | ||||
Interest income | 719 | 416 | ||||||
Interest expense | (316 | ) | (1,235 | ) | ||||
Other income (expense), net | 402 | (776 | ) | |||||
Loss before income taxes | (11,171 | ) | (9,672 | ) | ||||
Income taxes | 819 | 55 | ||||||
Net loss | $ | (11,990 | ) | $ | (9,727 | ) | ||
Net loss per share attributable to common stockholders, basic and diluted | $ | (0.13 | ) | $ | (0.38 | ) | ||
Weighted-average shares used in computing net loss per share attributable to common stockholders, basic and diluted | 95,401 | 25,290 | ||||||
__________
(1) | Includes stock-based compensation expense as follows: |
Three months ended March 31, | ||||||||
2020 | 2019 | |||||||
Cost of revenue | $ | 615 | $ | 144 | ||||
Research and development | 1,671 | 432 | ||||||
Sales and marketing | 1,483 | 369 | ||||||
General and administrative | 2,560 | 522 | ||||||
Total | $ | 6,329 | $ | 1,467 | ||||
Exhibit 99.1
Condensed Consolidated Balance Sheets
(in thousands)
As of March 31, 2020 | As of December 31, 2019 | |||||||
(unaudited) | (audited) | |||||||
Assets | ||||||||
Current assets: | ||||||||
Cash and cash equivalents | $ | 22,501 | $ | 16,142 | ||||
Marketable securities | 94,084 | 114,967 | ||||||
Accounts receivable, net | 43,017 | 37,136 | ||||||
Restricted cash | 70,087 | 70,087 | ||||||
Prepaid expenses and other current assets | 12,139 | 10,991 | ||||||
Total current assets | 241,828 | 249,323 | ||||||
Property and equipment, net | 69,069 | 60,037 | ||||||
Goodwill | 348 | 372 | ||||||
Intangible assets, net | 1,089 | 1,125 | ||||||
Other assets | 11,512 | 10,112 | ||||||
Total assets | $ | 323,846 | $ | 320,969 | ||||
Liabilities and Stockholders’ Equity | ||||||||
Current liabilities: | ||||||||
Accounts payable | $ | 9,457 | $ | 4,602 | ||||
Accrued expenses | 20,218 | 19,878 | ||||||
Current portion of long-term debt | 5,291 | 4,472 | ||||||
Other current liabilities | 5,430 | 8,169 | ||||||
Total current liabilities | 40,396 | 37,121 | ||||||
Long-term debt, less current portion | 26,043 | 25,158 | ||||||
Other long-term liabilities | 1,357 | 1,038 | ||||||
Total liabilities | 67,796 | 63,317 | ||||||
Stockholders’ equity: | ||||||||
Class A and Class B common stock | 2 | 2 | ||||||
Additional paid-in capital | 459,360 | 449,463 | ||||||
Accumulated other comprehensive income | 687 | 196 | ||||||
Accumulated deficit | (203,999 | ) | (192,009 | ) | ||||
Total stockholders’ equity | 256,050 | 257,652 | ||||||
Total liabilities and stockholders’ equity | $ | 323,846 | $ | 320,969 | ||||
Exhibit 99.1
Condensed Consolidated Statements of Cash Flows
(in thousands, unaudited)
Three months ended March 31, | ||||||||
2020 | 2019 | |||||||
Cash flows from operating activities: | ||||||||
Net loss | $ | (11,990 | ) | $ | (9,727 | ) | ||
Adjustments to reconcile net loss to net cash used in operating activities: | ||||||||
Depreciation and amortization | 4,715 | 3,738 | ||||||
Amortization of deferred rent | 204 | 17 | ||||||
Amortization of debt issuance costs | 19 | 159 | ||||||
Stock-based compensation | 6,329 | 1,467 | ||||||
Provision for doubtful accounts | 150 | 602 | ||||||
Change in fair value of preferred stock warrant liabilities | — | 706 | ||||||
Other adjustments | (39 | ) | (224 | ) | ||||
Interest paid on capital leases | (119 | ) | (77 | ) | ||||
Loss on disposal of property and equipment | — | 36 | ||||||
Changes in operating assets and liabilities: | ||||||||
Accounts receivable | (6,031 | ) | (4,586 | ) | ||||
Prepaid expenses and other current assets | (1,148 | ) | (931 | ) | ||||
Other assets | (1,400 | ) | (1,860 | ) | ||||
Accounts payable | 3,112 | 1,686 | ||||||
Accrued expenses | (1,495 | ) | (507 | ) | ||||
Other liabilities | 507 | (582 | ) | |||||
Net cash used in operating activities | (7,186 | ) | (10,083 | ) | ||||
Cash flows from investing activities: | ||||||||
Purchase of marketable securities | — | (20,088 | ) | |||||
Sale of marketable securities | — | 3,578 | ||||||
Maturities of marketable securities | 21,400 | 17,700 | ||||||
Purchases of property and equipment | (10,221 | ) | (4,025 | ) | ||||
Capitalized internal-use software | (1,437 | ) | (759 | ) | ||||
Net cash used in investing activities | 9,742 | (3,594 | ) | |||||
Cash flows from financing activities: | ||||||||
Repayments of notes payable | — | (2,488 | ) | |||||
Repayments of capital leases | (1,541 | ) | (336 | ) | ||||
Proceeds from employee stock purchase plan | 2,133 | — | ||||||
Proceeds from exercise of vested stock options | 3,174 | 639 | ||||||
Proceeds from early exercise of stock options | — | 250 | ||||||
Proceeds from payment of stockholder note | — | 12 | ||||||
Net cash (used in) provided by financing activities | 3,766 | (1,923 | ) | |||||
Effects of exchange rate changes on cash, cash equivalents, and restricted cash | 37 | (8 | ) | |||||
Net increase in cash, cash equivalents, and restricted cash | 6,359 | (15,608 | ) | |||||
Cash, cash equivalents, and restricted cash at beginning of period | 86,229 | 36,963 | ||||||
Cash, cash equivalents, and restricted cash at end of period | $ | 92,588 | $ | 21,355 | ||||
Reconciliation of cash, cash equivalents, and restricted cash as shown in the statements of cash flows | ||||||||
Cash and cash equivalents | $ | 22,501 | $ | 21,355 | ||||
Restricted cash included in prepaid and other current assets line item of Condensed Consolidated Balance Sheets | $ | 70,087 | $ | — | ||||
Total cash, cash equivalents, and restricted cash | $ | 92,588 | $ | 21,355 | ||||
Exhibit 99.1
Free Cash Flow
(in thousands, unaudited)
Quarter ended | Year ended | Quarter ended | ||||||||||||||||||||||
Q1 2019 | Q2 2019 | Q3 2019 | Q4 2019 | Q4 2019 | Q1 2020 | |||||||||||||||||||
Cash flow used in operations | $ | (10,083 | ) | $ | (5,565 | ) | $ | (12,595 | ) | $ | (3,060 | ) | $ | (31,303 | ) | $ | (7,186 | ) | ||||||
Capital expenditures(1) | (4,784 | ) | (4,445 | ) | (4,389 | ) | (5,847 | ) | (19,465 | ) | (11,658 | ) | ||||||||||||
Free Cash Flow(2) | $ | (14,867 | ) | $ | (10,010 | ) | $ | (16,984 | ) | $ | (8,907 | ) | $ | (50,768 | ) | $ | (18,844 | ) | ||||||
__________
(1) | Capital Expenditures are defined as cash used for purchases of property and equipment and capitalized internal-use software, as reflected in our statement of cash flows. |
(2) | As of Q3 2019, we started disclosing Free Cash Flow, which is defined as cash flow from operating activities less capital expenditures. |
Exhibit 99.1
Reconciliation of GAAP to Non-GAAP Financial Measures
(in thousands, unaudited)
Three months ended March 31, | ||||||||
2020 | 2019 | |||||||
Gross Profit | ||||||||
GAAP gross profit | $ | 35,659 | $ | 25,838 | ||||
Stock-based compensation—Cost of revenue | 615 | 144 | ||||||
Non-GAAP gross profit | $ | 36,274 | $ | 25,982 | ||||
Non-GAAP gross margin | 57.6 | % | 57.0 | % | ||||
Research and development | ||||||||
GAAP research and development | $ | 14,298 | $ | 10,176 | ||||
Stock-based compensation | (1,671 | ) | (432 | ) | ||||
Non-GAAP research and development | $ | 12,627 | $ | 9,744 | ||||
Sales and marketing | ||||||||
GAAP sales and marketing | $ | 19,168 | $ | 15,039 | ||||
Stock-based compensation | (1,483 | ) | (369 | ) | ||||
Non-GAAP sales and marketing | $ | 17,685 | $ | 14,670 | ||||
General and administrative | ||||||||
GAAP general and administrative | $ | 14,169 | $ | 8,700 | ||||
Stock-based compensation | (2,560 | ) | (522 | ) | ||||
Non-GAAP general and administrative | $ | 11,609 | $ | 8,178 | ||||
Operating loss | ||||||||
GAAP operating loss | $ | (11,976 | ) | $ | (8,077 | ) | ||
Stock-based compensation | 6,329 | 1,467 | ||||||
Non-GAAP operating loss | $ | (5,647 | ) | $ | (6,610 | ) | ||
Net loss | ||||||||
GAAP net loss | $ | (11,990 | ) | $ | (9,727 | ) | ||
Stock-based compensation | 6,329 | 1,467 | ||||||
Other expense—mark-to-market warrant liability | — | 706 | ||||||
Non-GAAP net loss | $ | (5,661 | ) | $ | (7,554 | ) | ||
Non-GAAP net loss per common share—basic and diluted | $ | (0.06 | ) | $ | (0.30 | ) | ||
Weighted average basic and diluted common shares | 95,401 | 25,290 | ||||||
Adjusted EBITDA | ||||||||
GAAP net loss | $ | (11,990 | ) | $ | (9,727 | ) | ||
Stock-based compensation | 6,329 | 1,467 | ||||||
Depreciation and amortization | 4,715 | 3,738 | ||||||
Interest income | (719 | ) | (416 | ) | ||||
Interest expense | 316 | 1,235 | ||||||
Other (income) expense, net | (402 | ) | 776 | |||||
Income taxes | 819 | 55 | ||||||
Adjusted EBITDA | $ | (932 | ) | $ | (2,872 | ) | ||