Attached files
| file | filename |
|---|---|
| EX-99.1 - EX-99.1 - DRIL-QUIP INC | d830979dex991.htm |
| 8-K - 8-K - DRIL-QUIP INC | d830979d8k.htm |

Exhibit 99.2 FIRST QUARTER 2020 SUPPLEMENTAL EARNINGS INFORMATION dril-quip.com | NYSE: DRQExhibit 99.2 FIRST QUARTER 2020 SUPPLEMENTAL EARNINGS INFORMATION dril-quip.com | NYSE: DRQ

CAUTIONARY STATEMENT Forward-Looking Statements The information furnished in this presentation contains “forward-looking statements” within the meaning of the federal securities laws. Forward-looking statements include the effects of the COVID-19 pandemic, goals, projections, estimates, expectations, market outlook, forecasts, plans and objectives, including revenue and new product revenue, capital expenditures and other projections, project bookings, bidding and service activity, acquisition opportunities, forecasted supply and demand, forecasted drilling activity and subsea investment, liquidity, cost savings, and share repurchases and are based on assumptions, estimates and risk analysis made by management of Dril-Quip, Inc. (“Dril-Quip”) in light of its experience and perception of historical trends, current conditions, expected future developments and other factors. No assurance can be given that actual future results will not differ materially from those contained in the forward-looking statements in this presentation. Although Dril-Quip believes that all such statements contained in this presentation are based on reasonable assumptions, there are numerous variables of an unpredictable nature or outside of Dril-Quip’s control that could affect Dril-Quip’s future results and the value of its shares. Each investor must assess and bear the risk of uncertainty inherent in the forward-looking statements contained in this presentation. Please refer to Dril-Quip’s filings with the Securities and Exchange Commission (“SEC”) for additional discussion of risks and uncertainties that may affect Dril-Quip’s actual future results. Dril-Quip undertakes no obligation to update the forward-looking statements contained herein. Use of Non-GAAP Financial Measures EBITDA, Adjusted EBITDA and Free Cash Flow are non-GAAP measures. EBITDA is defined as net income excluding income taxes, interest income and expense, depreciation and amortization expense. Adjusted EBITDA is defined as net income excluding income taxes, interest income and expense, depreciation and amortization expense, non-cash gains or losses from foreign currency exchange rate changes as well as other significant non-cash items and items that can be considered non-recurring. Free Cash Flow is defined as net cash provided by operating activities less net cash used in the purchase of property, plant and equipment. We believe that these non-GAAP measures enable us to evaluate and compare more effectively the results of our operations period over period and identify operating trends by removing the effect of our capital structure from our operating structure and certain other items including those that affect the comparability of operating results. In addition, we believe that these measures are supplemental measurement tools used by analysts and investors to help evaluate overall operating performance, ability to pursue and service possible debt opportunities and make future capital expenditures. These measures do not represent funds available for our discretionary use and are not intended to represent or to be used as a substitute for net income or net cash provided by operating activities, as measured under U.S. generally accepted accounting principles (“GAAP”). Non-GAAP financial information supplements should be read together with, and is not an alternative or substitute for, our financial results reported in accordance with GAAP. Because non-GAAP financial information is not standardized, it may not be possible to compare these financial measures with other companies’ non-GAAP financial measures. Reconciliations of these non-GAAP measures to the most directly comparable GAAP measure can be found in the appendix. Use of Website Investors should note that Dril-Quip announces material financial information in SEC filings, press releases and public conference calls. Dril-Quip may use the Investors section of its website (www.dril- quip.com) to communicate with investors. It is possible that the financial and other information posted there could be deemed to be material information. Information on Dril-Quip’s website is not part of this presentation. 1CAUTIONARY STATEMENT Forward-Looking Statements The information furnished in this presentation contains “forward-looking statements” within the meaning of the federal securities laws. Forward-looking statements include the effects of the COVID-19 pandemic, goals, projections, estimates, expectations, market outlook, forecasts, plans and objectives, including revenue and new product revenue, capital expenditures and other projections, project bookings, bidding and service activity, acquisition opportunities, forecasted supply and demand, forecasted drilling activity and subsea investment, liquidity, cost savings, and share repurchases and are based on assumptions, estimates and risk analysis made by management of Dril-Quip, Inc. (“Dril-Quip”) in light of its experience and perception of historical trends, current conditions, expected future developments and other factors. No assurance can be given that actual future results will not differ materially from those contained in the forward-looking statements in this presentation. Although Dril-Quip believes that all such statements contained in this presentation are based on reasonable assumptions, there are numerous variables of an unpredictable nature or outside of Dril-Quip’s control that could affect Dril-Quip’s future results and the value of its shares. Each investor must assess and bear the risk of uncertainty inherent in the forward-looking statements contained in this presentation. Please refer to Dril-Quip’s filings with the Securities and Exchange Commission (“SEC”) for additional discussion of risks and uncertainties that may affect Dril-Quip’s actual future results. Dril-Quip undertakes no obligation to update the forward-looking statements contained herein. Use of Non-GAAP Financial Measures EBITDA, Adjusted EBITDA and Free Cash Flow are non-GAAP measures. EBITDA is defined as net income excluding income taxes, interest income and expense, depreciation and amortization expense. Adjusted EBITDA is defined as net income excluding income taxes, interest income and expense, depreciation and amortization expense, non-cash gains or losses from foreign currency exchange rate changes as well as other significant non-cash items and items that can be considered non-recurring. Free Cash Flow is defined as net cash provided by operating activities less net cash used in the purchase of property, plant and equipment. We believe that these non-GAAP measures enable us to evaluate and compare more effectively the results of our operations period over period and identify operating trends by removing the effect of our capital structure from our operating structure and certain other items including those that affect the comparability of operating results. In addition, we believe that these measures are supplemental measurement tools used by analysts and investors to help evaluate overall operating performance, ability to pursue and service possible debt opportunities and make future capital expenditures. These measures do not represent funds available for our discretionary use and are not intended to represent or to be used as a substitute for net income or net cash provided by operating activities, as measured under U.S. generally accepted accounting principles (“GAAP”). Non-GAAP financial information supplements should be read together with, and is not an alternative or substitute for, our financial results reported in accordance with GAAP. Because non-GAAP financial information is not standardized, it may not be possible to compare these financial measures with other companies’ non-GAAP financial measures. Reconciliations of these non-GAAP measures to the most directly comparable GAAP measure can be found in the appendix. Use of Website Investors should note that Dril-Quip announces material financial information in SEC filings, press releases and public conference calls. Dril-Quip may use the Investors section of its website (www.dril- quip.com) to communicate with investors. It is possible that the financial and other information posted there could be deemed to be material information. Information on Dril-Quip’s website is not part of this presentation. 1

Leading Manufacturer of Highly Engineered Drilling & Production Equipment Technically Innovative Products & First-class Service DRIL-QUIP Strong Financial Position INVESTMENT HIGHLIGHTS Historically Superior Margins to Peers Results Driven Management Team 2Leading Manufacturer of Highly Engineered Drilling & Production Equipment Technically Innovative Products & First-class Service DRIL-QUIP Strong Financial Position INVESTMENT HIGHLIGHTS Historically Superior Margins to Peers Results Driven Management Team 2
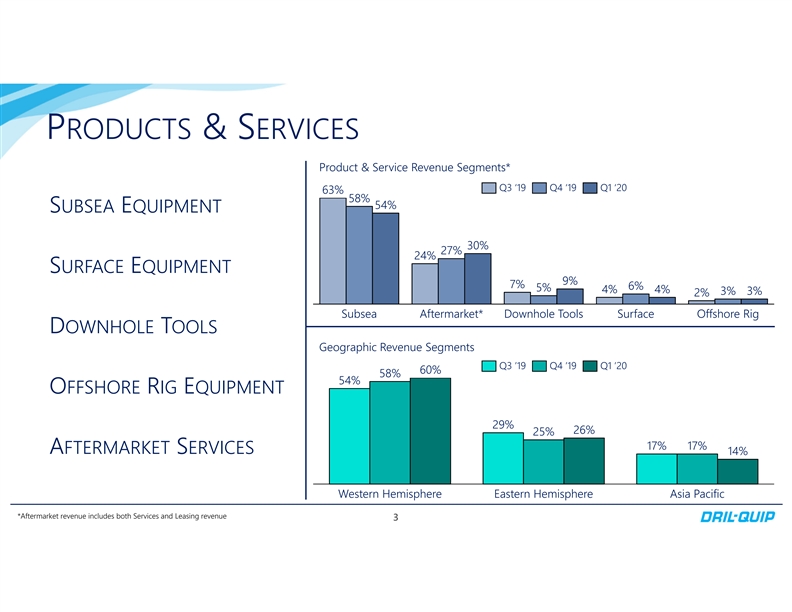
PRODUCTS & SERVICES Product & Service Revenue Segments* Q3 ‘19 Q4 ‘19 Q1 ‘20 63% 58% 54% SUBSEA EQUIPMENT 30% 27% 24% SURFACE EQUIPMENT 9% 7% 6% 5% 4% 4% 3% 3% 2% Subsea Aftermarket* Downhole Tools Surface Offshore Rig DOWNHOLE TOOLS Geographic Revenue Segments Q3 ’19 Q4 ’19 Q1 ’20 60% 58% 54% OFFSHORE RIG EQUIPMENT 29% 26% 25% 17% 17% AFTERMARKET SERVICES 14% Western Hemisphere Eastern Hemisphere Asia Pacific *Aftermarket revenue includes both Services and Leasing revenue 3PRODUCTS & SERVICES Product & Service Revenue Segments* Q3 ‘19 Q4 ‘19 Q1 ‘20 63% 58% 54% SUBSEA EQUIPMENT 30% 27% 24% SURFACE EQUIPMENT 9% 7% 6% 5% 4% 4% 3% 3% 2% Subsea Aftermarket* Downhole Tools Surface Offshore Rig DOWNHOLE TOOLS Geographic Revenue Segments Q3 ’19 Q4 ’19 Q1 ’20 60% 58% 54% OFFSHORE RIG EQUIPMENT 29% 26% 25% 17% 17% AFTERMARKET SERVICES 14% Western Hemisphere Eastern Hemisphere Asia Pacific *Aftermarket revenue includes both Services and Leasing revenue 3

Q1 2020 HIGHLIGHTS • Delivered $96.0 million of revenue, despite lower product volumes and services primarily from COVID-19 related impacts • Reported net loss of $19.7 million, or $0.55 per share, driven by $40.4 million of impairments, restructuring and other charges, partially offset by a $21.6 million income tax benefit • Generated adjusted EBITDA of $6.5 million, or 6.7% of revenue • Announced action plan for an additional $20 million in annualized cost savings, of which $10 million is expected to be realized in the second half of 2020 • Maintained strong balance sheet with cash on hand of $343.5 million and no debt • Net cash used by operating activities of $21.2 million and Free Cash Flow of negative $25.4 million, inclusive of $4.2 million of capital expenditures, driven primarily by slower collections late in Q1 2020 • Repurchased approximately $25.0 million or 800,000 of Company shares in Q1 2020 • Presented with a “Spotlight on New Technology Award” by the 2020 Offshore Technology Conference for the VXTe™ vertical subsea tree system 4Q1 2020 HIGHLIGHTS • Delivered $96.0 million of revenue, despite lower product volumes and services primarily from COVID-19 related impacts • Reported net loss of $19.7 million, or $0.55 per share, driven by $40.4 million of impairments, restructuring and other charges, partially offset by a $21.6 million income tax benefit • Generated adjusted EBITDA of $6.5 million, or 6.7% of revenue • Announced action plan for an additional $20 million in annualized cost savings, of which $10 million is expected to be realized in the second half of 2020 • Maintained strong balance sheet with cash on hand of $343.5 million and no debt • Net cash used by operating activities of $21.2 million and Free Cash Flow of negative $25.4 million, inclusive of $4.2 million of capital expenditures, driven primarily by slower collections late in Q1 2020 • Repurchased approximately $25.0 million or 800,000 of Company shares in Q1 2020 • Presented with a “Spotlight on New Technology Award” by the 2020 Offshore Technology Conference for the VXTe™ vertical subsea tree system 4

COVID-19 AND OPEC+ IMPACTS • Global economic slowdown combined with oversupply of oil and gas production leading to a projected 30-50% decline in 2020 customer capital spending • Rapidly changing environment has caused customers to put investment decisions on hold and pushed out delivery of existing projects in backlog • Social distancing, staggered shifts and quarantine measures are driving lower productivity and resulting in product and service delivery delays • Supply chain bottlenecks are resulting in slightly higher freight expense, raw material procurement delays • Slow down in collections of receivables and other day-to-day business interactions due to adjustment to remote working arrangements *OPEC+ is in reference to member nations of the Organization of Petroleum Exporting Countries and Russia 5COVID-19 AND OPEC+ IMPACTS • Global economic slowdown combined with oversupply of oil and gas production leading to a projected 30-50% decline in 2020 customer capital spending • Rapidly changing environment has caused customers to put investment decisions on hold and pushed out delivery of existing projects in backlog • Social distancing, staggered shifts and quarantine measures are driving lower productivity and resulting in product and service delivery delays • Supply chain bottlenecks are resulting in slightly higher freight expense, raw material procurement delays • Slow down in collections of receivables and other day-to-day business interactions due to adjustment to remote working arrangements *OPEC+ is in reference to member nations of the Organization of Petroleum Exporting Countries and Russia 5

RAPID RESPONSE TO COVID-19 AND OPEC+ Executed Immediate Cost Containment Hiring freeze, compensation curtailment, elimination of discretionary spending Implemented Business Continuity Plan Staggered manufacturing shifts, self-quarantine of service personnel between jobs, working remotely Ensuring Customer Orders Are Fulfilled Initiated planning for the potential of longer lead times on materials and third party service; maintaining service technician support Reduced R&D and Cut Non-essential Capital Expenditures Eliminated incremental R&D spend, reduced CAPEX to maintenance levels Focused on employee safety, customer needs and controlling costs 6RAPID RESPONSE TO COVID-19 AND OPEC+ Executed Immediate Cost Containment Hiring freeze, compensation curtailment, elimination of discretionary spending Implemented Business Continuity Plan Staggered manufacturing shifts, self-quarantine of service personnel between jobs, working remotely Ensuring Customer Orders Are Fulfilled Initiated planning for the potential of longer lead times on materials and third party service; maintaining service technician support Reduced R&D and Cut Non-essential Capital Expenditures Eliminated incremental R&D spend, reduced CAPEX to maintenance levels Focused on employee safety, customer needs and controlling costs 6

FINANCIAL PERFORMANCE Quarterly (USD$ millions) • Revenue down near Q1 2019 levels 0% +4% $108 $108 +10% primarily from market decline, delays $104 -11% and disruptions from COVID-19 $96 $94 Revenue • Higher Adjusted EBITDA decremental Q1 ’19 Q2 ’19 Q3 ’19 Q4 ’19 Q1 ’20 margins from COVID-19 related lower +5% productivity and service delays of ~$4 +13% $16 $15 +45% $13 million $10 -61% $9 $4 • Estimated ~$3 million impact to A. EBITDA $6 adjusted EBITDA margin due to Q1 ’19 Q2 ’19 Q3 ’19 Q4 ’19 Q1 ’20 product mix Estimated cost impact of productivity and service delays from COVID-19 Using Transformation Playbook to Execute 2020 Cost Takeout Note: Sum of components may not foot due to rounding. 7FINANCIAL PERFORMANCE Quarterly (USD$ millions) • Revenue down near Q1 2019 levels 0% +4% $108 $108 +10% primarily from market decline, delays $104 -11% and disruptions from COVID-19 $96 $94 Revenue • Higher Adjusted EBITDA decremental Q1 ’19 Q2 ’19 Q3 ’19 Q4 ’19 Q1 ’20 margins from COVID-19 related lower +5% productivity and service delays of ~$4 +13% $16 $15 +45% $13 million $10 -61% $9 $4 • Estimated ~$3 million impact to A. EBITDA $6 adjusted EBITDA margin due to Q1 ’19 Q2 ’19 Q3 ’19 Q4 ’19 Q1 ’20 product mix Estimated cost impact of productivity and service delays from COVID-19 Using Transformation Playbook to Execute 2020 Cost Takeout Note: Sum of components may not foot due to rounding. 7

COMMERCIAL UPDATE Historical Backlog Trends ($M) $270 $273 $261 $207 • Backlog of $261 million as of 3/31/2020 after recording $58 million of product bookings in Q1 2020 Backlog • Backlog should help mitigate unfavorable market conditions, but YE 2017 YE 2018 YE 2019 Q1 2020 likely to decline in an extended Estimated Backlog Conversion to Revenue downturn as of Q1 ‘20 • Delays, deferrals and potentially 2021 cancellations could impact timing of 30% conversion and total amount of backlog 2020 70% 8COMMERCIAL UPDATE Historical Backlog Trends ($M) $270 $273 $261 $207 • Backlog of $261 million as of 3/31/2020 after recording $58 million of product bookings in Q1 2020 Backlog • Backlog should help mitigate unfavorable market conditions, but YE 2017 YE 2018 YE 2019 Q1 2020 likely to decline in an extended Estimated Backlog Conversion to Revenue downturn as of Q1 ‘20 • Delays, deferrals and potentially 2021 cancellations could impact timing of 30% conversion and total amount of backlog 2020 70% 8

GLOBAL MARKET ENVIRONMENT $ Bn Product Bookings ($M) Subsea Equipment Market Demand $13.2 $14 +10% $12 -43% -41% $101 $92 $10 $9.0 $58 $8.1 $7.6 $8 -31% Q3 ’19 Q4 ’19 Q1 ’20 $6.9 -28% $7.8 $6 $6.7 $6.2 Substantial declines in the expected $5.8 $4 demand for subsea equipment over the next several years following $2 escalation of COVID-19 and Feb Outlook Apr Outlook production oversupply impacts $0 2019 2020F 2021F 2022F 2023F Source: Rystad Energy, Wood Mackenzie, & DRQ Internal Estimates as of April 16, 2020 9GLOBAL MARKET ENVIRONMENT $ Bn Product Bookings ($M) Subsea Equipment Market Demand $13.2 $14 +10% $12 -43% -41% $101 $92 $10 $9.0 $58 $8.1 $7.6 $8 -31% Q3 ’19 Q4 ’19 Q1 ’20 $6.9 -28% $7.8 $6 $6.7 $6.2 Substantial declines in the expected $5.8 $4 demand for subsea equipment over the next several years following $2 escalation of COVID-19 and Feb Outlook Apr Outlook production oversupply impacts $0 2019 2020F 2021F 2022F 2023F Source: Rystad Energy, Wood Mackenzie, & DRQ Internal Estimates as of April 16, 2020 9

FOLLOW-ON RESPONSE & FURTHER TRANSFORMATION Expected New Operational Transformation Cumulative Annual Cost Savings ($M) • Adjust personnel resources to $20 address an extended period of lower offshore market activity • Realign manufacturing footprint for improved efficiency $10 • Partner, “Warm Stack” or exit $5 certain product lines still $5 requiring extensive R&D $5 investment Q3 ’20 Q4 ’20 2021 Run-Rate Position Dril-Quip for Annual Free Cash Flow Generation through the Cycle 10FOLLOW-ON RESPONSE & FURTHER TRANSFORMATION Expected New Operational Transformation Cumulative Annual Cost Savings ($M) • Adjust personnel resources to $20 address an extended period of lower offshore market activity • Realign manufacturing footprint for improved efficiency $10 • Partner, “Warm Stack” or exit $5 certain product lines still $5 requiring extensive R&D $5 investment Q3 ’20 Q4 ’20 2021 Run-Rate Position Dril-Quip for Annual Free Cash Flow Generation through the Cycle 10

CAPITAL ALLOCATION PRIORITIES Daily Operations • $100M - $150M required to support daily operations with plans to lower range Capital Expenditures • 2020 CAPEX to be primarily maintenance capex of $10M - $15M, flat year-over-year R&D • Re-prioritizing R&D projects to focus on ready to commercialize “Quick Wins” • Reduced or deferred $10 million total of R&D spending Monitor Strategic Acquisitions • Evaluate targets or partnerships that complement offering with a focus on technology Share Repurchase • Approximately $50M remaining under $100M share repurchase plan approved by Board in Q1 2019 • Limit share repurchase amounts to annual free cash flow generation Strong Balance Sheet with Liquidity to Achieve Strategic Objectives 11CAPITAL ALLOCATION PRIORITIES Daily Operations • $100M - $150M required to support daily operations with plans to lower range Capital Expenditures • 2020 CAPEX to be primarily maintenance capex of $10M - $15M, flat year-over-year R&D • Re-prioritizing R&D projects to focus on ready to commercialize “Quick Wins” • Reduced or deferred $10 million total of R&D spending Monitor Strategic Acquisitions • Evaluate targets or partnerships that complement offering with a focus on technology Share Repurchase • Approximately $50M remaining under $100M share repurchase plan approved by Board in Q1 2019 • Limit share repurchase amounts to annual free cash flow generation Strong Balance Sheet with Liquidity to Achieve Strategic Objectives 11

KEYS TO EXECUTION OF PLAN Manufacturing Capacity Consolidation • Reallocate manufacturing equipment and personnel to improve plant utilization • Lease, mothball or divest excess capacity, as necessary, to align with long-term outlook Capital Expenditure and Discretionary Spend Discipline • Eliminated bonus compensation and merit increases for 2020 • Reduce capital purchases to maintenance levels that ensure customer demand is met Reprioritize & Right-Size Organization • Assess alternative methods for monetizing certain differentiated technologies • Rationalize spending to focus on highest return projects in current environment • Streamline commercial function for maximum customer engagement Targeting Positive Free Cash Flow for the Full Year 2020 12KEYS TO EXECUTION OF PLAN Manufacturing Capacity Consolidation • Reallocate manufacturing equipment and personnel to improve plant utilization • Lease, mothball or divest excess capacity, as necessary, to align with long-term outlook Capital Expenditure and Discretionary Spend Discipline • Eliminated bonus compensation and merit increases for 2020 • Reduce capital purchases to maintenance levels that ensure customer demand is met Reprioritize & Right-Size Organization • Assess alternative methods for monetizing certain differentiated technologies • Rationalize spending to focus on highest return projects in current environment • Streamline commercial function for maximum customer engagement Targeting Positive Free Cash Flow for the Full Year 2020 12

APPENDIX dril-quip.com | NYSE: DRQAPPENDIX dril-quip.com | NYSE: DRQ

SUMMARY OF IMPAIRMENTS, RESTRUCTURING & OTHER CHARGES $ millions $40 • Severance of ~$8 million related to $8 right-sizing of workforce to market conditions • PP&E of ~$7 million associated with $17 excess capacity and equipment $17 • Inventory of ~$17 million in raw materials and finished goods from warm stacking of certain product $7 $8 lines $8 $7 $8 • Goodwill of ~$8 million reflecting depressed market conditions Severance PP&E Inventory Goodwill Total Estimated cash impact of charges: ~$8 million 14SUMMARY OF IMPAIRMENTS, RESTRUCTURING & OTHER CHARGES $ millions $40 • Severance of ~$8 million related to $8 right-sizing of workforce to market conditions • PP&E of ~$7 million associated with $17 excess capacity and equipment $17 • Inventory of ~$17 million in raw materials and finished goods from warm stacking of certain product $7 $8 lines $8 $7 $8 • Goodwill of ~$8 million reflecting depressed market conditions Severance PP&E Inventory Goodwill Total Estimated cash impact of charges: ~$8 million 14

R&D DRIVING BOOKINGS AND NEW CUSTOMERS • Developing innovative products that structurally reduce total cost of ownership • Expanding product portfolio to increase markets and market share • Presented with OTC Spotlight on New Technology award for four new products the past four years DXe Wellhead Double Expansion BigBore IIe VXTe Vertical Subsea Connector XPAK Liner Hanger Tree System Wellhead 2019 2020 2017 2017 15R&D DRIVING BOOKINGS AND NEW CUSTOMERS • Developing innovative products that structurally reduce total cost of ownership • Expanding product portfolio to increase markets and market share • Presented with OTC Spotlight on New Technology award for four new products the past four years DXe Wellhead Double Expansion BigBore IIe VXTe Vertical Subsea Connector XPAK Liner Hanger Tree System Wellhead 2019 2020 2017 2017 15

MARKET PERFORMANCE MARKET INFORMATION Ticker NYSE: DRQ Share Price (at close: 5/5/20) $29.18 52-Week Range $23.91 - $56.71 Performance: DRQ OSX SPX Since Q4 Filing (2/27/20) -12% -44% -4% Year-to-Date -38% -64% -11% Balance Sheet Strength and Backlog Supporting Share Price Relative to OSX Source: FactSet, Market data as of 5/5/2020 16MARKET PERFORMANCE MARKET INFORMATION Ticker NYSE: DRQ Share Price (at close: 5/5/20) $29.18 52-Week Range $23.91 - $56.71 Performance: DRQ OSX SPX Since Q4 Filing (2/27/20) -12% -44% -4% Year-to-Date -38% -64% -11% Balance Sheet Strength and Backlog Supporting Share Price Relative to OSX Source: FactSet, Market data as of 5/5/2020 16

INCOMESTATEMENT Dril-Quip, Inc. Comparative Condensed Consolidated Income Statement (Unaudited) Three months ended March 31, 2020 December 31, 2019 March 31, 2019 (In thousands, except per share data) Revenues: Products $ 67 ,558 $ 78,762 $ 65,434 Services 18,814 19,082 18,476 Leasing 9,626 10,610 10,407 Total revenues 95,998 108,454 94,317 Costs and expenses: Cost of sales 71,414 75,741 69,376 Selling, general and administrative 21,416 21,444 24,544 Engineering and product development 5,525 4,798 3,617 Impairment 7,719 435 - Restructuring and other charges 32,713 - 2,396 Gain on sale of assets (467) (28) (13) Total costs and expenses 138,320 102,390 99,920 Operating income (loss) (42,322) 6,064 (5,603) Interest income 1,206 1,347 2,006 Interest expense (191) (166) (121) Income tax provision (benefit) (21,609) (155) 2,333 Net income (loss) $ (19,698) $ 7,400 $ (6,051) Earnings (loss) per share Basic $ (0 .55) $ 0 .21 $ (0.17) Diluted $ ( 0.55) $ 0.21 $ (0.17) Depreciation and amortization $ 8,873 $ 8,865 $ 8,356 Capital expenditures $ 4,187 $ 2,881 $ 3,527 Weighted Average Shares Outstanding Basic 35,695 35,873 35,559 Diluted 35,695 36,101 35,559 17INCOMESTATEMENT Dril-Quip, Inc. Comparative Condensed Consolidated Income Statement (Unaudited) Three months ended March 31, 2020 December 31, 2019 March 31, 2019 (In thousands, except per share data) Revenues: Products $ 67 ,558 $ 78,762 $ 65,434 Services 18,814 19,082 18,476 Leasing 9,626 10,610 10,407 Total revenues 95,998 108,454 94,317 Costs and expenses: Cost of sales 71,414 75,741 69,376 Selling, general and administrative 21,416 21,444 24,544 Engineering and product development 5,525 4,798 3,617 Impairment 7,719 435 - Restructuring and other charges 32,713 - 2,396 Gain on sale of assets (467) (28) (13) Total costs and expenses 138,320 102,390 99,920 Operating income (loss) (42,322) 6,064 (5,603) Interest income 1,206 1,347 2,006 Interest expense (191) (166) (121) Income tax provision (benefit) (21,609) (155) 2,333 Net income (loss) $ (19,698) $ 7,400 $ (6,051) Earnings (loss) per share Basic $ (0 .55) $ 0 .21 $ (0.17) Diluted $ ( 0.55) $ 0.21 $ (0.17) Depreciation and amortization $ 8,873 $ 8,865 $ 8,356 Capital expenditures $ 4,187 $ 2,881 $ 3,527 Weighted Average Shares Outstanding Basic 35,695 35,873 35,559 Diluted 35,695 36,101 35,559 17
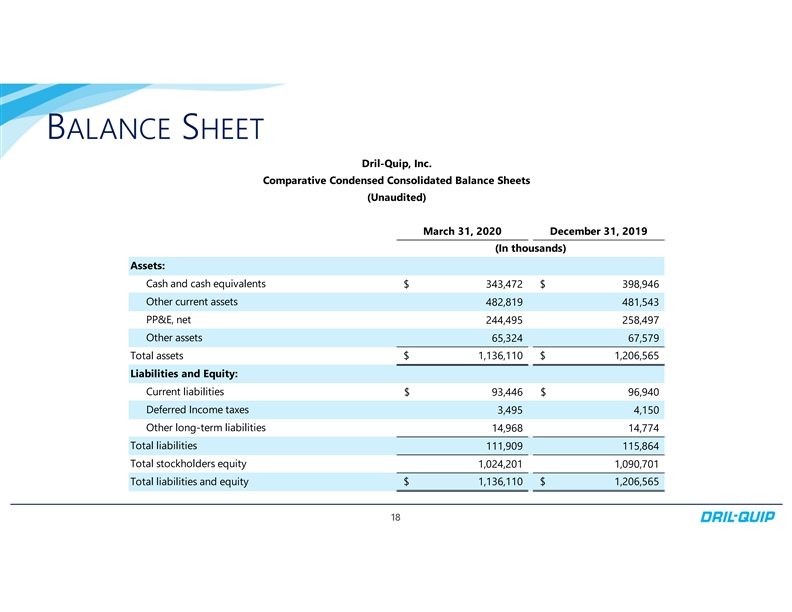
BALANCE SHEET Dril-Quip, Inc. Comparative Condensed Consolidated Balance Sheets (Unaudited) March 31, 2020 December 31, 2019 (In thousands) Assets: Cash and cash equivalents $ 343,472 $ 398,946 Other current assets 482,819 481,543 PP&E, net 244,495 258,497 Other assets 65,324 67,579 Total assets $ 1,136,110 $ 1,206,565 Liabilities and Equity: Current liabilities $ 93,446 $ 96,940 Deferred Income taxes 3,495 4,150 Other long-term liabilities 14,968 14,774 Total liabilities 111,909 115,864 Total stockholders equity 1,024,201 1,090,701 Total liabilities and equity $ 1,136,110 $ 1,206,565 18BALANCE SHEET Dril-Quip, Inc. Comparative Condensed Consolidated Balance Sheets (Unaudited) March 31, 2020 December 31, 2019 (In thousands) Assets: Cash and cash equivalents $ 343,472 $ 398,946 Other current assets 482,819 481,543 PP&E, net 244,495 258,497 Other assets 65,324 67,579 Total assets $ 1,136,110 $ 1,206,565 Liabilities and Equity: Current liabilities $ 93,446 $ 96,940 Deferred Income taxes 3,495 4,150 Other long-term liabilities 14,968 14,774 Total liabilities 111,909 115,864 Total stockholders equity 1,024,201 1,090,701 Total liabilities and equity $ 1,136,110 $ 1,206,565 18

NON-GAAP FINANCIAL MEASURES Dril-Quip, Inc. Reconciliation of Net Income (Loss) to Adjusted EBITDA Adjusted EBITDA: Three months ended March 31, 2020 December 31, 2019 March 31, 2019 (In thousands) Net income (loss) $ (19,698) $ 7 ,400 $ (6,051) Add: Interest income, net (1,015) (1,181) (1,885) Income tax expense (benefit) (21,609) (155) 2,333 Depreciation and amortization expense 8,873 8,865 8,356 Impairments 7,719 4 35 - Restructuring costs, including severance 32,713 - 2,396 Gain on sale of assets (467) (28) (13) Foreign currency loss (gain) (3,242) 4 49 (704) Stock compensation expense 3,176 (25) 4,862 Adjusted EBITDA $ 6,450 $ 15,760 $ 9 ,294 19NON-GAAP FINANCIAL MEASURES Dril-Quip, Inc. Reconciliation of Net Income (Loss) to Adjusted EBITDA Adjusted EBITDA: Three months ended March 31, 2020 December 31, 2019 March 31, 2019 (In thousands) Net income (loss) $ (19,698) $ 7 ,400 $ (6,051) Add: Interest income, net (1,015) (1,181) (1,885) Income tax expense (benefit) (21,609) (155) 2,333 Depreciation and amortization expense 8,873 8,865 8,356 Impairments 7,719 4 35 - Restructuring costs, including severance 32,713 - 2,396 Gain on sale of assets (467) (28) (13) Foreign currency loss (gain) (3,242) 4 49 (704) Stock compensation expense 3,176 (25) 4,862 Adjusted EBITDA $ 6,450 $ 15,760 $ 9 ,294 19

NON-GAAP FINANCIAL MEASURES Dril-Quip, Inc. Reconciliation of Net Cash Provided by Operating Activities to Free Cash Flow Free Cash Flow: Three months ended March 31, 2020 December 31, 2019 March 31, 2019 (In thousands) Net cash provided (used) by operating activities $ (21,237) $ 8,054 $ 838 Less: Purchase of property, plant and equipment (4,187) (2,881) (3,527) Free cash flow $ ( 25,424) $ 5,173 $ (2,689) 20NON-GAAP FINANCIAL MEASURES Dril-Quip, Inc. Reconciliation of Net Cash Provided by Operating Activities to Free Cash Flow Free Cash Flow: Three months ended March 31, 2020 December 31, 2019 March 31, 2019 (In thousands) Net cash provided (used) by operating activities $ (21,237) $ 8,054 $ 838 Less: Purchase of property, plant and equipment (4,187) (2,881) (3,527) Free cash flow $ ( 25,424) $ 5,173 $ (2,689) 20
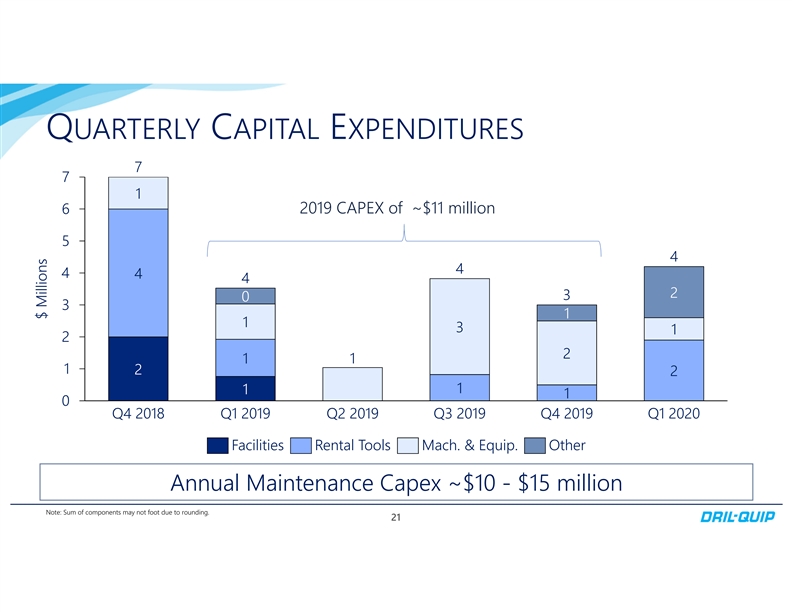
QUARTERLY CAPITAL EXPENDITURES 7 7 1 6 2019 CAPEX of ~$11 million 5 4 4 4 4 4 2 3 0 3 1 1 3 1 2 2 1 1 1 2 2 1 1 1 0 Q4 2018 Q1 2019 Q2 2019 Q3 2019 Q4 2019 Q1 2020 Facilities Rental Tools Mach. & Equip. Other Annual Maintenance Capex ~$10 - $15 million Note: Sum of components may not foot due to rounding. 21 $ MillionsQUARTERLY CAPITAL EXPENDITURES 7 7 1 6 2019 CAPEX of ~$11 million 5 4 4 4 4 4 2 3 0 3 1 1 3 1 2 2 1 1 1 2 2 1 1 1 0 Q4 2018 Q1 2019 Q2 2019 Q3 2019 Q4 2019 Q1 2020 Facilities Rental Tools Mach. & Equip. Other Annual Maintenance Capex ~$10 - $15 million Note: Sum of components may not foot due to rounding. 21 $ Millions
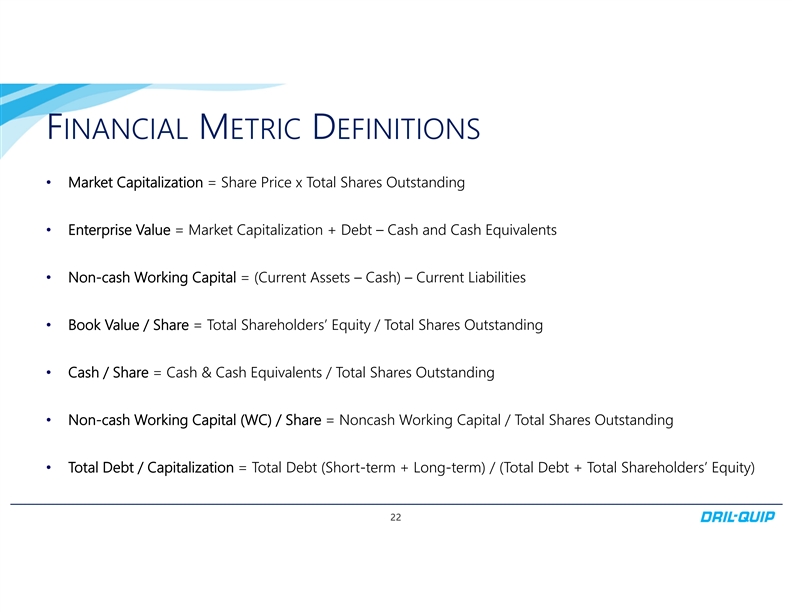
FINANCIAL METRIC DEFINITIONS • Market Capitalization = Share Price x Total Shares Outstanding • Enterprise Value = Market Capitalization + Debt – Cash and Cash Equivalents • Non-cash Working Capital = (Current Assets – Cash) – Current Liabilities • Book Value / Share = Total Shareholders’ Equity / Total Shares Outstanding • Cash / Share = Cash & Cash Equivalents / Total Shares Outstanding • Non-cash Working Capital (WC) / Share = Noncash Working Capital / Total Shares Outstanding • Total Debt / Capitalization = Total Debt (Short-term + Long-term) / (Total Debt + Total Shareholders’ Equity) 22FINANCIAL METRIC DEFINITIONS • Market Capitalization = Share Price x Total Shares Outstanding • Enterprise Value = Market Capitalization + Debt – Cash and Cash Equivalents • Non-cash Working Capital = (Current Assets – Cash) – Current Liabilities • Book Value / Share = Total Shareholders’ Equity / Total Shares Outstanding • Cash / Share = Cash & Cash Equivalents / Total Shares Outstanding • Non-cash Working Capital (WC) / Share = Noncash Working Capital / Total Shares Outstanding • Total Debt / Capitalization = Total Debt (Short-term + Long-term) / (Total Debt + Total Shareholders’ Equity) 22