Attached files
| file | filename |
|---|---|
| EX-99.1 - EX-99.1 - Ceridian HCM Holding Inc. | cday-ex991_6.htm |
| 8-K - 8-K - Ceridian HCM Holding Inc. | cday-8k_20200506.htm |
Exhibit 99.2


David Ossip
Chairman and CEO, Ceridian
From the CEO
Dear Fellow Stockholders,
I hope that you and your families are safe and well.
As we approach a period of profound uncertainty for all businesses, I can report that our first quarter financial performance was strong, and that our underlying business is performing well.
Throughout the first quarter, demand for Dayforce continued to be high, and our pipeline expanded. Even in this new environment, we continue to close business and take customers live. We launched the Dayforce Wallet, and we are seeing the demand we expected.
We continue to execute against our strategic growth agenda. We are growing our customer base, deepening and broadening our product offering, expanding into both the Enterprise segment and new international markets, and we are continuing to innovate, with new products such as Dayforce Wallet.
Before I turn to our strong first quarter results in detail, I want to share a few thoughts on the “new normal” and how we are managing the business with agility at this time.
From the outset of the COVID-19 crisis, Ceridian acted quickly and decisively to protect the health and well-being of our employees, families, customers, suppliers and the broader community, as well as to ensure our ability to continue business operations and support our customers.
Thanks to our experienced Business Continuity and IT teams, we made a quick and smooth pivot to a virtual working environment. This transition enabled the leadership team to stay focused on managing the business prudently, driving our growth strategy, and delivering quantifiable value to our customers in new and innovative ways.
Our focus remains squarely on our current and future customers. Organizations are looking for long-term partners with deep domain expertise to help them navigate the uncertainty of this time and emerge from it stronger and more resilient. Our brand promise – Makes Work Life Better™ – has never been more relevant or valuable. It is a promise to deliver hard dollar returns to our customers and to create engaging experiences for their employees.
We launched a COVID-19 Learning Portal, hosted webinars and virtual HCM Summit events, and have extended the capabilities of the Dayforce platform with timely innovations like the Dayforce Safety Monitor to help our customers and prospective customers adapt to this crisis. The reaction has been positive.
While the COVID-19 crisis will affect our business, there are a number of mitigating factors within our business model and growth strategy. Dayforce revenue is somewhat insulated from the changing employment patterns globally in that both active and inactive - including furloughed - employees contribute to our Dayforce recurring revenue base. In addition, we are in the process of moving to customer contracts with minimum employee thresholds, which will further insulate recurring revenue. We have expanded globally beyond our traditional North American geography. We have moved into the Enterprise segment demonstrably, and 88% of Dayforce users were employed at customers with more than 500 employees as of December 31, 2019. We have extended our partnerships with global systems integrators to enhance our scale now and to accelerate it in the future.
Today, our business is scalable, stronger, more resilient, and better diversified by sector, geography, and product. We believe this diversification positions us exceptionally well to lead, to capture share, and to drive profitable growth.
2 | Q1 2020 Stockholder letter
We are very pleased with our solid financial performance. Dayforce revenue growth, Cloud recurring services gross margin, and Adjusted EBITDA exceeded our expectations, indicating the strength of the underlying business.
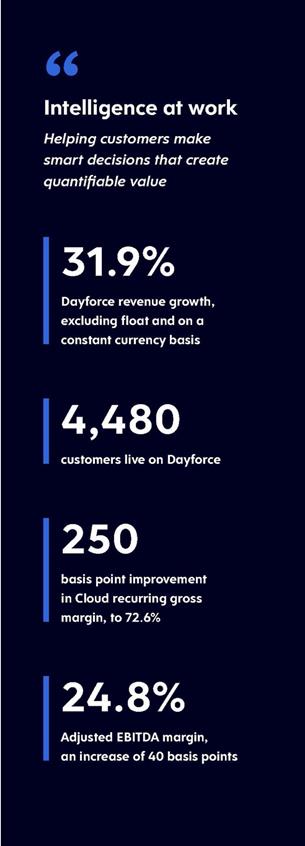
First, from a growth perspective, Dayforce revenue increased by 27.1% year-over-year. Most importantly, Dayforce revenue, excluding float revenue and on a constant currency basis, grew by 31.9% as compared to 25.3% in the same period last year, driven by a 30.4% increase in Dayforce recurring services revenue and a 36.5% increase in Dayforce professional services and other revenue.
Second, from a profitability perspective, Adjusted EBITDA margin increased by 40 basis points year-over-year to 24.8%, Cloud recurring services gross margin increased by 250 basis points to 72.6%, and Cloud professional services and other gross margin improved by 1,080 basis points to (3.4)%.
Although we began to see the impact of COVID-19 in the latter half of March, the financial impact was limited to a decline in float revenue resulting from reductions in the U.S. Federal Reserve federal funds rate and the Bank of Canada overnight rate target, which had the effect of reducing revenue and Adjusted EBITDA by approximately $1.5 million. We experienced some delays in sales and kickoffs, however these delays had minimal impact on first quarter results.
Customer highlights
In times of uncertainty, the winning organizations will become smarter in how they operate. They will spend less time on transactional tasks and more time on strategy. They will leverage a broad spectrum of data and intelligence to make smarter decisions. They will embrace change and find opportunities for value creation within it, and they’ll use modern technologies that learn and adapt and evolve along with them. We
3 | Q1 2020 Stockholder letter
believe that our suite of HCM solutions are uniquely well-positioned to enable our customers to make smart decisions that create quantifiable value and to deliver experiences their employees will love. We call this Intelligence at work, and it remains our plan for how we expect to continue to lead in the HCM space globally.
We ended the first quarter with 4,480 Dayforce customers live, an increase of 117 customers compared to the fourth quarter of 2019 and an increase of 629 customers compared to the first quarter of 2019.
Our expansion into the Enterprise segment is paying off. We continued to see success with larger customers as indicated by a 13% increase in trailing twelve months Dayforce revenue per customer to $124,129*. Trailing twelve months Incremental Dayforce revenue per customer increased by 63% to $213,196*.
Sales highlights
Underlining our continued momentum, key wins in the quarter included:
|
• |
The Society for Human Resources Management (SHRM) selected Dayforce to drive its global HR function, including payroll, benefits, workforce management, and talent management. The most trusted expert in HR chose Ceridian as its partner for their own business. |
|
• |
A staffing company that operates in over 40 states and employs over 60,000 people selected Dayforce to meet challenges managing its expansive workforce and to provide real-time labor costing. Enterprise-grade customers increasingly trust Ceridian with their complex business requirements. |
|
• |
A 5,000-employee U.S. municipal government successfully migrated from a legacy Ceridian application to Dayforce. Regulated Industries, with complex legislative requirements, continue to trust Ceridian for its intelligent approach. |
|
• |
One of the largest local newspaper organizations in the U.S., with 261 local daily brands and 23,000 employees, selected Dayforce to realize short-term hard dollar returns by consolidating and standardizing systems and processes for all |
* Excluding float revenue and on a fixed currency basis

4 | Q1 2020 Stockholder letter
areas of HCM, including pay, time, talent acquisition, talent management, and learning.
|
• |
One of the leading meat processors in Canada with 5,000 employees across 20 locations selected Dayforce to replace manual and disparate processes and drive quantifiable value for the business as a result. |
|
• |
Our global expansion strategy is driving results. |
|
|
– |
One of Australia’s largest menswear retailers, spanning five brands and 3,500 employees across Australia and New Zealand selected Dayforce for its unified time and pay capabilities and continuous calculation engine, which will enable the company to reduce payroll processing time and to eliminate manual processes. |
|
|
– |
A medical product manufacturer based in Düsseldorf, Germany, which has 10,000 employees globally, selected Dayforce to improve its workforce management, provide greater visibility and accurate, consistent data. |
|
|
– |
A global investment company with 3,800 employees in the U.S., Canada, U.K., Ireland, Hong Kong, India, and South Africa selected Dayforce to standardize disparate systems. |
And, even right now, in this unprecedented time, we believe one thing remains constant - organizations globally strive to both operate more efficiently and position for growth. In April, we continued to see success including:
|
• |
A manufactured housing community developer with 1,400 employees across 18 U.S. states selected Dayforce as a partner to provide a single HCM solution that can meet their industry specific requirements. |
|
• |
A large Canadian oil & gas development consortium with 1,800 employees selected Dayforce to reduce the number of in-house systems, to ensure compliance, and to improve employee experience. |
|
• |
A UK regional airport and a UK healthcare provider both selected Dayforce for its comprehensive functionality to meet all their needs across core HR, workforce management, and payroll. |
|
|
90,000+ |
|
|
HR and business leaders have registered for our webinar series in the last 45 days alone |
Marketing highlights
Virtual marketing has actually expanded our ability to reach potential customers. In April alone, we had over 90,000 HR and business leaders register for our webinar series, significantly more than would be common pre-COVID-19. Our key marketing metrics, including website traffic and qualified leads, are up significantly. We have hosted four virtual-format HCM Summit events, which saw record levels of attendance. Our first virtual HCM Summit had over 500 attendees, and we continued that momentum with an event for the Australia and New Zealand markets. As a result of our successful shift to digital marketing and virtual events, we have been able to reach wider audiences and increase our prospect touchpoints.
Global expansion
We announced an agreement to acquire Excelity. Building on our recent investments in Australia and New Zealand, we believe that this acquisition, which is expected to close in the second quarter, will position Ceridian as a leading HCM provider in the Asia-Pacific region. Excelity works with more than 300 clients, including Forbes, Volvo, Emerson, Oracle, QBE, Palo Alto Networks, Mammoet, Lufthansa, Uber, and Mondelez. They produce more than 1.2 million pay slips, and operate their native payroll platform in 13
5 | Q1 2020 Stockholder letter
countries, including India, China, Singapore, Hong Kong, Japan, Indonesia, South Korea, Malaysia, the Philippines, Taiwan, Thailand, Australia, and New Zealand. This acquisition provides us an opportunity to land and to expand in the Asia-Pacific region, accelerating market presence, and paves the way to extend the Dayforce native payroll platform to the Asia-Pacific region.
In addition to the Excelity acquisition, we began development of native payroll engines for Germany, Mexico, and Mauritius, which are expected to be completed in the next 18 months.
Dayforce Wallet and other product
updates
We achieved a notable milestone with the launch of www.dayforcewallet.com. Dayforce Wallet leverages the Dayforce platform’s unique continuous calculation capabilities to produce an accurate, on-demand payment, instead of an approximation of earnings. The Dayforce Wallet fundamentally changes the concept of the traditional payday as employees can request access to their pay as they earn it and need it, with no direct fees for the employer or employee.
|
|
Dayforce Wallet |
|
|
fundamentally changes the concept of the traditional payday |
The launch comes at a time when workers are feeling stressed about making ends meet, with many individuals, across income levels and employment types, living paycheck-to-paycheck. Using the Dayforce Wallet app, employees can request a payout of their earnings whenever they need it. They can also manage their finances, check their balance, and track their transaction history. We have a broad spectrum of customers across industries looking to implement Dayforce Wallet to support their workforce during this unprecedented time.

6 | Q1 2020 Stockholder letter
In the first quarter, we completed launch preparations for Dayforce Wallet, and on April 9 we activated our first customer. Danone, a global multi-national food products company operating in 120 markets, are actively adopting the Dayforce Wallet to improve the financial well-being of their employees. With a large base of front-line manufacturing staff, Danone needed an intuitive app-based solution that would drive value for their people and their business.
We will provide updates on Dayforce Wallet usage in future quarters, and we continue to expect to have more than a hundred organizations live by the end of the year.
We would also like to highlight some other Dayforce product updates for the first quarter. First, we continued to extend the Dayforce platform with the general availability of the Dayforce Engagement module, on which several customers are already live. Second, in response to the COVID-19 crisis, we launched Dayforce Safety Monitor, which enables organizations to track employee movement across facilities and to efficiently communicate potential exposure. Finally, we made COVID-19 related training content available, free-of-charge, to all Dayforce customers and prospects.
Summary
While the world has changed, customers continue to go live on the Dayforce platform. Our virtual marketing events are well attended and generating both pipeline and new sales. We are seeing solid demand for Dayforce Wallet, with live customers and prospective customers in the queue. And our investments are highly focused and tied to our stated growth initiatives that create quantifiable value for our customers.
Despite the real economic headwind we are all facing, Ceridian has underlying momentum in the business, and we believe we are well-positioned to gain share and to drive scale coming out of the crisis.
We have a strong balance sheet, and we are able to continue investing in the growth of Dayforce. We remain laser focused on delivering against our growth strategy and on delivering value to our customers and their employees and, as a result, on delivering value to you, our fellow stockholders.

7 | Q1 2020 Stockholder letter

Arthur Gitajn
Executive VP and CFO, Ceridian
From the CFO
The financial highlights below are on a year-over-year basis, unless otherwise stated. All financial results are reported in U.S. dollars unless otherwise stated.
Revenue
We are pleased with our strong financial performance in the first quarter of 2020.
|
• |
Dayforce revenue increased by $36.0 million, or 27.1%. Excluding float revenue and on a constant currency basis, Dayforce revenue increased 31.9%. The growth in Dayforce revenue, excluding float revenue and on a constant currency basis, was driven by an increase in Dayforce recurring services revenue of 30.4% and an increase in Dayforce professional services and other revenue of 36.5%. |
|
• |
Powerpay revenue increased by $0.3 million, or 1.4%. Excluding float revenue and on a constant currency basis, Powerpay revenue increased 3.8%. |
|
• |
Cloud revenue increased by $36.3 million, or 23.5%. Excluding float revenue and on a constant currency basis, Cloud revenue increased 28.1%. |
|
• |
Total revenue increased by $19.0 million, or 9.3%. Excluding float revenue and on a constant currency basis, total revenue increased 13.4%. |
The average float balance for our customer trust funds during the first quarter was approximately $4,093.3
million, compared to $4,075.4 million in the first quarter last year. The average yield on our float balance was 1.93% during the first quarter of 2020, a decline of 49 basis points compared to the average yield in the first quarter of 2019. The decline was primarily attributable to reductions in the U.S. Federal Reserve federal funds rate of 75 basis points in the second half of 2019 and 150 basis points in the first quarter of 2020, as well as a reduction in the Bank of Canada overnight rate target of 150 basis points in the first quarter of 2020. As a result, float revenue from invested customer trust funds was $19.6 million in the first quarter, compared to $24.3 million in the first quarter last year. The allocation of float revenue to Dayforce and Cloud revenue was $14.1 million and $16.9 million, respectively, in the first quarter of 2020.
In the first quarter of 2020, Cloud recurring services gross margin increased 250 basis points to 72.6%, from 70.1% in the first quarter last year, as we continued to realize economies of scale in customer support and hosting costs. Cloud professional services margin improved from (14.2)% in the first quarter last year to (3.4)%, as we continued to improve productivity in our customer implementations. Activations increased to $25.2 million, or 61.5% of Cloud professional services and other revenue, from $17.9 million, or 59.3% of Cloud professional services and other revenue in the first quarter last year. Post go-live professional services and other revenue increased to $8.7 million, or 21.1% of Cloud professional services and other revenue, from $6.7 million, or 22.2% of Cloud professional services and other revenue in the first quarter last year.
Operating profit and Adjusted EBITDA
Operating profit declined 4.0% in the first quarter of 2020, primarily as a result of share-based compensation expense, but Adjusted EBITDA improved 10.8% year-over-year. Excluding float revenue, Adjusted EBITDA increased 39.6%, reflecting gross margin improvement in our underlying Cloud business.
8 | Q1 2020 Stockholder letter
Net income and net income per share
Net income in the first quarter of 2020 was $8.6 million, or $0.06 per diluted share, compared to $11.2 million, or $0.08 per diluted share, in the first quarter of last year. Adjusted net income in the first quarter of 2020 was $22.0 million, or $0.15 per diluted share, compared to $20.4 million, or $0.14 per diluted share, in the first quarter of last year.
Balance sheet and liquidity
As of March 31, 2020, we had cash and cash equivalents of $255.3 million and availability under our revolving credit facility of $300.0 million. Our total debt balance was $674.7 million as of March 31, 2020, including financing lease obligations of $11.4 million.
On April 2, 2020, in light of the current uncertainty in the global capital markets resulting from the COVID-19 crisis, we elected to borrow $295.0 million under our revolving credit facility as a precautionary measure to increase our cash position and to preserve financial flexibility. We may use a portion of the proceeds from the borrowing for general corporate purposes.

9 | Q1 2020 Stockholder letter
Impact of COVID-19
As evidenced in our first quarter 2020 results, our underlying business remains strong, and we are executing against our strategic growth levers. Beginning in the latter half of March, however, the COVID-19 crisis began to affect our business.
|
• |
First, the monetary policy efforts of governments to mitigate the financial impacts of the COVID-19 crisis resulted in lower interest rates, which reduced actual and projected interest income, or float revenue, earned on customer trust funds. |
|
• |
Second, we began to see some impact on our recurring revenue, which is highly correlated with employment levels. From a Dayforce perspective, recurring revenue is based on active and inactive employees, including those that have been furloughed. So, Dayforce revenue growth is only impacted by those employees that have been terminated. |
|
• |
Third, the uncertainty surrounding COVID-19 began to impact sales decisions, implementation project completions, and project kickoffs. In the first quarter, the impact on recurring revenue activated was minimal; however, we did see several kickoffs pushed to later quarters. On the sales side, we continue to have a healthy pipeline, and we continue to win new customers, but the length of sales cycles has extended in some cases. |
Withdrawing guidance
It is impossible to accurately predict the depth and duration of the COVID-19 crisis, and in particular, its impact on the employment levels at our customers. Accordingly, we are suspending our remaining quarterly guidance and withdrawing our full year 2020 guidance at this time.
To help stockholders and analysts to understand the impact of COVID-19 on our business as the COVID-19 recovery progresses, we are providing additional detail on revenue and performance indicators.
Second quarter 2020 Dayforce revenue
In the second quarter, we expect Dayforce revenue growth between 15% to 20%, excluding float revenue and on a constant currency basis.
Employment levels at existing Dayforce customers
We invoice Dayforce recurring services revenue on a per-employee, per-month (“PEPM”) basis, generally one month in advance, based on the total of active and inactive employees in the system as measured on the 15th of the previous month. Furloughed employees are included in the inactive employee counts. From April 15, 2019 to April 15, 2020, we experienced a net 17% increase in the number of Dayforce users; however, this was 190,000, or approximately 5%, less than our planned expectations.
Subsequent to April 15, 2020, we have observed that the rate of decline in Dayforce users has slowed.
Float revenue on customer trust funds
From the time we provided guidance on February 5, 2020, the Federal Reserve rate has been reduced by 150 basis points to 0.25%, and the Bank of Canada rate has been reduced by 150 basis points to 0.25%. Consistent with our previous disclosure, each 100 basis point decline in market investment rates would result in an approximately $18 million decline in float revenue over the ensuing twelve month period. Based on current market investment rates and assuming no such changes in rates for the remainder of the year, we estimate that float revenue for the full year 2020 would be approximately $48 million, or approximately $22 million lower than our previous full year 2020 guidance.
Foreign exchange impacts
The guidance issued on February 5, 2020, assumed an average U.S. dollar to Canadian dollar foreign exchange rate during the fourth quarter of 2019 of $1.32. Over the past two months, the U.S. dollar to Canadian dollar foreign exchange rate has averaged approximately $1.40; and assuming this rate, revenue would be approximately $10 to $12 million less than our previous full year 2020 guidance. We do not expect a material impact to our Adjusted EBITDA as a result of foreign exchange fluctuations, as our revenues and expenses in Canada are roughly matched.
10 | Q1 2020 Stockholder letter
Powerpay, which constitutes approximately 10% of first quarter 2020 total revenue, is invoiced on a fixed fee plus per-check basis. Approximately 40% of the Powerpay recurring revenue is from the per-check fees. Unlike Dayforce, we do not earn check fees for furloughed employees.
As of March 31, 2020, the number of Powerpay paid employees had declined approximately 13% from pre-COVID-19 levels. We monitor these counts daily, and although we experienced an additional decline of 4% from March 31, 2020 through April 30, 2020, the number of Powerpay paid employees increased modestly in each of the last six days of April.
Bureau
Bureau, which includes both payroll solutions and stand-alone tax solutions, constituted approximately 14% of first quarter 2020 total revenue.
With regard to Bureau payroll solutions, representing approximately 60% of first quarter 2020 Bureau revenue, we typically charge recurring fees on a per-employee, per-process basis. Unlike Dayforce, we do not earn check fees for furloughed employees.
With regard to Bureau stand-alone tax solutions, representing approximately 40% of first quarter 2020 Bureau revenue, invoicing is generally based on a flat monthly fee plus a per-jurisdiction filing fee. As such, we believe revenue from Bureau stand-alone tax solutions will be less impacted by changes in employment levels than revenue from Bureau payroll solutions.

11 | Q1 2020 Stockholder letter
Condensed Consolidated Balance Sheets
(Dollars in millions, except share data)
|
|
|
March 31, |
|
|
December 31, |
|
||
|
|
|
2020 |
|
|
2019 |
|
||
|
Assets |
|
(unaudited) |
|
|
|
|
|
|
|
Current assets: |
|
|
|
|
|
|
|
|
|
Cash and equivalents |
|
$ |
255.3 |
|
|
$ |
281.3 |
|
|
Trade and other receivables, net |
|
|
82.8 |
|
|
|
80.4 |
|
|
Prepaid expenses and other current assets |
|
|
68.9 |
|
|
|
57.9 |
|
|
Total current assets before customer trust funds |
|
|
407.0 |
|
|
|
419.6 |
|
|
Customer trust funds |
|
|
3,649.5 |
|
|
|
3,204.1 |
|
|
Total current assets |
|
|
4,056.5 |
|
|
|
3,623.7 |
|
|
Right of use lease asset |
|
|
34.8 |
|
|
|
32.0 |
|
|
Property, plant, and equipment, net |
|
|
124.6 |
|
|
|
128.3 |
|
|
Goodwill |
|
|
1,939.5 |
|
|
|
1,973.5 |
|
|
Other intangible assets, net |
|
|
176.5 |
|
|
|
177.9 |
|
|
Other assets |
|
|
138.2 |
|
|
|
150.3 |
|
|
Total assets |
|
$ |
6,470.1 |
|
|
$ |
6,085.7 |
|
|
Liabilities and equity |
|
|
|
|
|
|
|
|
|
Current liabilities: |
|
|
|
|
|
|
|
|
|
Current portion of long-term debt |
|
$ |
9.7 |
|
|
$ |
10.8 |
|
|
Current portion of long-term lease liabilities |
|
|
8.4 |
|
|
|
8.8 |
|
|
Accounts payable |
|
|
34.9 |
|
|
|
43.2 |
|
|
Deferred revenue |
|
|
26.8 |
|
|
|
25.5 |
|
|
Employee compensation and benefits |
|
|
49.3 |
|
|
|
75.9 |
|
|
Other accrued expenses |
|
|
18.4 |
|
|
|
13.9 |
|
|
Total current liabilities before customer trust funds obligations |
|
|
147.5 |
|
|
|
178.1 |
|
|
Customer trust funds obligations |
|
|
3,605.2 |
|
|
|
3,193.6 |
|
|
Total current liabilities |
|
|
3,752.7 |
|
|
|
3,371.7 |
|
|
Long-term debt, less current portion |
|
|
665.0 |
|
|
|
666.3 |
|
|
Employee benefit plans |
|
|
113.9 |
|
|
|
117.2 |
|
|
Long-term lease liabilities, less current portion |
|
|
32.8 |
|
|
|
30.1 |
|
|
Other liabilities |
|
|
20.1 |
|
|
|
18.1 |
|
|
Total liabilities |
|
|
4,584.5 |
|
|
|
4,203.4 |
|
|
Commitments and contingencies |
|
|
|
|
|
|
|
|
|
Stockholders’ equity: |
|
|
|
|
|
|
|
|
|
Common stock, $0.01 par, 500,000,000 shares authorized, 144,937,946 and 144,386,618 shares issued and outstanding as of March 31, 2020, and December 31, 2019, respectively |
|
|
1.4 |
|
|
|
1.4 |
|
|
Additional paid in capital |
|
|
2,473.0 |
|
|
|
2,449.1 |
|
|
Accumulated deficit |
|
|
(221.2 |
) |
|
|
(229.8 |
) |
|
Accumulated other comprehensive loss |
|
|
(367.6 |
) |
|
|
(338.4 |
) |
|
Total stockholders’ equity |
|
|
1,885.6 |
|
|
|
1,882.3 |
|
|
Total liabilities and equity |
|
$ |
6,470.1 |
|
|
$ |
6,085.7 |
|
12 | Q1 2020 Stockholder letter
Condensed Consolidated Statements of Operations
(Unaudited, dollars in millions, except share and per share data)
|
|
|
Three months ended March 31, |
|
|||||
|
|
|
2020 |
|
|
2019 |
|
||
|
Revenue: |
|
|
|
|
|
|
|
|
|
Recurring services |
|
$ |
181.5 |
|
|
$ |
172.8 |
|
|
Professional services and other |
|
|
41.2 |
|
|
|
30.9 |
|
|
Total revenue |
|
|
222.7 |
|
|
|
203.7 |
|
|
Cost of revenue: |
|
|
|
|
|
|
|
|
|
Recurring services |
|
|
52.2 |
|
|
|
50.9 |
|
|
Professional services and other |
|
|
42.6 |
|
|
|
35.3 |
|
|
Product development and management |
|
|
17.6 |
|
|
|
15.2 |
|
|
Depreciation and amortization |
|
|
9.8 |
|
|
|
8.7 |
|
|
Total cost of revenue |
|
|
122.2 |
|
|
|
110.1 |
|
|
Gross profit |
|
|
100.5 |
|
|
|
93.6 |
|
|
Selling, general, and administrative |
|
|
74.2 |
|
|
|
66.2 |
|
|
Operating profit |
|
|
26.3 |
|
|
|
27.4 |
|
|
Interest expense, net |
|
|
6.9 |
|
|
|
8.9 |
|
|
Other expense, net |
|
|
2.6 |
|
|
|
1.6 |
|
|
Income before income taxes |
|
|
16.8 |
|
|
|
16.9 |
|
|
Income tax expense |
|
|
8.2 |
|
|
|
5.7 |
|
|
Net income |
|
$ |
8.6 |
|
|
$ |
11.2 |
|
|
Net income per share: |
|
|
|
|
|
|
|
|
|
Basic |
|
$ |
0.06 |
|
|
$ |
0.08 |
|
|
Diluted |
|
$ |
0.06 |
|
|
$ |
0.08 |
|
|
Weighted-average shares outstanding: |
|
|
|
|
|
|
|
|
|
Basic |
|
|
144,645,325 |
|
|
|
140,149,271 |
|
|
Diluted |
|
|
151,178,498 |
|
|
|
147,042,228 |
|
13 | Q1 2020 Stockholder letter
Condensed Consolidated Statements of Cash Flows
(Unaudited, dollars in millions)
|
|
|
Three months ended March 31, |
|
|||||
|
|
|
2020 |
|
|
2019 |
|
||
|
Net income |
|
$ |
8.6 |
|
|
$ |
11.2 |
|
|
Adjustments to reconcile net income to net cash provided by (used in) operating activities: |
|
|
|
|
|
|
|
|
|
Deferred income tax expense (benefit) |
|
|
4.1 |
|
|
|
(1.9 |
) |
|
Depreciation and amortization |
|
|
11.8 |
|
|
|
14.4 |
|
|
Amortization of debt issuance costs and debt discount |
|
|
0.3 |
|
|
|
0.3 |
|
|
Net periodic pension and postretirement cost |
|
|
0.8 |
|
|
|
1.3 |
|
|
Non-cash share-based compensation |
|
|
12.5 |
|
|
|
6.0 |
|
|
Other |
|
|
0.8 |
|
|
|
0.5 |
|
|
Changes in operating assets and liabilities excluding effects of acquisitions and divestitures: |
|
|
|
|
|
|
|
|
|
Trade and other receivables |
|
|
(4.5 |
) |
|
|
(3.8 |
) |
|
Prepaid expenses and other current assets |
|
|
(7.5 |
) |
|
|
(7.0 |
) |
|
Accounts payable and other accrued expenses |
|
|
(2.0 |
) |
|
|
(5.8 |
) |
|
Deferred revenue |
|
|
2.1 |
|
|
|
(0.2 |
) |
|
Employee compensation and benefits |
|
|
(26.4 |
) |
|
|
(16.9 |
) |
|
Accrued interest |
|
|
— |
|
|
|
3.4 |
|
|
Accrued taxes |
|
|
0.9 |
|
|
|
(8.1 |
) |
|
Other assets and liabilities |
|
|
(0.1 |
) |
|
|
(2.2 |
) |
|
Net cash provided by (used in) operating activities |
|
|
1.4 |
|
|
|
(8.8 |
) |
|
Cash Flows from Investing Activities |
|
|
|
|
|
|
|
|
|
Purchase of customer trust funds marketable securities |
|
|
(24.6 |
) |
|
|
(143.3 |
) |
|
Proceeds from sale and maturity of customer trust funds marketable securities |
|
|
49.5 |
|
|
|
49.8 |
|
|
Expenditures for property, plant, and equipment |
|
|
(4.9 |
) |
|
|
(4.0 |
) |
|
Expenditures for software and technology |
|
|
(10.7 |
) |
|
|
(9.9 |
) |
|
Acquisition costs, net of cash acquired |
|
|
— |
|
|
|
(10.2 |
) |
|
Net cash provided by (used in) investing activities |
|
|
9.3 |
|
|
|
(117.6 |
) |
|
Cash Flows from Financing Activities |
|
|
|
|
|
|
|
|
|
Increase in customer trust funds obligations, net |
|
|
480.8 |
|
|
|
1,916.1 |
|
|
Proceeds from issuance of common stock under share-based compensation plans |
|
|
11.4 |
|
|
|
20.1 |
|
|
Repayment of long-term debt obligations |
|
|
(2.7 |
) |
|
|
(1.7 |
) |
|
Net cash provided by financing activities |
|
|
489.5 |
|
|
|
1,934.5 |
|
|
Effect of exchange rate changes on cash, restricted cash, and equivalents |
|
|
(14.5 |
) |
|
|
3.9 |
|
|
Net increase in cash, restricted cash, and equivalents |
|
|
485.7 |
|
|
|
1,812.0 |
|
|
Cash, restricted cash, and equivalents at beginning of period |
|
|
1,658.6 |
|
|
|
1,106.3 |
|
|
Cash, restricted cash, and equivalents at end of period |
|
$ |
2,144.3 |
|
|
$ |
2,918.3 |
|
|
Reconciliation of cash, restricted cash, and equivalents to the condensed consolidated balance sheets |
|
|
|
|
|
|
|
|
|
Cash and equivalents |
|
$ |
255.3 |
|
|
$ |
206.3 |
|
|
Restricted cash and equivalents included in customer trust funds |
|
|
1,889.0 |
|
|
|
2,712.0 |
|
|
Total cash, restricted cash, and equivalents |
|
$ |
2,144.3 |
|
|
$ |
2,918.3 |
|
14 | Q1 2020 Stockholder letter
Revenue Financial Measures
(Unaudited)
|
|
|
Three months ended March 31, |
|
|
Percentage change in revenue as reported |
|
|
Impact of changes in foreign currency (a) |
|
|
Percentage change in revenue on constant currency basis (a) |
|
||||||||
|
|
|
2020 |
|
|
2019 |
|
|
2020 vs. 2019 |
|
|
|
|
|
|
2020 vs. 2019 |
|
||||
|
|
|
(Dollars in millions) |
|
|
|
|
|
|
|
|
|
|
|
|
|
|||||
|
Revenue: |
|
|
|
|
|
|
|
|
|
|
|
|
|
|
|
|
|
|
|
|
|
Dayforce recurring services, excluding float |
|
$ |
114.0 |
|
|
$ |
87.6 |
|
|
|
30.1 |
% |
|
|
(0.3 |
)% |
|
|
30.4 |
% |
|
Dayforce float |
|
|
14.1 |
|
|
|
15.3 |
|
|
|
(7.8 |
)% |
|
|
(— |
)% |
|
|
(7.8 |
)% |
|
Total Dayforce recurring services |
|
|
128.1 |
|
|
|
102.9 |
|
|
|
24.5 |
% |
|
|
(0.2 |
)% |
|
|
24.7 |
% |
|
Powerpay recurring services, excluding float |
|
|
19.0 |
|
|
|
18.3 |
|
|
|
3.8 |
% |
|
|
(— |
)% |
|
|
3.8 |
% |
|
Powerpay float |
|
|
2.8 |
|
|
|
3.2 |
|
|
|
(12.5 |
)% |
|
|
(— |
)% |
|
|
(12.5 |
)% |
|
Total Powerpay recurring services |
|
|
21.8 |
|
|
|
21.5 |
|
|
|
1.4 |
% |
|
|
(— |
)% |
|
|
1.4 |
% |
|
Total Cloud recurring services |
|
|
149.9 |
|
|
|
124.4 |
|
|
|
20.5 |
% |
|
|
(0.2 |
)% |
|
|
20.7 |
% |
|
Dayforce professional services and other |
|
|
40.7 |
|
|
|
29.9 |
|
|
|
36.1 |
% |
|
|
(0.4 |
)% |
|
|
36.5 |
% |
|
Powerpay professional services and other |
|
|
0.3 |
|
|
|
0.3 |
|
|
|
(— |
)% |
|
|
(— |
)% |
|
|
(— |
)% |
|
Total Cloud professional services and other |
|
|
41.0 |
|
|
|
30.2 |
|
|
|
35.8 |
% |
|
|
(0.3 |
)% |
|
|
36.1 |
% |
|
Total Cloud revenue |
|
|
190.9 |
|
|
|
154.6 |
|
|
|
23.5 |
% |
|
|
(0.2 |
)% |
|
|
23.7 |
% |
|
Bureau recurring services, excluding float |
|
|
28.9 |
|
|
|
42.6 |
|
|
|
(32.2 |
)% |
|
|
(0.3 |
)% |
|
|
(31.9 |
)% |
|
Bureau float |
|
|
2.7 |
|
|
|
5.8 |
|
|
|
(53.4 |
)% |
|
|
(— |
)% |
|
|
(53.4 |
)% |
|
Total Bureau recurring services |
|
|
31.6 |
|
|
|
48.4 |
|
|
|
(34.7 |
)% |
|
|
(0.2 |
)% |
|
|
(34.5 |
)% |
|
Bureau professional services and other |
|
|
0.2 |
|
|
|
0.7 |
|
|
|
(71.4 |
)% |
|
|
(— |
)% |
|
|
(71.4 |
)% |
|
Total Bureau revenue |
|
|
31.8 |
|
|
|
49.1 |
|
|
|
(35.2 |
)% |
|
|
(0.2 |
)% |
|
|
(35.0 |
)% |
|
Total revenue |
|
$ |
222.7 |
|
|
$ |
203.7 |
|
|
|
9.3 |
% |
|
|
(0.2 |
)% |
|
|
9.5 |
% |
|
|
|
|
|
|
|
|
|
|
|
|
|
|
|
|
|
|
|
|
|
|
|
Dayforce |
|
$ |
168.8 |
|
|
$ |
132.8 |
|
|
|
27.1 |
% |
|
|
(0.2 |
)% |
|
|
27.3 |
% |
|
Powerpay |
|
|
22.1 |
|
|
|
21.8 |
|
|
|
1.4 |
% |
|
|
(— |
)% |
|
|
1.4 |
% |
|
Total Cloud revenue |
|
$ |
190.9 |
|
|
$ |
154.6 |
|
|
|
23.5 |
% |
|
|
(0.2 |
)% |
|
|
23.7 |
% |
|
|
|
|
|
|
|
|
|
|
|
|
|
|
|
|
|
|
|
|
|
|
|
Dayforce, excluding float |
|
$ |
154.7 |
|
|
$ |
117.5 |
|
|
|
31.7 |
% |
|
|
(0.2 |
)% |
|
|
31.9 |
% |
|
Powerpay, excluding float |
|
|
19.3 |
|
|
|
18.6 |
|
|
|
3.8 |
% |
|
|
(— |
)% |
|
|
3.8 |
% |
|
Cloud revenue, excluding float |
|
|
174.0 |
|
|
|
136.1 |
|
|
|
27.8 |
% |
|
|
(0.3 |
)% |
|
|
28.1 |
% |
|
Cloud float |
|
|
16.9 |
|
|
|
18.5 |
|
|
|
(8.6 |
)% |
|
|
(— |
)% |
|
|
(8.6 |
)% |
|
Total Cloud revenue |
|
$ |
190.9 |
|
|
$ |
154.6 |
|
|
|
23.5 |
% |
|
|
(0.2 |
)% |
|
|
23.7 |
% |
|
(a) |
We have calculated revenue on a constant currency basis by applying the average foreign exchange rate in effect during the comparable prior period. |
15 | Q1 2020 Stockholder letter
Reconciliation of GAAP to Non-GAAP Financial Measures
(Unaudited)
The following tables present a reconciliation of our reported results to our non-GAAP financial measures Adjusted EBITDA, Adjusted EBITDA margin, and Adjusted net income for all periods presented:
|
|
|
Three months ended March 31, |
|
|||||
|
|
|
2020 |
|
|
2019 |
|
||
|
|
|
($ in millions) |
|
|||||
|
Operating profit |
|
$ |
26.3 |
|
|
$ |
27.4 |
|
|
Other expense, net |
|
|
(2.6 |
) |
|
|
(1.6 |
) |
|
Depreciation and amortization |
|
|
11.8 |
|
|
|
14.4 |
|
|
EBITDA (a) |
|
|
35.5 |
|
|
|
40.2 |
|
|
Intercompany foreign exchange loss |
|
|
1.8 |
|
|
|
0.3 |
|
|
Share-based compensation (b) |
|
|
12.7 |
|
|
|
6.0 |
|
|
Severance charges (c) |
|
|
4.0 |
|
|
|
2.1 |
|
|
Restructuring consulting fees (d) |
|
|
1.5 |
|
|
|
1.2 |
|
|
Other non-recurring charges (e) |
|
|
(0.3 |
) |
|
|
— |
|
|
Adjusted EBITDA |
|
$ |
55.2 |
|
|
$ |
49.8 |
|
|
Adjusted EBITDA margin |
|
|
24.8 |
% |
|
|
24.4 |
% |
|
(a) |
We define EBITDA as net income before interest, taxes, and depreciation and amortization. |
|
(b) |
Represents share-based compensation expense and related employer taxes. |
|
(c) |
Represents costs for severance compensation paid to employees whose positions have been eliminated or who have been terminated not for cause. |
|
(d) |
Represents consulting fees and expenses incurred during the periods presented in connection with any acquisition, investment, disposition, recapitalization, equity offering, issuance or repayment of debt, issuance of equity interests, or refinancing. |
|
(e) |
Represents gain on unrecovered duplicate payments associated with an isolated service incident. |
16 | Q1 2020 Stockholder letter
|
|
|
Three months ended March 31, 2020 |
|
|||||||||||||||||||||
|
|
|
As Reported |
|
|
Share-based compensation |
|
|
Severance charges |
|
|
Other (a) |
|
|
Income tax effects (b) |
|
|
Adjusted |
|
||||||
|
|
|
(Dollars in millions, except per share data) |
|
|||||||||||||||||||||
|
Cost of revenue: |
|
|
|
|
|
|
|
|
|
|
|
|
|
|
|
|
|
|
|
|
|
|
|
|
|
Recurring services |
|
$ |
52.2 |
|
|
$ |
0.8 |
|
|
$ |
0.8 |
|
|
$ |
— |
|
|
$ |
— |
|
|
$ |
50.6 |
|
|
Professional services and other |
|
|
42.6 |
|
|
|
0.5 |
|
|
|
0.8 |
|
|
|
— |
|
|
|
— |
|
|
|
41.3 |
|
|
Product development and management |
|
|
17.6 |
|
|
|
0.9 |
|
|
|
0.3 |
|
|
|
— |
|
|
|
— |
|
|
|
16.4 |
|
|
Depreciation and amortization |
|
|
9.8 |
|
|
|
— |
|
|
|
— |
|
|
|
— |
|
|
|
— |
|
|
|
9.8 |
|
|
Total cost of revenue |
|
|
122.2 |
|
|
|
2.2 |
|
|
|
1.9 |
|
|
|
— |
|
|
|
— |
|
|
|
118.1 |
|
|
Sales and marketing |
|
|
40.7 |
|
|
|
2.2 |
|
|
|
0.8 |
|
|
|
— |
|
|
|
— |
|
|
|
37.7 |
|
|
General and administrative |
|
|
33.5 |
|
|
|
8.3 |
|
|
|
1.3 |
|
|
|
1.2 |
|
|
|
— |
|
|
|
22.7 |
|
|
Operating profit |
|
|
26.3 |
|
|
|
12.7 |
|
|
|
4.0 |
|
|
|
1.2 |
|
|
|
— |
|
|
|
44.2 |
|
|
Other expense, net |
|
|
2.6 |
|
|
|
— |
|
|
|
— |
|
|
|
1.8 |
|
|
|
— |
|
|
|
0.8 |
|
|
Depreciation and amortization |
|
|
11.8 |
|
|
|
— |
|
|
|
— |
|
|
|
— |
|
|
|
— |
|
|
|
11.8 |
|
|
EBITDA |
|
$ |
35.5 |
|
|
$ |
12.7 |
|
|
$ |
4.0 |
|
|
$ |
3.0 |
|
|
$ |
— |
|
|
$ |
55.2 |
|
|
Net income |
|
$ |
8.6 |
|
|
$ |
12.7 |
|
|
$ |
4.0 |
|
|
$ |
3.0 |
|
|
$ |
(6.3 |
) |
|
$ |
22.0 |
|
|
Net income per share- basic (c) |
|
$ |
0.06 |
|
|
$ |
0.08 |
|
|
$ |
0.03 |
|
|
$ |
0.02 |
|
|
$ |
(0.04 |
) |
|
$ |
0.15 |
|
|
Net income per share- diluted (c) |
|
$ |
0.06 |
|
|
$ |
0.08 |
|
|
$ |
0.03 |
|
|
$ |
0.02 |
|
|
$ |
(0.04 |
) |
|
$ |
0.15 |
|
|
(a) |
Other includes intercompany foreign exchange loss, restructuring consulting fees, and other non-recurring charges. |
|
(b) |
Income tax effects have been calculated based on the statutory tax rates in effect in the U.S. and foreign jurisdictions during the quarter. |
|
(c) |
GAAP and Adjusted basic and diluted net income per share are calculated based upon 144,645,325 and 151,178,498 weighted-average shares of common stock, respectively. |
17 | Q1 2020 Stockholder letter
|
|
Three months ended March 31, 2019 |
|
||||||||||||||||||||||
|
|
|
As Reported |
|
|
Share-based compensation |
|
|
Severance charges |
|
|
Other (a) |
|
|
Income tax effects (b) |
|
|
Adjusted |
|
||||||
|
|
|
(Dollars in millions, except per share data) |
|
|||||||||||||||||||||
|
Cost of revenue: |
|
|
|
|
|
|
|
|
|
|
|
|
|
|
|
|
|
|
|
|
|
|
|
|
|
Recurring services |
|
$ |
50.9 |
|
|
$ |
0.4 |
|
|
$ |
0.2 |
|
|
$ |
— |
|
|
$ |
— |
|
|
$ |
50.3 |
|
|
Professional services and other |
|
|
35.3 |
|
|
|
0.2 |
|
|
|
0.2 |
|
|
|
— |
|
|
|
— |
|
|
|
34.9 |
|
|
Product development and management |
|
|
15.2 |
|
|
|
0.5 |
|
|
|
0.1 |
|
|
|
— |
|
|
|
— |
|
|
|
14.6 |
|
|
Depreciation and amortization |
|
|
8.7 |
|
|
|
— |
|
|
|
— |
|
|
|
— |
|
|
|
— |
|
|
|
8.7 |
|
|
Total cost of revenue |
|
|
110.1 |
|
|
|
1.1 |
|
|
|
0.5 |
|
|
|
— |
|
|
|
— |
|
|
|
108.5 |
|
|
Sales and marketing |
|
|
35.2 |
|
|
|
1.0 |
|
|
|
1.0 |
|
|
|
— |
|
|
|
— |
|
|
|
33.2 |
|
|
General and administrative |
|
|
31.0 |
|
|
|
3.9 |
|
|
|
0.6 |
|
|
|
1.2 |
|
|
|
— |
|
|
|
25.3 |
|
|
Operating profit |
|
|
27.4 |
|
|
|
6.0 |
|
|
|
2.1 |
|
|
|
1.2 |
|
|
|
— |
|
|
|
36.7 |
|
|
Other expense, net |
|
|
1.6 |
|
|
|
— |
|
|
|
— |
|
|
|
0.3 |
|
|
|
— |
|
|
|
1.3 |
|
|
Depreciation and amortization |
|
|
14.4 |
|
|
|
— |
|
|
|
— |
|
|
|
— |
|
|
|
— |
|
|
|
14.4 |
|
|
EBITDA |
|
$ |
40.2 |
|
|
$ |
6.0 |
|
|
$ |
2.1 |
|
|
$ |
1.5 |
|
|
$ |
— |
|
|
$ |
49.8 |
|
|
Net income |
|
$ |
11.2 |
|
|
$ |
6.0 |
|
|
$ |
2.1 |
|
|
$ |
1.5 |
|
|
$ |
(0.4 |
) |
|
$ |
20.4 |
|
|
Net income per share- basic (c) |
|
$ |
0.08 |
|
|
$ |
0.05 |
|
|
$ |
0.01 |
|
|
$ |
0.01 |
|
|
$ |
— |
|
|
$ |
0.15 |
|
|
Net income per share- diluted (c) |
|
$ |
0.08 |
|
|
$ |
0.04 |
|
|
$ |
0.01 |
|
|
$ |
0.01 |
|
|
$ |
— |
|
|
$ |
0.14 |
|
|
(a) |
Other includes intercompany foreign exchange gain and restructuring consulting fees. |
|
(b) |
We have not applied an income tax effect to expenses incurred in the U.S. due to a full valuation allowance against our deferred tax assets as of March 31, 2019. Income tax effect in foreign jurisdictions is calculated based on the statutory tax rates during the quarter. |
|
(c) |
GAAP and Adjusted basic and diluted net income per share are calculated based upon 140,149,271 and 147,042,228 weighted-average shares of common stock, respectively. |
18 | Q1 2020 Stockholder letter
Use of Non-GAAP Financial Measures
We use certain non-GAAP financial measures in this stockholder letter including Adjusted EBITDA, Adjusted EBITDA margin, Adjusted net income, and revenue on a constant currency and fixed currency basis. We believe that Adjusted EBITDA, Adjusted EBITDA margin, and Adjusted net income, non-GAAP financial measures, are useful to management and investors as supplemental measures to evaluate our overall operating performance. Adjusted EBITDA and Adjusted EBITDA margin are components of our management incentive plan and are used by management to assess performance and to compare our operating performance to our competitors. We define Adjusted EBITDA as net income before interest, taxes, depreciation, and amortization, as adjusted to exclude gain (loss) on assets and liabilities held in a foreign currency other than the functional currency of a company subsidiary, share-based compensation expense and related employer taxes, severance charges, restructuring consulting fees, and other non-recurring charges. Adjusted EBITDA margin is determined by calculating the percentage Adjusted EBITDA is of total revenue. Adjusted net income is defined as net income, as adjusted to exclude release of the valuation allowance, gain (loss) on assets and liabilities held in a foreign currency other than the functional currency of a company subsidiary, share-based compensation expense and related employer taxes, severance charges, restructuring consulting fees, and other non-recurring charges, all of which are adjusted for the effect of income taxes. Management believes that Adjusted EBITDA, Adjusted EBITDA margin, and Adjusted net income are helpful in highlighting management performance trends because Adjusted EBITDA, Adjusted EBITDA margin, and Adjusted net income exclude the results of decisions that are outside the normal course of our business operations.
Our presentation of Adjusted EBITDA, Adjusted EBITDA margin, and Adjusted net income are intended as supplemental measures of our performance that are not required by, or presented in accordance with, GAAP. Adjusted EBITDA, Adjusted EBITDA margin, and Adjusted net income
should not be considered as alternatives to operating profit, net income, earnings per share, or any other performance measures derived in accordance with GAAP, or as measures of operating cash flows or liquidity. Our presentation of Adjusted EBITDA, Adjusted EBITDA margin, and Adjusted net income should not be construed to imply that our future results will be unaffected by similar items to those eliminated in this presentation. Adjusted EBITDA, Adjusted EBITDA margin, and Adjusted net income are included in this discussion because they are key metrics used by management to assess our operating performance.
Adjusted EBITDA, Adjusted EBITDA margin, and Adjusted net income are not defined under GAAP, are not measures of net income, operating profit, or any other performance measures derived in accordance with GAAP, and are subject to important limitations. Our use of the terms Adjusted EBITDA, Adjusted EBITDA margin, and Adjusted net income may not be comparable to similarly titled measures of other companies in our industry and are not measures of performance calculated in accordance with GAAP.
Adjusted EBITDA, Adjusted EBITDA margin, and Adjusted net income have important limitations as analytical tools, and you should not consider them in isolation or as substitutes for analysis of our results as reported under GAAP.
In evaluating Adjusted EBITDA, Adjusted EBITDA margin, and Adjusted net income, you should be aware that in the future we may incur expenses similar to those eliminated in this presentation.
We present revenue on a constant currency and fixed currency basis to assess how our underlying businesses performed, excluding the effect of foreign currency rate fluctuations, which we believe is useful to management and investors. We calculate revenue on a constant currency basis by applying the average foreign exchange rate in effect during the comparable prior period. Dayforce revenue per customer is calculated on a fixed currency basis by applying the prior year average exchange rate to all comparable periods.
19 | Q1 2020 Stockholder letter
This stockholder letter contains forward-looking statements that are subject to risks and uncertainties. All statements other than statements of historical fact or relating to present facts or current conditions included in this press release are forward-looking statements. Forward-looking statements give our current expectations and projections relating to our financial condition, results of operations, plans, objectives, future performance and business. You can identify forward-looking statements by the fact that they do not relate strictly to historical or current facts. Forward-looking statements in this stockholder letter include statements relating to second quarter and full year fiscal 2020, as well as those relating to future growth initiatives. These statements may include words such as “anticipate,” “estimate,” “expect,” “project,” “seek,” “plan,” “intend,” “believe,” “will,” “may,” “could,” “continue,” “likely,” “should,” and other words and terms of similar meaning in connection with any discussion of the timing or nature of future operating or financial performance or other events but not all forward-looking statements contain these identifying words. The forward-looking statements contained in this press release are based on assumptions that we have made in light of our industry experience and our perceptions of historical trends, current conditions, expected future developments and other factors that we believe are appropriate under the circumstances. As you consider this press release, you should understand that these statements are not guarantees of performance or results. These assumptions and our future performance or results involve risks and uncertainties (many of which are beyond our control). These risks and uncertainties include, but are not limited to, the following:
|
• |
the impact of the Coronavirus disease 2019 (“COVID-19”) pandemic on our business, operations, and financial results; |
|
• |
our inability to attain or to maintain profitability; |
|
• |
significant competition for our solutions; |
|
• |
our inability to continue to develop or to sell our existing Cloud solutions; |
|
• |
our inability to manage our growth effectively; |
|
• |
the risk that we may not be able to successfully migrate our Bureau customers to our Cloud |
|
solutions or to offset the decline in Bureau revenue with Cloud revenue; |
|
• |
the decline or slower than expected development of the market for enterprise cloud computing; |
|
• |
failure of our efforts to increase use of our Cloud solutions and our other applications may not succeed; |
|
• |
our failure to provide enhancements and new features and modifications to our solutions; |
|
• |
failure to comply the Federal Trade Commission’s ongoing consent order regarding data protection; |
|
• |
system interruptions or failures, including cyber-security breaches, identity theft, or other disruptions that could compromise our information; |
|
• |
our failure to comply with applicable privacy, security, data, and financial services laws, regulations and standards; |
|
• |
changes in regulations governing financial services, privacy concerns, and laws or other domestic or foreign data protection regulations; |
|
• |
the risk of loss caused by customer failure to repay distribution of earned net wages and associated tax amounts made on behalf of our customers for our Dayforce Wallet or other services; |
|
• |
our inability to successfully expand our current offerings into new markets or further penetrate existing markets; |
|
• |
our inability to meet the more complex configuration and integration demands of our large customers; |
|
• |
reductions in our customers’ employment levels or other overall declines in the financial viability of our current and prospective customers; |
|
• |
the risk of our customers declining to renew their agreements with us or renewing at lower performance fee levels; |
|
• |
our failure to manage our technical operations infrastructure; |
|
• |
our inability to maintain necessary third party relationships, and third party software licenses or there are errors in the software we license; |
|
• |
our inability to protect our intellectual property rights, proprietary technology, information, processes, and know-how; |
20 | Q1 2020 Stockholder letter
|
• |
our failure to keep pace with rapid technological changes and evolving industry standards; |
|
• |
general economic, political and market forces beyond our control; |
|
• |
changes in laws and regulations related to the Internet or changes in the Internet infrastructure itself; or |
|
• |
other risks and uncertainties described in our most recent annual report on Form 10-K, subsequent quarterly reports on Form 10-Q, and other filings with the Securities and Exchange Commission. |
Additional factors or events that could cause our actual performance to differ from these forward-looking statements may emerge from time to time, and it is not possible for us to predict all of them. Should one or more of these risks or uncertainties materialize, or should any of our assumptions prove incorrect, our actual financial condition, results of operations, future performance and business may vary in material respects from the performance projected in these forward-looking statements. In addition to any factors and assumptions set forth above in this press release, the material factors and assumptions used to develop the forward-looking information include, but are not limited to: the general economy remains stable; the competitive environment in the HCM market remains stable; the demand environment for HCM solutions remains stable; our implementation capabilities and cycle times remain stable; foreign exchange rates, both current and those used in developing forward-looking statements, specifically USD to CAD, remain stable at, or near, current rates; we will be able to maintain our relationships with our employees, customers and partners; we will continue to attract qualified personnel to support our development requirements and the support of our new and existing customers; and that the risk factors noted above, individually or collectively, do not have a material impact on the Company. Any forward-looking statement made by us in this press release speaks only as of the date on which it is made. We undertake no obligation to publicly update any forward-looking statement, whether as a result of new information, future developments or otherwise, except as may be required by law.
About Ceridian HCM Holding Inc.
Ceridian is a global human capital management software company. Dayforce, our flagship cloud HCM platform, provides human resources, payroll, benefits, workforce management, and talent management functionality. Our platform is used to optimize management of the entire employee lifecycle, including attracting, engaging, paying, deploying, and developing people. Ceridian has solutions for organizations of all sizes.
Ceridian. Makes Work Life Better™.
21 | Q1 2020 Stockholder letter