Attached files
| file | filename |
|---|---|
| 8-K - 8-K - California BanCorp | calb-8k_20200506.htm |
Exhibit 99.1
Investor Presentation March 31, 2020 Steven E. Shelton President CEO Thomas A. Sa SEVP, CFO COO Michele Wirfel, SEVP CBO
Forward-Looking Statements During the course of the presentation and any transcript that may result, written or otherwise, California BanCorp (the “Company” ) may make projections or other forward-looking statements regarding a variety of items. Such forward-looking statements are based upon current expectations and involve risks and uncertainties. Actual results may differ materially from those stated in any forward-looking statement based on a number of important factors and risks. Although the Company may indicate and believe that the assumptions underlying the forward- looking statements are reasonable, any of the assumptions could prove inaccurate or incorrect and therefore, there can be no assurance that the results contemplated in the forward-looking statements will be realized. The Company undertakes no obligation to release publicly the results of any revisions to the forward-looking statements included herein to reflect events or circumstances after today, or to reflect the occurrence of unanticipated events. The Company claims the protection of the safe harbor for forward-looking statements contained in the Private Securities Litigation Reform Act of 1995. 2
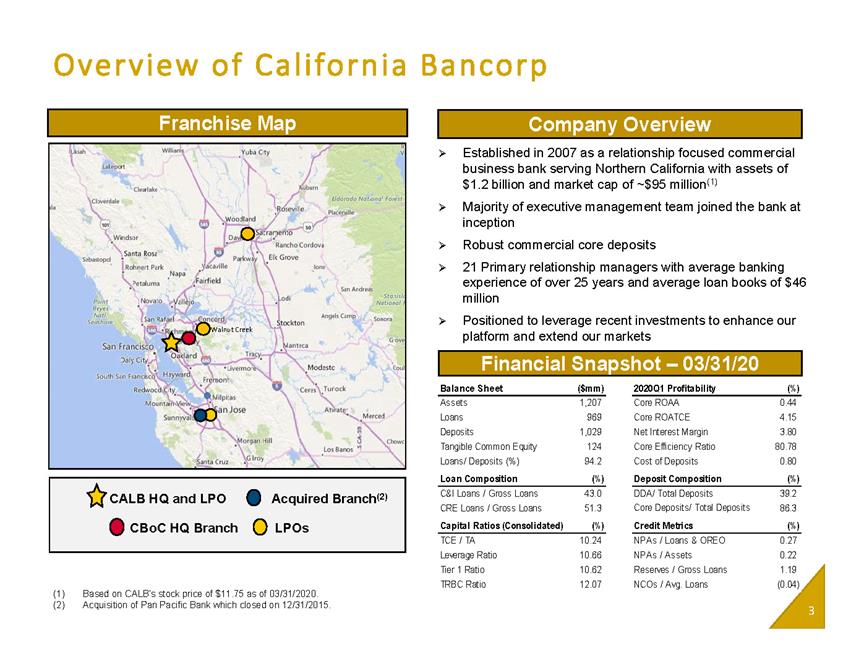
Overview of California Bancorp Company Overview Franchise Map • CALB HQ and LPO • Acquired Branch(2) • CBoC HQ Branch • LPOs WalnutCreek (1) Based on CALB’s stock price of $11.75 as of 03/31/2020. (2) Acquisition of Pan Pacific Bank which closed on 12/31/2015. • Established in 2007 as a relationship focused commercial business bank serving Northern California with assets of $1.2 billion and market cap of ~$95 million(1) • Majority of executive management team joined the bank at inception • Robust commercial core deposits • 21 Primary relationship managers with average banking experience of over 25 years and average loan books of $46 million • Positioned to leverage recent investments to enhance our platform and extend our markets Financial Snapshot – 03/31/20 Balance Sheet ($mm) 2020Q1 Profitability (%) Assets 1,207 Core ROAA 0.44 Loans 969 Core ROATCE 4.15 Deposits 1,029 Net Interest Margin 3.80 Tangible Common Equity 124 Core Efficiency Ratio 80.78 3Loans/ Deposits (%) 94.2 Cost of Deposits 0.80 Loan Composition (%) Deposit Composition (%) C&I Loans / Gross Loans 43.0 DDA/ Total Deposits 39.2 CRE Loans / Gross Loans 51.3 Core Deposits/ Total Deposits 86.3 Capital Ratios (Consolidated) (%) Credit Metrics (%) TCE / TA 10.24 NPAs / Loans & OREO 0.27 Leverage Ratio 10.66 NPAs / Assets 0.22 Tier 1 Ratio 10.62 Reserves / Gross Loans 1.19 TRBC Ratio 12.07 NCOs / Avg. Loans (0.04)

Investment Highlights • Branch light, commercial focused business bank with strong middle market relationships throughout Northern California • Experienced management team and seasoned C&I relationship team with strong ties to the local markets • Proven organic and acquisitive growth story • Quality core deposit franchise and commercial relationship strategy • C&I focus provides asset sensitivity and ability to rebalance loan portfolio • Disciplined underwriting standards with best in class asset quality metrics • Strong earnings outlook as efficiencies from investments are realized
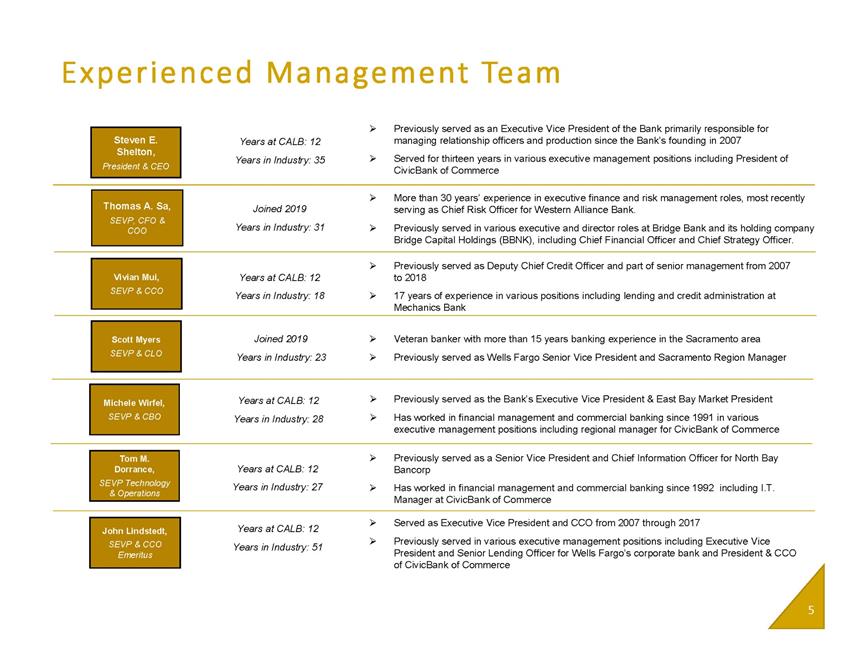
Experienced Management Team Steven E. Shelton, President & CEO • Previously served as an Executive Vice President of the Bank primarily responsible for Years at CALB: 12 managing relationship officers and production since the Bank’s founding in 2007 Years in Industry: 35 • Served for thirteen years in various executive management positions including President of CivicBank of Commerce Thomas A. Sa, SEVP, CFO & COO • More than 30 years’ experience in executive finance and risk management roles, most recently Joined 2019 serving as Chief Risk Officer for Western Alliance Bank. Years in Industry: 31 • Previously served in various executive and director roles at Bridge Bank and its holding company Bridge Capital Holdings (BBNK), including Chief Financial Officer and Chief Strategy Officer. Vivian Mui, SEVP & CCO • Previously served as Deputy Chief Credit Officer and part of senior management from 2007 Years at CALB: 12 to 2018 Years in Industry: 18 • 17 years of experience in various positions including lending and credit administration at Mechanics Bank Scott Myers SEVP & CLO Joined 2019 • Veteran banker with more than 15 years banking experience in the Sacramento area Years in Industry: 23 • Previously served as Wells Fargo Senior Vice President and Sacramento Region Manager Michele Wirfel, SEVP & CBO Years at CALB: 12 • Previously served as the Bank’s Executive Vice President & East Bay Market President Years in Industry: 28 • Has worked in financial management and commercial banking since 1991 in various executive management positions including regional manager for CivicBank of Commerce Tom M. Dorrance, SEVP Technology & Operations • Previously served as a Senior Vice President and Chief Information Officer for North Bay Years at CALB: 12 Bancorp Years in Industry: 27 • Has worked in financial management and commercial banking since 1992 including I.T. Manager at CivicBank of Commerce John Lindstedt, SEVP & CCO Emeritus • Served as Executive Vice President and CCO from 2007 through 2017 Years at CALB: 12 • Previously served in various executive management positions including Executive Vice Years in Industry: 51 President and Senior Lending Officer for Wells Fargo’s corporate bank and President & CCO of CivicBank of Commerce 5
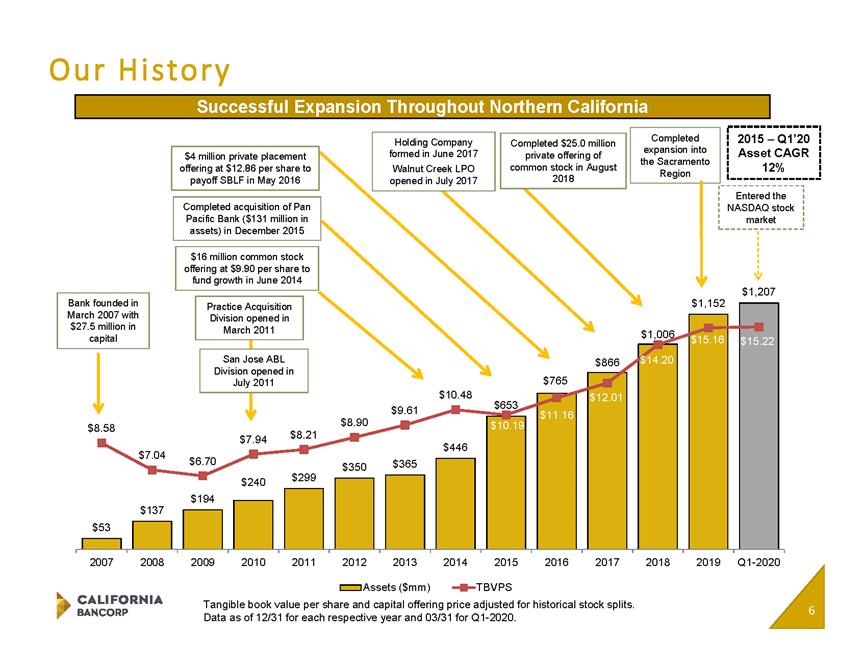
Our History Successful Expansion Throughout Northern California $16 million common stock offering at $9.90 per share to fund growth in June 2014 $4 million private placement offering at $12.86 per share to payoff SBLF in May 2016 Completed acquisition of Pan Pacific Bank ($131 million in assets) in December 2015 2015 – Q1’20 Asset CAGR 12% Practice Acquisition Division opened in March 2011 Completed $25.0 million private offering of common stock in August 2018 Holding Company formed in June 2017 Walnut Creek LPO opened in July 2017 Bank founded in March 2007 with $27.5 million in capital Completed expansion into the Sacramento Region San Jose ABL Division opened in July 2011 Entered the NASDAQ stock market $53 $137 $194 $240 $299 $350 $365 $446 $653 $765 $866 $1,006 $1,152 $1,207 $8.58 $7.04 $6.70 $7.94 $8.21 $8.90 $9.61 $10.48 $10.19 $11.16 $12.01 $14.20 $15.16 $15.22 2007 2008 2009 2010 2011 2012 2013 2014 2015 2016 2017 2018 2019 Q1-2020 Assets ($mm) TBVPS Tangible book value per share and capital offering price adjusted for historical stock splits. Data as of 12/31 for each respective year and 03/31 for Q1-2020. 6
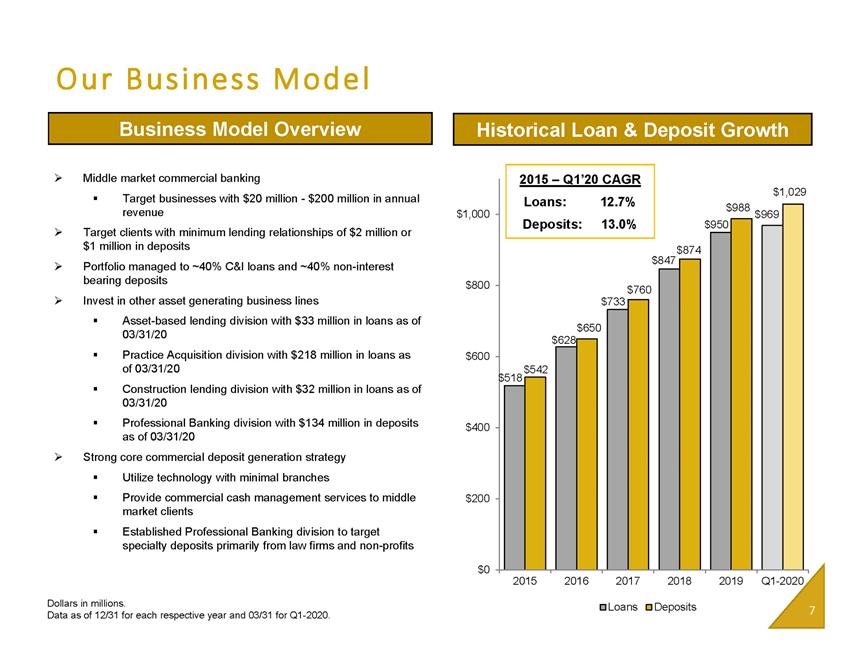
Our Business Model • Middle market commercial banking • Target businesses with $20 million -$200 million in annual revenue • Target clients with minimum lending relationships of $2 million or $1 million in deposits • Portfolio managed to ~40% C&I loans and ~40% non-interest bearing deposits • Invest in other asset generating business lines • Asset-based lending division with $33 million in loans as of 03/31/20 • Practice Acquisition division with $218 million in loans as of 03/31/20 • Construction lending division with $32 million in loans as of 03/31/20 • Professional Banking division with $134 million in deposits as of 03/31/20 • Strong core commercial deposit generation strategy • Utilize technology with minimal branches • Provide commercial cash management services to middle market clients • Established Professional Banking division to target specialty deposits primarily from law firms and non-profits Dollars in millions. Data as of 12/31 for each respective year and 03/31 for Q1-2020. Historical Loan & Deposit Growth Business Model Overview $1,000 $800 $600 $400 $200 2015 – Q1’20 CAGR Loans: 12.7% Deposits: 13.0% $1,029 $988 $969 $950 $874 $847 $760 $733 $650 $628 $542 $518 $0 2015 2016 2017 2018 2019 Q1-2020 Loans Deposits

We Serve Clients Throughout Northern California Franchise Map WalnutCreek Our Middle Market Relationships Our “Typical Client” • ~$50 million in annual revenue • $5 million revolver with $2 million outstanding • CALB HQ and LPO • Acquired Branch(1) • CBoC HQ Branch • LPOs • $1 million equipment financing • $3 million commercial real estate loan • $1 million demand deposit utilizing cash management services • $3 million money market accounts to hold surplus deposits • Fee income driven by commercial portfolio account analysis (1) Acquisition of Pan Pacific Bank which closed on 12/31/15.[company logos]

Strong Core Deposit Base Historical Deposit Composition Deposit Composition Money market & Demand deposits39% Time deposits14% savings deposits 45% Interest bearing demand deposits 2% Deposit Portfolio Highlights–03/31/20 • Deposits grew $158 million in Q1-2020 from Q1-2019 • Core deposit base driven by commercial clients • +95% of commercial relationships hold deposits at the bank • 86% Core deposit of total deposit • Utilize remote deposit capture and commercial cash management to generate and retain deposits • Established the Professional Banking Division in July 2018 to target core deposit growth from professional firms including law firms, non-profits, etc. • Treasury management division established in Q4-2019 Dollars in millions. Core deposits defined as total deposits less time deposits and brokered deposits. Data as of 12/31 for each respective year and 03/31 for Q1-2020. 2015 – Q1’20 CAGR DDA: 11.7% Core Deposits: 14.2% Total Deposits: 13.0% $542 $650 $761 $874 $988 $1,029 $225 $285 $315 $352 $387 $403 2015 2016 2017 2018 2019 Q1-2020 41%39%40%44%42%39% $1,200 $1,000 $800 $600 $400 $200 $0 Cost of Deposits Core Deposits Total Deposits NIB Deposits 0.23% 0.24% 0.35% 94% 93% 94% 88% 91% 0.80% 0.55% 90.80% 86%

Overview of Loan Composition Loan Portfolio Composition Historical Loan Composition(1) CRE -Non-Owner Occupied 27% Other 3% 3% Construction CRE -Owner Occupied 24% Commercial 43% Operating LOC Usage $600 $500 $400 $300 $200 $100 $ $444 $477 $507 $487 $475 $153 $160 $173 $150 $179 34% 34% 34% 31% 38% 50% 40% 30% 20% 10% 0% 2019Q1 2019Q2 2019Q3 2019Q4 2020Q1 Commitment Amount Gross Balance (1) Data as of 12/31 for each respective year and 03/31 for Q1-2020 (2) Impact from Pan Pacific Acquisition $203 $254 $329 $341 $390 $416 41%40%45%40%(2)39%(2)43% 2015 – Q1’20 CAGR C&I: 14.7% CRE: 11.0% Total Loans: 12.7% $969 $950 $1,000 $847 $733 $800 $628 $600 $518 $400 $200 $0 2015 2016 2017 2018 2019 Q1-2020 Total Loans C&I 4.95% 5.08% 4.88% 96% 97% 96% 5.19% 5.09% 96% 97% 4.98% 94% Yield on Loans Loans / Deposits Gross Loan Funding vs. Net Loan Funding $75 $68 $64 $54 $50 $43 $42 $41 $24 $23 $25 $19 $16 $ 0 2019Q1 2019Q2 2019Q3 2019Q4 2020Q1 Gross Loan Funding Net Loan Growth
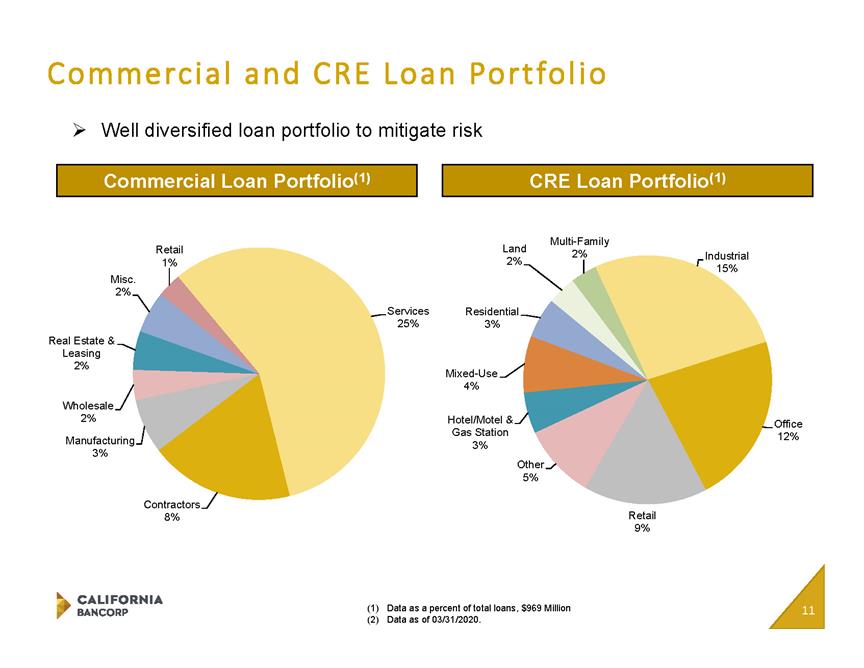
Commercial and CRE Loan Portfolio • Well diversified loan portfolio to mitigate risk Commercial Loan Portfolio(1) CRE Loan Portfolio(1) Multi-Family Land 2%2% Services Residential 25% 3% Real Estate & Leasing 2% Mixed-Use 4% Wholesale 2% Hotel/Motel & Industrial 15% Other 5% Office Gas Station 12% 3% 3% Contractors Manufacturing Misc. 2% Retail 1% 8% Retail 9% (1) Data as a percent of total loans, $969 Million (2) Data as of 03/31/2020. 11
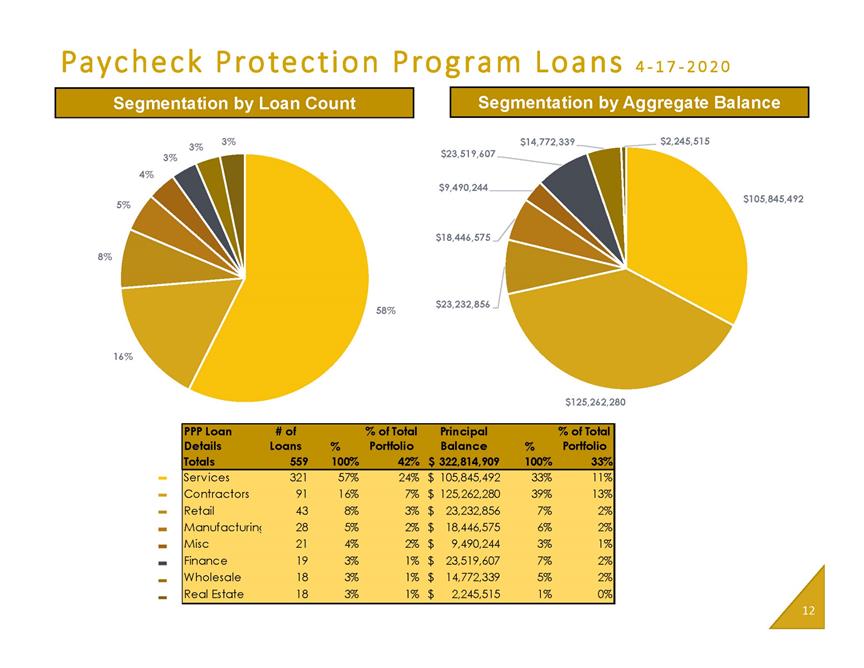
Paycheck Protection Program Loans 4 -17-2020 Segmentation by Loan Count Segmentation by Aggregate Balance 3% $14,772,339 $2,245,515 3% $23,519,607 3% 4% $9,490,244 $105,845,492 5% $18,446,575 8% $23,232,856 58% 16% $125,262,280 12PPP Loan Details # of Loans % % of Total Portfolio Principal Balance % % of Total Portfolio Totals 559 100% 42% 322,814,909 $ 100% 33% Services 321 57% 24% 105,845,492 $ 33% 11% Contractors 91 16% 7% 125,262,280 $ 39% 13% Retail 43 8% 3% 23,232,856 $ 7% 2% Manufacturing 28 5% 2% 18,446,575 $ 6% 2% Misc 21 4% 2% 9,490,244 $ 3% 1% Finance 19 3% 1% 23,519,607 $ 7% 2% Wholesale 18 3% 1% 14,772,339 $ 5% 2% Real Estate 18 3% 1% 2,245,515 $ 1% 0%
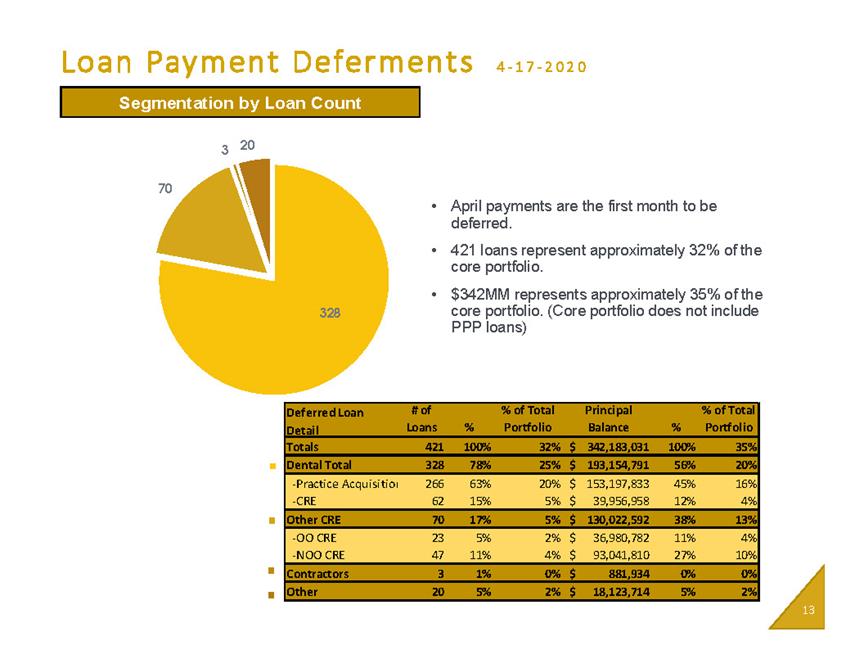
Loan Payment Deferments 4-17-2020 Segmentation by Loan Count 20 3 13328 70 Deferred Loan Detail # of Loans % % of Total Portfolio Principal Balance% %ofTotalPortfolioTotals421100%32%342,183,031$100%35% DentalTotal32878%25%193,154,791$56%20% -PracticeAcquisition26663%20%153,197,833$45%16% -CRE6215%5%39,956,958$12%4% OtherCRE7017%5%130,022,592$38%13% -OOCRE235%2%36,980,782$11%4% -NOOCRE4711%4%93,041,810$27%10% Contractors31%0%881,934$0%0% Other205%2%18,123,714$5%2% • April payments are the first month to be deferred. • 421 loans represent approximately 32% of the core portfolio. • $342MM represents approximately 35% of the core portfolio. (Core portfolio does not include PPP loans)
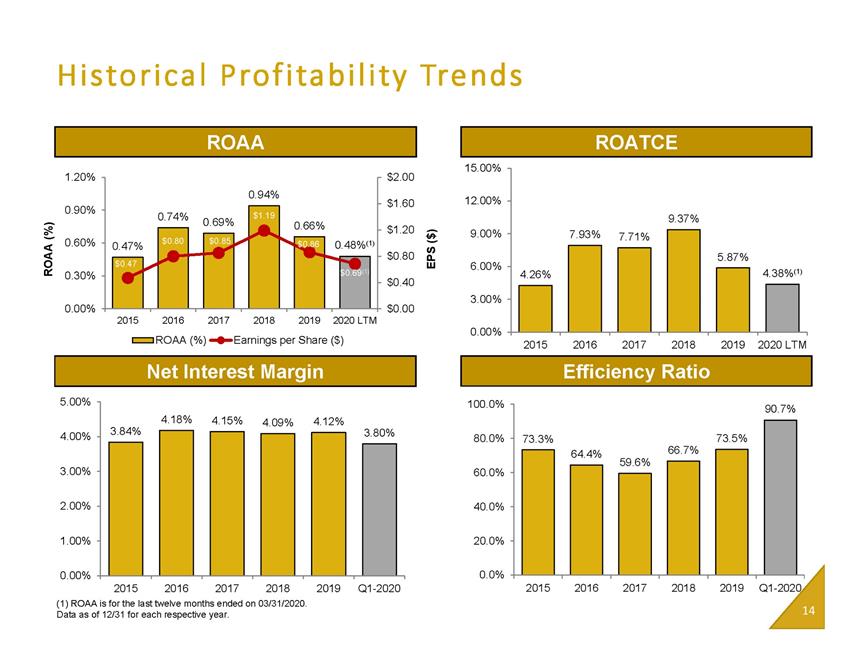
Historical Profitability Trends ROAA (%) ROAA ROATCE 15.00% 1.20% $0.47 $0.69(1) $0.00 $2.00 0.94% 12.00% $1.60 0.90% 0.74% 0.00% $0.80 $0.86 $1.19 $0.85 2015 2016 2017 2018 2019 2020 LTM 0.00% ROAA (%) Earnings per Share ($) 2015 2016 2017 2018 2019 2020 LTM 9.37% 0.69% 0.66% $1.20 9.00% 7.93% 7.71% EPS ($) 5.87% 6.00% 4.38%(1) 4.26% 0.60% 0.48%(1) 0.47% $0.80 0.30% $0.40 3.00% Efficiency Ratio Net Interest Margin 5.00% 100.0% 90.7% 4.18% 4.15% 4.12% 4.09% 3.84% 3.80% 4.00% 80.0% 73.3% 73.5% 66.7% 64.4% 59.6% 3.00% 60.0% 2.00% 40.0% 20.0% 1.00% 0.0% 2015 2016 2017 2018 2019 Q1-2020 2015 2016 2017 2018 2019 Q1-2020 0.00% (1) ROAA is for the last twelve months ended on 03/31/2020. Data as of 12/31 for each respective year.

Asset Quality Trends Net (Charge Offs) / Recoveries ($000s) Reserves / Loans 2.00% $2500 $2052 $2000 $1500 1.60% $618 $1000 $500 $0 ($500) ($35) 1.27% 1.28% 1.20% 1.19% 1.17% 1.13% ($1000) 0.80% ($1500) ($2000) 0.40% ($2500) 1.20% ($65) ($90) ($247) 2015 2016 2017 2018 2019 Q1-2020 2015 2016 2017 2018 2019 Q1-2020 Nonperforming Assets (NCOs) Recoveries / Avg. Loans (%) 0.23% 0.25% $10.0 2.50% $8.0 $1.8 $0.7 $0.5 $4.5 $2.8 $2.7 0.28% 0.10% 0.06% 0.53% 0.29% 0.27% 2015 2016 2017 2018 2019 Q1-2020 2.00% NPAs / Loans & OREO 0.15% 0.09% NPAs ($mm) $6.0 1.50% 0.05% $4.0 1.00% (0.00%) (0.01%) (0.05%) (0.04% $2.0 0.50% (0.04% ) $0.0 0.00% (0.15% ) (0.25%) Nonaccruals NPAs / Loans & OREO 2015 2016 2017 2018 2019 Q1-2020 15 As of Q1 ‘20 CALB had $416 thousand of loan discount on the acquired loans from Pan Pacific Bank Data as of 12/31 for each respective year and 03/31 for Q1-2020

Capital Ratios-Bank Only TCE / TA Leverage Ratio 16.00% 16.00% 13.25% 11.37% 10.44% 11.31% 11.36% 12.00% 12.00% 9.92% 4.00% 8.00% 8.78% 10.65% 10.24% 9.16% 9.08% 8.96% 8.00% 4.00% 0.00% 0.00% 2015 2016 2017 2018 2019 Q1-2020 2015 2016 2017 2018 2019 Q1-2020 Total Capital Ratio Tier 1 Ratio 16.00% 16.00% 12.77% 12.52% 11.33% 12.00% 10.88% 10.94% 11.83% 11.75% 10.63% 0.00% 2015 2016 2017 2018 2019 Q1-2020 0.00% 2015 2016 2017 2018 2019 Q1-2020 11.79% 10.38% 10.09% 12.00% 8.96% 8.00% 8.00% 4.00% 4.00% Data as of 12/31 for each respective year and 03/31 for Q1-2020.
Summary 17 Northern California commercial business bank with a disciplined approach to credit underwriting Experienced Executive Management Team and seasoned C&I Relationship Managers Strong commercial loan portfolio with corresponding commercial relationship deposits Keen focus on relationship core deposits in deposit rich industries Proven organic and acquisition grown capabilities

Please send questions to ir@bankcbc.com Or Call 510.457.3751 CaliforniaBankofCommerce.com