Attached files
| file | filename |
|---|---|
| EX-32 - EX-32 - CalAmp Corp. | camp-ex32_6.htm |
| EX-31.2 - EX-31.2 - CalAmp Corp. | camp-ex312_7.htm |
| EX-31.1 - EX-31.1 - CalAmp Corp. | camp-ex311_11.htm |
| EX-23.1 - EX-23.1 - CalAmp Corp. | camp-ex231_10.htm |
| EX-21 - EX-21 - CalAmp Corp. | camp-ex21_9.htm |
| EX-10.38 - EX-10.38 - CalAmp Corp. | camp-ex1038_250.htm |
| EX-4.5 - EX-4.5 - CalAmp Corp. | camp-ex45_237.htm |
| EX-3.2 - EX-3.2 - CalAmp Corp. | camp-ex32_67.htm |
UNITED STATES
SECURITIES AND EXCHANGE COMMISSION
Washington, D.C. 20549
FORM 10-K
ANNUAL REPORT PURSUANT TO SECTION 13 OR 15(d) OF THE SECURITIES EXCHANGE ACT OF 1934
FOR THE FISCAL YEAR ENDED FEBRUARY 29, 2020
COMMISSION FILE NUMBER: 0-12182

CALAMP CORP.
(Exact name of Registrant as specified in its Charter)
|
Delaware |
|
95-3647070 |
|
(State or other jurisdiction of incorporation or organization) |
|
(I.R.S. Employer Identification No.) |
|
|
|
15635 Alton Parkway, Suite 250 Irvine, California |
|
|
|
|
92618 |
|
|
(Address of principal executive offices) |
|
(Zip Code) |
REGISTRANT'S TELEPHONE NUMBER, INCLUDING AREA CODE: (949) 600-5600
SECURITIES REGISTERED PURSUANT TO SECTION 12(b) OF THE ACT:
|
TITLE OF EACH CLASS |
|
TRADING SYMBOL(S) |
|
NAME OF EACH EXCHANGE |
|
$0.01 par value Common Stock |
|
CAMP |
|
The Nasdaq Stock Market LLC (The Nasdaq Global Select Market) |
SECURITIES REGISTERED PURSUANT TO SECTION 12(g) OF THE ACT: None
Indicate by check mark if the registrant is a well-known seasoned issuer, as defined in Rule 405 of the Securities Act. Yes ☐ No ☒.
Indicate by check mark if the registrant is not required to file reports pursuant to Section 13 or Section 15(d) of the Act. Yes ☐ No ☒.
Indicate by check mark whether the registrant (1) has filed all reports required to be filed by Section 13 or 15(d) of the Securities Exchange Act of 1934 during the preceding 12 months (or for such shorter period that the registrant was required to file such reports), and (2) has been subject to such filing requirements for the past 90 days. Yes ☒ No ☐.
Indicate by check mark whether the registrant has submitted electronically every Interactive Data File required to be submitted pursuant to Rule 405 of Regulation S-T (§232.405 of this chapter) during the preceding 12 months (or for such shorter period that the registrant was required to submit such files). Yes ☒ No ☐
Indicate by check mark whether the registrant has filed a report on and attestation to its management’s assessment of the effectiveness of its internal control over financial reporting under Section 404(b) of the Sarbanes-Oxley Act (15 U.S.C. 7262(b)) by the registered public accounting firm that prepared or issued its audit report. ☒
Indicate by check mark whether the registrant is a large accelerated filer, an accelerated filer, a non-accelerated filer, smaller reporting company, or an emerging growth company. See the definitions of “large accelerated filer,” “accelerated filer,” “smaller reporting company,” and “emerging growth company” in Rule 12b-2 of the Exchange Act.:
|
Large accelerated filer |
☐ |
|
Accelerated filer |
☒ |
|
Non-accelerated filer |
☐ |
|
Smaller reporting company |
☐ |
|
Emerging growth company |
☐ |
|
|
|
If an emerging growth company, indicate by check mark if the registrant has elected not to use the extended transition period for complying with any new or revised financial accounting standards provided pursuant to Section 13(a) of the Exchange Act. Yes ☐ No ☐
Indicate by check mark whether the registrant is a shell company (as defined in Rule 12b-2 of the Exchange Act). Yes ☐ No ☒
As of August 31, 2019, the aggregate market value of shares held by non-affiliates of the registrant was approximately $264.9 million. For purposes of calculating the aggregate market value of shares held by non-affiliates, we have assumed that all outstanding shares are held by non-affiliates, except for shares held by each of our executive officers, directors and 10% or greater stockholders. These assumptions should not be deemed to constitute an admission that all executive officers, directors and 10% or greater stockholders are, in fact, affiliates of our company. As of April 30, 2020, there were 34,325,681 shares of the registrant’s common stock outstanding.
DOCUMENTS INCORPORATED BY REFERENCE
Portions of the registrant’s definitive Proxy Statement for the Annual Meeting of Stockholders to be held on July 29, 2020 are incorporated by reference into Part III, Items 10, 11, 12, 13 and 14 of this Form 10-K. This Proxy Statement will be filed within 120 days after the end of the fiscal year covered by this report.
|
|
|
|
|
Page |
|
|
|
|
|
|
|
Item 1. |
|
|
2 |
|
|
Item 1A. |
|
|
14 |
|
|
Item 1B. |
|
|
31 |
|
|
Item 2. |
|
|
31 |
|
|
Item 3. |
|
|
31 |
|
|
Item 4. |
|
|
32 |
|
|
|
|
|
|
|
|
|
|
|
|
|
|
Item 5. |
|
|
33 |
|
|
Item 6. |
|
|
34 |
|
|
Item 7. |
|
Management’s Discussion and Analysis of Financial Condition and Results of Operations |
|
37 |
|
Item 7A. |
|
|
55 |
|
|
Item 8. |
|
|
55 |
|
|
Item 9. |
|
Changes in and Disagreements With Accountants on Accounting and Financial Disclosure |
|
97 |
|
Item 9A. |
|
|
97 |
|
|
Item 9B. |
|
|
100 |
|
|
|
|
|
|
|
|
|
|
|
|
|
|
Item 10. |
|
|
101 |
|
|
Item 11. |
|
|
101 |
|
|
Item 12. |
|
Security Ownership of Certain Beneficial Owners and Management and Related Stockholder Matters |
|
101 |
|
Item 13. |
|
Certain Relationships and Related Transactions, and Director Independence |
|
101 |
|
Item 14. |
|
|
101 |
|
|
|
|
|
|
|
|
|
|
|
|
|
|
Item 15. |
|
|
102 |
Company Overview
CalAmp Corp. (including its subsidiaries unless the context otherwise requires, “CalAmp”, “the Company”, “we”, “our”, or “us”), incorporated in 1987, is a global technology solutions pioneer leading the transformation to a mobile connected economy. We help transform businesses and improve lives around the globe with technology solutions that streamline complex mobile Internet of Things (“IoT”) deployments using wireless connectivity and data analytics.
We have created a cloud-based connected IoT ecosystem that is enhanced through our Software-as-a-Service (SaaS) subscription services and applications. Our platform provides greater visibility, scalability and connectivity across automotive, insurance, transportation and logistics, government and construction markets creating a massive global IoT ecosystem. By employing our cloud platform and SaaS subscription services, global businesses can dramatically improve their operations, streamline communications and gain critical insights from their business data that can transform the speed, cost and reliability of their services and operations.
Our unified and integrated cloud-based IoT ecosystem combines SaaS-based applications, telematics services, a scalable global cloud platform and intelligent edge computing products. Together these elements deliver a comprehensive view of vehicles, machines, drivers, assets and cargo in real time that would otherwise require multiple disparate applications. Our applications and services all tie back to our cloud platform, generating actionable data and insights that help management optimize business operations through better decision making at the edge. While each one of our offerings can be combined for a complete end-to-end telematics solution, they can also be customized and integrated with custom applications or back-office systems, without losing the actionable mobility data that only CalAmp can provide.
Our cloud platform offers valuable telematics services that provide enhanced insights to help companies more efficiently manage their assets including fleet video intelligence, remote asset monitoring, real-time crash response and driver behavior scoring. Our programmable telematics devices enable computing at the edge and capture business-critical data from mobile assets, their passengers and content anywhere in the world at any time. We call this The New How: powering autonomous IoT interaction, facilitating efficient decision making, optimizing resource utilization and improving road safety.
Economic conditions, competitive markets, global regulatory environments, the COVID-19 pandemic and the transition to 4G and 5G connectivity are challenging traditional businesses to drive operational efficiencies, track processes, reduce costs, fund business growth and innovation, and enhance profitability and cash flow. Therefore, effective management of business spend is imperative if businesses are to achieve significant profitable growth. Businesses must evaluate their underutilized resources and leverage the new connected ecosystem. CalAmp helps enterprises and mid-to-large businesses compete in the on-demand economy, and thus fulfill consumer expectations for fast, reliable and on -time products and services at their fingertips.
Our company culture is driven by our five core values:
|
|
• |
Integrity – take personal responsibility - we value our customers and look for ways to enhance our solutions to benefit them and the community. |
|
|
• |
Inspiration – foster high performance - we design all of our products and services with the highest quality, knowing that whether it’s a shipment of critical refrigerated pharmaceuticals, children on their way to school, or packages en route to a retail store, they should all be handled with care. |
|
|
• |
Innovation – bring value to our customers - optimizing businesses all over the world is at the heart of what we do and we’re always seeking ways to learn about their needs in order to improve their overall operations. |
2
|
|
• |
Excellence – exceed customer requirements by delivering best-in-class solutions - our customer-focused approach includes enabling better business outcomes by offering our customers the finest products, services and support to help them optimize their business operations. |
The successful execution of this approach, in combination with our core values, will help customers to succeed and thus drive our growth.
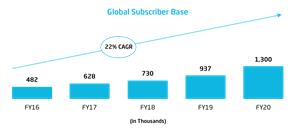
We have approximately 1.3 million software and service subscribers and more than 20 million products installed globally in multiple market verticals including automotive, insurance, transportation and logistics, government and construction. There are over two million Here Comes The Bus® mobile app users operated by fleet managers and school districts. We believe the installed base represents a significant recurring revenue opportunity as we strive to deliver additional over-the-top services and data monetization opportunities to subscribers in collaboration with our customers and partners.
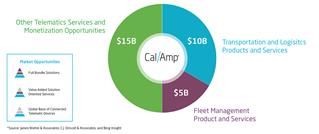
Growth Strategy – Capitalize on $30B Total Available Market
3
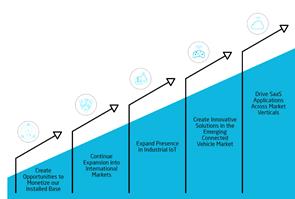
Over the past three years, we have focused on growing our new subscription-based business model. We intend to grow this core business and expand into new markets and geographic regions in the years ahead. Our business operates at the nexus of several large market opportunities including the connected vehicle ecosystem, enterprise asset tracking, and fleet management product and services markets. We believe these market opportunities constitute a total available market (“TAM”) of approximately $30 billion. In order to capitalize on this TAM, our growth strategy and the metrics by which we measure ourselves includes the following five key elements:
|
|
• |
Drive SaaS Applications Across Market Verticals. We are relentlessly pursuing our goal to grow our software and subscription services business. To accomplish this goal, our team is focused on continual product innovation across our proprietary software stack. We believe that by leveraging our existing brand presence and customer base in four market verticals including transportation, construction, government and the automotive aftermarket, we can drive growth in our SaaS applications. And as we steadily grow our base of SaaS subscribers, we’ll continue to migrate to a pure-play solution provider of subscription services by combining our broad portfolio of SaaS applications, cloud-based platform and programmable telematics devices. |
|
|
• |
Create Innovative Solutions in the Emerging Connected Vehicle Market. With the acquisition of LoJack® licensees in the U.S., U.K., Italy and Mexico, we now have a highly recognizable, consumer-facing brand as well as strong and unique relationships with law enforcement agencies (in the U.S. and other geographical regions), auto dealerships, insurance companies, rental car agencies, regional and global transportation and logistics providers, and heavy equipment original equipment manufacturers (OEMs). We plan to develop telematics applications for the connected vehicle market similar to LoJack® SureDrive™ targeting the consumer telematics segment and LoJack® LotSmart™ for automotive dealer inventory management. We plan to increase our investment in research and development to expand and enhance the features and capabilities of our products and solutions and drive further innovation through synergies created among our Synovia acquisition and LoJack subsidiaries. |
|
|
• |
Expand Presence in Industrial IoT. We believe that our current distribution footprint covers a significant portion of the global industrial IoT market due to our strong relationships with large enterprises such as Caterpillar. We believe there is an opportunity for us to leverage our core competencies of working with these global enterprises and expand our presence with other industrial OEMs. |
|
|
• |
Continue Expansion into International Markets. We are leveraging our existing customer relationships, international subscribers and recent Tracker UK and LoJack Mexico acquisitions to further expand into global markets including Latin America, Europe, Middle East, Africa and Asia Pacific. Our global expansion strategy is focused on countries with anticipated demand for our full stack of SaaS application and services, cloud platform and telematics devices. |
|
|
• |
Create Opportunities to Monetize our Installed Base. We believe that our strong and growing installed-base of over 20 million telematics devices and approximately 1.3 million unique software and services subscribers provide us with an opportunity to create additional revenue streams by delivering high-value data sources, applications and other over-the-top subscription services to enterprises in large markets such as automotive, insurance, transportation & logistics, government and construction. |
Subsidiaries and Recent Acquisitions
Synovia Solutions - In April 2019, we acquired Synovia Solutions (“Synovia”), a North American market leader in fleet safety and management for the K-12 market as well as state and local government organizations. At the forefront is Here Comes The Bus, an award-winning mobile app powered by GPS services that delivers real-time school bus and student tracking intelligence. Since the acquisition, downloads of the application have exceeded two million serving over 300 school districts in 35 states across the U.S. Synovia Solutions also provides government fleet management solutions designed to improve utilization, lower insurance premiums and enable preventative maintenance while expanding our fleet management and vehicle safety services portfolio. This acquisition also accelerates our transformation to high-value subscription-based services. Moreover, in the wake of the COVID-19 outbreak, schools districts throughout the U.S. are now using Here Comes The Bus to assist in meal delivery to students while schools remain closed.
4
LoJack Mexico - In March 2019, we acquired Car Track, S.A. de C.V. (“LoJack Mexico”), the exclusive licensee of LoJack technology for the Mexican market. LoJack Mexico is a provider of innovative automotive and stolen vehicle recovery (“SVR”) services throughout Mexico and Latin America. LoJack Mexico is leveraging CalAmp’s full stack of telematics and SaaS solutions to expand product offerings to its substantial subscriber base of consumers, auto dealers and OEMs, insurance providers and leasing companies. This acquisition provides us with a profitable business and world-class brand. With strong channels, consumer awareness and law enforcement relationships in major cities across Mexico and Latin America, LoJack Mexico boasts approximately 139,000 software and services subscribers and has announced recent partnerships with Hertz, MAN Truck, Volkswagen Financial and Dogo Informatique.
Tracker - In February 2019, CalAmp acquired Tracker Network (UK) Limited (“Tracker”), a LoJack licensee and market leader in SVR and telematics services across the United Kingdom since 1993. Tracker is strategically aligned with LoJack Italia to drive CalAmp’s European expansion by leveraging a complete, vertically integrated portfolio of SaaS applications and services, cloud platform and telematics devices to develop advanced connected car solutions for auto dealers, OEMs, insurance providers and other enterprise customers. The acquisition brings strong brand awareness across the U.K. and extensive law enforcement relationships by integrating two of Europe’s most advanced SVR and telematics solutions providers. Tracker recently announced a new SmartDealer solution for lot and fleet management, a SmartDrive connected car application as well as partnerships with Auto Capital and NG Bailey.
Extended Business Network
Because our connected IoT ecosystem is constantly collecting, monitoring and reporting business-critical information from mobile and remote assets, our customers can run their business operations more efficiently. We also make it easy for our customers to purchase our end-to-end connected fleet and supply chain solutions via a SaaS subscription-based model that enables us to create greater customer engagement and long-term enterprise relationships while driving incremental recurring revenue.
Today we sell into numerous market verticals including automotive, insurance, transportation and logistics, government, K-12 and construction in the United States, Latin America, Western Europe, Asia Pacific, Middle East and Africa. We sell our connected car applications to consumers through all of LoJack distribution channels. We serve parents, students and school administrators through our Here Comes The Bus mobile app that can be found in the App Store and Google Play Store. Our brands and technological leadership have driven the adoption of our connectivity solutions with small to midsize customers as well as large global enterprises. We also serve numerous government organizations and municipalities and over 300 school districts across North America. With our international network of LoJack subsidiaries and a strong ecosystem of industry partnerships, we bring intelligence to the edge in the mobile connected economy to help drive business efficiencies.
Our software subscription business model allows us to continuously listen to our customer’s needs and learn about their pain points and how they affect their day-to-day business. Our partnerships and acquisitions have enabled us to get in front of new customers furthering our abilities to digitize their businesses, and capitalizing on our reputation and history as a true telematics pioneer.
Enterprise Customers - We sell our products and services directly to large global enterprises and industrial OEM customers. These customers require very different selling approaches and support requirements, and we have organized our teams to address these different requirements. Additionally, certain customers often have unique technical requirements and manufacturing processes, and may request specific product configurations, feature sets and designs. Sales to large enterprise customers often involve complex program management and long sales cycles, and require close cooperation between sales, operations and engineering personnel. As such, we have developed teams of key account managers and business development managers to serve the unique requirements of these customers. Some of the global enterprises we serve include Amazon, Caterpillar, Hertz, Omnitracs, Pioneer, Toyota, TransUnion, Trimble and Volkswagen Financial.
5
Telematics Service Providers (“TSPs”) and Channel Partners - We market and sell our products and services to small- and mid-sized companies through our well-established sales team and Channel Partner Program that sells our full product portfolio into Telematics Service Providers, Value-Added Resellers (“VARs”), systems integrators and mobile network operators. These partners integrate our telematics solutions with their value-added applications to deliver purpose-built solutions that are sold through to restaurant, farming, water & waste management and construction industries among others.
Strategic Partners - CalAmp has developed third party strategic partnerships to serve a wide range of customers from enterprises to small businesses. CalAmp has established strategic partnerships with supply chain management service providers including CargoSense, Overhaul, Cryoport and RoviTracker. We also partnered with TransUnion to work with insurance companies and to provide stolen vehicle recovery services and help insurance carriers better manage risk, minimize replacement losses and improve customer service. We partner with mobile network operators including AT&T, Verizon, Sprint and Telefonica among others to provide connectivity solutions for our customers. This year we established a partnership with Sprint to deliver intelligent telematics devices and software applications, along with unique CalAmp iOn™ DaaS subscription services to expand Sprint's broad range of connected car, fleet and asset management services that drive operational efficiencies and secure high-value assets for enterprise and business customers.
Our global direct sales organization consists of teams of field salespeople, key account managers and business development managers, who work closely with product and applications specialists and other internal sales support personnel based primarily across our U.S. locations. We have organized our field sales personnel, together with internal sales and field support personnel, into teams within each business group based on their specialized knowledge and expertise relating to specific product and service areas, geographies and customer groups. These sales teams are closely aligned with their respective product management, engineering and operations organizations.
We expect that our reputation for providing innovative and high-quality solutions will continue to play a significant role in our growth and success, and that high customer satisfaction will continue to fuel referrals of our brand to new customers. Through our trademarked name – CalAmp – we have built a highly recognizable brand in the global enterprise, fleet management and supply chain market verticals. Also, in connection with the acquisitions of LoJack and Synovia Solutions, we acquired a highly recognizable consumer-facing brand in the K-12 market with Here Comes The Bus.
Customer Benefits
Our connected telematics products, software solutions and other subscription services address a wide variety of applications across key vertical markets ranging from small to large enterprises. They are in constant communication with remote and/or mobile assets as they perform business-critical tasks and services that are otherwise difficult to manage in real time on a remote basis. In such situations, our solutions provide a clear and demonstrable return on investment. Our products and solutions benefit our customers in the following ways:
|
|
• |
Increasing productivity, improving communications and optimizing performance of fleets and mobile workers. Applications include vehicle monitoring, dispatch and route optimization, fleet diagnostics and maintenance, workflow improvement, workforce communications, driver behavior monitoring, as well as training and work-alone safety initiatives. |
|
|
• |
Improving the automobile dealer, vehicle owner and vehicle insurer experience. Applications include connected car and insurance telematics solutions that expedite the claims process for insurers, improve lot management for automobile dealers and provide early warning alerts, accident reconstruction and other connected car and road safety services for consumers. |
|
|
• |
Enabling multi-modal supply chain visibility tracking and management services from the cab to the containers and cargo. Applications include local and long-haul trailer tracking, management and logistics, container tracking and status, refrigerated container monitoring and control, high-value asset & pet-tracking solutions for in-air travel, environmental condition monitoring of cargo down to the product level, and, delivery assurance combined with local and intermodal pallet and cargo logistics and tracking. |
6
|
|
• |
Facilitating comprehensive monitoring, tracking and telematics for heavy equipment and commercial trucking. Applications include heavy equipment maintenance, usage optimization and tracking, rental equipment tracking, high-value tools and asset tracking, yellow iron and attachment management, indoor/outdoor forklift and loader location, impact detection and telematics. |
|
|
• |
Enabling usage-based insurance, enhanced claims processing and delivery of comprehensive value-added services for the vehicle insurance industry. Applications include stolen vehicle recovery for insurance providers, driver behavior scoring and feedback, crash discrimination, collision alerts and reconstruction, damage assessment and estimation, teen driver tracking and management, roadside assistance and predictive maintenance. |
|
|
• |
Delivering end-to-end visibility and regulatory compliance for supply chain management. Applications include granular visibility of product location and environmental status for temperature-sensitive drugs, perishable food and high-value consumer goods. |
|
|
• |
Enabling rapid delivery of comprehensive managed services for machine and equipment OEMs. Applications include service, maintenance, tracking, monitoring and control for generators, turbines, compressors, small engines (e.g., outboard motors, ATVs and electric carts) and power tools. |
|
|
• |
Creating a safe and reliable school bus riding experience for students and parents. School bus tracking and student tracking mobile app that gives students and parents peace of mind through regular real-time tracking of pick-up and drop-off information for K-12 students all over the U.S. |
Differentiators
We pride ourselves in servicing each layer of a business’s telematics value chain, from software service applications through devices. This integrated approach puts us ahead of competitors because we can provide customers with a complete solution or a flexible, configurable solution that can easily enhance other third party applications or back-office enterprise systems.
With a trusted and growing global presence, CalAmp provides a secure, scalable, and flexible solution with application for multiple industries and continues to expand its offerings in different geographies and market segments. Our powerful technology and financial strength empower us to bring innovative solutions to market. The CalAmp mobile connected ecosystem, for example, offers a seamless, end-to-end telematics solution that addresses the most complex operational challenges.
Within the ecosystem, exists CalAmp Telematics Cloud™ (“CTC”) which captures, analyzes and transforms data from equipment and mobile assets into actionable insights. Powered by an enterprise-grade cloud platform and advanced security, CTC facilitates integration between CalAmp applications and third-party management systems to enable flexible IoT solutions and innovative telematics services. Many multinational shipping enterprises rely on CalAmp, such as Amazon which uses CTC to build a mission-critical business application that enables them to quickly develop tailored solutions designed around their own applications to meet specific use cases.
Our enterprise customers tell us that only CalAmp offers a seamless one-stop shop for mobile asset management with these critical capabilities:
|
|
• |
Integration: CTC’s Application Development Environment (“ADE”), along with CalAmp’s broad portfolio of devices, easily links vertical, back-end applications to remote assets providing only the information needed for each key stakeholder within the organization. |
|
|
• |
Scalability: The ADE provides an embedded framework to help create tailored solutions enabling faster deployment with minimized infrastructure. Our Device-as-a-Service (“DaaS”) model minimizes costs for managing devices and telematics services as well as technical support, so customers can scale their solutions in a more cost-effective manner. |
7
|
|
• |
Speed: With CalAmp’s industry-standard APIs, customer development teams can capture the information they need from mobile assets to speed time-to-market of custom telematics solutions. |
|
|
• |
Reliability: Large global logistics companies can’t afford downtime or loss of data. This is especially imperative for surviving peak seasons in freight transportation. Data reliability and zero operational downtime on that kind of global scale only comes with experience. Our customers have come to know whom we serve and the importance and scale of those telematics deployments. Reliability comes in large part from CTC being built on one of the most reliable and scalable enterprise-grade cloud infrastructures in the business: Amazon Web Services. That kind of reliability played a part in Amazon choosing CalAmp for one of its telematics needs. |
Our Platform
CalAmp’s unified IoT ecosystem includes our SaaS-based applications, CalAmp Telematics Services, CalAmp Telematics Cloud Platform and intelligent edge computing products. Companies of all sizes leverage our integrated suite of IoT services and devices into their operational infrastructure to reliably and securely transmit business-critical data points from high-valued mobile assets to address the most complex operational challenges. This tight integration of IoT technology provides greater visibility to help meet customer expectations in the on-demand economy.
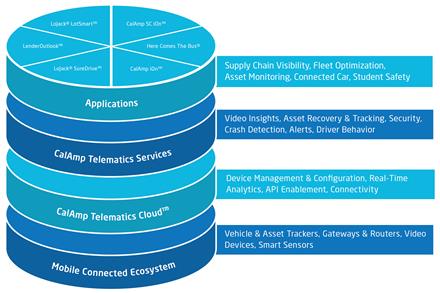
SaaS Applications. We provide our customers with intelligent analytics and reporting tools that are accessible via a single view, user-friendly interface through SaaS-based applications designed to address specific vertical market needs. CalAmp iOnTM is purpose-built for service fleets, government fleets and construction, turning multiple data feeds from previously unconnected networks of vehicles, drivers and associated assets into clear and actionable insights that optimize operations, increase productivity and deliver compelling ROI for virtually any business challenge. CalAmp SC iOn Supply Chain delivers real-time visibility about the environmental status of pharmaceuticals, electronics, food or other perishables from manufacturing to the point of purchase, helping to manage quality and compliance across land, air or sea shipments. LenderOutlookTM enables vehicle finance, automotive dealers and credit unions to secure their assets, reduce risk and build customer loyalty while driving revenue. Here Comes The Bus® is an award winning mobile application that provides real-time school bus location through push notifications and email alerts to help families monitor bus arrival and keep students safe. LoJack SureDrive is a connected car app that provides crash alerts, movement detection, arrival notifications and speed alerts to help drivers and their families save time and stay safe. LoJack LotSmart is an inventory management system that empowers dealers with vehicle location, battery level and other diagnostic information to streamline operations and improve the customer experience.
8
CalAmp Telematics Services. CalAmp delivers enhanced contextual insights that help manage mobile workers, vehicles, mobile assets, tools and cargo. Our subscription-based telematics services enable customers to optimize their operations by collecting, monitoring and effectively reporting business-critical information and desired intelligence from high-value remote and mobile assets. CalAmp iOn Vision provides fleet operators and service providers with actionable video insights to assess driver behavior, mitigate liabilities and improve fleet safety. CalAmp iOn Tag Service helps service fleets to minimize project delays and prevent loss by enabling greater visibility and control over their assets and tools. CrashBoxx provides crash detection and delivers instant crash alerts to speed life-saving assistance to drivers, expedite the claims process and reconstruct the collision to help fleet operators mitigate liability and fraud. Driver Behavior Scoring enables fleet managers to improve driver safety and identify the need for training based on speeding, harsh braking, hard cornering and other risky driving behaviors. LoJack Stolen Vehicle Recovery is the only SVR solution directly integrated with law enforcement that has a 90%+ recovery rate and over $1 billion worth of recoveries in the U.S. alone. LoJack Stolen Asset Recovery allows construction and heavy equipment rental companies to protect and recover high-value construction equipment and commercial vehicles. Security is of greatest importance to CalAmp especially in a rapidly evolving cyber threat landscape. CTC is SOC 2 certified, meaning it’s designed to securely retain data in the cloud. With this certification, organizations have the confidence their sensitive data is secure, ensuring confidentiality and availability for optimized telematics deployments.
CalAmp Telematics Cloud (“CTC”). The CalAmp Telematics Cloud is the core engine that enables seamless management of a diverse set of assets, from service vehicles to high-value equipment. CTC is an enablement platform that connects our customers to a wide range of applications and software services, which enhances the value of our telematics products and offers flexibility and scale for small to medium-sized businesses as well as global enterprise corporations. Our cloud-based platform connects our SaaS-based applications, telematics services and edge computing devices, and facilitates integration with third party applications, through open Application Programming Interfaces (“API”s). Our partners leverage multiple APIs we’ve created to rapidly deliver full-featured IoT solutions to their customers and markets. Our proven CTC is architected to integrate with numerous global Mobile Network Operator (“MNO”) account management systems and leverage these carrier backend systems to provide customers access to services that are essential for creating and managing flexible end-to-end solutions.
CalAmp Edge Computing Products. We offer a series of telematics devices and sensors that serve as the backbone of our mobile connected ecosystem by collecting data insights from vehicles, drivers, assets and cargo. These wireless networking devices--including asset tracking units, mobile telematics devices, fixed and mobile wireless gateways and routers--underpin our wide range of proprietary and third-party software applications and services for business-critical deployments demanding secure and reliable communications and controls anywhere in the world. Our customers select our products and solutions based on optimized feature sets, configurability, manageability, long-term support, reliability and, in particular, overall value.
Industry Recognition
In 2019, CalAmp received an Honorable Mention for Hello Tractor in the Fast Company World Changing Ideas award and won the IoT Platform Leadership Award for our Air Freight Visibility Solution, developed jointly with CargoSense. Here Comes The Bus and Synovia Solutions won the Mobile World Congress Barcelona Global Mobile Award, IoT Excellence Award and IHS Markit Award.
Recent Developments
In December 2019, a strain of coronavirus entitled COVID-19 emerged in China and spread to other countries including to the United States. In March 2020, the World Health Organization declared COVID-19 to be a public health pandemic of international concern, which has resulted in travel restrictions and in some cases, prohibitions of non-essential activities, disruption and shutdown of businesses and greater uncertainty in global financial markets.
In the United States and other geographies in which we and our customers, partners and service providers operate, the health concerns as well as political or governmental developments in response to COVID-19 could result in economic, social or labor instability or prolonged contractions in certain end markets which could slow the sales process, result in customers not purchasing or renewing contracts or failing to make payments. These events could have a material adverse effect on the business and results of operations and financial condition.
9
At this time, it is difficult to predict the extent to which the COVID-19 outbreak will impact our business or operating results, which is highly dependent on uncertain future developments, including the severity of the pandemic and the actions taken or to be taken by governments and private businesses in relation to its containment. Because our business is dependent on telematics product sales, device installations and related subscription-based services, the effect of the outbreak may not be fully reflected in our operating results until future periods.
We have adopted several measures in response to the COVID-19 outbreak, including instructing employees to work from home, implementing certain cost and cash flow control measures to address potential declines in billings and cash collections from customers, shifting the manner in which we engage with customer and restricting non-critical business travel by our employees. As a result of the work and travel restrictions, substantially all of our sales and installation services activities are being conducted remotely.
Manufacturing and Operations
While the vast majority of our products are designed in the U.S., we currently outsource a substantial portion of our manufacturing to certain contract manufacturers, which are located primarily in Hong Kong, mainland China, Malaysia and other Pacific Rim countries. Our electronic devices, components and made-to-order assemblies used in our products can be obtained from these manufacturers, although certain components are obtained from sole source suppliers. Although we do not have any long-term purchase contracts, we have executed product supply agreements with these manufacturers, which provide for certain product quality requirements. We are not vertically integrated, which provides us with flexibility and an ability to adapt to changes in the market, product supply and pricing while keeping our fixed costs low. Our relationships with our manufacturers are critical to new product introduction and the success of our business. We have strong relationships with our manufacturers, helping us to meet our supply and support requirements. As we announced in fiscal year 2019, we commenced a plan to streamline our global operations including further outsourcing of our manufacturing functions to increase supplier diversification and reduce operating expenses. We now have full manufacturing capabilities in Taiwan, Malaysia and Mexico. Furthermore, our production and distribution facility in Oxnard California has been closed. We are now utilizing our outsourced partner in Fort Worth, Texas for certain US distribution.
We focus on driving alignment of our product roadmaps with all our manufacturers and determining what we can do collectively to reduce costs across the supply chain. Our operations team based in the U.S. coordinates with our manufacturers’ engineers and quality control personnel to develop the requisite manufacturing processes, quality checks and testing as well as general oversight of the manufacturing activities. We believe this model has allowed us to effectively deliver high quality and innovative products while enabling us to minimize costs, manage inventory risk and maintain flexibility.
We are certified to the ISO (International Organization for Standardization) 9001: 2008 Quality management systems standard.
Research and Development
We compete in markets characterized by industry disruption, rapid technological change, evolving industry standards and new product features. We believe that our future success depends upon our ability to continue to develop innovative new products and solutions as well as enhancements to our existing products and solutions with advanced functionality and ease of use to drive customer demand and to further enhance our global brand and drive recurring revenue. We will continue to focus our research and development resources primarily on developing telematics products, services and software solutions for fleet management, heavy equipment, stolen vehicle recovery, consumer aftermarket telematics, trailer & asset tracking, transportation & logistics, and industrial monitoring & controls applications. We have developed technology platforms that can be leveraged across many of our vertical markets, applications and geographic regions. These include cloud-based telematics application enablement platforms and end-user software applications, cellular and satellite communications network-based asset tracking units, as well as 3G and 4G LTE broadband router products primarily for mobile applications. In addition, our development resources have been allocated to rationalizing existing product lines, reducing product costs, and improving performance through product redesign efforts.
10
Our research and development expenses in fiscal years ended February 29, 2020, February 28, 2019 and 2018 were $29.4 million, $27.7 million and $25.8 million, respectively. During this three-year period, our research and development expenses have ranged between 7% and 8% of annual consolidated revenues.
Sales and Marketing
We market and sell our products and services through our global direct sales organization, Channel Partner Program and sales representatives as well as our websites and digital presence. Our global direct sales organization consists of teams of field salespeople, key account managers and business development managers, who work closely with product and applications specialists and other internal sales support personnel based primarily at our U.S. locations. We have organized our field sales personnel, together with internal sales and field support personnel, into teams within each business group based on their specialized knowledge and expertise relating to specific product and service areas, geographies and customer groups. These sales teams are closely aligned with their respective product management, engineering and operations organizations.
We sell our products and services to large global enterprises, small to midsize companies, channel accounts and distributors as well as industrial OEM customers. These categories of customers require very different selling approaches and support requirements, and we have organized our sales teams to address these different requirements. Additionally, certain customers often have unique technical requirements and manufacturing processes, and may request specific product configurations, feature sets and designs. Sales to large enterprise customers often involve complex program management and long sales cycles, and require close cooperation between sales, operations and engineering personnel. As such, we have developed teams of key account managers and business development managers to serve the unique requirements of these customers.
We also actively sell our products in certain markets through our LoJack subsidiaries, independent sales representatives and distributors. We have entered into agreements with substantially all of our distributors. In some cases, we have granted representatives and distributors exclusive authorization to sell certain products in a specific geographic area. These agreements generally have terms of one year, which automatically renew on an annual basis, and are generally terminable by either party for convenience following a specified notice period.
We expect that our reputation for providing innovative and high-quality products will continue to play a significant role in our growth and success, and that high customer satisfaction will continue to fuel referrals of our brand to new customers. Through our trademarked name – CalAmp – we have built a highly recognizable brand in the global enterprise asset tracking and fleet management market verticals. Also, in connection with the acquisition of LoJack, we acquired a highly recognizable consumer-facing brand in the global connected vehicle market.
We will continue our investment in sales and marketing programs that further build brand awareness, drive deeper customer engagement and foster long-term relationships with our customers. Our marketing programs are now focused on supporting multi-channel product launches in new geographic markets. With the recent acquisitions, we will drive additional sales through our Tracker and LoJack Mexico subsidiaries, which will be a primary focus throughout fiscal 2021.
Additionally, we are focused on maximizing our efficiency and reach of our marketing spend by investing in public relations, social media and digital marketing programs. These programs are developed to educate our potential customers and other industry influencers to fuel active engagement with our products and services. Our activities around public relations, thought leadership, social media and digital marketing will be aligned with our customary product launches, media campaigns and presence at tradeshows and high exposure venues such as Mobile World Congress in Barcelona, Spain, Mobile World Congress Americas in Los Angeles among other high-profile industry events. Notably, Mobile World Congress Barcelona 2020, due to be held in late February 2020, was cancelled amid the coronavirus outbreak.
Our revenues derived from customers in the U.S. represented 73%, 74% and 73% of consolidated revenues in fiscal years ended February 29, 2020, February 28, 2019 and 2018, respectively.
11
Our markets are highly competitive. We face competition from small to large public and private competitors some of which have greater financial, distribution, marketing and other resources as well as greater economies of scale than we do. We believe the principal competitive factors impacting the market for our products and services are global scale, innovation, reputation, customer service, product quality, functionality and reliability, time-to-market, responsiveness and price. We believe that we compete favorably in all of these areas. Our continued success in our vertical markets will depend in part upon our ability to continue to innovate, design quality products and deploy solutions at competitive prices and with superior support services to our customers.
Some of the more established competitors for telematics systems and related connected products include Danlaw, Mobile Devices, Orbcomm, Quake Global, Queclink, Sierra Wireless, Spireon, Teltonika, Inseego, and Xirgo. Additionally, the market for Software and Subscription Services is also highly competitive and includes well-established companies such as Geotab, Samsara, Octo Telematics, Omnitracs, OnStar, Trimble, Verizon Connect and Zonar Systems as well as numerous smaller players.
BACKLOG
Total backlog for our hardware products as of February 29, 2020 and February 28, 2019 was $30.9 million and $18.4 million, respectively. Substantially all of the backlog at February 29, 2020 is expected to be shipped in fiscal 2021. Our backlog for hardware products increased year-over-year as we experienced significant supply shortages which were primarily attributable to significantly impaired production capacity from our one remaining Chinese supplier resulting from the coronavirus outbreak. We also experienced other supply shortages due to supply chain transitions, coupled with extended lead times on raw materials and components sourced from China, but used elsewhere in our global supply chain.
INTELLECTUAL PROPERTY
Intellectual property is an important aspect of our business, and we seek protection for our intellectual property as appropriate. We rely upon a combination of patent, trade secret, and trademark laws and contractual restrictions, such as confidentiality agreements and licenses, to establish and protect our proprietary rights. In addition, we often rely on inbound licenses of intellectual property for use in our business.
We own and utilize the tradenames “CalAmp” and “LoJack” as well as the related logos and trademarks on all of our products and solutions. We believe that having distinctive marks that are registered and readily identifiable is an important factor in identifying our brand. We own 223 active trademark applications and registrations throughout the world, with 35 pending and registered trademarks in the U.S.
In addition to the foregoing protections, we generally control access to and the use of our proprietary and other confidential information through the use of internal and external controls, including contractual protections with employees, manufacturers, and others. We will continue to file and prosecute patent applications when appropriate to attempt to protect our rights in our proprietary technologies.
As of February 29, 2020, we had 84 U.S. patents and 221 foreign patents. In addition to our awarded patents, we have 55 patent applications in process. Although a number of these trademarks, copyrights, and patents relate to software and products that are significant to our business and operations, we do not believe we are dependent on a single trademark, copyright or patent.
ENVIRONMENTAL REGULATION
We are subject to a variety of U.S. and foreign laws and regulations in connection with our operations and relating to the protection of the environment, including those governing discharges of pollutants into the air and water, the management and disposal of hazardous substances and the clean-up of contaminated sites. Some of our operations require environmental permits and controls to prevent and reduce air and water pollution. These permits are subject to modification, renewal and revocation by issuing authorities. We believe that we have obtained or are in the process of obtaining all necessary environmental permits for our operations.
12
We have established environmental management systems and continually update our environmental policies and standard operating procedures for our operations worldwide. We believe that our operations are in material compliance with applicable environmental laws, regulations and permits. We budget for operating and capital costs on an ongoing basis to comply with environmental laws.
CORPORATE RESPONSIBILITY AND SUSTAINABILITY
We believe responsible and sustainable business practices support our long-term success. As a company, we are deeply committed to protecting and supporting our people, our environment, and our communities. That commitment is reflected through sustainability-focused initiatives as well as day-to-day activities, including our adoption of sustainability-focused policies and procedures, our publicly-recognized focus on fostering an inclusive workplace, our constant drive toward more efficient use of materials and energy, our careful and active management of our supply chain, our products which help reduce carbon footprints and enhance road safety, and our impactful, globally-integrated ethics and compliance program.
|
|
• |
We seek to protect the human rights and civil liberties of our employees through policies, procedures, and programs that avoid risks of compulsory and child labor, both within our company and throughout our supply chain. |
|
|
• |
We foster a workplace of dignity, respect, diversity, and inclusion through our recruiting and advancement practices, internal communications, and employee resource groups. |
|
|
• |
We educate our employees annually on relevant ethics and compliance topics, publish accessible guidance on ethical issues and related company resources in our global Code of Business Conduct and Ethics, and encourage reporting of ethical concerns through any of several global and local reporting channels. |
|
|
• |
We innovate to reduce the energy used by our products, the energy used to manufacture them, and the amount of new materials required to manufacture them. |
EMPLOYEES
As of February 29, 2020, we had approximately 1,080 employees and 10 contracted workers. None of our employees or contract workers are represented by a labor union. The contracted production workers are engaged through independent temporary labor agencies.
EXECUTIVE OFFICERS
Our executive officers are as follows:
|
NAME |
|
AGE |
|
POSITION |
|
Jeffery Gardner |
|
60 |
|
Interim President and Chief Executive Officer |
|
Kurtis Binder |
|
49 |
|
Executive Vice President and Chief Financial Officer |
|
Arym Diamond |
|
41 |
|
Senior Vice President and Chief Revenue Officer |
|
Anand Rau |
|
57 |
|
Senior Vice President, Engineering |
JEFFERY GARDNER was appointed as our Interim President and CEO on March 25, 2020, and has served as a member of CalAmp’s Board since 2015. He most recently served as the President and CEO of Brinks Home Security from 2015 until February 2020. Mr. Gardner also served as President and CEO of Windstream Corporation, a leading provider of advanced network communications and technology solutions, including cloud computing and managed services. Before joining Windstream, Mr. Gardner served as Executive Vice President and CFO of Alltel Corp. Earlier in his career, Mr. Gardner held a variety of senior management positions at 360 Communications, which merged with Alltel in 1998.
13
KURTIS BINDER joined us in July 2017 and serves as our Executive Vice President and Chief Financial Officer. Prior to joining our company, he served as the Chief Financial Officer at VIZIO, Inc., a television and consumer electronics company headquartered in the United States since April 2010. Prior to joining VIZIO, Mr. Binder served as the Chief Accounting Officer for Applied Medical Resources, Inc. since December 2009. Mr. Binder was also employed in the assurance practice of Ernst & Young LLP from October 1997 to July 2009 and served as an Assurance and Advisory Business Services Partner.
ARYM DIAMOND is the Senior Vice President and Chief Revenue Officer responsible for the customer experience related to sales and support. Mr. Diamond joined CalAmp in March 2020 and brings over 20 years of experience in the enterprise software and consulting industry. Before joining CalAmp, he was part of the sales leadership team within Salesforce.com’s Einstein Analytics group where analytics and machine learning were re-imagined for the front office. Prior to that, he spent over 10 years at Oracle in various sales roles, which included being part of sales organizational alignment that came from multiple acquisitions as well as a shift from on premise to cloud-based subscriptions.
ANAND RAU is the Senior Vice President of Engineering responsible for all software and hardware product development and quality. Mr. Rau joined CalAmp in 2015 and brings 25 years of strategic management experience in delivering enterprise-class, mission-critical applications and platforms across several industry verticals including telematics, supply chain, physical resource management, industrial automation and medical products. Prior to CalAmp, Mr. Rau was the CTO at MarginPoint, a mobile inventory management and supply chain solutions company. Mr. Rau also led product development and quality assurance as Vice President of Engineering at Accruent Inc., a leader in the physical resource management vertical. He was also the co-founder and Vice President of Engineering at RiverOne (acquired by i2 technologies), where he led the team that built a supply chain solution that was adopted by companies representing approximately 25% of the global electronics industry. Rau started his career with Hewlett Packard Company in the Medical Products group, and has led the innovation and launch of technologically advanced enterprise solutions serving many markets.
Our executive officers are appointed by and serve at the discretion of the Board of Directors.
AVAILABLE INFORMATION
Our primary Internet address is www.calamp.com. We make our U.S. Securities and Exchange Commission (“SEC”) periodic reports (Forms 10-Q and Forms 10-K) and current reports (Forms 8-K) available free of charge through our website as soon as reasonably practicable after they are filed electronically with the SEC. Within the Investor Relations section of our website, we provide information concerning corporate governance, including our Corporate Governance Guidelines, Board committee charters and composition, Code of Business Conduct and Ethics, and other information. The content of our website is not incorporated by reference into this Annual Report on Form 10-K or into any other report or document we file with the SEC, and any references to our websites are intended to be inactive textual references only.
Materials that we file with the SEC may be read and copied at the SEC's Public Reference Room at 100 F Street, NE, Washington, D.C. 20549. Information on the operation of the Public Reference Room may be obtained by calling the SEC at 1-800-SEC-0330. The SEC also maintains an Internet website at http://www.sec.gov that contains reports, proxy and information statements, and other information that we file electronically with the SEC.
We operate in a rapidly changing environment that involves a number of risks and uncertainties, some of which are beyond our control. The following list describes several risk factors, which are applicable to our business and speaks as of the date of this document. These and other risks could have a material adverse effect on our business, results of operations, financial condition, and cash flows and the trading price of our common stock. The risks and uncertainties described below are not the only ones we face. Additional risks and uncertainties that we are unaware of, or that we currently believe are not material, may also become important factors that affect us.
14
Our accelerated supply chain diversification program, component shortages and uncertainty in international trade relations with China may adversely impact us and have a material adverse effect on our financial condition or results of operations.
We accelerated our supply chain diversification program to transition our manufacturing to tier one global contract manufacturers with facilities outside of China. This program was initiated against the backdrop of the escalation of trade tensions between the U.S. and China. These factors attributed to various supply disruptions, including component shortages, in the third and fourth quarter of fiscal 2020. Although we are taking steps to address these matters, the related operational challenges and supply chain disruptions may persist for some time.
The Coronavirus (COVID-19) pandemic could have a material adverse impact on our business, results of operations and financial condition.
In December 2019, a novel strain of coronavirus disease (“COVID-19”) was first reported in Wuhan, China. Less than four months later, on March 11, 2020, the World Health Organization declared COVID-19 a pandemic—the first pandemic caused by a coronavirus. The outbreak has reached more than 160 countries, resulting in the implementation of significant governmental measures, including lockdowns, closures, quarantines and travel bans, intended to control the spread of the virus. The COVID-19 outbreak has already caused severe global disruptions. In response to the virus, China and Italy (where we have a subsidiary in Milan) placed tens of millions of people under lockdown. Spain and France also recently implemented lockdown measures, and other countries and local governments may enact similar policies. As of April 30, 2020, the United States has temporarily restricted travel by foreign nationals into the country from a number of places, including China and Europe. In addition, on March 18, 2020, the U.S. and Canada agreed to restrict all nonessential travel across the border. We, and other companies, are also taking precautions, such as requiring employees to work remotely and imposing travel restrictions. These restrictions, and future prevention and mitigation measures, are likely to have an adverse impact on global economic conditions and consumer confidence and spending, which could materially adversely affect the supply and demand for our products and solutions. Uncertainties regarding the economic impact of COVID-19 is likely to result in sustained market turmoil, which could also negatively impact our business, financial condition and cash flows. This pandemic could negatively affect our ability to sell-through our backlog. Our ability to manage normal commercial relationships with our suppliers, contract manufacturers, and customers may suffer. Our customers could shift purchases to lower-priced or other perceived value offerings during the pandemic-caused economic downturn as a result of various factors, including workforce reductions, reduced access to credit, and changes in federal economic policy. In particular, customers may become more conservative in response to these conditions and seek to reduce their purchases and inventories. Our results of operations depend upon, among other things, our ability to maintain and increase sales volume with our existing customers, our ability to attract new consumers, and the financial condition of our customers. Decreases in demand for our products and solutions without a corresponding decrease in costs would put downward pressure on our margins and would negatively impact our financial results.
Governmental organizations, such as the U.S. Centers for Disease Control and Prevention and state and local governments, have recommended and/or imposed increased community-based interventions, including event cancellations, social distancing measures, and restrictions on gatherings of more than ten people. The governors of several states have temporarily closed bars and restaurants, and others may follow suit. As of April 30, 2020, California and New York residents were under a shelter-in-place order. On March 30, 2020, President Trump announced a shelter-in-place extension through April 30, 2020. In the future, government authorities may impose similar and/or additional restrictions on people’s movement, public gatherings and businesses. The extent of COVID-19’s effect on our operational and financial performance will depend on future developments, including the duration, spread and intensity of the outbreak, all of which are uncertain and difficult to predict considering the rapidly evolving landscape. As a result, it is not currently possible to ascertain the overall impact of COVID-19 on our business. However, if the pandemic continues to evolve into a severe worldwide health crisis, the disease could have a material adverse effect on our business, results of operations, financial condition and cash flows and adversely impact the trading price of our common stock.
15
We generally do not have long-term contracts with customers and our customers may cease purchasing our products and services at any time, which could negatively affect our business, financial condition or results of operations.
We generally do not have long-term contracts with our customers. As a result, our agreements with our customers generally do not provide us with any assurance of future sales. These customers can cease purchasing products and services from us at any time without penalty, are free to purchase products and services from our competitors, may expose us to competitive price pressure on each order and are not required to make minimum purchases. Any of these actions taken by our customers could have a material adverse effect on our business, financial condition or results of operations.
Because some of our components, assemblies and electronics manufacturing services are purchased from sole source suppliers or require long lead times, our business is subject to unexpected interruptions, which could cause our operating results to suffer.
Some of our key components are complex to manufacture and have long lead times. In the event of a reduction or interruption of supply, or degradation in quality, it could take up to six months to begin receiving adequate supplies from alternative suppliers, if any. As a result, product shipments could be delayed and revenues and profitability could suffer. Furthermore, if we receive a smaller allocation of component parts than is necessary to manufacture products in quantities sufficient to meet customer demand, customers could choose to purchase competing products and we could lose market share. Any of these events could have a material adverse effect on our business, financial condition or results of operations.
Because we depend on a few significant customers for a substantial portion of our revenues, the loss or significant decline or slowdown in growth in business of any of these customers could have an adverse effect on our business, financial condition or results of operations.
Our revenues depend on a small number of significant customers and some of them represent more than 10% of our total revenues in fiscal year 2020, 2019 and 2018 (see Note 3 to our consolidated financial statements). They are also expected to represent a substantial portion of our revenues in the near future. As a result, the loss of any one of these customers, or decline or slowdown in the growth in business of these customers, could have a material adverse effect on our business, financial condition and results of operations. In addition, because service revenue depends either partially or entirely on the usage levels of data transmission by our customers and end users, the decline or slowdown in the growth of usage patterns of these customers, which has and could continue to occur at any time and with or without a reduction in the number of our subscriber basis could have a material adverse effect on our business, financial condition and results of operations.
Dependence on a limited number of contract manufacturers and suppliers of manufacturing services and critical components within our supply chain may adversely affect our ability to bring products to market, damage our reputation and adversely affect our results of operations.
We operate a primarily outsourced manufacturing business model that utilizes contract manufacturers. We depend on a limited number of contract manufacturers to allocate sufficient manufacturing capacity to meet our needs, to produce products of acceptable quality at acceptable yields, and to deliver those products to us on a timely basis. In such circumstances, we may be unable to meet our customer demand and may fail to meet our contractual obligations. This could result in the payment of significant damages by us to our customers and our net revenue could decline, which could adversely affect our business, financial condition and results of operations. Any substantial disruption in our contract manufacturers’ supply as a result of a pandemic, natural disaster, trade wars, political unrest, economic instability, equipment failure or other cause, could materially harm our business, customer relationships and results of operations.
16
Because the markets in which we compete are highly competitive and some of our competitors have greater resources than us, we cannot be certain that our products and services will continue to be accepted in the marketplace or capture increased market share.
The markets for our products and services are intensely competitive and characterized by rapid technological change, evolving standards, short product life cycles, and price erosion. Given the highly competitive environment in which we operate, we cannot be sure that any competitive advantages currently enjoyed by our products and services will be sufficient to establish and sustain our products and services in the markets we serve. Any increase in price or other competition could result in erosion of our market share, to the extent we have obtained market share, and could have a negative impact on our financial condition and results of operations. We cannot provide assurance that we will have the financial resources, technical expertise or marketing and support capabilities to compete successfully. We expect competition to intensify in the future with the introduction of new technologies and market entrants and with the possible consolidation of competitors.
Information about our competitors is included in Part I, Item 1 of this Annual Report on Form 10-K under the heading “COMPETITION”.
If demand for our products and services fluctuates rapidly and unpredictably, it may be difficult to manage our business efficiently, which may result in reduced gross margins and profitability.
Our cost structure is based in part on our expectations for future demand. Many costs, particularly those relating to capital equipment and manufacturing overhead, are largely fixed. Rapid and unpredictable shifts in demand for our products and services may make it difficult to plan production capacity and business operations efficiently. If demand is significantly below expectations, we may be unable to rapidly reduce these fixed costs, which can diminish gross margins and cause losses. A sudden downturn may also leave us with excess inventory, which may be rendered obsolete if products and services evolve during the downturn and demand shifts to newer products and services. Our ability to reduce costs and expenses may be further constrained because we must continue to invest in research and development to maintain our competitive position and to maintain service and support for our existing customer base. Conversely, in the event of a sudden upturn, we may incur significant costs to rapidly expedite delivery of components, procure scarce components and outsource additional manufacturing processes. These costs could reduce our gross margins and overall profitability. Any of these results could adversely affect our business, financial condition or results of operations.
Any acquisitions we pursue could disrupt our business and harm our financial condition and results of operations.
As part of our business strategy, we review and intend to continue to review acquisition opportunities that we believe would be advantageous or complementary to the development of our business. In fiscal 2017, we acquired LoJack. In fiscal 2019, we acquired Tracker and in the first quarter of fiscal 2020, we acquired LoJack Mexico and Synovia, and we may acquire additional businesses, assets, or technologies in the future. If we make any acquisitions, we could take any or all of the following actions, any one of which could adversely affect our business, financial condition, results of operations or share price:
|
|
• |
use a substantial portion of our available cash; |
|
|
• |
require a significant devotion of management’s time and resources in the pursuit or consummation of any acquisition; |
|
|
• |
incur substantial debt, which may not be available to us on favorable terms and may adversely affect our liquidity; |
|
|
• |
issue equity or equity-based securities that would dilute existing stockholders’ ownership percentage; |
|
|
• |
assume contingent liabilities; and |
|
|
• |
take substantial charges in connection with acquired assets. |
17
Acquisitions also entail numerous other risks, including, without limitation: difficulties in assimilating acquired operations, products, technologies and personnel; unanticipated costs; diversion of management’s attention from existing operations; risks of entering markets in which we have limited or no prior experience; and potential loss of key employees from either our existing business or the acquired organization. Acquisitions may result in substantial accounting charges for restructuring and other expenses, amortization of purchased technology and intangible assets and stock-based compensation expense, any of which could materially and adversely affect our operating results. We may not be able to realize the anticipated benefits of or successfully integrate with our existing business the businesses, products, technologies or personnel that we acquire, and our failure to do so could harm our business and operating results.
Any acquisitions we make and industry consolidation could adversely affect our existing business relationships with our suppliers and customers.
If we make any acquisitions, our existing business relationships with our suppliers and customers could be adversely affected. Moreover, our industry is being affected by the trend toward consolidation and the creation of strategic relationships. If we are unable to successfully adapt to this rapidly changing environment, we could suffer a reduction in the volume of business with our customers and suppliers, or we could lose customers or suppliers entirely, which could materially and adversely affect our financial condition and operating results.
Our success depends on the attraction and retention of senior management and technical personnel with relevant expertise.
As a competitor in a highly technical market, we depend heavily upon the efforts of our existing senior management and technical teams. The loss of the services of one or more members of these teams could slow product and services development and commercialization objectives. Due to the specialized nature of our products and services, we also depend upon our ability to attract and retain qualified technical personnel with substantial industry knowledge and expertise. Competition for qualified personnel is intense, and we may not be able to continue to attract and retain qualified personnel necessary for the development of our business.
Our business is subject to many factors that could cause our quarterly or annual operating results to fluctuate and our stock price to be volatile.
Our quarterly and annual operating results have fluctuated in the past and may fluctuate significantly in the future due to a variety of factors, many of which are outside of our control. A majority of our product orders are shipped in the final month of the quarter and a significant amount in the last two weeks of the quarter. Some of the other factors that could affect our quarterly or annual operating results include:
|
|
• |
the timing and amount, or cancellation or rescheduling, of orders for our products or services; |
|
|
• |
our ability to develop, introduce, ship and support new products, services and enhancements, and manage product and services transitions; |
|
|
• |
announcements of new product and service introductions and reductions in the price of products and services offered by our competitors; |
|
|
• |
our ability to achieve cost reductions; |
|
|
• |
our ability to obtain sufficient supplies of sole or limited source components for our products; |
|
|
• |
our ability to achieve and maintain production volumes and quality levels for our products; |
|
|
• |
our ability to maintain the volume of products and services sold and the mix of distribution channels through which they are sold; |
|
|
• |
the loss of any one of our major customers or a significant reduction in orders from those customers; |
|
|
• |
increased competition, particularly from larger, better capitalized competitors; |
|
|
• |
fluctuations in demand for our products and services; and |
|
|
• |
changes in telecommunications and wireless market conditions specifically and economic conditions generally, including as a result of a pandemic or other catastrophic event. |
18
Due in part to factors such as the timing of product release dates, purchase orders and product availability, significant volume shipments of products could occur close to the end of a fiscal quarter. Failure to ship products by the end of a quarter may adversely affect operating results. In the future, our customers may delay delivery schedules or cancel their orders without notice. Due to these and other factors, our quarterly revenue, expenses and results of operations could vary significantly in the future, and period-to-period comparisons should not be relied upon as indications of future performance.
If we do not meet product and services introduction deadlines, our business could be adversely affected.
In the past, we have experienced design and manufacturing difficulties that have delayed the development, introduction or marketing of new products, services and enhancements and which caused us to incur unexpected expenses and lost revenue. In addition, some of our existing customers have conditioned their future purchases of our products and services on the addition of new features. In the past, we have experienced delays in introducing some new product features. Furthermore, in order to compete in some markets, we will have to develop different versions of existing products and services that comply with diverse, new or varying governmental regulations in each market. Our inability to develop new products, services, product features on a timely basis, or the failure of new products, services or features to achieve market acceptance, could adversely affect our business.
If our introduction of a DaaS subscription model is not embraced by enterprise customers, our business could be adversely affected.
We recently introduced an innovative Device-as-a-Service (“DaaS”) subscription business model for certain products that enables enterprise customers to leverage more of our research and development investments and full portfolio of connected car software services to lower their business costs and drive new revenue streams from subscription services. If our enterprise customers do not broadly embrace this business model, it could adversely affect our business, financial condition, or results of operations.
Because we currently sell, and we intend to grow the sales of, certain of our products and services in countries other than the U.S., we are subject to different regulatory policies. We may not be able to develop products and services that comply with the standards of different countries, which could result in our inability to sell our products and services and further, we may be subject to political, economic, and other conditions affecting such countries, which could result in reduced sales of our products and services and which could adversely affect our business.
If our sales are to grow in the longer term, we believe we must grow our international business. Many countries require communications equipment used in their country to comply with unique regulations, including safety regulations, radio frequency allocation schemes and standards. If we cannot develop products that work with different standards, we will be unable to sell our products and services in those locations. If compliance proves to be more expensive or time consuming than we anticipate, our business would be adversely affected. Some countries have not completed their radio frequency allocation process and therefore we do not know the standards with which we would be required to comply. Furthermore, standards and regulatory requirements are subject to change. If we fail to anticipate or comply with these new standards, our business and results of operations will be adversely affected.
Sales to customers outside the U.S. accounted for 27.2%, 26.2% and 27.4% of our total sales for fiscal years ended February 29, 2020, February 28, 2019 and 2018, respectively. Assuming that we continue to sell our products and services to foreign customers, which is our expectation, we will be subject to the political, economic and other conditions affecting countries or jurisdictions other than the U.S., including those in Latin America, Africa, the Middle East, Europe and Asia. Any interruption or curtailment of trade between the countries in which we operate and our present trading partners, changes in exchange rates, significant shift in U.S. trade policy toward these countries, or significant downturn in the political, economic or financial condition of these countries, could cause demand for and sales of our products and services to decrease, or subject us to increased regulation including future import and export restrictions, any of which could adversely affect our business.
Additionally, a substantial portion of our products, components and subassemblies are currently procured from foreign suppliers located primarily in Hong Kong, mainland China, Malaysia and other Pacific Rim countries. Any significant shift in U.S. trade policy toward these countries or a significant downturn in the political, economic or financial condition of these countries could cause disruption of our supply chain or otherwise disrupt operations, which could adversely affect our business.
19
Our global operations and continued international expansion expose us to risks and challenges associated with conducting business internationally.
We face several risks inherent in conducting business internationally, including compliance with international and U.S. laws and regulations that apply to our international operations. These laws and regulations include data privacy requirements, labor relations laws, tax laws, competition regulations, import and trade restrictions, economic sanctions, export requirements, U.S. laws such as the Foreign Corrupt Practices Act, the UK Bribery Act 2010 and other local laws that prohibit payments to governmental officials or certain payments or remunerations to customers. Given the high level of complexity of these laws there is a risk that some provisions may be breached by us, for example through fraudulent or negligent behavior of individual employees, our failure to comply with certain formal documentation requirements, or otherwise. Violations of these laws and regulations could result in fines, criminal sanctions against us, our officers or our employees, requirements to obtain export licenses, cessation of business activities in sanctioned countries, implementation of compliance programs, or prohibitions on the conduct of our business. Any such violations could include prohibitions on our ability to offer our products or services in one or more countries and could materially damage our reputation, our brand, our international expansion efforts, ability to attract and retain employees, business or operating results.
Additionally, the announcement of the Referendum of the U.K.’s Membership of the European Union (referred to as Brexit), advising for the exit of the U.K. from the European Union, could cause disruptions to and create uncertainty surrounding our business, particularly given our recent efforts to expand our business throughout Europe through our acquisition of Tracker UK. Brexit could affect our relationships with our existing and future customers, suppliers and employees, which could in turn have an adverse effect on our business, financial results and operations.
Disruptions in global credit and financial markets could materially and adversely affect our business and results of operations.
There is significant uncertainty about the stability of global credit and financial markets. Credit market dislocations could cause interest rates and the cost of borrowing to rise or reduce the availability of credit, which could negatively affect customer demand for our products and services if they responded to such credit market dislocations by suspending, delaying or reducing their capital expenditures. Moreover, since we currently generate more than 25% of our revenues outside the U.S., fluctuations in foreign currencies can have an impact on demand for our products and services for which the sales are generally denominated in U.S. dollars.
Ongoing changes to U.S. tax, tariff and import/export regulations may have a negative effect on global economic conditions, financial markets and our business.
We import certain products and components from suppliers in China. In 2018, the Office of the U.S. Trade Representative (the “USTR”) enacted tariffs on imports into the U.S. from China, resulting in ongoing trade tensions. Although some of the products and components we import are affected by the tariffs, at this time, we do not expect these tariffs to have a material impact on our business, financial condition or results of operations. However, it is possible that further tariffs may be imposed on imports of our products, or that our business will be impacted by retaliatory trade measures taken by China or other countries in response to existing or future tariffs, causing us to raise prices or make changes to our operations, any of which could have a negative impact on our revenue or operating results.
We may not be able to adequately protect our intellectual property, and our competitors may be able to offer similar products and services that would harm our competitive position.
Our ability to succeed in wireless data communications markets may depend, in large part, upon our intellectual property for some of our wireless technologies. We currently rely primarily on patents, trademark and trade secret laws, confidentiality procedures and contractual provisions to establish and protect our intellectual property. However, these mechanisms provide us with only limited protection. We currently hold 84 U.S. patents and 221 foreign patents. As part of our confidentiality procedures, we enter into non-disclosure and invention assignment agreements with all employees, including officers, managers and engineers. Despite these precautions, third parties could copy or otherwise obtain and use our technology without authorization, or develop similar technology independently. Furthermore, effective protection of intellectual property rights is unavailable or limited in some foreign countries. The protection of our intellectual property rights may not provide us with any legal remedy should our competitors independently develop similar technology, duplicate our products and services, or design around any intellectual property rights we hold.
20
We rely on access to third-party patents and intellectual property, and our future results could be materially and adversely affected if we are unable to secure such access in the future.
Many of our products and services are designed to include third-party intellectual property, and in the future, we may need to seek or renew licenses relating to such intellectual property. Although we believe that, based on past experience and industry practice, such licenses generally can be obtained on reasonable terms, there is no assurance that the necessary licenses would be available on acceptable terms or at all. Some licenses we obtain may be nonexclusive and, therefore, our competitors may have access to the same technology licensed to us. If we fail to obtain a required license or are unable to design around a patent where we do not hold a license, we may be unable to sell some of our hardware solutions and services, and there can be no assurance that we would be able to design and incorporate alternative technologies, without a material adverse effect on our business, financial condition, and results of operations.
Our competitors have or may obtain patents that could restrict our ability to offer our products, software and services, or subject us to additional costs, which could impede our ability to offer our products, software and services and otherwise adversely affect us. In addition, third parties may claim that we infringe their intellectual property and proprietary rights and may prevent us from manufacturing and selling some of our products and services and subject us to litigation over intellectual property rights or other commercial issues.
Several of our competitors have obtained and can be expected to obtain patents that cover products, software and services directly or indirectly related to those offered by us. There can be no assurance that we are aware of all existing patents held by our competitors or other third parties containing claims that may pose a risk of our infringement on such claims by our products, software and services. In addition, patent applications in the U.S. may be confidential until a patent is issued and, accordingly, we cannot evaluate the extent to which our hardware solutions, software and services may infringe on future patent rights held by others.
Even with technology that we develop independently, a third party may claim that we are using inventions claimed by their patents and may initiate litigation to stop us from engaging in our normal operations and activities, such as engineering and development and the sale of any of our products, software and services. Furthermore, because of rapid technological changes in the mobile resource management (“MRM”) and IoT marketplaces, current extensive patent coverage, and the rapid issuance of new patents, it is possible that certain components of our products, software, services, and business methods may unknowingly infringe the patents or other intellectual property rights of third parties. From time to time, we have been notified that we may be infringing such rights.
In the highly competitive and technology-dependent telecommunications field in particular, litigation over intellectual property rights is a significant business risk, and some third parties (referred to as non-practicing, or patent-assertion, entities) are pursuing a litigation strategy with the goal of monetizing otherwise unutilized intellectual property portfolios via licensing arrangements entered into under threat of continued litigation. These lawsuits relate to the validity, enforceability, and infringement of patents or proprietary rights of third parties. We may have to defend ourselves against allegations that we violated patents or proprietary rights of third parties.
Regardless of merit, responding to such litigation may be costly, unpredictable, time - consuming, and often involves complex legal, scientific, and factual questions, and could divert the attention of our management and technical personnel. In certain cases, we may consider the desirability of entering into such licensing agreements or arrangements, although no assurance can be given that these licenses can be obtained on acceptable terms or that litigation will not occur. If we are found to be infringing any intellectual property rights, we could lose our right to develop, manufacture, or market products and services, product and services launches could be delayed, or we could be required to pay substantial monetary damages or royalties to license proprietary rights from third parties. If a temporary or permanent injunction is granted by a court prohibiting us from marketing or selling certain products, software and services, or a successful claim of infringement against us requires us to pay royalties to a third party, our financial condition and operating results could be materially and adversely affected, regardless of whether we can develop non-infringing technology.
21
We may be subject to legal proceedings that could adversely affect our business.
We may be subject to legal claims or regulatory matters involving stockholder, consumer, antitrust, intellectual property infringement, product liability and other issues. Litigation is subject to inherent uncertainties, including increases in demands for attention on our management team, and unfavorable rulings could occur. An unfavorable ruling could include money damages. If an unfavorable ruling were to occur, it could have a material adverse effect on our business, financial condition and results of operations for the period in which the ruling occurred or future periods. See also “Item 3 – Legal Proceedings” in Part I of this Annual Report on Form 10-K.
Evolving regulation and changes in applicable laws relating to the Internet may increase our expenditures related to compliance efforts or otherwise limit the solutions we can offer, which may harm our business and adversely affect our financial condition.
As Internet commerce continues to evolve, increased regulation by federal, state or foreign agencies becomes more likely. We are particularly sensitive to these risks because the Internet is a critical component of our SaaS and DaaS business model. In addition, taxation of services provided over the Internet or other charges imposed by government agencies or by private organizations for accessing the Internet may be imposed. Any regulation imposing greater fees for Internet use or restricting information exchange over the Internet could result in a decline in the use of the Internet and the viability of Internet-based services, which could harm our business.
Evolving regulation relating to data privacy may increase our expenditures related to compliance efforts or otherwise limit the solutions we can offer, which may harm our business and adversely affect our financial condition.
Our products and solutions enable us to collect, manage and store a wide range of data related to fleet management such as vehicle location and fuel usage, speed and mileage and, in the case of our field service application, includes customer information, job data, schedule, invoice and other information. A valuable component of our solutions is our ability to analyze this data to present the user with actionable business intelligence. We obtain our data from a variety of sources, including our customers and third-party providers. The U.S. and various state governments (including the California Consumer Privacy Act of 2018) have adopted or proposed limitations on the collection, distribution and use of personal information. Several foreign jurisdictions, including the European Union and the United Kingdom, have adopted legislation (including directives or regulations) that increase or change the requirements governing data collection and storage in these jurisdictions. Proposed or new legislation and regulations could also significantly affect our business. There currently are a number of proposals pending before federal, state, and foreign legislative and regulatory bodies. In addition, the new European Union General Data Protection Regulation (“GDPR”) took effect in May 2018. The GDPR includes operational requirements for companies that receive or process personal data of residents of the European Union. For example, we may be required to obtain consent and/or offer new controls to existing and new users in Europe before processing data. In addition, the GDPR includes significant penalties for non-compliance.
Violations of these laws, or allegations of such violations, could subject us to litigation, regulatory investigations, cash and non-cash penalties for noncompliance, disrupt our operations, involve significant management distraction and result in a material adverse effect on our business, financial condition and results of operations. Moreover, if future laws and regulations limit our customers’ ability to use and share this data, or our ability to store, process and share data with our customers over the Internet, demand for our solutions could decrease, our costs could increase, and our results of operations and financial condition could be harmed.
We may be subject to breaches of our information technology systems, which could damage our reputation, vendor, and customer relationships, and our customers’ access to our services.
Our presence in the IoT industry with offerings of telematics products and services, including vehicle telematics, could also increase our exposure to potential costs and expenses and reputational harm in the event of cyber-attacks impacting these products or services. Our business operations require that we use and store sensitive data, including intellectual property, proprietary business information and personally identifiable information, in our secure data centers and on our networks. We face a number of threats to our data centers and networks in the form of unauthorized access, security breaches and other system disruptions. It is critical to our business strategy that our infrastructure remains secure and is perceived by customers and partners to be secure. We require usernames and passwords in order
22
to access our information technology systems. We also use encryption and authentication technologies to secure the transmission and storage of data. Despite our security measures, our information technology systems may be vulnerable to attacks by hackers or other disruptive problems. Any such security breach may compromise information used or stored on our networks and may result in significant data losses or theft of our, our customers’, or our business partners’ intellectual property, proprietary business information or personally identifiable information. A cybersecurity breach could negatively affect our reputation by adversely affecting the market’s perception of the security or reliability of our products or services. In addition, a cyber-attack could result in other negative consequences, including remediation costs, disruption of internal operations, increased cybersecurity protection costs, lost revenues or litigation, which could have a material adverse effect on our business, results of operations and financial condition.
We depend to some extent upon wireless networks owned and controlled by others, unproven business models, and emerging wireless carrier models to deliver existing services and to grow.
If we do not have continued access to sufficient capacity on reliable networks, we may be unable to deliver services and our sales could decrease. Our ability to grow and achieve profitability partly depends on our ability to buy sufficient capacity on the networks of wireless carriers and on the reliability and security of their systems. Some of our wireless services are delivered using airtime purchased from third parties. We depend on these third parties to provide uninterrupted service free from errors or defects and would not be able to satisfy our customers’ needs if such third parties failed to provide the required capacity or needed level of service. In addition, our expenses would increase, and profitability could be materially and adversely affected if wireless carriers were to significantly increase the prices of their services. Our existing agreements with the wireless carriers generally have one- to three-year terms. Some of these wireless carriers are, or could become, our competitors.
Our failure to predict carrier and end user customer preferences among the many evolving wireless industry standards could hurt our ability to introduce and sell new products and services.
In our industry, it is critical to our success that we accurately anticipate evolving wireless technology standards and that our products and services comply with these standards in relevant respects. We are currently focused on engineering and manufacturing products and services that comply with several different wireless standards. Any failure of our products and services to comply with any one of these or future applicable standards could prevent or delay their introduction and require costly and time-consuming engineering changes. Additionally, if an insufficient number of wireless operators or subscribers adopt the standards to which we engineer our products and services, then sales of our new products and services designed to those standards could be materially harmed.
Our business could be adversely impacted by the interruption, failure or corruption of our proprietary Internet-based systems that are used to configure and communicate with the wireless tracking and monitoring devices that we sell.
Our telematics products and software services depend upon Internet-based systems that are proprietary to our business. These applications, which are hosted at independent data centers and are connected via access points to cellular networks, are used by our customers and by us to configure and communicate with wireless devices for purposes of determining location, speed or other conditions of vehicles and other mobile or fixed assets, and to deliver configuration code or executable commands to the devices. If these Internet-based systems failed or were otherwise compromised in some way, it could adversely affect the proper functioning of the wireless tracking and monitoring devices that we sell, and could result in damages being incurred by us as a result of the temporary or permanent inability of our customers to wirelessly communicate with these devices.
23
If we fail to maintain proper and effective internal controls, our ability to produce accurate and timely financial statements could be impaired, which could harm our operating results, our ability to operate our business and investors’ views of us.
We are subject to the rules and regulations of the SEC, including those rules and regulations mandated by the Sarbanes-Oxley Act. Section 404 of the Sarbanes-Oxley Act requires public companies to include in their annual report a statement of management’s responsibilities for establishing and maintaining adequate internal control over financial reporting, together with an assessment of the effectiveness of those internal controls. Section 404 also requires the independent auditors of certain public companies to attest to, and report on, this management assessment. Ensuring that we have adequate internal financial and accounting controls and procedures in place so that we can produce accurate financial statements on a timely basis is a costly and time-consuming effort that will need to be evaluated frequently. Our failure to maintain the effectiveness of our internal controls in accordance with the requirements of the Sarbanes-Oxley Act could have a material adverse effect on our business. We could lose investor confidence in the accuracy and completeness of our financial reports, which could have an adverse effect on the price of our common stock. In addition, if our efforts to comply with new or changed laws, regulations, and standards differ from the activities intended by regulatory or governing bodies due to ambiguities related to practice, regulatory authorities may initiate legal proceedings against us and our business may be harmed.
We rely upon Amazon Web Services to operate certain aspects of our service and any disruption of or interference with our use of the Amazon Web Services operation would impact our operations and our business would be materially and adversely impacted.
Amazon Web Services (“AWS”) provides a distributed computing infrastructure platform for business operations, or what is commonly referred to as a “cloud” computing service. We have architected our software and computer systems so as to utilize data processing, storage capabilities, and other services provided by AWS. Certain of our SaaS platforms and applications are hosted by AWS. Given this, along with the fact that we cannot easily switch our AWS operations to another cloud service provider, any disruption of or interference with our use of AWS would impact our operations and our business would be materially and adversely impacted.
Some of our products are subject to mandatory regulatory approvals in the U.S. and other countries that are subject to change, which could make compliance costly and unpredictable.
Some of our products are subject to certain mandatory regulatory approvals in the U.S. and other countries in which it operates. In the U.S., the Federal Communications Commission (“FCC”) regulates many aspects of communication devices, including radiation of electromagnetic energy, biological safety and rules for devices to be connected to the telecommunication networks. Although we have obtained the required FCC and various country approvals for all products it currently sells, there can be no assurance that such approvals can be obtained for future products on a timely basis, or at all. In addition, such regulatory requirements may change or we may not in the future be able to obtain all necessary approvals from countries other than the U.S. in which we currently sell our products or in which we may sell its products in the future.
We may be subject to product liability, warranty and recall claims that may increase the costs of doing business and adversely affect our business, financial condition and results of operations.
We are subject to a risk of product liability or warranty claims if our products or services actually or allegedly fail to perform as expected or the use of our products or services results, or are alleged to result, in bodily injury and/or property damage. While we maintain what we believe to be reasonable limits of insurance coverage to appropriately respond to such liability exposures, large product liability claims, if made, could exceed our insurance coverage limits and insurance may not continue to be available on commercially acceptable terms, if at all. There can be no assurance that we will not incur significant costs to defend these claims or that we will not experience any product liability losses in the future. In addition, if any of our designed products are, or are alleged to be, defective, we may be required to participate in recalls and exchanges of such products. The future cost associated with providing product warranties and/or bearing the cost of repair or replacement of our products could exceed our historical experience and have a material adverse effect on our business, financial condition and results of operations.
24
Our inability to identify the origin of conflict minerals in our products could have a material adverse effect our business.
Many of our product lines include tantalum, tungsten, tin, gold and other materials that are considered to be “conflict minerals” under the SEC’s rules. Those rules require public reporting companies to provide disclosure regarding the use of conflict minerals sourced from the Democratic Republic of the Congo and adjoining countries in the manufacture of products. Those rules, or similar rules that may be adopted in other jurisdictions, could adversely affect our costs, the availability of minerals used in our products and our relationships with customers and suppliers.
We may experience significant disruptions in our operations resulting from our enterprise resource planning system initiatives.
We depend on our information technology systems for the efficient functioning of our global business, including accounting, billing, data storage, purchasing and inventory management. In order to integrate and enhance our global operations, we initiated the phased implementation of an ERP system across our global operating locations to support our operations. The implementation of this ERP system required, and will continue to require, the investment of human and financial resources. We have incurred and expect to incur additional expenses as we continue to implement, enhance and develop our ERP system. As a result of our ERP initiatives, we may encounter difficulties in operating our business, which could disrupt our operations, including our ability to timely ship and track customer orders, determine inventory requirements, manage our supply chain, manage customer billing and adequately service our customers. If we experience significant disruptions resulting from our ERP initiatives, our business and operations could be disrupted, including our ability to report accurate and timely financial results. Accordingly, such events may disrupt or reduce the efficiency of our global operations and have a material adverse effect on our operating results and cash flows.
Risks Relating to Our Convertible Notes and Indebtedness
We may not have the ability to raise the funds necessary to settle conversions of the convertible notes in cash, repay the convertible notes at maturity or repurchase the convertible notes upon a fundamental change, and our future debt may contain limitations on our ability to pay cash upon conversion or repurchase of the convertible notes.
We have two outstanding convertible senior unsecured notes – a $27.6 million aggregate principal amount of 1.625% convertible senior unsecured notes due in May 2020 (“2020 Convertible Notes”) and a $230.0 million aggregate principal amount of 2.00% convertible senior unsecured notes due in 2025 (“2025 Convertible Notes”, and collectively with the 2020 Convertible Notes, the “Notes”).
Holders of the 2020 Convertible Notes will have the right to require us to repurchase all or a portion of their convertible notes upon the occurrence of a fundamental change at a repurchase price equal to 100% of the principal amount of the convertible notes to be repurchased, plus accrued and unpaid interest, if any. The 2020 Convertible Notes will be convertible into cash, shares of our common stock or a combination of cash and shares of common stock, at our election, based on an initial conversion rate of 36.2398 shares of common stock per $1,000 principal amount of the convertible notes, which is equivalent to an initial conversion price of $27.594 per share of common stock, subject to customary adjustments. Holders may convert their notes at their option at any time prior to November 15, 2019 upon the occurrence of certain events in the future, as defined in the applicable indenture. During the period from November 15, 2019 to May 13, 2020, holders may convert all or any portion of their notes regardless of the foregoing conditions. As of February 29, 2020, none of the holders of the 2020 Convertible Notes elected to convert since our shares have been trading under the initial conversion price.
Holders of the 2025 Convertible Notes will have the right to require us to repurchase all or a portion of their convertible notes upon the occurrence of a fundamental change at a repurchase price equal to 100% of the principal amount of the convertible notes to be repurchased, plus accrued and unpaid interest, if any. The 2025 Convertible Notes will be convertible into cash, shares of our common stock or a combination of cash and shares of common stock, at our election, based on an initial conversion rate of 32.5256 shares of common stock per $1,000 principal amount of the convertible notes, which is equivalent to an initial conversion price of $30.7450 per share of common stock, subject to customary adjustments. Holders may convert their notes at their option upon the occurrence of certain events, as defined in the applicable indenture.
25
Upon conversion of one or both of the Notes, unless we elect to deliver solely shares of our common stock to settle such conversion (other than paying cash in lieu of delivering any fractional share), we will be required to make cash payments in respect of the convertible notes being converted. However, we may not have enough available cash or be able to obtain financing at the time we are required to make repurchases of the Notes surrendered therefor or pay cash with respect to the convertible notes being converted or at their maturity.
In addition, our ability to repurchase or to pay cash upon conversions or at maturity of the Notes may be limited by law, regulatory authority or agreements governing our future indebtedness. Our failure to repurchase the Notes at a time when the repurchase is required by the applicable indenture or to pay any cash payable on future conversions of the convertible notes as required by the applicable indenture would constitute a default under the applicable indenture. A fundamental change under such indenture or a default under the indenture could also lead to a default under agreements governing our future indebtedness. If the repayment of the related indebtedness were to be accelerated after any applicable notice or grace periods, we may not have sufficient funds to repay the indebtedness and repurchase the convertible notes or make cash payments upon conversions thereof.
The conditional conversion feature of the convertible notes, if triggered, may adversely affect our financial condition and operating results.
In the event the conditional conversion feature of the Notes is triggered, holders of the Notes will be entitled to convert the Notes at any time during specified periods at their option. If one or more holders elect to convert their convertible notes, unless we elect to satisfy our conversion obligation by delivering solely shares of our common stock (other than paying cash in lieu of delivering any fractional share), we would be required to settle a portion or all of our conversion obligation through the payment of cash, which could adversely affect our liquidity. In addition, even if holders do not elect to convert their convertible notes, we could be required under applicable accounting rules to reclassify all or a portion of the outstanding principal of the Notes as a current rather than long-term liability, which would result in a material reduction of our net working capital.
The accounting method for convertible debt securities that may be settled in cash, such as the convertible notes, could have a material adverse effect on our reported financial results.
Accounting Standards Codification Subtopic 470-20, Debt with Conversion and Other Options (“ASC 470-20”), requires an entity to separately account for the liability and equity components of convertible debt instruments (such as the convertible notes) that may be settled entirely or partially in cash upon conversion in a manner that reflects the issuer’s non-convertible debt interest rate. Accordingly, the equity component of the convertible notes is required to be included in the additional paid-in capital section of stockholders’ equity on our consolidated balance sheet, and the value of the equity component is treated as original issue discount for purposes of accounting for the debt component of the convertible notes. As a result, we are required to recognize a greater amount of non-cash interest expense in our consolidated income statements in the current and future periods presented as a result of the amortization of the discounted carrying value of the convertible notes to their principal amount over the term of the convertible notes. We report lower net income (or greater net losses) in our consolidated financial results because ASC 470-20 requires interest to include both the current period’s amortization of the original issue discount and the instrument’s non-convertible interest rate. This could adversely affect our reported or future consolidated financial results, the trading price of our common stock and the trading price of the convertible notes.
In addition, under certain circumstances, in calculating earnings per share, convertible debt instruments (such as the convertible notes) that may be settled entirely or partly in cash are currently accounted for utilizing a method in which the shares of common stock issuable upon conversion of the convertible notes, if any, are not included in the calculation of diluted earnings per share except to the extent that the conversion value of the convertible notes exceeds their principal amount. Under this method, diluted earnings per share is calculated as if the number of shares of common stock that would be necessary to settle such excess, if we elected to settle such excess in shares, were issued. We cannot be sure that the accounting standards in the future will continue to permit the use of this method. If we are unable to use this method in accounting for the shares issuable upon conversion of the convertible notes, if any, then our diluted consolidated earnings per share could be adversely affected.
26
The capped call, convertible note hedge and warrant transactions may adversely affect the value of our notes and our common stock.
In connection with the sale of the 2020 Convertible Notes, we entered into convertible note hedge transactions with certain financial institutions that we refer to as the option counterparties. The convertible note hedge transactions are expected to offset the potential dilution to our common stock upon any conversion of convertible notes and/or offset any cash payments we are required to make in excess of the principal amount upon conversion of any convertible notes. We also entered into warrant transactions with the option counterparties pursuant to which we sold warrants for the purchase of our common stock. The warrant transactions could separately have a dilutive effect if and to the extent that the market price per share of our common stock exceeds the applicable strike price of the warrants.
We have been advised that the option counterparties or their respective affiliates may modify their initial hedge positions by entering into or unwinding various derivatives with respect to our common stock and/or purchasing or selling our common stock or other securities of ours in secondary market transactions prior to the maturity of the convertible notes (and are likely to do so during any observation period related to a conversion of convertible notes or following any repurchase of convertible notes by us in connection with any fundamental change repurchase date or otherwise). This activity could suppress or inflate the market price of our common stock.
In connection with the sale of the 2025 Convertible Notes, we entered into privately negotiated capped call transactions with option counterparties. The capped call transactions are expected generally to reduce the potential dilution to our common stock upon any conversion of the notes and/or offset any potential cash payments we are required to make in excess of the principal amount of converted notes, as the case may be, with such reduction and/or offset subject to a cap. In connection with establishing any hedges of the capped call transactions, the option counterparties or their respective affiliates may enter into various derivative transactions with respect to our common stock and/or purchase shares of our common stock. This activity could increase (or reduce the size of any decrease in) the market price of our common stock or the notes at that time. In addition, the option counterparties and/or their respective affiliates may modify their hedge positions by entering into or unwinding various derivatives with respect to our common stock and/or purchasing or selling our common stock or other securities of ours in secondary market transactions prior to the maturity of the notes (and are likely to do so during any observation period related to a conversion of notes). This activity could also cause or avoid an increase or a decrease in the market price of our common stock or the notes, which could affect your ability to convert the notes and, to the extent the activity occurs following conversion or during any observation period related to a conversion of notes, it could affect the amount and value of the consideration that investors will receive upon conversion of the notes.
The effect, if any, of these activities, including the direction or magnitude, on the market price of our common stock will depend on a variety of factors, including market conditions, and cannot be ascertained at this time. Any of these activities could, however, adversely affect the market price of our common stock and the trading price of the convertible notes.
We are subject to counterparty risk with respect to the convertible note hedge transactions.
The option counterparties are financial institutions or affiliates of financial institutions, and we will be subject to the risk that one or more option counterparties may default under the capped call and/or convertible note hedge transactions. Our exposure to the credit risk of the option counterparties will not be secured by any collateral. If any of the option counterparties becomes subject to insolvency proceedings, we will become an unsecured creditor in those proceedings with a claim equal to our exposure at the time under those transactions. Our exposure will depend on many factors but, generally, the increase in our exposure will be correlated to the increase in the market price of our common stock and in the volatility of the market price of our common stock. In addition, upon a default by an option counterparty, we may suffer adverse tax consequences and more dilution than we currently anticipate with respect to our common stock. We can provide no assurances as to the financial stability or viability of any of the option counterparties.
27
We may incur substantially more debt or take other actions that could diminish our ability to make payments on the convertible notes.
We and our subsidiaries may be able to incur substantial additional debt in the future, subject to the restrictions contained in our future debt instruments, some of which may be secured debt. We are not restricted under the terms of the indenture governing the convertible notes from incurring additional debt, securing existing or future debt, recapitalizing our debt or taking a number of other actions that are not limited by the terms of the indentures governing the convertible notes that could have the effect of diminishing our ability to make payments on the convertible notes when due.
Risks Relating to Our Common Stock and the Securities Market
The trading price of shares of our common stock may be affected by many factors and the price of shares of our common stock could decline.
As a publicly traded company, the trading price of our common stock has fluctuated significantly in the past. The future trading price of our common stock may be volatile and could be subject to wide price fluctuations in response to such factors, including:
|
|
• |
actual or anticipated fluctuations in revenues or operating results; |
|
|
• |
the effects of the recent global coronavirus (COVID-19) pandemic; |
|
|
• |
failure to meet securities analysts’ or investors’ expectations of performance; |
|
|
• |
changes in key management personnel; |
|
|
• |
announcements of technological innovations or new products by us or our competitors; |
|
|
• |
developments in or disputes regarding patents and proprietary rights; |
|
|
• |
proposed and completed acquisitions by us or our competitors; |
|
|
• |
the mix of products and services sold; |
|
|
• |
the timing, placement and fulfillment of significant orders; |
|
|
• |
product and service pricing and discounts; |
|
|
• |
acts of war or terrorism; and |
|
|
• |
general economic conditions. |
Our stock price has been highly volatile in the past and could be highly volatile in the future.
The market price of our stock can be highly volatile due to the risks and uncertainties described in this Annual Report, as well as other factors, including substantial volatility in quarterly revenues and earnings due to comments by securities analysts and our failure to meet market expectations.
Over the fiscal year ended February 29, 2020, the price of our common stock as reported on The Nasdaq Global Select Market ranged from a high of $14.69 to a low of $8.99. The stock market has from time to time experienced extreme price and volume fluctuations that were unrelated to the operating performance of particular companies. In the past, companies that have experienced volatility have sometimes subsequently become the subject of securities class action litigation. If litigation were instituted on this basis, it could result in substantial costs and a diversion of management’s attention and resources.
28
Future issuances of shares of our common stock could dilute the ownership interests of our stockholders.
Any issuance of equity securities could dilute the interests of our stockholders and could substantially decrease the trading price of our common stock. We may issue equity securities in the future for a number of reasons, including to finance our operations and business strategy (including in connection with acquisitions, strategic collaborations or other transactions), to adjust our ratio of debt to equity, to satisfy our obligations upon the exercise of outstanding options or for other reasons. In May 2015 and July 2018, we issued the Notes and, to the extent we issue common stock upon conversion of the convertible notes, that conversion would dilute the ownership interests of our stockholders.
Anti-takeover defenses in our charter and under Delaware law could prevent us from being acquired or limit the price that investors might be willing to pay for our common stock in an acquisition.
Section 203 of the Delaware General Corporation Law prohibits a Delaware corporation from engaging in any business combination with any interested stockholder for a period of three years from the time the person became an interested stockholder, unless specific conditions are met. In addition, we have in place various protections which would make it difficult for a company or investor to buy our business without the approval of our Board of Directors, including authorized but undesignated preferred stock and provisions requiring advance notice of board nominations and other actions to be taken at stockholder meetings. All of the foregoing could hinder, delay or prevent a change in control and could limit the price that investors might be willing to pay in the future for shares of our common stock.
Our amended and restated bylaws provide that the Court of Chancery of the State of Delaware and the federal district courts of the United States of America will be the exclusive forums for substantially all disputes between us and our stockholders, which could limit our stockholders’ ability to obtain a favorable judicial forum for disputes with us or our directors, officers, or employees.
Our amended and restated bylaws provide that the Court of Chancery of the State of Delaware is the exclusive forum for:
|
|
• |
any derivative action or proceeding brought on our behalf; |
|
|
• |
any action asserting a claim of breach of a fiduciary duty owed by, or other wrongdoing by, any of our directors, officers, employees or agents to us or our stockholders; |
|
|
• |
any action asserting a claim against us arising pursuant to any provision of the Delaware General Corporation Law, our restated certificate of incorporation, or our amended and restated bylaws; |
|
|
• |
any action to interpret, apply, enforce or determine the validity of our restated certificate of incorporation or our amended and restated bylaws; and |
|
|
• |
any action asserting a claim against us that is governed by the internal affairs doctrine; |
provided, that with respect to any derivative action or proceeding brought on our behalf to enforce any liability or duty created by the Securities Exchange Act of 1934 or the rules and regulations thereunder, the exclusive forum will be the federal district courts of the United States of America. Our restated and amended bylaws further provides that the federal district courts of the United States of America will be the exclusive forum for resolving any complaint asserting a cause of action arising under the Securities Act of 1933, as amended.
These exclusive forum provisions may limit a stockholder’s ability to bring a claim in a judicial forum that it finds favorable for disputes with us or our directors, officers, or other employees, which may discourage lawsuits against us and our directors, officers and other employees.
If securities or industry analysts issue an adverse or misleading opinion regarding our business or publish unfavorable research about our business, our stock price and trading volume could decline.
29
The trading market for our common stock depends in part on the research and reports that industry or securities analysts publish about us or our business. If one or more of the analysts who cover us ceases coverage of our Company or fails to publish reports on us regularly, we could lose visibility in the financial markets, which in turn could cause our stock price or trading volume to decline. Moreover, if any of the analysts who cover us downgrade our stock or issue an adverse or misleading opinion regarding us, our business model or our stock performance, or if our operating results fail to meet the expectations of the investor community, our stock price could decline.
Lack of expected dividends may make our stock less attractive as an investment.
We intend to retain all future earnings for use in the development of our business. We do not anticipate paying any cash dividends on our common stock in the foreseeable future. In certain cases, stocks that pay regular dividends command higher market trading prices, and so our stock price may be lower as a result of our dividend policy.
We may not be able to generate sufficient future taxable income to utilize our net operating loss and tax credit carryforwards. In addition, our ability to utilize our federal net operating loss and tax credit carryforwards may be limited under Sections 382 and 383 of the Internal Revenue Code (the “Code”).
As discussed in Note 13, as of February 29, 2020, we maintained a valuation allowance with respect to certain of our deferred tax assets relating primarily to net operating losses and tax credits in U.S. and certain non-U.S. jurisdictions that we believe are not likely to be realized. We considered positive and negative evidence, including three years of cumulative losses considering forecasts of future profitability as of February 29, 2020, in assessing our ability to realize our domestic net deferred tax assets.
Also, as of February 29, 2020, we had net operating loss carryforwards of approximately $38.9 million and $36.8 million for federal and state tax purposes, respectively. The federal net operating loss (NOL) carryforwards are subject to various limitations under Section 382 of the Internal Revenue Code. The ability to utilize our NOL carryforwards to reduce taxable income in future years could become subject to significant limitations under Section 382 of the Internal Revenue Code if we undergo an ownership change.
The limitations apply if a corporation undergoes an “ownership change,” which is generally defined as a greater than fifty (50) percentage point change (by value) in its equity ownership by stockholders who own directly or indirectly, 5% or more of our common stock, over a three (3)-year period. Future changes in our stock ownership, which may be outside of our control, may trigger an ownership change and, consequently, Section 382 and 383 limitations. Similar provisions of state tax law may also apply to limit our use of accumulated state tax attributes. As a result, if we earn net taxable income, our ability to use our pre-change net operating loss carryforwards and other tax attributes to offset such taxable income may be subject to limitations, which could potentially result in increased future income tax liability to us. We continue to monitor stockholders who own directly or indirectly, 5% or more of our common stock to determine if we have experienced an ownership change pursuant to Section 382.
30
None.
We are headquartered in Irvine, California with operations principally in the U.S., U.K., Italy and Mexico. We conduct engineering as well as research and development activities at our facilities in the United States, while our sales and administrative functions are performed in the U.S., U.K., Italy and Mexico. We periodically evaluate our facility requirements as necessary and believe our existing and planned facilities are sufficient for our needs for at least the next 12 months. All of our properties are leased facilities located in the following areas:
|
|
|
Square |
|
|
|
|
Square |
|
||
|
Location |
|
Footage |
|
|
Location |
|
Footage |
|
||
|
Irvine, California |
|
|
23,000 |
|
|
Mexico City, Mexico |
|
|
15,300 |
|
|
Richardson, Texas |
|
|
31,000 |
|
|
Milan, Italy |
|
|
9,400 |
|
|
Carlsbad, California |
|
|
29,000 |
|
|
Rome, Italy |
|
|
2,200 |
|
|
Indianapolis, Indiana |
|
|
11,000 |
|
|
London, U.K. |
|
|
5,700 |
|
|
Eden Prairie, Minnesota |
|
|
7,000 |
|
|
|
|
|
|
|
|
|
|
|
|
|
|
|
|
|
|
|
We vacated our Canton, Massachusetts facility as part of our plan to capture certain synergies and cost savings related to streamlining our global operations in fiscal 2019. This facility is sublet through December 2025.
From time to time, various claims and litigation may be asserted or commenced against us arising from our ordinary course of business. In particular, we may receive claims concerning contract performance, or claims that our products or services infringe the intellectual property of third parties. Regardless of the outcome, litigation can have an adverse impact on us because of deferred costs, diversion of management resources and other factors. The following contains information regarding potentially material pending litigation.
31
Omega patent infringement claim
As previously disclosed in our Form 10-Q for the third quarter ended November 30, 2019 that was filed with the U.S. Securities and Exchange Commission on December 19, 2019, on May 22, 2017, we filed motions with the court seeking judgment as a matter of law and for a new trial in response to the patent infringement lawsuit filed by Omega Patents, LLC, (“Omega”) that was decided against us in 2016. The court denied our motions on November 14, 2017. We then appealed to the Court of Appeals for the Federal Circuit (the “Federal Circuit”). The appeal was fully briefed, and the court heard oral argument on January 9, 2019. On April 8, 2019, the Federal Circuit vacated the compensatory and enhanced damages and attorney’s fees awarded by the trial court to Omega. The Federal Circuit also set aside the jury’s verdict that our alleged infringement was willful, and remanded the case for a new trial. As a result, substantially all of the previously reserved legal provisions of $19.1 million as of November 30, 2018 were reversed as of February 28, 2019. The reversal was recorded as a reduction of general and administrative expenses in our consolidated statement of comprehensive income for the fiscal year ended February 28, 2019. The new trial began on September 23, 2019 in the U.S. District Court for the Middle District of Florida (“Trial Court”), and on September 30, 2019, the jury determined that the Company infringed two of the four patents; however, the jury found that there was no willful infringement. On the first patent (U.S. Pat. No. 7,671,727), the jury found only one unit infringed, and assessed $1 in damages. On the second patent (U.S. Pat. No. 8,032,278), the jury found direct infringement and awarded damages at a rate of $5 per unit, for total damages of approximately $4.6 million. On November 26, 2019 the Trial Court entered judgment, awarding Omega damages of $4.6 million, together with pre-judgment interest in the amount of $0.8 million through September 30, 2019. We filed motions with the Trial Court seeking judgment as a matter of law (“JMOL”) in our favor and, alternatively, a new trial. On March 20, 2020, the Trial Court denied our motion for JMOL, a new trial, and remittitur of damages. The Trial Court also denied Omega’s motion for a new trial on willfulness. On April 1, 2020, the Trial Court denied Omega’s motion to enhance the royalty rate beyond the jury’s award of $5 per unit. Also, on April 1, 2020, the Trial Court denied Omega’s motion to conduct post-trial discovery on CalAmp’s other OBD-II compliant LMUs. On April 3, 2020, the Trial Court denied Omega’s final motion regarding infringement of the VPODs. On April 30, 2020, we filed a notice of appeal at the Federal Circuit. Also on April 30, 2020, Omega filed notices of cross-appeal at the Federal Circuit.
In connection with this claim, we have accrued our best estimate of the probable liability based on reasonable royalty rates for similar technologies. It is reasonably possible that the judgement and amounts described above could be upheld.
We also initiated ex parte reexamination proceedings filed in the U.S. Patent and Trademark Office seeking to invalidate a number of Omega’s patents involved in the litigation. Those proceedings currently remain pending. We continue to believe that our products do not infringe on any of Omega’s patents. While it is not feasible to predict with certainty the outcome of this litigation, we believe that its ultimate resolution would not have a material adverse effect on our consolidated results of operations, financial condition and cash flows.
For further detail on the matters described above, refer to “Note 19 – Commitments and Contingencies” in the accompanying consolidated financial statements.
Not applicable.
32
|
ITEM 5. |
MARKET FOR REGISTRANT'S COMMON EQUITY, RELATED STOCKHOLDER MATTERS AND ISSUER PURCHASES OF EQUITY SECURITIES |
Our Common Stock trades on the Nasdaq Global Select Market under the ticker symbol CAMP. The following graph and table compare our stock performance to three stock indices over a five-year period assuming $100 investment was made on the last day of fiscal year 2015:
|
Years Ended February 28, |
2015 |
|
2016 |
|
2017 |
|
2018 |
|
2019 |
|
2020 |
|
||||||
|
CalAmp Corp. |
|
100 |
|
|
95 |
|
|
85 |
|
|
122 |
|
|
73 |
|
|
50 |
|
|
Nasdaq Composite Index |
|
100 |
|
|
93 |
|
|
120 |
|
|
152 |
|
|
136 |
|
|
183 |
|
|
Nasdaq Electronic Components |
|
100 |
|
|
86 |
|
|
115 |
|
|
135 |
|
|
134 |
|
|
134 |
|
|
Nasdaq Telecommunications |
|
100 |
|
|
106 |
|
|
118 |
|
|
114 |
|
|
120 |
|
|
132 |
|
At April 30, 2020, we had approximately 1,300 stockholders of record. The number of stockholders of record does not include the number of persons having beneficial ownership held in “street name” which are estimated to approximate 19,000. We have never paid a cash dividend and have no current plans to pay cash dividends on our Common Stock. In addition, our revolving credit facility prohibits payment of dividends without the prior written consent of the lender under certain circumstances.
Securities Authorized for Issuance under Equity Compensation Plans
The information required by this Item will be included in our definitive proxy statement for the Annual Meeting of Stockholders to be held on July 29, 2020 and is incorporated herein by this reference.
33
|
|
|
Year Ended February 29/28, |
|
|||||||||||||||||
|
|
|
2020 |
|
|
2019 |
|
|
2018 |
|
|
2017 |
|
|
2016 |
|
|||||
|
|
|
(In thousands except per share amounts) |
|
|||||||||||||||||
|
OPERATING DATA |
|
|
|
|
|
|
|
|
|
|
|
|
|
|
|
|
|
|
|
|
|
Revenues |
|
$ |
366,107 |
|
|
$ |
363,800 |
|
|
$ |
365,912 |
|
|
$ |
351,102 |
|
|
$ |
280,719 |
|
|
Cost of revenues |
|
|
222,804 |
|
|
|
216,036 |
|
|
|
215,022 |
|
|
|
207,750 |
|
|
|
177,760 |
|
|
Gross profit |
|
|
143,303 |
|
|
|
147,764 |
|
|
|
150,890 |
|
|
|
143,352 |
|
|
|
102,959 |
|
|
Operating expenses: |
|
|
|
|
|
|
|
|
|
|
|
|
|
|
|
|
|
|
|
|
|
Research and development |
|
|
29,436 |
|
|
|
27,656 |
|
|
|
25,761 |
|
|
|
22,005 |
|
|
|
19,803 |
|
|
Selling and marketing |
|
|
60,534 |
|
|
|
49,892 |
|
|
|
50,096 |
|
|
|
49,044 |
|
|
|
23,380 |
|
|
General and administrative |
|
|
57,669 |
|
|
|
31,070 |
|
|
|
52,089 |
|
|
|
57,119 |
|
|
|
25,065 |
|
|
Intangible asset amortization |
|
|
12,321 |
|
|
|
11,436 |
|
|
|
14,989 |
|
|
|
15,061 |
|
|
|
6,626 |
|
|
Impairment loss |
|
|
19,143 |
|
|
|
- |
|
|
|
- |
|
|
|
- |
|
|
|
- |
|
|
Restructuring |
|
|
4,400 |
|
|
|
8,015 |
|
|
|
- |
|
|
|
- |
|
|
|
- |
|
|
Total operating expenses |
|
|
183,503 |
|
|
|
128,069 |
|
|
|
142,935 |
|
|
|
143,229 |
|
|
|
74,874 |
|
|
Operating income (loss) |
|
|
(40,200 |
) |
|
|
19,695 |
|
|
|
7,955 |
|
|
|
123 |
|
|
|
28,085 |
|
|
Non-operating income (expense), net |
|
|
(18,120 |
) |
|
|
4,160 |
|
|
|
20,754 |
|
|
|
(8,306 |
) |
|
|
(5,744 |
) |
|
Income (loss) before income taxes and equity in net loss of affiliate and related impairment loss |
|
|
(58,320 |
) |
|
|
23,855 |
|
|
|
28,709 |
|
|
|
(8,183 |
) |
|
|
22,341 |
|
|
Income tax benefit (provision) |
|
|
(20,454 |
) |
|
|
1,330 |
|
|
|
(10,681 |
) |
|
|
1,563 |
|
|
|
(4,572 |
) |
|
Income (loss) before equity in net loss of affiliate and related impairment loss |
|
|
(78,774 |
) |
|
|
25,185 |
|
|
|
18,028 |
|
|
|
(6,620 |
) |
|
|
17,769 |
|
|
Equity in net loss of affiliate and related impairment loss |
|
|
(530 |
) |
|
|
(6,787 |
) |
|
|
(1,411 |
) |
|
|
(1,284 |
) |
|
|
(829 |
) |
|
Net income (loss) |
|
$ |
(79,304 |
) |
|
$ |
18,398 |
|
|
$ |
16,617 |
|
|
$ |
(7,904 |
) |
|
$ |
16,940 |
|
|
Earnings (loss) per share: |
|
|
|
|
|
|
|
|
|
|
|
|
|
|
|
|
|
|
|
|
|
Basic |
|
$ |
(2.36 |
) |
|
$ |
0.53 |
|
|
$ |
0.47 |
|
|
$ |
(0.22 |
) |
|
$ |
0.46 |
|
|
Diluted |
|
$ |
(2.36 |
) |
|
$ |
0.52 |
|
|
$ |
0.46 |
|
|
$ |
(0.22 |
) |
|
$ |
0.46 |
|
|
|
|
February 29/28, |
|
|||||||||||||||||
|
|
|
2020 |
|
|
2019 |
|
|
2018 |
|
|
2017 |
|
|
2016 |
|
|||||
|
|
|
(In thousands except ratio) |
|
|||||||||||||||||
|
BALANCE SHEET DATA |
|
|
|
|
|
|
|
|
|
|
|
|
|
|
|
|
|
|
|
|
|
Current assets |
|
$ |
237,866 |
|
|
$ |
403,497 |
|
|
$ |
275,885 |
|
|
$ |
206,705 |
|
|
$ |
298,767 |
|
|
Current liabilities |
|
$ |
121,475 |
|
|
$ |
83,592 |
|
|
$ |
95,529 |
|
|
$ |
77,841 |
|
|
$ |
49,565 |
|
|
Working capital |
|
$ |
116,391 |
|
|
$ |
319,905 |
|
|
$ |
180,356 |
|
|
$ |
128,864 |
|
|
$ |
249,202 |
|
|
Current ratio |
|
|
2.0 |
|
|
|
4.8 |
|
|
|
2.9 |
|
|
|
2.7 |
|
|
|
6.0 |
|
|
Total assets |
|
$ |
495,805 |
|
|
$ |
603,626 |
|
|
$ |
472,993 |
|
|
$ |
408,139 |
|
|
$ |
384,363 |
|
|
Long-term debt |
|
$ |
177,088 |
|
|
$ |
275,905 |
|
|
$ |
154,299 |
|
|
$ |
146,827 |
|
|
$ |
139,800 |
|
|
Stockholders' equity |
|
$ |
137,919 |
|
|
$ |
205,653 |
|
|
$ |
198,916 |
|
|
$ |
163,242 |
|
|
$ |
189,447 |
|
Factors affecting the comparability of our Selected Financial Data are as follows:
|
|
• |
During the year ended February 29, 2020, the provision for income taxes reflected a tax expense of $34.6 million primarily related to a valuation allowance recorded during the year on our domestic net deferred tax assets that the Company believes are more likely than not that they will not be realized. See Note 13 to the accompanying consolidated financial statements for additional information on this matter. |
34
|
|
• |
In October and November 2019, we entered into separate, privately negotiated purchase agreements to repurchase approximately $94.9 million in aggregate principal amount of these notes for $94.7 million. The repurchase resulted in $2.4 million of loss on extinguishment of debt See Note 10 to the accompanying consolidated financial statements for additional information on the convertible notes. |
|
|
• |
The new trial for Omega patent infringement claim began on September 23, 2019 in the U.S. District Court for the Middle District of Florida, and on September 30, 2019, the jury determined that the we infringed two of the four patents; however, the jury found that there was no willful infringement. On November 26, 2019 the U.S. District Court for the Middle District of Florida entered judgment, awarding Omega damages of $4.6 million, together with pre-judgment interest in the amount of $0.8 million through September 30, 2019. In connection with this claim, we have accrued our best estimate of the probable liability based on reasonable royalty rates for similar technologies for the fiscal year ended February 29, 2020. See Note 19 to the accompanying consolidated financial statements for additional information on this matter. |
|
|
• |
On April 12, 2019, we acquired Synovia Solutions, a North American market leader in fleet safety and management for K-12 school bus and state and local government fleets, for a total cash purchase of $49.8 million. See Note 2 to the accompanying consolidated financial statements for additional information on this acquisition. |
|
|
• |
On April 8, 2019, the U.S. Court of Appeals for the Federal Circuit (the “Federal Circuit”) vacated all compensatory and enhanced damages and attorney’s fees awarded by the trial court to the plaintiff in the Omega patent infringement lawsuit. The Federal Circuit also set aside the jury’s verdict that our alleged infringement was willful, and remanded the case for a new trial. As a result, we reversed substantially all of the $19.1 million of the previously accrued legal reserve during the fourth quarter of fiscal 2019. The reversal of the loss contingency was recorded in general and administrative expense for the fiscal year ended February 28, 2019. See Note 19 to the accompanying consolidated financial statements for additional information on this matter. |
|
|
• |
On March 19, 2019, we completed the acquisition of LoJack Mexico, the exclusive licensee of LoJack technology for the Mexican market, for a purchase price of $14.3 million. See Note 2 to the accompanying consolidated financial statements for additional information on this acquisition. |
|
|
• |
As of February 28, 2019, we had made loans aggregating £5,700,000, or approximately $7.6 million to Smart Driver Club, an equity method investee, which bear interest at an annual interest rate of 8% with all principal and all unpaid interest due in 2021. Our equity in the net loss of Smart Driver Club amounted $1.8 million, $1.4 million and $1.3 million for the fiscal years ended February 28, 2019, 2018 and 2017. As of February 28, 2019, we determined that this investment is subject to other than temporary impairment of $5.0 million, which is reported as part of impairment loss and equity in net loss of affiliate in our consolidated statement of comprehensive income. See Note 9 to the accompanying consolidated financial statements for additional information on this impairment. |
|
|
• |
On February 25, 2019, we completed the acquisition of Tracker Network (UK) Limited, a LoJack licensee and a market leader in SVR telematics services across the U.K., for a cash purchase price of £10.0 million, or approximately $13.0 million. See Note 2 to the accompanying consolidated financial statements for additional information on this acquisition. |
|
|
• |
On July 20, 2018, we issued $230.0 million aggregate principal amount of 2.00% convertible senior unsecured notes through a private placement. See Note 10 to the accompanying consolidated financial statements for additional information on the convertible notes. |
35
|
|
• |
Effective December 22, 2017, the U.S. enacted tax reform legislation that included a broad range of changes impacting the corporate income tax provision, including the reduction of the U.S. federal statutory corporate tax rate from 35% to 21%. In the fourth quarter of fiscal 2018, we recognized an income tax charge of $6.6 million for the re-measurement of our deferred tax assets and liabilities based on the rates at which they are expected to reverse in the future. We completed our accounting for the income tax effects of the Tax Act in 2018, and no material adjustments were required to the provisional amounts initially recorded on our existing deferred tax balances and the one-time transition tax. |
|
|
• |
In fiscal 2018, we entered into a settlement agreement with a former LoJack supplier for $46.6 million, which amount is net of attorneys’ fees and insurance subrogation payment. We received $18.3 million and $28.3 million in fiscal 2019 and 2018, respectively, which are reported as other non-operating income in our consolidated statement of comprehensive income. |
|
|
• |
In fiscal 2017, we acquired LoJack Corporation. |
|
|
• |
We ceased operation of our legacy Satellite segment effective August 31, 2016. Between September 1, 2016 and August 31, 2017, our business operated under one reportable segment – Wireless DataCom. See Note 20 to the accompanying financial statements for additional information on the business segments. |
|
|
• |
In fiscal 2016, we issued $172.5 million aggregate principal amount of 1.625% convertible senior unsecured notes through a private placement. See Note 10 to the accompanying consolidated financial statements for additional information on the convertible notes. |
|
|
• |
In fiscal 2016, we reduced our deferred tax assets valuation allowance by $2.5 million and recognized federal research and development tax credits of $1.0 million, which lowered our effective tax rate to 20.5% for the year. |
36
Overview
CalAmp Corp. (including its subsidiaries unless the context otherwise requires, “CalAmp”, “the Company”, “we”, “our”, or “us”) is a global technology solutions pioneer leading transformation to a mobile connected economy. We help reinvent businesses and improve lives around the globe with technology solutions that streamline complex mobile Internet of Things (“IoT”) deployments through wireless connectivity solutions and derived data intelligence. Our software applications, scalable cloud services, and intelligent devices collect and assess business-critical data anywhere in the world from industrial machines, commercial and passenger vehicles, their drivers and contents. With our global network of LoJack licensees and a strong ecosystem of industry partnerships, we bring intelligence to the edge in the mobile connected economy to help drive business efficiencies.
In February 2019, we acquired Tracker Network (UK) Limited, which brings us strong brand awareness across the United Kingdom and extensive law enforcement relationships with an ability to help drive our expansion in Europe. In March 2019, we acquired Car Track, S.A. de C.V. (“LoJack Mexico”), which will leverage our full stack of telematics and SaaS solutions to expand product offerings to our substantial subscriber base in Mexico. Both Tracker UK and LoJack Mexico were customers in our Telematics Systems segment prior to the acquisition.
In April 2019, we acquired Synovia Solutions (“Synovia”), a North American market leader in fleet safety and management for K-12 school bus and state and local government fleets. Synovia was a customer in our Telematics Systems segment prior to our acquisition. Combined with the recent acquisitions of Tracker Network UK and LoJack Mexico, the Synovia acquisition expands our fleet management and vehicle safety services portfolio while accelerating our transformation to high-value subscription-based services. These acquisitions contributed to a shift in revenues from our Telematics Systems segment to our Software & Subscriptions segment during fiscal 2020.
We operate under two reportable segments: Telematics Systems and Software & Subscription Services.
Telematics Systems
Our Telematics Systems segment offers a series of advanced telematics and stolen vehicle recovery (“SVR”) products for the broader connected vehicle and emerging industrial IoT marketplace, which enable customers to optimize their operations by collecting, monitoring and effectively reporting business-critical information and desired intelligence from high-value remote and mobile assets. Our telematics products include asset tracking units, mobile telematics devices, fixed and mobile wireless gateways, and routers. These wireless networking devices underpin a wide range of solutions, and are ideal for applications demanding secure, reliable and business-critical communications. Products and sales channels include Original Equipment Manufacturers (“OEM”), Mobile Resource Management (“MRM”) and SVR products.
Software & Subscription Services
Our Software & Subscription Services segment offers cloud-based application enablement and telematics service platforms that facilitate integration of our own applications, as well as those of third parties, through open Application Programming Interfaces (“APIs”) to deliver full-featured mobile IoT solutions to a wide range of customers and markets. Our scalable proprietary applications and other subscription services enable rapid and cost-effective development of high-value solutions for customers all around the globe. Services include Fleet Management, Vehicle Finance, Auto Remote Start, Supply Chain Integrity and International Vehicle Location.
Recent Developments
In December 2019, a strain of coronavirus entitled COVID-19 emerged in China and spread to other countries including to the United States. In March 2020, the World Health Organization declared COVID-19 to be a public health pandemic of international concern, which has resulted in travel restrictions and in some cases, prohibitions of non-essential activities, disruption and shutdown of businesses and greater uncertainty in global financial markets.
37
In the United States and other geographies in which we and our customers, partners and service providers operate, the health concerns as well as political or governmental developments in response to COVID-19 could result in economic, social or labor instability or prolonged contractions in certain end markets which could slow the sales process, result in customers not purchasing or renewing on contracts or failing to make payments. These events could have a material adverse effect on the business and results of operations and financial condition.
At this time, it is difficult to predict the extent to which the COVID-19 outbreak will impact our business or operating results, which is highly dependent on uncertain future developments, including the severity of the pandemic and the actions taken or to be taken by governments and private businesses in relation to its containment. Because our business is dependent on telematics product sales, device installations and related subscription-based services, the effect of the outbreak may not be fully reflected in our operating results until future periods.
We have adopted several measures in response to the COVID-19 outbreak, including instructing employees to work from home, implementing certain cost and cash flow control measures to address potential declines in billings and cash collections from customers, shifting the manner in which we engage with customers and restricting non-critical business travel by our employees. As a result of the work and travel restrictions, substantially all of our sales and installation services activities are being conducted or managed remotely.
Results of Operations and Financial Condition
Revenues
Our revenue streams are described as follows:
Products. Our products revenues consist primarily of sales of our telematics products or wireless networking devices to large global companies as well as small and medium-sized enterprises in the United States and internationally. Revenues from our products are reported net of sales returns and allowances, and incentives. The prices charged for telematics products are determined through negotiation with our customers as well as prevailing market conditions and are fixed and determinable upon shipment. The revenues are included in our Telematics Systems segment.
Software-as-a-Service (“SaaS”) and Platform-as-a-Service (“PaaS”). Our SaaS-based and PaaS-based solutions for our fleet management, vehicle finance and certain other verticals provide our customers with the ability to wirelessly communicate with monitoring devices installed in vehicles and other mobile or remote assets via our software applications. For our fleet management, vehicle finance and certain other customers, we sell or lease highly customized devices that only function with our proprietary SaaS technology. We consider the service and devices as a single performance obligation. Generally, we defer the recognition of revenue for the devices that are sold with application subscriptions. The deferred product revenue amounts are amortized on a straight-line basis over the estimated average in-service lives of these devices, which are three years in the vehicle finance vertical and generally four to five years in the fleet management vertical. Revenues from subscription services are recognized ratably, on a straight-line basis, over the term of the subscription.
We also sell vehicle location monitoring solutions internationally. These solutions generally consist of the sale of a vehicle location unit (“VLU”) together with our related monitoring services. Because we sell similar VLUs on a stand-alone basis from time to time, we recognize revenue up front for the sale of the device and over time for the monitoring services.
These revenues are included in our Software & Services Segment.
Professional Services. Our professional services provided to customers include project management, engineering services, installation services and an on-going early warning automated notification service. Revenues are typically distinct from other performance obligations and are recognized as the related services are performed.
38
Our cost of revenues for telematics and SVR products represent the cost of finished goods sold to our customers and are recognized at the point in time control passes to the customer. These costs include raw materials, manufacturing overhead and labor costs, as well as customs and duties, license royalties, recycling fees, insurance and other costs that are included in the price that we negotiate and pay to our contract manufacturers and component suppliers for the products. The cost of revenues also includes charges related to excess and obsolete inventories and the cost of fulfilling product warranties.
Our cost of revenues for application subscriptions and other services includes personnel costs and related benefits, consultants, software development activities, cellular network access costs, infrastructure costs for use of private networking services, and other costs that are required to deliver these services to our customers. Our cost of revenues for application subscriptions and other services also includes cost of customized devices that only function with our applications and are sold on an integrated basis with applicable subscriptions. These costs are capitalized and are recognized ratably, on a straight-line basis, over the estimated average in-service lives of these devices. The estimated average in-service lives are three years in the vehicle finances and generally four to five years in the fleet management verticals. We recognize cost of revenues for VLUs concurrently with the sale of the VLU and over the subscription period for the related monitoring services.
We continually negotiate to reduce the cost we pay to our suppliers in order to maintain consistent low prices for our customers. We accomplish this by working with our suppliers to find alternative, less expensive sources of raw materials and components as well as eliminating excess costs throughout our supply chain.
Gross Profit
Our gross profit and gross profit as a percentage of revenues, or gross margin, is influenced by several factors including sales volume, product and service mix, and excess and obsolescence (“E&O”) charges and other product costs. We expect gross margin to fluctuate over time based on how we control the mix of product and services and manage our inventory using sales incentives granted to our customers. Additionally, although we primarily procure and sell our products in U.S. dollars, we are susceptible to exchange rate fluctuations with other currencies. To the extent that exchange rates move unfavorably this may have an impact on our future selling prices and unit costs. Gross profit and gross margin may fluctuate over time based on the factors described above.
Operating Expenses
Our operating expenses consist principally of personnel related costs, including salaries and bonuses, fringe benefits and stock-based compensation as well as the cost of professional services, information technology, facilities and other administrative expenses. We classify our operating expenses into the following six categories:
|
|
• |
Research and development expense consists of personnel related costs, professional services, certification fees and software licenses incurred to support our existing install-base of telematics devices through our field application engineers, software developers, program and product managers, as well as our effort to develop new products and technologies. |
|
|
• |
Selling and marketing expense consists of personnel related costs including our incentive programs to support our global sales organization as well as advertising and marketing promotions of our brand and products, including media advertisement costs, merchandising and display costs, trade show and event costs, and sponsorship costs. |
|
|
• |
General and administrative expense consists of personnel related costs to support our global enterprise as well as outside services for legal, accounting, insurance, information technology, investor relations and other costs associated with being a public company. |
|
|
• |
Intangible asset amortization is attributable to our acquired identifiable intangible assets from business combinations. Our acquired intangible assets with definite lives are amortized from the date of acquisition over periods ranging from two to ten years. |
|
|
• |
Restructuring expense consists of personnel and facility related costs resulting from our cost savings initiative commenced in the fiscal 2019. Personnel costs represent severance and employee related costs, and facility charges represent expenses for vacant office and manufacturing facility space under Corporate Expenses. |
39
We expect our operating costs will increase in absolute dollars due to the anticipated growth of our business and related infrastructure as well as expansion into new geographic regions. Operating expense may fluctuate as a percentage of revenue throughout the year due to discrete quarterly events and seasonal trends.
Non-Operating Income (Expense)
Non-operating income (expense) consists of (i) investment and interest income earned on our cash balances and investments, (ii) interest expense on our convertible senior unsecured notes including the amortization of note discount and debt issue costs, (iii) the gain on a legal settlement, (iv) the loss from extinguishment of debt and (v) other income (expense) that includes but is not limited to transaction gains and losses and foreign currency gains and losses. We recognized the gain on legal settlement on a cash basis due to the lack of certainty of collection as we received the settlement payments from a former LoJack supplier, which is further explained in “Note 19 – Commitments and Contingencies” to the accompanying consolidated financial statements. Loss from extinguishment of debt is further explained in “Note 10 – Financing Arrangements” to the accompanying consolidated financial statements.
Income Tax Expense (Benefit)
We are subject to income taxes in the U.S. and related states as well as foreign jurisdictions in which we do business. These foreign jurisdictions have different statutory tax rates than the U.S., in addition to certain of our foreign earnings may also be taxable in the U.S. Accordingly, our effective tax rate will vary from the U.S. statutory income tax due to state income taxes, the amount of income allocable to each tax jurisdiction, tax credits, and changes in valuation allowances which are provided against net deferred tax assets when it is determined that it is more likely than not that the assets will not be realized.
Equity in Net Loss of Affiliate and related Impairment Loss
We had an investment in a technology and insurance startup company called Smart Driver Club Limited, which represented a minority ownership interest that was accounted for under the equity method of accounting. As a result, we recorded our portion of the losses incurred by this entity and impairment charges related to this investment as equity in net loss of affiliate.
Adjusted EBITDA
In addition to our U.S. GAAP results, we present Adjusted EBITDA as a supplemental non-GAAP measure of our performance. Our CEO, the CODM, uses Adjusted EBITDA to evaluate and monitor segment performance. A non-GAAP financial measure is defined as a numerical measure of a company’s financial performance that excludes or includes amounts to be different than the most directly comparable measure calculated and presented in accordance with generally accepted accounting principles in the statements of comprehensive income (loss), balance sheets or statements of cash flows. We define Adjusted EBITDA as Earnings Before Investment Income, Interest Expenses, Taxes, Depreciation, Amortization, stock-based compensation, acquisition and integration expenses, non-cash costs and expenses arising from purchase accounting adjustments, litigation provision, gain from legal settlement, impairment loss and certain other adjustments. We believe this non-GAAP financial information provides additional insight into our ongoing performance and have therefore chosen to provide this information to investors for a more consistent basis of comparison to help investors evaluate our results of ongoing operations and enable more meaningful period-to-period comparisons. Pursuant to the rule and regulations of the U.S. Securities and Exchange Commission regarding the use of non-GAAP financial measures, we have provided a reconciliation of non-GAAP financial measures to the most directly comparable financial measure. See Note 20 to the accompanying consolidated financial statements for additional information related to Adjusted EBITDA by reportable segments and reconciliation to net income (loss).
40
The following table sets forth the percentage of revenues represented by items included in our consolidated statements of income for the three most recent fiscal years:
|
|
|
Year Ended February 29/28, |
|
|||||||||
|
|
|
2020 |
|
|
2019 |
|
|
2018 |
|
|||
|
Revenues |
|
|
100.0 |
% |
|
|
100.0 |
% |
|
|
100.0 |
% |
|
Cost of revenues |
|
|
60.9 |
|
|
|
59.4 |
|
|
|
58.8 |
|
|
Gross profit |
|
|
39.1 |
|
|
|
40.6 |
|
|
|
41.2 |
|
|
Operating expenses: |
|
|
|
|
|
|
|
|
|
|
|
|
|
Research and development |
|
|
8.0 |
|
|
|
7.6 |
|
|
|
7.0 |
|
|
Selling and marketing |
|
|
16.5 |
|
|
|
13.7 |
|
|
|
13.7 |
|
|
General and administrative |
|
|
15.8 |
|
|
|
8.5 |
|
|
|
14.2 |
|
|
Intangible asset amortization |
|
|
3.4 |
|
|
|
3.1 |
|
|
|
4.1 |
|
|
Impairment loss |
|
|
5.2 |
|
|
|
- |
|
|
|
- |
|
|
Restructuring |
|
|
1.2 |
|
|
|
2.2 |
|
|
|
- |
|
|
Operating income (loss) |
|
|
(11.0 |
) |
|
|
5.5 |
|
|
|
2.2 |
|
|
Non-operating income (expense), net |
|
|
(4.9 |
) |
|
|
1.1 |
|
|
|
5.7 |
|
|
Income (loss) before income taxes and equity in net loss of affiliate and related impairment loss |
|
|
(15.9 |
) |
|
|
6.6 |
|
|
|
7.9 |
|
|
Income tax benefit (provision) |
|
|
(5.6 |
) |
|
|
0.4 |
|
|
|
(2.9 |
) |
|
Income (loss) before equity in net loss of affiliate and related impairment loss |
|
|
(21.5 |
) |
|
|
7.0 |
|
|
|
5.0 |
|
|
Equity in net loss of affiliate and related impairment loss |
|
|
(0.1 |
) |
|
|
(1.9 |
) |
|
|
(0.4 |
) |
|
Net income (loss) |
|
|
(21.6 |
) |
|
|
5.1 |
|
|
|
4.6 |
|
Fiscal year ended February 29, 2020 compared to fiscal year ended February 28, 2019:
Revenue by Segment
|
|
Fiscal years ended February 29/28, |
|
|
|
|
|
|
|
|
|
||||||||||||||
|
|
2020 |
|
|
|
2019 |
|
|
|
|
|
|
|
|
|
||||||||||
|
(In thousands) |
$ |
|
|
% of Revenue |
|
|
|
$ |
|
|
% of Revenue |
|
|
$ Change |
|
|
% Change |
|
||||||
|
Segment |
|
|
|
|
|
|
|
|
|
|
|
|
|
|
|
|
|
|
|
|
|
|
|
|
|
Telematics Systems |
$ |
241,212 |
|
|
|
65.9 |
% |
|
|
$ |
287,370 |
|
|
|
79.0 |
% |
|
$ |
(46,158 |
) |
|
|
(16.1 |
%) |
|
Software & Subscription Services |
|
124,895 |
|
|
|
34.1 |
% |
|
|
|
76,430 |
|
|
|
21.0 |
% |
|
|
48,465 |
|
|
|
63.4 |
% |
|
Total |
$ |
366,107 |
|
|
|
100.0 |
% |
|
|
$ |
363,800 |
|
|
|
100.0 |
% |
|
$ |
2,307 |
|
|
|
0.6 |
% |
41
Telematics Systems revenue, comprised of MRM telematics, OEM/network products and legacy LoJack SVR products, decreased by $46.2 million or 16.1% for the fiscal year ended February 29, 2020 compared to the same period last year. Factors affecting the decrease are as follows:
|
|
• |
MRM telematics products revenue decreased $25.0 million due to a reduction in sales volume to a few larger customers, including Synovia that we acquired, during the year coupled with significant supply shortages and softer than expected demand experienced in the fourth quarter. The supply shortages were primarily attributable to our one remaining Chinese supplier, the production capacity of which was significantly impaired in February due to the COVID-19 outbreak. We also experienced other supply shortages due to supply chain transitions, coupled with extended lead times on raw materials and components sourced from China, but used elsewhere in our global supply chain; |
|
|
• |
OEM/network products revenue decreased $11.4 million due to a reduction in sales to our largest OEM/network products customer which is in the middle of a product line transition with the rollout of a 3G-to-4G LTE retrofit program. We expect this decline to be temporary and to be offset by incremental product demands as the 3G network sunset becomes more imminent; and |
|
|
• |
Legacy LoJack SVR revenue decreased $9.7 million due to a technology transition from proprietary radio frequency technology to GPS-based telematics solutions. We expect this decline to continue but to be partially offset over time by revenues growth in our telematics solutions, such as SureDrive and LotSmart within our Software & Subscription Services segment. |
Software & Subscription Services revenue, comprised principally of fleet management services and LoJack subscription services, increased by $48.5 million or 63.4% for the fiscal year ended February 29, 2020 compared to the same period last year. The increase was due to the three recent acquisitions of Tracker UK, LoJack Mexico and Synovia, coupled with growth in LoJack Italy.
Gross Profit by Segment
|
|
Fiscal years ended February 29/28, |
|
|
|
|
|
|
|
|
|
||||||||||||||
|
|
2020 |
|
|
|
2019 |
|
|
|
|
|
|
|
|
|
||||||||||
|
(In thousands) |
$ |
|
|
% of Revenue |
|
|
|
$ |
|
|
% of Revenue |
|
|
$ Change |
|
|
% Change |
|
||||||
|
Segment |
|
|
|
|
|
|
|
|
|
|
|
|
|
|
|
|
|
|
|
|
|
|
|
|
|
Telematics Systems |
$ |
86,558 |
|
|
|
35.9 |
% |
|
|
$ |
110,542 |
|
|
|
38.5 |
% |
|
$ |
(23,984 |
) |
|
|
(21.7 |
%) |
|
Software & Subscription Services |
|
56,745 |
|
|
|
45.4 |
% |
|
|
|
37,222 |
|
|
|
48.7 |
% |
|
|
19,523 |
|
|
|
52.5 |
% |
|
Gross profit |
$ |
143,303 |
|
|
|
39.1 |
% |
|
|
$ |
147,764 |
|
|
|
40.6 |
% |
|
$ |
(4,461 |
) |
|
|
(3.0 |
%) |
Consolidated gross profit for the fiscal year ended February 29, 2020 decreased by $4.5 million or 3.0% over the prior year due to lower revenue in our Telematics Systems business and partially offset by continued growth in Software & Subscription Services.
Consolidated gross margin decreased by 150 basis points comparing to the same period in last year. Gross margin for Telematics Systems decreased to 35.9% for fiscal 2020 compared to 38.5% in fiscal 2019. Gross margin was impacted principally by product mix, incremental charges for excess and obsolete inventory and unfavorable manufacturing variances as we proceeded with the closure of our manufacturing facility in Oxnard, California which was substantially completed in March 2020. Gross margin for Software & Subscription Services was 45.4% in fiscal 2020 compared to 48.7% in fiscal 2019. The decrease was primarily driven by the recently acquired businesses as the gross profit was impacted by purchase price adjustments to deferred revenue.
Cost of revenues above excludes restructuring related costs, which are shown separately in the operating expenses in our consolidated statement of comprehensive income (loss).
42
|
|
Fiscal years ended February 29/28, |
|
|
|
|
|
|
|
|
|
||||||||||||||
|
|
2020 |
|
|
|
2019 |
|
|
|
|
|
|
|
|
|
||||||||||
|
(In thousands) |
$ |
|
|
% of Revenue |
|
|
|
$ |
|
|
% of Revenue |
|
|
$ Change |
|
|
% Change |
|
||||||
|
Research and development |
$ |
29,436 |
|
|
|
8.0 |
% |
|
|
$ |
27,656 |
|
|
|
7.6 |
% |
|
$ |
1,780 |
|
|
|
6.4 |
% |
|
Selling and marketing |
|
60,534 |
|
|
|
16.5 |
% |
|
|
|
49,892 |
|
|
|
13.7 |
% |
|
|
10,642 |
|
|
|
21.3 |
% |
|
General and administrative |
|
57,669 |
|
|
|
15.8 |
% |
|
|
|
31,070 |
|
|
|
8.5 |
% |
|
|
26,599 |
|
|
|
85.6 |
% |
|
Intangible asset amortization |
|
12,321 |
|
|
|
3.4 |
% |
|
|
|
11,436 |
|
|
|
3.1 |
% |
|
|
885 |
|
|
|
7.7 |
% |
|
Impairment loss |
|
19,143 |
|
|
|
5.2 |
% |
|
|
|
- |
|
|
|
0.0 |
% |
|
|
19,143 |
|
|
|
100.0 |
% |
|
Restructuring |
|
4,400 |
|
|
|
1.2 |
% |
|
|
|
8,015 |
|
|
|
2.2 |
% |
|
|
(3,615 |
) |
|
|
(45.1 |
%) |
|
Total |
$ |
183,503 |
|
|
|
50.1 |
% |
|
|
$ |
128,069 |
|
|
|
35.1 |
% |
|
$ |
55,434 |
|
|
|
43.3 |
% |
Consolidated research and development expense increased by $1.8 million or 6.4% for the fiscal year ended February 29, 2020 compared to the same period last year. The increase was primarily driven by increased employee compensation and benefits due to increased headcount. Consolidated research and development expense as a percentage of revenues increased to 8.0% for the fiscal year ended February 29, 2020 compared to 7.6% in the same period last year. We are investing in research and development of new products and technologies to be sold through the U.S. and international sales channels.
Consolidated selling and marketing expense increased by $10.6 million or 21.3% for the fiscal year ended February 29, 2020 compared to the prior year. The increase was primarily driven by additional compensation expenses related to an increase in headcount due to the acquired businesses.
Consolidated general and administrative expense increased by $26.6 million or 85.6% for the fiscal year ended February 29, 2020 compared to the same period last year. The increase was primarily driven by the reduction of $17.6 million in a legal reserve in the prior year (see Note 19 in the accompanying financial statements) and decreases in professional fees related to certain non-recurring legal matters. In fiscal 2020, we incurred additional compensation expenses related to an increase in headcount due to acquired businesses coupled with increased professional services and service fees related to a new cloud-based ERP system that we are implementing to support the growth in our global operations. Certain implementation costs on the new ERP system were capitalized as Property and Equipment in our consolidated balance sheets.
Amortization of intangibles increased by $0.9 million or 7.7% for the fiscal year ended February 29, 2020 compared to the same period last year due the addition of intangible assets from the acquisitions and partially offset by reduced amortization due to the asset impairment.
In the fourth quarter of fiscal 2020, we determined that the prolonged secular decline in revenues from our legacy LoJack US SVR products coupled with the slower than anticipated market penetration of our telematics solutions in the U.S. automotive dealership channel represented determinate indications of impairment. These factors were further exacerbated by the immediate unfavorable impact that the COVID-19 pandemic has had on the automotive end markets commencing in February 2020. As a result, we initiated an assessment of the carrying amount of goodwill and long-lived assets supporting these products including the LoJack tradename and US dealer relationships. The total impairment loss we recorded for fiscal 2020 was $19.1 million, which was primarily attributable to partial write-offs of intangible assets for LoJack tradenames and dealer relationships associated with LoJack products and services, right-of-use assets for tower infrastructure leases resulting from early terminations and property and equipment associated with the early terminated tower leases (see Note 1 in the accompanying financial statements). Impairment losses are shown in the operating expenses in our consolidated statement of comprehensive income (loss). There was no impairment of goodwill for fiscal 2020 and fiscal 2019. The fair value of the LoJack US SVR reporting unit exceeds its carrying amount by approximately 8% as of February 29, 2020. Any deterioration in future cash flows may result in impairment of goodwill. Additionally, any reduction in the revenue forecast utilized for the impairment test of the LoJack tradename may result in additional impairment. Our stock price has declined subsequent to year-end because of COVID-19 and other market factors. We will evaluate if this decline is more than temporary as an impairment indicator for assessing the carrying amount of our goodwill and long-lived assets in future periods.
43
As described in Note 11 to the accompanying consolidated financial statements, during fiscal 2019, we commenced a plan to capture certain synergies and cost savings related to streamlining our global operations and sales organization as well as rationalize certain leased properties that are partially vacant. We incurred additional charges for this initiative during fiscal 2020. For the fiscal year ended February 29, 2020, we recorded approximately of $2.5 million in severance and employee related costs and $1.9 million for facilities. For the fiscal year ended February 28, 2019, total restructuring charges were $8.0 million, comprised of $4.3 million in severance and employee related costs, and $3.7 million for vacant office and manufacturing facility space. Restructuring costs are shown separately in the operating expenses in our consolidated statement of comprehensive income (loss).
Non-operating Income (Expense), Net
Investment income decreased by $0.8 million to $4.5 million for the fiscal year ended February 29, 2020 from $5.3 million for the prior year. The decrease was due primarily to a decrease in interest income resulting from decreased investments in various cash equivalent and short-term marketable securities.
Interest expense increased $3.4 million to $20.1 million for the fiscal year ended February 29, 2020 from $16.7 million for the prior year due to additional interest expense and debt discount and issue costs relating to the 2025 Convertible Notes issued in July 2018 that are being amortized on the effective interest method and amortization of the discount of Due to Factors debt related to our acquisition of Synovia.
See Note 10 to the accompanying consolidated financial statements for information on the $2.4 million and $2.0 million loss on extinguishment of debt for the fiscal years ended February 29, 2020 and February 28, 2019, respectively.
Other non-operating expense for the fiscal year ended February 29, 2020 decreased $0.6 million from the prior year due to favorable fluctuations in foreign currency exchange rates, primarily Euros to U.S. dollars.
Income Tax Expense (Benefit)
An income tax expense of $20.5 million was recorded in fiscal 2020, compared to an income tax benefit of $1.3 million in fiscal 2019. The increase in the income tax expense compared to the prior year was primarily driven by the recording of a valuation allowances against domestic net deferred tax assets in the amount of $34.6 million. See Note 13 to the accompanying consolidated financial statements for additional information.
Profitability Measures
Net Income (Loss):
Our net loss in the fiscal year ended February 29, 2020 was $79.3 million as compared to net income of $18.4 million in the same period last year. The decrease is due to a decrease in gross profit of $4.5 million, an increase in operating expenses of $55.4 million, and an increase in income tax provision of $21.8 million as described above.
Adjusted EBITDA:
|
|
Fiscal years ended February 29/28, |
|
|
|
|
|
||||||||||
|
(In thousands) |
2020 |
|
|
2019 |
|
|
|
$ Change |
|
|
% Change |
|
||||
|
Segment |
|
|
|
|
|
|
|
|
|
|
|
|
|
|
|
|
|
Telematics Systems |
$ |
19,682 |
|
|
$ |
40,821 |
|
|
|
$ |
(21,139 |
) |
|
|
-52 |
% |
|
Software & Subscription Services |
|
21,747 |
|
|
|
13,093 |
|
|
|
|
8,654 |
|
|
|
66 |
% |
|
Corporate Expense |
|
(4,528 |
) |
|
|
(5,699 |
) |
|
|
|
1,171 |
|
|
|
-21 |
% |
|
Total Adjusted EBITDA |
$ |
36,901 |
|
|
$ |
48,215 |
|
|
|
$ |
(11,314 |
) |
|
|
-23 |
% |
44
Adjusted EBITDA for Telematics Systems in the fiscal year ended February 29, 2020 decreased $21.1 million compared to the same period last year due to lower revenues as described above coupled with higher operating expenses as a result of increased headcount and outsourced professional service fees. Adjusted EBITDA for Software and Subscription Services increased $8.7 million compared to the same period last year due primarily to growth in revenues and gross profit from our Italia market and three acquired businesses.
See Note 20 for reconciliation of Adjusted EBITDA by reportable segments and a reconciliation to GAAP-basis net income (loss).
Fiscal year ended February 28, 2019 compared to fiscal year ended February 28, 2018:
Revenue by Segment
|
|
Fiscal years ended February 28, |
|
|
|
|
|
|
|
|
|
||||||||||||||
|
|
2019 |
|
|
|
2018 |
|
|
|
|
|
|
|
|
|
||||||||||
|
(In thousands) |
$ |
|
|
% of Revenue |
|
|
|
$ |
|
|
% of Revenue |
|
|
$ Change |
|
|
% Change |
|
||||||
|
Segment |
|
|
|
|
|
|
|
|
|
|
|
|
|
|
|
|
|
|
|
|
|
|
|
|
|
Telematics Systems |
$ |
287,370 |
|
|
|
79 |
% |
|
|
$ |
302,126 |
|
|
|
83 |
% |
|
$ |
(14,756 |
) |
|
|
(5 |
%) |
|
Software & Subscription Services |
|
76,430 |
|
|
|
21 |
% |
|
|
|
63,786 |
|
|
|
17 |
% |
|
|
12,644 |
|
|
|
20 |
% |
|
Total |
$ |
363,800 |
|
|
|
100 |
% |
|
|
$ |
365,912 |
|
|
|
100 |
% |
|
$ |
(2,112 |
) |
|
|
(1 |
%) |
Telematics Systems revenue decreased by $14.8 million or 4.9% for the fiscal year ended February 28, 2019 compared to the prior year. The decrease was primarily attributed to reduced sales of our MRM telematics and legacy LoJack SVR products and partially offset by increase in customer demand for OEM products. During fiscal 2019, we initiated our supply chain diversification program to transition our manufacturing to tier one global contract manufacturers with facilities outside of China. In connection with this program, we experienced various operational challenges and extended lead times on certain components thereby impacting our ability to delivery on customer orders for MRM telematics products. Additionally, our legacy LoJack SVR revenue continued its secular decline due to a technology transition from proprietary radio frequency technology to GPS-based telematics solutions. OEM products sales increased due to more favorable conditions in the heavy equipment markets.
Software & Subscription Services revenue increased by $12.6 million or 19.8% for the fiscal year ended February 28, 2019 compared to the same period last year. The increase was due to growth driven by our fleet management and LoJack subscription services
Gross Profit by Segment
|
|
Fiscal years ended February 28, |
|
|
|
|
|
|
|
|
|
||||||||||||||
|
|
2019 |
|
|
|
2018 |
|
|
|
|
|
|
|
|
|
||||||||||
|
(In thousands) |
$ |
|
|
% of Revenue |
|
|
|
$ |
|
|
% of Revenue |
|
|
$ Change |
|
|
% Change |
|
||||||
|
Segment |
|
|
|
|
|
|
|
|
|
|
|
|
|
|
|
|
|
|
|
|
|
|
|
|
|
Telematics Systems |
$ |
110,542 |
|
|
|
38.5 |
% |
|
|
$ |
120,774 |
|
|
|
40.0 |
% |
|
$ |
(10,232 |
) |
|
|
(8.5 |
%) |
|
Software & Subscription Services |
|
37,222 |
|
|
|
48.7 |
% |
|
|
|
30,116 |
|
|
|
47.2 |
% |
|
|
7,106 |
|
|
|
23.6 |
% |
|
Gross profit |
$ |
147,764 |
|
|
|
40.6 |
% |
|
|
$ |
150,890 |
|
|
|
41.2 |
% |
|
$ |
(3,126 |
) |
|
|
(2.1 |
%) |
Consolidated gross profit for the fiscal year ended February 28, 2019 decreased by $3.1 million or 2.1% over the prior year due to lower revenue in our Telematics Systems business. Gross profit in fiscal year 2019 was adversely impacted by higher excess and obsolete inventory charges as we transition suppliers and contract manufacturers, and manage the closure of our manufacturing facilities. Cost of revenues above excludes restructuring related costs, which are shown separately in the operating expenses in our consolidation statement of comprehensive income (loss).
45
|
|
Fiscal years ended February 28, |
|
|
|
|
|
|
|
|
|
||||||||||||||
|
|
2019 |
|
|
|
2018 |
|
|
|
|
|
|
|
|
|
||||||||||
|
(In thousands) |
$ |
|
|
% of Revenue |
|
|
|
$ |
|
|
% of Revenue |
|
|
$ Change |
|
|
% Change |
|
||||||
|
Research and development |
$ |
27,656 |
|
|
|
7.6 |
% |
|
|
$ |
25,761 |
|
|
|
7.0 |
% |
|
$ |
1,895 |
|
|
|
7.4 |
% |
|
Selling and marketing |
|
49,892 |
|
|
|
13.7 |
% |
|
|
|
50,096 |
|
|
|
13.7 |
% |
|
|
(204 |
) |
|
|
(0.4 |
%) |
|
General and administrative |
|
31,070 |
|
|
|
8.5 |
% |
|
|
|
52,089 |
|
|
|
14.2 |
% |
|
|
(21,019 |
) |
|
|
(40.4 |
%) |
|
Restructuring |
|
11,436 |
|
|
|
3.1 |
% |
|
|
|
- |
|
|
|
0.0 |
% |
|
|
11,436 |
|
|
|
100.0 |
% |
|
Intangible asset amortization |
|
8,015 |
|
|
|
2.2 |
% |
|
|
|
14,989 |
|
|
|
4.1 |
% |
|
|
(6,974 |
) |
|
|
(46.5 |
%) |
|
Total |
$ |
128,069 |
|
|
|
35.1 |
% |
|
|
$ |
142,935 |
|
|
|
39.0 |
% |
|
$ |
(14,866 |
) |
|
|
(10.4 |
%) |
Consolidated research and development expense increased by $1.9 million or 7.4% for the fiscal year ended February 28, 2019 compared to the prior year. The increase was primarily driven by increased employee compensation and benefits due to increased headcount. Consolidated research and development expense as a percentage of revenues increased to 7.6% for the fiscal year ended February 28, 2019 compared to 7.0% in the prior year. We are investing in research and development of new products and technologies to be sold through the U.S. and international sales channels.
Consolidated selling and marketing expense decreased by $0.2 million or 0.4% for the fiscal year ended February 28, 2019 compared to the prior year. The decrease was primarily driven by a decrease in professional services and web design costs, as we substantially completed our CalAmp and LoJack brand refresh initiatives during the prior fiscal year. The decrease was partially offset by increases in marketing expenses to support various business developments in international territories.
Consolidated general and administrative expense decreased by $21.0 million or 40.4% for the fiscal year ended February 28, 2019 compared to the prior year. The decrease was primarily driven by a decline in litigation provisions and expenses related to existing legal matters (see Note 19). The decrease was partially offset by increased professional services coupled with service fees related to a new cloud-based ERP system that we are implementing to support the growth in our global operations. Certain implementation costs on the new ERP system were capitalized as Property and Equipment in our consolidated balance sheets.
As described in Note 11 to the accompanying consolidated financial statements, during fiscal 2019, we commenced a plan to capture certain synergies and cost savings related to streamlining our global operations and sales organization as well as rationalize certain leased properties that are partially vacant. For the fiscal year ended February 28, 2019, we recorded approximately $4.3 million in severance and employee related costs as well as $3.7 million in rent and related costs associated with office and manufacturing plant facilities where we have ceased use.
Amortization of intangibles decreased by $3.6 million or 23.7% for the fiscal year ended February 28, 2019 compared to the prior year due to completion of amortization on certain intangible assets.
Non-operating Income (Expense), Net
Investment income increased by $3.0 million to $5.3 million for the fiscal year ended February 28, 2019 from $2.3 million for the prior year. The increase was due primarily to an increase in interest income resulting from increased investments in various cash equivalent and short-term marketable securities primarily as a result of the net proceeds from our 2025 Convertible Notes and operating cash flows.
Interest expense increased $6.4 million to $16.7 million for the fiscal year ended February 28, 2019 from $10.3 million for the prior year due to additional interest expense and debt discount and issue costs relating to the 2025 Convertible Notes issued in July 2018 that are being amortized on the effective interest method.
See Note 19 to the accompanying consolidated financial statements for information concerning the $18.3 million gain on the legal settlement with a former supplier of LoJack.
46
See Note 10 to the accompanying consolidated financial statements for information on the $2.0 million loss on extinguishment of debt.
Other non-operating income for the fiscal year ended February 28, 2019 increased $1.1 million from net non-operating expense for the prior year due to unfavorable fluctuations in foreign currency exchange rates, primarily Euros to U.S. dollars.
Profitability Measures
Net income:
Our net income in the fiscal year ended February 28, 2019 was $18.4 million as compared to net income of $16.6 million in the prior year. The increase is due to a $11.7 million increase in operating income, $3.0 million increase in investment income and $12.0 million decrease in income tax provision. The increase in operating income was primarily attributable to $21.0 million decrease in general and administrative expense due to reduced legal provision and related costs as further discussed in Note 19 and partially offset by $8.0 million of restructuring expense.
Adjusted EBITDA:
|
|
Fiscal years ended February 28, |
|
|
|
|
|
||||||||||
|
(In thousands) |
2019 |
|
|
2018 |
|
|
|
$ Change |
|
|
% Change |
|
||||
|
Segment |
|
|
|
|
|
|
|
|
|
|
|
|
|
|
|
|
|
Telematics Systems |
$ |
40,821 |
|
|
$ |
48,943 |
|
|
|
$ |
(8,122 |
) |
|
|
-17 |
% |
|
Software & Subscription Services |
|
13,093 |
|
|
|
8,233 |
|
|
|
|
4,860 |
|
|
|
59 |
% |
|
Corporate Expense |
|
(5,699 |
) |
|
|
(4,794 |
) |
|
|
|
(905 |
) |
|
|
19 |
% |
|
Total Adjusted EBITDA |
$ |
48,215 |
|
|
$ |
52,382 |
|
|
|
$ |
(4,167 |
) |
|
|
-8 |
% |
Adjusted EBITDA for Telematics Systems in the fiscal year ended February 28, 2019 decreased $8.1 million compared to the prior year due to lower revenues as described above and the impact of high margin revenue earned on a strategic technology partnership arrangement in fiscal 2018. These factors were coupled with higher operating expenses in Telematics Systems as a result of increased headcount and outsourced professional service fees. Adjusted EBITDA for Software and Subscription Services increased $4.9 million compared to the prior year due primarily to continued growth in revenues and gross profit from our Italia market and higher gross profit from our fleet management services.
See Note 20 for a reconciliation of Adjusted EBITDA by reportable segments and a reconciliation to GAAP-basis net income (loss).
Liquidity and Capital Resources
In fiscal 2020, our primary cash needs have been for acquisitions and related costs, working capital purposes and, to a lesser extent, capital expenditures. We have historically funded our principal business activities through cash flows generated from operations. As we continue to grow our customer base and increase our revenues, there will be a need for working capital in the future. Our immediate sources of liquidity are cash, cash equivalents, marketable securities and our revolving credit facility. As of February 29, 2020, our cash, cash equivalents and marketable securities totaled $107.4 million.
On March 30, 2018, we entered into a revolving credit facility with JPMorgan Chase Bank, N.A. that provided for borrowings of up to $50 million. On March 27, 2020, we entered into an amendment of the revolving credit facility to extend the term to March 30, 2022. Borrowings under this revolving credit facility bear interest at either a Prime or LIBOR-based variable rate as selected by us on a periodic basis. This revolving credit facility contains financial covenants that require us to maintain a minimum level of earnings before interest, income taxes, depreciation, amortization and other noncash charges (EBITDA) and minimum debt coverage ratios. Throughout fiscal 2020 and as of February 29, 2020, there were no borrowings outstanding on this revolving credit facility.
47
On April 16, 2020, we received proceeds from a loan in the amount of $10 million (the “PPP Loan”) from JPMorgan Chase Bank, N.A., as lender, pursuant to the Small Business Association (“SBA”) Paycheck Protection Program (the “PPP”) of the Coronavirus Aid, Relief, and Economic Security Act. At the time we applied for the PPP loan, we believed that we qualified to receive the funds pursuant to the PPP. On April 23, 2020, the SBA, in consultation with the Department of Treasury, issued new guidance that creates uncertainty regarding the qualification requirements for a PPP loan. Out of an abundance of caution and in light of the new guidance, we repaid in full the principal and interest on the PPP Loan on April 27, 2020.
As described in Note 2 to the accompanying consolidated financial statements, in February 2019, we acquired Tracker Network (UK) Limited (“Tracker”), a LoJack in the U.K. licensee for a total purchase price of £10.0 million, or approximately $13.0 million. In the same month, we also entered into an agreement to acquire Car Track, S.A. DE C.V. (“LoJack Mexico”), the exclusive licensee of LoJack technology for the Mexican market. The agreement consisted of the purchase of the 87.5% of the LoJack Mexico shares not currently owned by us for a purchase price, net of cash on hand, of approximately $13.0 million. We completed the acquisition in March 2019. In April 2019, we acquired Synovia Solutions (“Synovia”), a North American market leader in fleet safety and management for K-12 school bus and state and local government fleets. The total purchase price was $49.8 million. We funded these acquisitions from cash on hand. As part of the Synovia acquisition, we assumed the rights and obligations from the Synovia revenue assignments (“Due to Factors”) as described in Note 10. The revenues recognized from this arrangement of $6.8 million were considered a non-cash financing activity for the fiscal year ended February 29, 2020.
We are a defendant in various legal proceedings involving intellectual property claims and contract disputes matters whereby the final settlement has not been determined at this time. In connection with these matters, we may have to enter into license agreements or other settlement arrangements that could require us to make significant payments in the future. Based on current information available, we do not believe that there are any claims that would have a material adverse effect on our financial condition, results of operations, or liquidity. See Note 19 to the accompanying consolidated financial statements for additional information on legal proceedings.
Cash flows from operating activities
Cash flows from operating activities consist of net income (loss) adjusted for certain non-cash items, including depreciation, intangible asset amortization, stock-based compensation expense, amortization of convertible debt issue costs and discount, deferred income taxes and other investment related matters as well as the effect of changes in working capital and other activities.
Our cash flow from operating activities are attributable to our net income as well as how well we manage our working capital, which is dictated by the volume of product we purchase from our manufacturers or suppliers and then sell to our customers along with the payment and collection terms that we negotiate with them. We purchase a majority of our product from significant suppliers located in Asia and Mexico that generally provide us 60-day payment terms for products purchased. Our significant customers are located in the U.S. as well as certain international locations. We believe that our relationship with our customers is good and that these customers are in good financial condition. We generally grant credit to our customers based on their financial viability and our historical collection experience with them. We typically require payment from them within 30 to 45 days of our invoice date with a few exceptions that extend the credit terms up to 90 days. Since we are paying our suppliers at or within 60 days of inventory purchase and our payment terms on our accounts receivable are within 45 days, we have historically generated positive cash flows from operating activities.
For the fiscal year ended February 29, 2020, net cash provided by operating activities was $11.5 million with a net loss was $79.3 million. Our non-cash expenses, comprised principally of depreciation, intangible assets amortization, stock-based compensation expense, amortization of convertible debt issue costs and discount, impairment loss, valuation allowance on deferred income tax assets and equity in net loss of affiliate and related impairment loss, was a $98.2 million source of cash in fiscal 2020. Changes in operating assets and liabilities represented a $7.8 million usage of cash, primarily driven by changes in working capital including a decrease in accounts payable and an increase in inventory but partially offset by a decrease in accounts receivable.
For the years ended February 28, 2019 and 2018, net cash provided by operating activities was $47.7 million and $66.9 million, respectively. Our cash flows from operations were impacted by our net income of $18.4 million and $16.6 million and a gain from legal settlement with a former supplier of LoJack of $18.3 million and $28.3 million, respectively, as well as similar activities within other non-cash items and changes in working capital as noted above.
48
Cash flows from investing activities
For the years ended February 29, 2020, February 28, 2019 and 2018, our net cash used in investing activities was $65.7 million, $21.8 million, and $26.5 million, respectively. In each of these periods, our primary investing activities consisted of capital expenditures and the purchase and sale of marketable securities in accordance with our corporate investment policy as well as strategic initiatives including certain investments in and advances to our affiliate and acquisitions. In fiscal 2020, we completed the acquisition of LoJack Mexico and Synovia for $12.7 million and $48.9 million, net of cash acquired, respectively. In fiscal 2019, we completed the acquisition of Tracker UK for approximately $13.0 million, net of cash acquired.
Our capital expenditures support our increased employee headcount and overall growth in our business. We expect that we may make additional capital expenditures in the future, all of which would be done to support the future growth of our business.
Cash flows from financing activities
For the years ended February 29, 2020, February 28, 2019 and 2018, our net cash (used in) provided by financing activities was $(94.8) million, $98.5 million and $(2.3) million, respectively. In each of these periods, we incurred payments for taxes related to the net share settlement of vested equity awards and the proceeds for the exercise of stock options. In fiscal 2020, we entered into separate, privately negotiated purchase agreements to repurchase approximately $94.9 million in aggregate principal amount of these notes for $94.7 million. In fiscal 2019, we issued $230.0 million of the 2025 Convertible Notes and used the net proceeds to pay the cost of the capped call transactions; repurchase shares of our common stock for $49 million, and repurchase a portion of our outstanding 2020 Convertible Notes as discussed above for $53.7 million. We also received proceeds of $3.1 million from the unwinding of the note hedges and warrants related to the 2020 Convertible Notes.
We are currently monitoring the impact of COVID-19 on our operating results and liquidity as we believe the pandemic may have an unfavorable impact on our financial condition and results of operations. We have implemented certain cost containment and cash flow control measures especially in areas such as personnel, travel and other discretionary spend. As of February 29, 2020, we had cash and cash equivalents of $107.4 million and $50 million available under our existing revolving credit facility. Accordingly, we believe that our existing cash and cash equivalents, funds anticipated to be generated from our operations and available borrowing on our revolving credit facility will be sufficient to meet our working capital needs for at least the next 12 months. Our future capital requirements may vary from those currently planned and will depend on many factors, including our rate of sales growth, the timing and extent of spending on various business initiatives, our international expansion, the timing of new product introductions, market acceptance of our products and overall economic conditions including the potential impact of COVID-19 on the global financial markets. To the extent that current and anticipated future sources of liquidity are insufficient to fund our future business activities and requirements, we may be required to seek additional equity or debt financing.
Off-Balance Sheet Arrangements
We have no off-balance sheet arrangements as defined in Item 303(a)(4)(ii) of the Securities and Exchange Commission Regulation S-K.
49
Following is a summary of our contractual cash obligations as of February 29, 2020 (in thousands):
|
|
|
Future Estimated Cash Payments Due by Period |
|
|||||||||||||||||
|
Contractual Obligations |
|
Less than 1 year |
|
|
1 - 3 years |
|
|
3 - 5 years |
|
|
> 5 years |
|
|
Total |
|
|||||
|
Convertible senior notes principal |
|
$ |
27,599 |
|
|
$ |
- |
|
|
$ |
- |
|
|
$ |
230,000 |
|
|
$ |
257,599 |
|
|
Convertible senior notes stated interest |
|
|
4,824 |
|
|
|
9,200 |
|
|
|
9,200 |
|
|
|
2,300 |
|
|
|
25,524 |
|
|
Operating leases |
|
|
6,087 |
|
|
|
10,827 |
|
|
|
8,630 |
|
|
|
9,952 |
|
|
|
35,496 |
|
|
Purchase obligations |
|
|
38,761 |
|
|
|
- |
|
|
|
- |
|
|
|
- |
|
|
|
38,761 |
|
|
Total contractual obligations |
|
$ |
77,271 |
|
|
$ |
20,027 |
|
|
$ |
17,830 |
|
|
$ |
242,252 |
|
|
$ |
357,380 |
|
Purchase obligations consist primarily of inventory purchase commitments.
Critical Accounting Policies
We prepare our consolidated financial statements in accordance with accounting principles generally accepted in the U.S.. The preparation of these consolidated financial statements requires us to make estimates, assumptions and judgments that can significantly impact the amount we report as assets, liabilities, revenues, costs and expenses and the related disclosures. We base our estimates on historical experience and other assumptions that we believe are reasonable under the circumstances. We believe that the accounting policies discussed below are critical to understanding our historical and future performance as these policies involve a greater degree of judgment and complexity.
Revenue Recognition
In May 2014, the FASB issued Accounting Standards Update 2014-09, Revenue from Contracts with Customers (“ASC 606”). The new revenue recognition standard provides a five-step analytical framework for transactions to determine when and how revenue is recognized. The core principle is that a company should recognize revenue to depict the transfer of promised goods or services to customers in an amount that reflects the consideration to which the entity expects to be entitled in exchange for those goods or services. In order to adhere to this core principle, we apply the following five-step approach:
|
|
• |
identify the contract with a customer; |
|
|
• |
identify the performance obligations in the contract; |
|
|
• |
determine the transaction price; |
|
|
• |
allocate the transaction price to the performance obligations in the contract; and |
|
|
• |
recognize revenue when (or as) we satisfy a performance obligation. |
We only apply the five-step model to contracts when it is probable that we will collect the consideration we are entitled to in exchange for goods or services we transfer to the customer.
The two permitted transition methods under the new standard are the full retrospective method or the modified retrospective method. We adopted the new standard effective March 1, 2018 using the modified retrospective method, which we applied to all contracts that were not completed on adoption date. We applied the provisions of ASC 605 to revenue recognized during fiscal year ended February 28, 2018.
Telematics Products. We recognize revenue from product sales upon transfer of control of promised products to customers in an amount that reflects the transaction price, which is generally the stand-alone selling prices of the promised goods. Such arrangements do not involve contracts with customers for future service commitments or performance obligations. For product shipments made on the basis of “FOB Destination” terms, revenue is recorded when the products reach the customer. Customers generally do not have a right of return except for defective products returned during the warranty period. We record estimated commitments related to customer incentive programs as reductions of revenues.
50
Application Services, subscriptions and related devices. We recognize the following revenues (and related cost of revenues) in our Application subscriptions and related products and service revenues and cost of revenues because we enter into arrangements that combine various hardware devices as well as installation and notification services that are provided over a stipulated service period.
Our integrated SaaS-based solutions for our fleet management, vehicle finance and certain other verticals provide our customers with the ability to wirelessly communicate with monitoring devices installed in vehicles and other mobile or remote assets via our software applications. The transaction price for a typical SaaS arrangement includes the price for the customized device, installation and application subscriptions. We have applied our judgment in determining that these integrated arrangements typically represent single performance obligations satisfied over time.
Accordingly, we defer the recognition of revenue for the customized devices that only function with our applications and are sold only on an integrated basis with our proprietary applicable subscriptions. Such customized devices and the application services are not sold separately. In such circumstances, the associated device related costs are recorded as deferred costs in the balance sheet. The upfront fees for the devices are not distinct from the subscription service and are combined into the subscription service performance obligation. Generally, these service arrangements do not provide the customer with the right to take possession of the software supporting the subscription service at any time. Revenues from subscription services are recognized ratably, on a straight-line basis, over the term of the subscription. Subscription renewal fees are recognized ratably over the term of the renewal. The deferred revenue and product cost amounts are amortized to Application Subscriptions and Related Products and Other Services revenue and cost of revenue, respectively, on a straight-line basis over the estimated average in-service lives of these devices, which are three years in the vehicle finance and four to five years in the fleet management verticals. Our deferred contract revenue under ASC 606 does not include future subscription fees associated with customers’ unexercised contract renewal rights.
Accessories may also be sold to these customers. We recognize revenue for sales of accessories upon transfer of control to the customer based on estimated stand-alone selling prices.
In certain customer arrangements, we sell or lease vehicle location devices together with related monitoring services as part of the contractual arrangement. From time to time we sell these vehicle location devices and monitoring services separately to customers and sell similar devices on a stand-alone basis to licensees. Accordingly, we recognize revenues for the sales of these devices upon transfer of control to the customer and recognize revenue for the related monitoring services over the service period. The allocation of the transaction price is based on the estimated stand-alone selling prices for the devices and the monitoring services.
Deferred revenues consist primarily of the deferred amounts related to the integrated SaaS solutions and advance payments received from customers for vehicle location monitoring and recovery services.
Professional Services. We also provide various professional services to customers. These include project management, engineering services, installation services and an on-going early warning automated notification service, which are typically distinct from other performance obligations and are recognized as the related services are performed. For certain professional service contracts, we recognize revenue based on the proportion of total costs incurred to-date over the estimated cost of the contract, which is an input method. These are generally short-term projects which do not require significant judgement or estimation.
Contract Balances. Timing of revenue recognition may differ from the timing on our invoicing to customers. Contract liabilities are comprised of billings or payments received from our customers in advance of performance under the contract. We refer to these contract liabilities as “Deferred Revenues” in the accompanying consolidated financial statements. Certain incremental costs of obtaining a contract with a customer consist of sales commissions, which are recognized on a straight-line basis over the life of the corresponding contracts. The deferred costs of hardware are capitalized and amortized over the estimated useful life of the device on a straight-line basis.
51
Accounts Receivable and Allowance for Doubtful Accounts
Accounts receivable consists of amounts due from sales arrangements executed in our normal business activities and are recorded at invoiced amounts. We maintain an allowance for doubtful accounts for uncollectible receivables. We determine the sufficiency of the accounts receivable allowance based upon historical experience and an evaluation of current industry trends and economic conditions. The current global economic and business conditions attributable to COVID-19 may have an unfavorable impact on our customers and impact our ability to collect on outstanding accounts receivable. If our actual collection experience varies significantly from our estimates, we may be required to adjust our allowance for doubtful accounts. Historical variances of these amounts from our estimates have not resulted in material adjustments to our financial statements.
Inventories
We evaluate the carrying value of inventory on a quarterly basis to determine if the carrying value is recoverable at estimated selling prices. To the extent that estimated selling prices do not exceed the associated carrying values, inventory carrying amounts are written down. In addition, we generally treat inventory on hand or committed with suppliers, that is not expected to be sold in the near term, as excess and thus appropriate write-downs of the inventory carrying amounts are established through a charge to cost of revenues. Estimated usage in the next 12 months is based on firm demand represented by orders in backlog at the end of the quarter and management's estimate of sales beyond existing backlog, giving consideration to customers' forecasted demand, ordering patterns and product life cycles. A large portion of our inventory was purchased within the last two years, which we believe mitigates our exposure to material excess or obsolescence at this time, although ongoing changes in cellular carrier technology, supplier changes, closure of our warehouse facilities, changes in demand or significant reductions in product pricing may necessitate additional write-downs of inventory carrying value in the future, which could be material.
Patent Litigation and Other Contingencies
We operate in an industry where there may be certain claims made against us related to patent infringement and other matters. We accrue for these claims whenever we determine that an unfavorable outcome is probable and the liability is reasonably estimable. The amount of the accrual is estimated based on our review of each individual claim, including the type and facts of the claim and our assessment of the merits of the claim. Since these legal matters can be very complex and require significant judgement, we often utilize external legal counsel and other subject matter experts to assist us in defending against such claims. These accruals are reviewed at least on a quarterly basis and are adjusted to reflect the impact of recent negotiations, settlements, court rulings, advice from legal counsel and other events pertaining to the case. Although we believe that we take reasonable and considerable measures to mitigate our exposure in these matters, the outcome of litigation is inherently unpredictable. Nonetheless, we believe that we have valid defenses with respect to pending legal matters against us as well as adequate provisions for probable and estimable losses. All costs for legal services are expensed as incurred.
52
We use the asset and liability method when accounting for income taxes. Under this method, deferred income tax assets and liabilities are recognized for future tax consequences attributable to the difference between the financial statement carrying amounts of existing assets and liabilities and their respective tax bases and operating loss and tax credit carryforwards. Deferred tax assets and liabilities are measured using enacted tax rates expected to apply to the taxable income in the years in which those temporary differences are expected to be recovered or settled. The effect on deferred tax assets and liabilities of a change in tax rates is recognized in income in the period that includes the enactment date. Under U.S. GAAP we are allowed to make an accounting policy choice to either: (1) treat taxes due on future GILTI inclusions in U.S. taxable income as a current-period expense when incurred (the “period cost method”); or (2) factor in such amounts into our measurement of our deferred taxes (the “deferred method”). We have elected to account for GILTI as a period cost in the year the tax is incurred. Accordingly, no GILTI-related deferred amounts were recorded. We recognize the effect of income tax positions only if those positions are more likely than not of being sustained. Changes in recognition or measurement are reflected in the period in which the change in judgment occurs. Valuation allowances are provided against deferred tax assets when it is determined that it is more likely than not that the assets will not be realized. In assessing valuation allowances, we review historical and future expected operating results and other factors, including cumulative earnings experience, expectations of future taxable income by jurisdiction, and the carryforward periods available for income tax purposes. We make estimates, assumptions and judgments to determine our provision for income taxes, our deferred tax assets and liabilities, and any valuation allowances recorded against our deferred tax assets.
Business Combinations
The purchase price of an acquisition is allocated to the underlying assets acquired and liabilities assumed based upon their estimated fair values at the date of acquisition. To the extent the purchase price exceeds the aggregate fair value of the net identifiable tangible and intangible assets acquired and labilities assumed, such excess is allocated to goodwill. We determine the estimated fair values after review and consideration of relevant information, including discounted cash flows, quoted market prices and other estimates made by management. We adjust the preliminary purchase price allocation, as necessary, during the measurement period of up to one year after the acquisition closing date as we obtain more information as to facts and circumstances existing at the acquisition date impacting the asset valuations and liabilities assumed. While we use our best estimates and assumptions to accurately value assets acquired and liabilities assumed at the acquisition date, these estimates are uncertain and subject to refinement. As a result, we may record adjustments to the fair value of the assets and liabilities with a corresponding adjustment to goodwill during the measurement period. Upon conclusion of the measurement period, the impact of any subsequent adjustments is included in our consolidated statement of comprehensive income (loss).
Goodwill acquired in business combinations is assigned to the reporting unit expected to benefit from the combination as of the acquisition date. Acquisition-related costs are recognized separately from the acquisition and are expensed as incurred.
Goodwill and Other Intangible and Long-lived Assets
At February 29, 2020, we had $106.3 million in goodwill and $45.9 million in other net intangible assets, recorded on our consolidated balance sheet.
Goodwill represents the excess of the purchase price over the fair value of the net tangible and intangible assets acquired in a business combination and consists primarily of goodwill from the Synovia and recent LoJack related acquisitions. Prior to the fourth quarter of fiscal 2020, our two operating segments, Telematics Systems and Software & Subscription Services, also represent our two reporting units for goodwill impairment testing. During the fourth quarter, we changed our reporting structure, resulting in four reporting units with two reporting units under each of our operating segment. Our Telematics Systems segment includes $51.2 million of goodwill and our Software & Subscription Service segment includes $55.1 million.
53
Goodwill is not amortized but we perform an annual qualitative assessment of our goodwill during the fourth quarter of each calendar year, or at other reporting periods within the fiscal year as may be required, to determine if any events or circumstances exist, such as decline in our stock price, significant differences in our forecasts compared to actual results, changes in our business climate or a decline in overall industry demand, that would indicate that it is more likely than not that the fair value of a reporting unit is below its carrying amount. In accordance with Accounting Standards Update 2017-04, Simplifying the Test for Goodwill Impairment (“ASU 2017-04”), which we adopted in the fourth quarter of fiscal 2020, the impairment test involves comparing the estimated fair value of a reporting unit with its book value, including goodwill. If the estimated fair value exceeds book value, goodwill is considered not to be impaired. If, however, the fair value of the reporting unit is less than book value, then an impairment loss is recognized in an amount equal to the amount that the book value of the reporting unit exceeds its fair value, not to exceed the total amount of goodwill allocated to the reporting unit. For the purpose of impairment testing, we estimated the fair value of each of our reporting units to be higher than the book value as of February 29, 2020. As a result, we have determined that there has been no impairment of goodwill for all periods presented.
Acquired intangible assets with definite lives consist primarily of asset acquired in the LoJack related acquisition, including tradenames, dealer relationships and developed technology and are amortized on a straight-line basis over the remaining estimated economic life of the underlying products, technologies or relationships. We review our definite lived long-lived assets for impairment whenever events or changes in circumstances indicate that the carrying amount of a long-lived asset may not be recoverable. Recoverability of an asset group is first evaluated by comparing its carrying amount to the expected future undiscounted cash flows that the lowest level of asset group is expected to generate. Certain of our other intangible and long-lived assets share resources and have interdependent cash flows across our segments, product and service verticals and geographies. If we determine that an intangible or long-lived asset or asset group is not recoverable, an impairment loss is recorded in the amount by which the carrying amount of the asset group exceeds its estimated fair value.
The recoverability assessment with respect to each of the tradenames used in our operations requires us to estimate the fair value of the asset as of the assessment date. Such determination is made using discounted cash flow techniques (Level 3 determination of fair value). Significant inputs to the valuation model include:
|
|
• |
future revenue and profitability projections associated with the tradename through a relief of royalty approach; |
|
|
• |
estimated market royalty rates that could be derived from the licensing of our tradenames to third parties in order to establish the cash flows accruing to the benefit of the Company as a result of our ownership of our tradenames; and |
|
|
• |
rate used to discount the estimated royalty cash flow projections to their present value (or estimated fair value). |
We estimate the fair value of goodwill and other long-lived assets other than tradenames based on discounted cash flow techniques (Level 3 determination of fair value). Significant inputs to the valuation model include:
|
|
• |
estimated future cash flows; |
|
|
• |
growth assumptions for future revenues as well as future gross margin rates, expense rates, capital expenditures and other estimates; and |
|
|
• |
rate used to discount our estimated future cash flow projections to their present value (or estimated fair value) based on our estimated weighted average cost of capital. |
54
Based upon our assessment of economic conditions, our expectations of future business conditions and trends, our projected revenues, earnings, and cash flows, we determined that our LoJack tradename and US dealer relationships intangible assets and certain other long-lived assets were impaired in fiscal year 2020 and recorded total impairment losses of $19.1 million. There was no impairment of goodwill for fiscal 2020 and fiscal 2019. The fair value of the LoJack US SVR reporting unit exceeds its carrying amount by approximately 8% as of February 29, 2020. Any deterioration in future cash flows of this reporting unit may result in impairment of its goodwill, which was approximately $12 million as of February 29, 2020. Any reduction in the revenue forecast utilized for the impairment test of the LoJack tradename, which had a carrying value of $10.5 million as of February 29, 2020, may result in additional impairment. Our stock price has declined subsequent to year-end because of COVID-19 and other market factors. We will evaluate if this decline is more than temporary as an impairment indicator for assessing the carrying amount of our goodwill and long-lived assets in future periods.
Forward Looking Statements
Forward looking statements in this Annual Report on Form 10-K which include, without limitation, statements relating to our plans, strategies, objectives, expectations, intentions, projections and other information regarding future performance, are made pursuant to the safe harbor provisions of the Private Securities Litigation Reform Act of 1995. The words “may”, “will”, “could”, “plans”, “intends”, “seeks”, “believes”, “anticipates”, “expects”, “estimates”, “judgment”, “goal”, and variations of these words and similar expressions, are intended to identify forward-looking statements. These forward-looking statements reflect our current views with respect to future events and financial performance and are subject to certain risks and uncertainties that are difficult to predict, including, without limitation, product demand, competitive pressures and pricing declines in our markets, the timing of customer approvals of new product designs, intellectual property infringement claims, interruption or failure of our Internet-based systems used to wirelessly configure and communicate with the tracking and monitoring devices that we sell, our potential needs for additional capital, the impact of adverse and uncertain economic conditions in the U.S. and international markets, the effects of global outbreaks of pandemics or contagious diseases or fear of such outbreaks, such as the recent coronavirus (COVID-19) pandemic, our ability to accurately forecast demand for our products and manage our inventory, our ability to successfully enter new geographic markets, manage our international expansion and comply with any applicable laws and regulations, significant disruption in, or breach in security of our ERP systems and resultant interruptions in service and any related impact on our reputation, the attraction and retention of qualified employees and key personnel and our ability to maintain our corporate culture as we continue to grow, the sufficiency of our cash and cash equivalents to meet our liquidity needs and service our indebtedness, and other risks and uncertainties that are set forth under the caption in Part I, Item 1A of this Annual Report on Form 10-K (Risk Factors). Such risks and uncertainties could cause actual results to differ materially and adversely from historical or anticipated results. Although we believe the expectations reflected in such forward-looking statements are based upon reasonable assumptions, we can give no assurance that our expectations will be attained. We undertake no obligation to revise or
55
publicly release the results of any revision to these forward-looking statements, except as required by law. Given these risks and uncertainties, readers are cautioned not to place undue reliance on such forward-looking statements.
Foreign Currency Risk
We have international operations, giving rise to exposure to market risks from changes in currency exchange rates. A cumulative foreign currency translation loss of $1.4 million related to our foreign subsidiaries is included in accumulated other comprehensive loss in the stockholders' equity section of the consolidated balance sheet at February 29, 2020. The aggregate foreign currency transaction exchange rate losses included in determining income (loss) before income taxes and equity in net loss of affiliate were $(0.2) million, $(0.4) million and $0.5 million in fiscal years ended February 29, 2020, February 28, 2019 and 2018, respectively.
Interest Rate Risk
Our exposure to market rate risk for changes in interest rates relates primarily to our marketable securities investment portfolio. The primary objective of our investment activities is to preserve principal and liquidity while at the same time maximizing yields without significantly increasing risk. To achieve this objective, we maintain our investments portfolio in a variety of available-for-sale fixed debt securities, including both government and corporate obligations and money market funds. Investments in fixed rate interest bearing instruments carry a degree of interest rate risk. Fixed rate securities may have their fair market value adversely impacted due to a rise in prevailing interest rates. Due in part to these factors, we may suffer losses in principal if we need the funds prior to maturity and choose to sell securities that have declined in market value due to changes in interest rates or perceived credit risk related to the securities’ issuers.
On March 30, 2018, we entered into a revolving credit facility with JPMorgan Chase Bank, N.A. that provides for borrowings of up to $50 million. On March 27, 2020, we entered into an amendment of the revolving credit facility with J.P. Morgan to extend the term for 24 months to March 30, 2022. Borrowings under this revolving credit facility bear interest at a Prime or LIBOR-based variable rate as selected by us on a periodic basis. There were no borrowings outstanding under this revolving credit facility at February 29, 2020.
56
Report of Independent Registered Public Accounting Firm
To the stockholders and the Board of Directors of CalAmp Corp.
Opinion on the Financial Statements
We have audited the accompanying consolidated balance sheets of CalAmp Corp and subsidiaries (the "Company") as of February 29, 2020 and February 28, 2019, the related consolidated statements of comprehensive income (loss), stockholders’ equity, and cash flows, for each of the three years in the period ended February 29, 2020, and the related notes (collectively referred to as the "financial statements"). In our opinion, the financial statements present fairly, in all material respects, the financial position of the Company as of February 29, 2020 and February 28, 2019, and the results of its operations and its cash flows for each of the three years in the period ended February 29, 2020, in conformity with accounting principles generally accepted in the United States of America.
We have also audited, in accordance with the standards of the Public Company Accounting Oversight Board (United States) (PCAOB), the Company's internal control over financial reporting as of February 29, 2020, based on criteria established in Internal Control — Integrated Framework (2013) issued by the Committee of Sponsoring Organizations of the Treadway Commission and our report dated May 5, 2020, expressed an unqualified opinion on the Company's internal control over financial reporting.
Adoption of New Accounting Standards
As discussed in Note 1 to the financial statements, the Company has changed its method of accounting for leases in fiscal year 2020 due to the adoption of Accounting Standards Update ASU 2016-02, Leases, using the modified retrospective approach.
As discussed in Note 1 to the financial statements, the Company has changed its method of accounting for revenue in fiscal year 2019 due to the adoption of Accounting Standards Update ASU 2014-09, Revenue from Contracts with Customers, using the modified retrospective approach.
Basis for Opinion
These financial statements are the responsibility of the Company's management. Our responsibility is to express an opinion on the Company's financial statements based on our audits. We are a public accounting firm registered with the PCAOB and are required to be independent with respect to the Company in accordance with the U.S. federal securities laws and the applicable rules and regulations of the Securities and Exchange Commission and the PCAOB.
We conducted our audits in accordance with the standards of the PCAOB. Those standards require that we plan and perform the audit to obtain reasonable assurance about whether the financial statements are free of material misstatement, whether due to error or fraud. Our audits included performing procedures to assess the risks of material misstatement of the financial statements, whether due to error or fraud, and performing procedures that respond to those risks. Such procedures included examining, on a test basis, evidence regarding the amounts and disclosures in the financial statements. Our audits also included evaluating the accounting principles used and significant estimates made by management, as well as evaluating the overall presentation of the financial statements. We believe that our audits provide a reasonable basis for our opinion.
/s/ Deloitte & Touche LLP
Costa Mesa, CA
May 5, 2020
We have served as the Company's auditor since 2018.
57
(In thousands, except par value)
|
|
|
February 29/28, |
|
|||||
|
|
|
2020 |
|
|
2019 |
|
||
|
Assets |
|
|
|
|
|
|
|
|
|
Current assets: |
|
|
|
|
|
|
|
|
|
Cash and cash equivalents |
|
$ |
107,404 |
|
|
$ |
256,500 |
|
|
Short-term marketable securities |
|
|
- |
|
|
|
17,512 |
|
|
Accounts receivable, net |
|
|
72,273 |
|
|
|
78,079 |
|
|
Inventories |
|
|
36,778 |
|
|
|
32,033 |
|
|
Prepaid expenses and other current assets |
|
|
21,411 |
|
|
|
19,373 |
|
|
Total current assets |
|
|
237,866 |
|
|
|
403,497 |
|
|
Property and equipment, net |
|
|
55,878 |
|
|
|
27,023 |
|
|
Operating lease right-of-use assets |
|
|
20,626 |
|
|
|
- |
|
|
Deferred income tax assets |
|
|
4,437 |
|
|
|
22,626 |
|
|
Goodwill |
|
|
106,335 |
|
|
|
80,805 |
|
|
Other intangible assets, net |
|
|
45,895 |
|
|
|
47,165 |
|
|
Other assets |
|
|
24,768 |
|
|
|
22,510 |
|
|
|
|
$ |
495,805 |
|
|
$ |
603,626 |
|
|
Liabilities and Stockholders' Equity |
|
|
|
|
|
|
|
|
|
Current liabilities: |
|
|
|
|
|
|
|
|
|
Current portion of long-term debt |
|
$ |
33,119 |
|
|
$ |
- |
|
|
Accounts payable |
|
|
28,450 |
|
|
|
39,898 |
|
|
Accrued payroll and employee benefits |
|
|
9,049 |
|
|
|
8,808 |
|
|
Deferred revenue |
|
|
34,704 |
|
|
|
24,264 |
|
|
Other current liabilities |
|
|
16,153 |
|
|
|
10,622 |
|
|
Total current liabilities |
|
|
121,475 |
|
|
|
83,592 |
|
|
Long-term debt, net of current portion |
|
|
177,088 |
|
|
|
275,905 |
|
|
Operating lease liabilities |
|
|
24,279 |
|
|
|
- |
|
|
Other non-current liabilities |
|
|
35,044 |
|
|
|
38,476 |
|
|
Total liabilities |
|
|
357,886 |
|
|
|
397,973 |
|
|
Commitments and contingencies (see Notes 19) |
|
|
|
|
|
|
|
|
|
Stockholders' equity: |
|
|
|
|
|
|
|
|
|
Preferred stock, $.01 par value; 3,000 shares authorized; no shares issued or outstanding |
|
|
- |
|
|
|
- |
|
|
Common stock, $.01 par value; 80,000 shares authorized; 34,322 and 33,555 shares issued and outstanding at February 29, 2020 and February 28, 2019, respectively |
|
|
343 |
|
|
|
336 |
|
|
Additional paid-in capital |
|
|
220,482 |
|
|
|
208,205 |
|
|
Accumulated deficit |
|
|
(81,531 |
) |
|
|
(2,227 |
) |
|
Accumulated other comprehensive loss |
|
|
(1,375 |
) |
|
|
(661 |
) |
|
Total stockholders' equity |
|
|
137,919 |
|
|
|
205,653 |
|
|
|
|
$ |
495,805 |
|
|
$ |
603,626 |
|
See accompanying notes to consolidated financial statements.
58
CONSOLIDATED STATEMENTS OF COMPREHENSIVE INCOME (LOSS)
(In thousands, except per share amounts)
|
|
|
Year Ended February 29/28, |
|
|||||||||
|
|
|
2020 |
|
|
2019 |
|
|
2018 |
|
|||
|
Revenues: |
|
|
|
|
|
|
|
|
|
|
|
|
|
Telematics Products |
|
$ |
241,212 |
|
|
$ |
285,883 |
|
|
$ |
301,700 |
|
|
Application subscriptions and related products and other services |
|
|
124,895 |
|
|
|
77,917 |
|
|
|
64,212 |
|
|
Total revenues |
|
|
366,107 |
|
|
|
363,800 |
|
|
|
365,912 |
|
|
Cost of revenues: |
|
|
|
|
|
|
|
|
|
|
|
|
|
Telematics Products |
|
|
154,654 |
|
|
|
175,009 |
|
|
|
181,889 |
|
|
Application subscriptions and related products and other services |
|
|
68,150 |
|
|
|
41,027 |
|
|
|
33,133 |
|
|
Total cost of revenues |
|
|
222,804 |
|
|
|
216,036 |
|
|
|
215,022 |
|
|
Gross profit |
|
|
143,303 |
|
|
|
147,764 |
|
|
|
150,890 |
|
|
Operating expenses: |
|
|
|
|
|
|
|
|
|
|
|
|
|
Research and development |
|
|
29,436 |
|
|
|
27,656 |
|
|
|
25,761 |
|
|
Selling and marketing |
|
|
60,534 |
|
|
|
49,892 |
|
|
|
50,096 |
|
|
General and administrative |
|
|
57,669 |
|
|
|
31,070 |
|
|
|
52,089 |
|
|
Intangible asset amortization |
|
|
12,321 |
|
|
|
11,436 |
|
|
|
14,989 |
|
|
Impairment loss |
|
|
19,143 |
|
|
|
- |
|
|
|
- |
|
|
Restructuring |
|
|
4,400 |
|
|
|
8,015 |
|
|
|
- |
|
|
Total operating expenses |
|
|
183,503 |
|
|
|
128,069 |
|
|
|
142,935 |
|
|
Operating income (loss) |
|
|
(40,200 |
) |
|
|
19,695 |
|
|
|
7,955 |
|
|
Non-operating income (expense): |
|
|
|
|
|
|
|
|
|
|
|
|
|
Investment income |
|
|
4,497 |
|
|
|
5,258 |
|
|
|
2,256 |
|
|
Interest expense |
|
|
(20,096 |
) |
|
|
(16,726 |
) |
|
|
(10,280 |
) |
|
Gain on legal settlement |
|
|
- |
|
|
|
18,333 |
|
|
|
28,333 |
|
|
Loss on extinguishment of debt |
|
|
(2,408 |
) |
|
|
(2,033 |
) |
|
|
- |
|
|
Other income (expense), net |
|
|
(113 |
) |
|
|
(672 |
) |
|
|
445 |
|
|
|
|
|
(18,120 |
) |
|
|
4,160 |
|
|
|
20,754 |
|
|
Income (loss) before income taxes and equity in net loss of affiliate and related impairment loss |
|
|
(58,320 |
) |
|
|
23,855 |
|
|
|
28,709 |
|
|
Income tax benefit (provision) |
|
|
(20,454 |
) |
|
|
1,330 |
|
|
|
(10,681 |
) |
|
Income (loss) before equity in net loss of affiliate and related impairment loss |
|
|
(78,774 |
) |
|
|
25,185 |
|
|
|
18,028 |
|
|
Equity in net loss of affiliate and related impairment loss |
|
|
(530 |
) |
|
|
(6,787 |
) |
|
|
(1,411 |
) |
|
Net income (loss) |
|
$ |
(79,304 |
) |
|
$ |
18,398 |
|
|
$ |
16,617 |
|
|
Earnings (loss) per share: |
|
|
|
|
|
|
|
|
|
|
|
|
|
Basic |
|
$ |
(2.36 |
) |
|
$ |
0.53 |
|
|
$ |
0.47 |
|
|
Diluted |
|
$ |
(2.36 |
) |
|
$ |
0.52 |
|
|
$ |
0.46 |
|
|
Shares used in computing earnings (loss) per share: |
|
|
|
|
|
|
|
|
|
|
|
|
|
Basic |
|
|
33,670 |
|
|
|
34,589 |
|
|
|
35,250 |
|
|
Diluted |
|
|
33,670 |
|
|
|
35,294 |
|
|
|
36,139 |
|
|
Comprehensive income (loss): |
|
|
|
|
|
|
|
|
|
|
|
|
|
Net income (loss) |
|
$ |
(79,304 |
) |
|
$ |
18,398 |
|
|
$ |
16,617 |
|
|
Other comprehensive income (loss): |
|
|
|
|
|
|
|
|
|
|
|
|
|
Foreign currency translation adjustments, net of tax |
|
|
(714 |
) |
|
|
(33 |
) |
|
|
(122 |
) |
|
Unrealized income (loss) on available-for-sale securities, net of tax |
|
|
- |
|
|
|
(429 |
) |
|
|
464 |
|
|
Total comprehensive income (loss) |
|
$ |
(80,018 |
) |
|
$ |
17,936 |
|
|
$ |
16,959 |
|
See accompanying notes to consolidated financial statements.
59
CONSOLIDATED STATEMENTS OF STOCKHOLDERS' EQUITY
(In thousands)
|
|
|
Years Ended February 29/28, |
|
|||||||||
|
|
|
2020 |
|
|
2019 |
|
|
2018 |
|
|||
|
Total stockholders' equity, beginning balances |
|
$ |
205,653 |
|
|
$ |
198,916 |
|
|
$ |
163,242 |
|
|
|
|
|
|
|
|
|
|
|
|
|
|
|
|
Common stock and additional paid-in capital: |
|
|
|
|
|
|
|
|
|
|
|
|
|
Beginning balances |
|
|
208,541 |
|
|
|
218,574 |
|
|
|
211,540 |
|
|
Equity component of 2025 Convertible Notes, net of tax |
|
|
- |
|
|
|
51,902 |
|
|
|
- |
|
|
Purchase of capped call on 2025 Convertible Notes, net of tax |
|
|
- |
|
|
|
(15,870 |
) |
|
|
- |
|
|
Debt issuance costs of 2025 Convertible Notes allocated to equity, net of tax |
|
|
- |
|
|
|
(1,649 |
) |
|
|
- |
|
|
Equity component of the repurchased 2020 Convertible Notes |
|
|
- |
|
|
|
(6,088 |
) |
|
|
- |
|
|
Unwind of note hedges and warrants of 2020 Convertible Notes |
|
|
- |
|
|
|
3,122 |
|
|
|
- |
|
|
Stock-based compensation expense |
|
|
12,421 |
|
|
|
11,029 |
|
|
|
9,298 |
|
|
Shares issued on net share settlement of equity awards |
|
|
(2,007 |
) |
|
|
(3,603 |
) |
|
|
(2,594 |
) |
|
Exercise of stock options and contributions to ESPP |
|
|
1,870 |
|
|
|
124 |
|
|
|
330 |
|
|
Repurchases of common stock |
|
|
- |
|
|
|
(49,000 |
) |
|
|
- |
|
|
Ending balances |
|
|
220,825 |
|
|
|
208,541 |
|
|
|
218,574 |
|
|
|
|
|
|
|
|
|
|
|
|
|
|
|
|
Accumulated deficit: |
|
|
|
|
|
|
|
|
|
|
|
|
|
Beginning balances |
|
|
(2,227 |
) |
|
|
(19,459 |
) |
|
|
(47,757 |
) |
|
Cumulative adjustment upon adoption of ASU 2016-09, net of tax |
|
|
- |
|
|
|
- |
|
|
|
11,681 |
|
|
Cumulative adjustment upon adoption of ASU 2016-01, net of tax |
|
|
- |
|
|
|
429 |
|
|
|
- |
|
|
Cumulative adjustment upon adoption of ASC 606, net of tax |
|
|
- |
|
|
|
(1,595 |
) |
|
|
- |
|
|
Net income (loss) |
|
|
(79,304 |
) |
|
|
18,398 |
|
|
|
16,617 |
|
|
Ending balances |
|
|
(81,531 |
) |
|
|
(2,227 |
) |
|
|
(19,459 |
) |
|
|
|
|
|
|
|
|
|
|
|
|
|
|
|
Accumulated other comprehensive income: |
|
|
|
|
|
|
|
|
|
|
|
|
|
Beginning balances |
|
|
(661 |
) |
|
|
(199 |
) |
|
|
(541 |
) |
|
Cumulative adjustment upon adoption of ASU 2016-01, net of tax |
|
|
- |
|
|
|
(429 |
) |
|
|
- |
|
|
Foreign currency translation adjustments, net of tax |
|
|
(714 |
) |
|
|
(33 |
) |
|
|
342 |
|
|
Ending balances |
|
|
(1,375 |
) |
|
|
(661 |
) |
|
|
(199 |
) |
|
|
|
|
|
|
|
|
|
|
|
|
|
|
|
Total stockholders' equity, ending balances |
|
$ |
137,919 |
|
|
$ |
205,653 |
|
|
$ |
198,916 |
|
See accompanying notes to consolidated financial statements.
60
CALAMP CORP.
CONSOLIDATED STATEMENTS OF CASH FLOWS
(In thousands)
|
|
Year Ended February 29/28, |
|
|||||||||
|
|
2020 |
|
|
2019 |
|
|
2018 |
|
|||
|
CASH FLOWS FROM OPERATING ACTIVITIES: |
|
|
|
|
|
|
|
|
|
|
|
|
Net income (loss) |
$ |
(79,304 |
) |
|
$ |
18,398 |
|
|
$ |
16,617 |
|
|
Adjustments to reconcile net income (loss) to net cash provided by operating activities: |
|
|
|
|
|
|
|
|
|
|
|
|
Depreciation |
|
19,666 |
|
|
|
8,580 |
|
|
|
7,968 |
|
|
Intangible asset amortization expense |
|
12,321 |
|
|
|
11,436 |
|
|
|
14,989 |
|
|
Stock-based compensation expense |
|
12,421 |
|
|
|
11,029 |
|
|
|
9,298 |
|
|
Amortization of convertible debt issue costs and discount |
|
13,764 |
|
|
|
11,492 |
|
|
|
7,472 |
|
|
Impairment loss |
|
19,143 |
|
|
|
- |
|
|
|
- |
|
|
Impairment of operating lease right-of-use (ROU) assets |
|
1,210 |
|
|
|
- |
|
|
|
- |
|
|
Noncash operating lease cost |
|
4,894 |
|
|
|
- |
|
|
|
- |
|
|
Loss on extinguishment of debt |
|
2,408 |
|
|
|
2,033 |
|
|
|
- |
|
|
Revenue assigned to factors |
|
(6,844 |
) |
|
|
- |
|
|
|
- |
|
|
Tax benefits on vested and exercised equity awards |
|
- |
|
|
|
758 |
|
|
|
937 |
|
|
Deferred tax assets, net |
|
18,552 |
|
|
|
(1,244 |
) |
|
|
6,372 |
|
|
Unrealized foreign currency transaction gains (loss) |
|
211 |
|
|
|
404 |
|
|
|
(524 |
) |
|
Equity in net loss of affiliate and related impairment loss |
|
530 |
|
|
|
6,787 |
|
|
|
1,411 |
|
|
Changes in operating assets and liabilities, excluding effects from acquisitions: |
|
|
|
|
|
|
|
|
|
|
|
|
Accounts receivable |
|
9,602 |
|
|
|
(4,855 |
) |
|
|
(6,447 |
) |
|
Inventories |
|
1,017 |
|
|
|
5,435 |
|
|
|
(6,516 |
) |
|
Prepaid expenses and other current assets |
|
362 |
|
|
|
(10,078 |
) |
|
|
(4,607 |
) |
|
Accounts payable |
|
(16,440 |
) |
|
|
1,876 |
|
|
|
5,068 |
|
|
Accrued liabilities |
|
3,975 |
|
|
|
(20,830 |
) |
|
|
7,804 |
|
|
Deferred revenue |
|
1,905 |
|
|
|
6,153 |
|
|
|
7,044 |
|
|
Operating lease liabilities |
|
(8,237 |
) |
|
|
- |
|
|
|
- |
|
|
Other |
|
388 |
|
|
|
366 |
|
|
|
8 |
|
|
NET CASH PROVIDED BY OPERATING ACTIVITIES |
|
11,544 |
|
|
|
47,740 |
|
|
|
66,894 |
|
|
CASH FLOWS FROM INVESTING ACTIVITIES: |
|
|
|
|
|
|
|
|
|
|
|
|
Proceeds from maturities and sale of marketable securities |
|
37,055 |
|
|
|
56,358 |
|
|
|
22,382 |
|
|
Purchases of marketable securities |
|
(19,543 |
) |
|
|
(50,364 |
) |
|
|
(38,077 |
) |
|
Capital expenditures |
|
(22,192 |
) |
|
|
(12,007 |
) |
|
|
(8,339 |
) |
|
Acquisitions, net of cash acquired |
|
(60,652 |
) |
|
|
(13,031 |
) |
|
|
- |
|
|
Equity investments in and advances to affiliate |
|
(530 |
) |
|
|
(2,631 |
) |
|
|
(2,281 |
) |
|
Other |
|
164 |
|
|
|
(110 |
) |
|
|
(136 |
) |
|
NET CASH USED IN INVESTING ACTIVITIES |
|
(65,698 |
) |
|
|
(21,785 |
) |
|
|
(26,451 |
) |
|
CASH FLOWS FROM FINANCING ACTIVITIES: |
|
|
|
|
|
|
|
|
|
|
|
|
Taxes paid related to net share settlement of vested equity awards |
|
(2,007 |
) |
|
|
(3,603 |
) |
|
|
(2,594 |
) |
|
Proceeds from exercise of stock options |
|
1,870 |
|
|
|
124 |
|
|
|
330 |
|
|
Proceeds from issuance of 2025 Convertible Notes |
|
- |
|
|
|
230,000 |
|
|
|
- |
|
|
Payment of debt issuance costs of 2025 Convertible Notes |
|
- |
|
|
|
(7,305 |
) |
|
|
- |
|
|
Purchase of capped call on 2025 Convertible Notes |
|
- |
|
|
|
(21,160 |
) |
|
|
- |
|
|
Repurchase of 2020 Convertible Notes |
|
(94,683 |
) |
|
|
(53,683 |
) |
|
|
- |
|
|
Proceeds from unwind of note hedges and warrants on 2020 Convertible Notes |
|
- |
|
|
|
3,122 |
|
|
|
|
|
|
Repurchases of common stock |
|
- |
|
|
|
(49,000 |
) |
|
|
- |
|
|
NET CASH PROVIDED BY (USED IN) FINANCING ACTIVITIES |
|
(94,820 |
) |
|
|
98,495 |
|
|
|
(2,264 |
) |
|
EFFECT OF EXCHANGE RATE CHANGES ON CASH |
|
(122 |
) |
|
|
(553 |
) |
|
|
718 |
|
|
Net change in cash and cash equivalents |
|
(149,096 |
) |
|
|
123,897 |
|
|
|
38,897 |
|
|
Cash and cash equivalents at beginning of year |
|
256,500 |
|
|
|
132,603 |
|
|
|
93,706 |
|
|
Cash and cash equivalents at end of year |
$ |
107,404 |
|
|
$ |
256,500 |
|
|
$ |
132,603 |
|
See accompanying notes to consolidated financial statements.
61
CALAMP CORP.
NOTES TO CONSOLIDATED FINANCIAL STATEMENTS
NOTE 1 – DESCRIPTION OF BUSINESS AND SUMMARY OF SIGNIFICANT ACCOUNTING POLICIES
Description of Business
CalAmp Corp. (referred to herein as “CalAmp”, “the Company”, “we”, “our”, or “us”) is a global technology solutions pioneer leading transformation to a mobile connected economy. We help reinvent businesses and improve lives around the globe with technology solutions that streamline complex mobile Internet of Things (“IoT”) deployments through wireless connectivity solutions and derived data intelligence. Our software applications, scalable cloud services, and intelligent devices collect and assess business-critical data anywhere in the world from industrial machines, commercial and passenger vehicles, their drivers and contents. We are a global organization that is headquartered in Irvine, California. We operate under two reportable segments: Telematics Systems and Software & Subscription Services.
On February 25, 2019, we completed our acquisition of Tracker Network (UK) Limited (“Tracker UK”), a LoJack licensee and a market leader in stolen vehicle recovery (“SVR”) telematics services across the United Kingdom, for a cash purchase price of approximately $13.0 million. On March 18, 2019, we acquired Car Track, S.A. de C.V. (“LoJack Mexico”), the exclusive licensee of LoJack technology for the Mexican market and former customer. We purchased the 87.5% of the LoJack Mexico shares not currently owned by us for a purchase price, net of cash on hand, of approximately $13.0 million. On April 12, 2019, we acquired Synovia Solutions (“Synovia”), a North American market leader in fleet safety and management for K-12 school bus and state and local government fleets for a purchase price, net of cash on hand, of $49.8 million. Synovia was a customer prior to our acquisition. These acquisitions expand our fleet management and vehicle safety services portfolio and accelerate our transformation to high-value subscription-based services.
Subsequent Events
We have evaluated subsequent events through May 5, 2020, which is the date our financial statements were included in the Annual Report on Form 10-K.
In March 2020, the World Health Organization declared COVID-19 as a pandemic. The full impact of the COVID-19 outbreak is inherently uncertain at the time of this report. The pandemic has resulted in travel restrictions and in some cases, prohibitions of non-essential activities, disruption and shutdown of businesses and greater uncertainty in global financial markets. We cannot predict the extent to which the COVID-19 outbreak will negatively impact our business or operating results at this time.
We have considered all known and reasonably available information that existed as of February 29, 2020, in making accounting judgements, estimates and disclosures. We are monitoring the potential effects of the health care related and economic conditions of COVID-19 in assessing certain matters including (but not limited to) supply chain disruptions, decreases in customer demand for our products and services, potential longer-term effects on our customer and distribution channels particularly in the U.S. and relevant end markets as well as other developments. If the impact results in longer-term closures of businesses and economic recessionary conditions, we may recognize additional material asset impairments and charges for uncollectible accounts receivable in future periods. Currently, we estimate that the existing cash, future cash flows and available borrowings under our revolving credit facility will provide sufficient cash flows for at least twelve months after the issuance date of the consolidated financial statements.
Principles of Consolidation
Our consolidated financial statements include the accounts of CalAmp Corp. (a Delaware corporation) and all of our wholly-owned subsidiaries. All intercompany transactions and accounts have been eliminated in consolidation.
62
The preparation of financial statements in conformity with accounting principles generally accepted in the United States (“U.S. GAAP”) requires us to make estimates and assumptions that affect the amounts reported in the consolidated financial statements and accompanying notes. Actual results may differ from those estimates and assumptions. Significant items subject to such estimates and assumptions include allowances for doubtful accounts; charges for excess and obsolete inventory; deferred income tax asset valuation allowances; goodwill and other long-lived assets; intellectual property and accrued royalties; stock-based compensation; legal contingencies and revenue recognition. The current COVID-19 pandemic and general economic environment, and our supplier and customer concentrations also increase the degree of uncertainty inherent in these estimates and assumptions.
Revenue Recognition and Related Judgements
We recognize revenue under ASC 606, Revenue from Contracts with Customers (“ASC 606”), which provides a five-step analytical framework for transactions to determine when and how revenue is recognized. The core principle is that a company should recognize revenue to depict the transfer of promised goods or services to customers in an amount that reflects the consideration to which the entity expects to be entitled in exchange for those goods or services. In order to adhere to this core principle, we apply the following five-step approach:
|
|
• |
identify the contract with a customer; |
|
|
• |
identify the performance obligations in the contract; |
|
|
• |
determine the transaction price; |
|
|
• |
allocate the transaction price to the performance obligations in the contract; and |
|
|
• |
recognize revenue when (or as) we satisfy a performance obligation. |
We only apply the five-step model to contracts when it is probable that we will collect the consideration we are entitled to in exchange for goods or services we transfer to the customer.
Products. We recognize revenue from product sales upon transfer of control of promised products to customers in an amount that reflects the transaction price, which is generally the stand-alone selling prices of the promised goods. For product shipments made on the basis of “FOB Destination” terms, revenue is recorded when the products reach the customer. Customers generally do not have a right of return except for defective products returned during the warranty period. We record estimated commitments related to customer incentive programs as reductions of revenues.
Software-as-a-Service (“SaaS”). We recognize the following revenues and related cost of revenues in our Application subscriptions and related products and service revenues and cost of revenues because we enter into arrangements that combine various hardware devices as well as installation and notification services that are provided over a stipulated service period.
Our integrated SaaS-based solutions for our fleet management, vehicle finance and certain other verticals provide our customers with the ability to wirelessly communicate with monitoring devices installed in vehicles and other mobile or remote assets through our software applications. The transaction price for a typical SaaS arrangement includes the price for the customized device, installation and application subscriptions. We have applied our judgment in determining that these integrated arrangements typically represent single performance obligations satisfied over time.
Accordingly, we defer the recognition of revenue for the customized devices that only function with our applications and are sold only on an integrated basis with our proprietary applicable subscriptions. Such customized devices and the application services are not sold separately. In such circumstances, the associated device related costs are recorded as deferred costs on the balance sheet. The upfront fees for the devices are not distinct from the subscription service and are combined into the subscription service performance obligation. Generally, these service arrangements do not provide the customer with the right to take possession of the software supporting the subscription service at any time. Revenues from subscription services are recognized ratably on a straight-line basis over the term of the subscription. The deferred revenue and deferred cost amounts are amortized to application subscriptions and related products and other services revenue and cost of revenue, respectively, on a straight-line basis over the estimated
63
average in-service lives of these devices, which are three years in the vehicle finance and four years in the fleet management verticals. In certain fleet management contracts, we provide devices as part of the subscription contracts but we retain control of such devices. Under such arrangements, the cost of the devices is capitalized as property and equipment and depreciated over the estimated useful life of three to five years. The related subscription revenues of these arrangements are recognized as services are rendered. Our deferred revenue under ASC 606 also includes prepayments from our customers for various subscription services but does not include future subscription fees associated with customers’ unexercised contract renewal rights.
Accessories may also be sold to these customers. We recognize revenue for sales of accessories upon transfer of control to the customer based on estimated stand-alone selling prices.
In certain customer arrangements, we sell or lease vehicle location devices together with related monitoring services as part of the contractual arrangement. The devices leased to our customers are capitalized as property and equipment and being depreciated over the life of the devices. From time to time we sell devices and monitoring services separately to customers and sell similar devices on a stand-alone basis to licensees. Accordingly, we recognize revenues for the sales of the devices upon transfer of control to the customer and recognize revenue for the related monitoring services over the service period. The allocation of the transaction price is based on estimated stand-alone selling prices for the devices and the monitoring services.
Deferred revenues consist primarily of the deferred amounts on integrated SaaS solutions and advance payments for monitoring services.
Professional Services. We also provide various professional services to customers. These include project management, engineering services, installation services and an on-going early warning automated notification service, which are typically distinct from other performance obligations and are recognized as the related services are performed. For certain professional service contracts, we recognize revenue based on the proportion of total costs incurred to-date over the estimated cost of the contract, which is an input method.
Sales Taxes. We exclude from the measurement of the transaction price all taxes assessed by a governmental authority that are both imposed on and concurrent with a specific revenue-producing transaction and collected by us from a customer.
Contract Balances. Timing of revenue recognition may differ from the timing on our invoicing to customers. Contract liabilities are comprised of billings or payments received from our customers in advance of performance under the contract. We refer to these contract liabilities as “Deferred Revenues” in the accompanying consolidated financial statements. During fiscal year ended February 29, 2020, we recognized $23.8 million in revenue from the deferred revenue balance of $51.4 million as of March 1, 2019. Certain incremental costs of obtaining a contract with a customer consist of sales commissions, which are recognized on a straight-line basis over the life of the corresponding contracts. Prepaid sales commissions included in Prepaid expenses and other current assets and Other assets amounted to $2.0 million and $2.3 million, respectively, as of February 29, 2020. Prepaid sales commissions in Prepaid expenses and other current assets are expected to be amortized within the next 12 months.
64
We disaggregate revenue from contracts with customers into reportable segments, geography, type of goods and services and timing of revenue recognition. See Note 20 for our revenue by segment and geography. The disaggregation of revenue by type of goods and services and by timing of revenue recognition was as follows (in thousands):
|
|
Year Ended February 29/28, |
|
|||||
|
|
2020 |
|
|
2019 |
|
||
|
Revenue by type of goods and services: |
|
|
|
|
|
|
|
|
Telematics devices and accessories |
$ |
258,449 |
|
|
$ |
295,750 |
|
|
Rental income and other services |
|
24,415 |
|
|
|
13,293 |
|
|
Recurring application subscriptions |
|
83,243 |
|
|
|
54,757 |
|
|
Total |
$ |
366,107 |
|
|
$ |
363,800 |
|
|
|
|
|
|
|
|
|
|
|
Revenue by timing of revenue recognition: |
|
|
|
|
|
|
|
|
Revenue recognized at a point in time |
$ |
279,880 |
|
|
$ |
300,378 |
|
|
Revenue recognized over time |
|
86,227 |
|
|
|
63,422 |
|
|
Total |
$ |
366,107 |
|
|
$ |
363,800 |
|
Product revenues presented in the table above include devices sold in customer arrangements that include both the device and monitoring services. Recurring application subscriptions revenues include the amortization for customized devices functional only with application subscriptions.
We adopted ASC 606 under the modified retrospective method on March 1, 2018, and therefore we did not present comparative information for the fiscal year ended February 28, 2018.
Remaining performance obligations represents contracted revenue that has not yet been recognized, which includes deferred revenue on our consolidated balance sheets and unbilled amounts that will be recognized as revenue in future periods. As of February 29, 2020 and February 28, 2019, we have estimated remaining performance obligations for contractually committed revenues of $134.5 million and $51.4 million respectively. As of February 29, 2020, we expect to recognize approximately 44% in fiscal 2021 and 26% in fiscal 2022. As of February 28, 2019, we expected to recognize approximately 48% in fiscal 2020 and 29% in fiscal 2022. We have utilized the practical expedient exception within ASC 606 and exclude contracts that have original durations of less than one year from the aforementioned remaining performance obligation disclosure.
Cash and Cash Equivalents
We consider all highly liquid investments with maturities at date of purchase of three months or less to be cash equivalents.
Concentrations of Credit Risk
Financial instruments that potentially subject us to concentrations of credit risk consist principally of cash equivalents, marketable debt securities and trade accounts receivable.
Cash and cash equivalents as well as investments are maintained with several financial institutions. Deposits held with banks may exceed the federally insured limits. These deposits are maintained with reputable financial institutions and are redeemable upon demand. We have not experienced any losses in such accounts.
65
Accounts Receivable and Allowance for Doubtful Accounts
Accounts receivable consists of amounts due to us from sales arrangements executed in our normal business activities and are recorded at invoiced amounts. We typically require payment from customers within between 30 to 60 days of our invoice date with a few exceptions that extend the credit terms up to 90 days and we do not offer financing options. We present the aggregate accounts receivable balance net of an allowance for doubtful accounts. Generally, collateral and other security is not obtained for outstanding accounts receivable. Credit losses, if any, are recognized based on management’s evaluation of historical collection experience, customer-specific financial conditions as well as an evaluation of current industry trends and general economic conditions. The current global economic and business conditions attributable to COVID-19 may have an unfavorable impact on our customers and impact our ability to collect on outstanding accounts receivable. Past due balances are assessed by management on a periodic basis and balances are written off when the customer’s financial condition no longer warrants pursuit of collection. Although we expect to collect amounts due, actual collections may differ from estimated amounts.
Inventories
Inventories are stated at the lower of cost (using the first-in, first-out method) or market (net realizable value). Inventories are reviewed for excess quantities and obsolescence based upon demand forecasts for a specific time horizon. We record a charge to cost of revenues for the amount required to reduce the carrying value of inventory to estimated net realizable value. Ongoing changes in cellular carrier technology, supplier changes, closure of our warehouse facilities, changes in demand or significant reductions in product pricing may necessitate additional write-downs of inventory carrying value in the future, which could be material.
Property and equipment
Property and equipment are recorded at cost and depreciated using the straight-line method over the respective estimated useful lives of the assets ranging from two to ten years. Leasehold improvements are amortized using the straight-line method over the lesser of the lease term or the estimated useful life of the assets. Maintenance and repairs are expensed as incurred.
We capitalize certain costs incurred in connection with developing or obtaining internal-use software and software embedded in our products. These costs are recorded as property and equipment in our consolidated balance sheets and are amortized over useful lives ranging from three to seven years. The devices leased to our customers are capitalized as property and equipment and being depreciated over the life of the devices.
Business Combinations
The purchase price of an acquisition is allocated to the underlying assets acquired and liabilities assumed based upon their estimated fair value at the date of acquisition. To the extent the purchase price exceeds the fair value of the net identifiable tangible and intangible assets acquired and liabilities assumed, such excess is allocated to goodwill. We determine the estimated fair values after review and consideration of relevant information, including discounted cash flows, quoted market prices and other estimates made by management. We may refine the preliminary purchase price allocation, as necessary, during the measurement period of up to one year after the acquisition closing date as we obtain more information as to facts and circumstances existing at the acquisition date impacting the asset valuations and liabilities assumed. Goodwill acquired in business combinations is assigned to the reporting unit expected to benefit from the combination as of the acquisition date. Acquisition-related costs are recognized separately from the acquisition and are expensed as incurred.
Goodwill and Long-lived Assets
Goodwill represents the excess of the purchase price over the fair value of net assets acquired in a business combination. We test goodwill for impairment in accordance with the provisions of ASC 350, Intangibles – Goodwill and Other, (“ASC 350”). Goodwill is tested for impairment at least annually at the reporting unit level or whenever events or changes in circumstances indicate that goodwill might be impaired. ASC 350 provides that an entity has the option to first assess qualitative factors to determine whether the existence of events or circumstances leads to a determination that it is more likely than not that the fair value of a reporting unit is less than its carrying amount. If,
66
after assessing the totality of events or circumstances, an entity determines it is not more likely than not that the fair value of a reporting unit is less than its carrying amount, then additional impairment testing is not required. However, if an entity concludes otherwise, then it is required to perform an impairment test. Prior to the fourth quarter of fiscal 2020, our two operating segments, Telematics Systems and Software & Subscription Services, also represented our two reporting units for goodwill impairment testing. During the fourth quarter, we changed our reporting structure, resulting in four reporting units with two reporting units under each of our operating segments.
In accordance with Accounting Standards Update 2017-04, Simplifying the Test for Goodwill Impairment (“ASU 2017-04”), which we adopted in the fourth quarter of fiscal 2020, the impairment test involves comparing the estimated fair value of a reporting unit with its book value, including goodwill. If the estimated fair value exceeds book value, goodwill is considered not to be impaired. If, however, the fair value of the reporting unit is less than book value, then an impairment loss is recognized in an amount equal to the amount that the book value of the reporting unit exceeds its fair value, not to exceed the total amount of goodwill allocated to the reporting unit.
Long-lived assets to be held and used, including identifiable intangible assets, are reviewed for impairment whenever events or changes in circumstances indicate that the carrying amount of an asset may not be fully recoverable. These events or changes in circumstances may include a significant deterioration of operating results, changes in business plans or changes in anticipated future cash flows. If an impairment indicator is present, we evaluate recoverability by a comparison of the carrying amount of the assets or asset group to future undiscounted net cash flows expected to be generated by the lowest level of asset group. If the assets or asset group are impaired, the impairment recognized is measured by the amount by which the carrying amount exceeds the fair value of the assets. Fair value is generally determined by estimates of discounted cash flows. The discount rate used in any estimate of discounted cash flows would be the rate required for similar investment of like risk. In the fourth quarter of fiscal 2020, we determined that the prolonged secular decline in revenues from our legacy LoJack US SVR products coupled with the slower than anticipated market penetration of our telematics solutions in the U.S. automotive dealership channel represented determinate indications of impairment. These factors were further exacerbated by the immediate unfavorable impact that the COVID-19 pandemic has had on the automotive end markets commencing in February 2020. As a result, we initiated an assessment of the carrying amount of the related intangible and long-lived assets supporting these products including the LoJack tradename and dealer and customer relationships.
The recoverability assessment with respect to each of the tradenames used in our operations requires us to estimate the fair value of the asset as of the assessment date. Such determination is made using discounted cash flow techniques (Level 3 determination of fair value). Significant inputs to the valuation model include:
|
|
• |
future revenue and profitability projections associated with the tradename through relief of royalty approach; |
|
|
• |
estimated market royalty rates that could be derived from the licensing of our tradenames to third parties in order to establish the cash flows accruing to the benefit of the Company as a result of our ownership of our tradenames; and |
|
|
• |
rate used to discount the estimated royalty cash flow projections to their present value (or estimated fair value). |
We estimate the fair value of goodwill and other long-lived assets other than tradenames based on discounted cash flow techniques (Level 3 determination of fair value). Significant inputs to the valuation model include:
|
|
• |
estimated future cash flows; |
|
|
• |
growth assumptions for future revenues as well as future gross margin rates, expense rates, capital expenditures and other estimates; and |
|
|
• |
rate used to discount our estimated future cash flow projections to their present value (or estimated fair value) based on our estimated weighted average cost of capital. |
67
Based upon our assessment of economic conditions, our expectations of future business conditions and trends, our projected revenues, earnings, and cash flows, we determined that certain of our long-lived assets utilized in our LoJack US SVR reporting unit were impaired in fiscal year 2020 as follows (in thousands):
|
|
Year Ended February 29, 2020 |
|
|
|
Other intangible assets: |
|
|
|
|
Tradenames |
$ |
11,540 |
|
|
Dealer and customer relationships |
|
6,194 |
|
|
Property and equipment |
|
514 |
|
|
Operating lease right-of-use assets and related liabilities |
|
895 |
|
|
Total |
$ |
19,143 |
|
There was no impairment of goodwill for fiscal 2020 and fiscal 2019. The fair value of the LoJack US SVR reporting unit exceeds its carrying amount by approximately 8% as of February 29, 2020. Any deterioration in future cash flows of this reporting unit may result in impairment of its goodwill, which had a carrying value of approximately $12 million as of February 29, 2020. Any reduction in the revenue forecast utilized for the impairment test of the LoJack tradename, which had a carrying value of $10.5 million as of February 29, 2020, may also result in additional impairment. Our stock price has declined subsequent to year-end because of COVID-19 and other market factors. We will evaluate if this decline is more than temporary as an impairment indicator for assessing the carrying amount of our goodwill and long-lived assets in future periods.
Fair Value Measurements
Our cash equivalents, accounts receivable, accounts payable and accrued expenses approximate fair value due to the short-term maturities of these items. Our marketable securities are measured at fair value on a recurring basis.
The framework for measuring fair value and related disclosure requirements about fair value measurements are provided in ASC 820, Fair Value Measurements (ASC 820). This pronouncement defines fair value as the price that would be received to sell an asset or paid to transfer a liability in the principal or most advantageous market for the asset or liability in an orderly transaction between market participants on the measurement date. The fair value hierarchy proscribed by ASC 820 contains three levels as follows:
Level 1 – Quoted prices in active markets for identical assets or liabilities.
Level 2 – Observable inputs other than quoted prices in active markets for identical assets or liabilities, quoted prices for identical or similar assets or liabilities in inactive markets, or other inputs that are observable or can be corroborated by observable market data for substantially the full term of the assets or liabilities.
Level 3 – Inputs that are generally unobservable and typically reflect management’s estimate of assumptions that market participants would use in pricing the asset or liability.
Convertible Senior Notes and Capped Call Transactions
We account for our convertible senior notes as separate liability and equity components. We determine the carrying amount of the liability component based on the estimated fair value of a similar debt instrument excluding the embedded conversion option at the issuance date. The carrying amount of the equity component representing the conversion option is calculated by deducting the carrying value of the liability component from the principal amount of the notes as a whole. This difference represents a debt discount that is amortized to interest expense over the term of the notes using the effective interest rate method. The equity component of the notes is included in stockholders’ equity and is not remeasured as long as it continues to meet the conditions for equity classification. We allocate transaction costs related to the issuance of the notes to the liability and equity components using the same proportions as the initial carrying value of the notes. Transaction costs attributable to the liability component are being amortized to interest expense using the effective interest method over the respective term of the notes, and transaction costs attributable to the equity components are netted with the equity component of the note in stockholders’ equity. We account for the cost of the capped calls as a reduction to additional paid-in capital.
68
Research and Development Costs
Research and development costs are expensed as incurred. In certain cases, costs are incurred to purchase materials and equipment for future use in research and development efforts. In such cases, these costs are capitalized and expensed as consumed.
Product Warranty
All products have a one- or two-year limited warranty against manufacturing defects and workmanship. We estimate the future costs relating to product returns subject to our warranty and record a reserve upon shipment of our products. We periodically adjust our estimates for actual warranty claims, historical claims experience as well as the impact of known product quality issues.
Patent Litigation and Other Contingencies
We accrue for patent litigation and other contingencies whenever we determine that an unfavorable outcome is probable and a liability is reasonably estimable. The amount of the accrual is estimated based on a review of each claim, including the type and facts of the claim and our assessment of the merits of the claim. These accruals are reviewed at least on a quarterly basis and are adjusted to reflect the impact of recent negotiations, settlements, court rulings, advice from legal counsel and other events pertaining to the case. Such accruals, if any, are recorded as general and administrative expense in our consolidated statements of comprehensive income (loss). Although we take considerable measures to mitigate our exposure in these matters, litigation is unpredictable; however, we believe that we have valid defenses with respect to pending legal matters against us as well as adequate provisions for probable and estimable losses. All costs for legal services are expensed as incurred.
Income Taxes
We use the asset and liability method when accounting for income taxes. Under this method, deferred income tax assets and liabilities are recognized for future tax consequences attributable to difference between the financial statement carrying amounts of existing assets and liabilities and their respective tax bases and operating loss and tax credit carryforwards. Deferred tax assets and liabilities are measured using enacted tax rates expected to apply to the taxable income in the years in which those temporary differences are expected to be recovered or settled. The effect on deferred tax assets and liabilities of a change in tax rates is recognized in income in the period that includes the enactment date. Under U.S. GAAP we are allowed to make an accounting policy choice to either: (1) treat taxes due on future GILTI inclusions in U.S. taxable income as a current-period expense when incurred (the “period cost method”); or (2) factor in such amounts into our measurement of our deferred taxes (the “deferred method”). We have elected to account for GILTI as a period cost in the year the tax is incurred. Accordingly, no GILTI-related deferred amounts were recorded. We recognize the effect of income tax positions only if those positions are more likely than not of being sustained. Changes in recognition or measurement are reflected in the period in which the change in judgement occurs. Valuation allowances are provided against net deferred tax assets when it is determined that it is more likely than not that the assets will not be realized. In assessing valuation allowances, we review historical and future expected operating results and other factors, including cumulative earnings experience, expectations of future taxable income by jurisdiction and the carryforward periods available for reporting purposes.
In the fourth quarter of fiscal 2020, management assessed the available positive and negative evidence to estimate whether sufficient future taxable income will be generated to permit the use of the existing net deferred tax assets. Due to our recent decrease in profitability, three-year cumulative loss position considering forecasts of future profitability and weighing all other positive and negative objective evidence, we determined that it is more likely than not that our domestic net deferred tax assets will not be realized, as such a valuation allowance against our domestic net deferred tax assets was established during the three months ended February 29, 2020. The amount of the deferred tax assets considered realizable, however, could be adjusted in future periods in the event sufficient evidence is present to support a conclusion that it is more likely than not that all or a portion of our domestic deferred tax assets will be realized.
We recognize interest and/or penalties related to uncertain tax positions in income tax expense.
69
We translate the assets and liabilities of our non-U.S. dollar functional currency subsidiaries into U.S. dollars using exchange rates in effect at the end of each period. Revenue and expenses for these subsidiaries are translated using rates that approximate those in effect during the period. Gains and losses from these translations are recognized in foreign currency translation included in Accumulated Other Comprehensive Income (Loss) during the period. The aggregate foreign currency transaction exchange rate gain (losses) included in determining income (loss) before income taxes were $(0.2) million, $(0.4) million and $0.5 million in fiscal years 2020, 2019 and 2018, respectively.
Stock-Based Compensation
Our stock-based compensation expense resulting from grants of employee stock options, restricted stock and restricted stock units is recognized in the consolidated financial statements based on the respective grant date fair values of the awards. We use the Black-Scholes option-pricing method for valuing stock options and shares granted under the employee stock purchase plan and recognize the expense over a requisite service (vesting) period using the straight-line method. Restricted stock units, or RSUs, are valued based on the fair value of our common stock on the date of grant. The measurement of stock-based compensation is based on several criteria such as the type of equity award, the valuation model used and associated input factors including the expected term of the award, stock price volatility, risk free interest rate and forfeiture rate. Certain of these inputs are subjective and are determined based in part on management's judgment. We account for forfeitures as they occur, rather than estimating expected forfeitures over the course of a vesting period.
Other Comprehensive Income (Loss)
Other comprehensive income (loss) consists of two components, net income (loss) and other comprehensive income (loss) (“OCI”). OCI refers to revenue, expenses and gains and losses that under U.S. GAAP are recorded as an element of stockholders’ equity and excluded from net income (loss). Our OCI consists of foreign currency translation adjustments from those subsidiaries not using the U.S. dollar as their functional currency.
Recently Issued Accounting Standards Not Yet Adopted
In December 2019, the Financial Accounting Standards Board (“FASB”) issued ASU No. 2019-12, Income Taxes (Topic 740): Simplifying the Accounting for Income Taxes. This ASU removes certain exceptions for recognizing deferred taxes for investments, performing intraperiod allocation, and calculating income taxes in interim periods. This ASU also adds guidance to reduce complexity in certain areas, including recognizing deferred taxes for goodwill and allocating taxes to members of a consolidated group. The updated guidance is effective for fiscal years, and interim periods within those fiscal years, beginning after December 15, 2020 with early adoption permitted. We are currently assessing the impact that adopting this new standard will have on our consolidated financial statements and footnote disclosures.
In August 2018, the FASB issued Accounting Standards Update 2018-15, Customer’s Accounting for Implementation Costs Incurred in a Cloud Computing Arrangement That is a Service Contract (“ASU 2018-15”). The amendments in ASU 2018-15 provide guidance to align the requirements for capitalizing implementation costs incurred in a hosting arrangement that is a service contract with the requirements for capitalizing implementation costs incurred to develop or obtain internal-use software (and hosting arrangements that include an internal-use software license). The accounting for the service element of a hosting arrangement that is a service contract is not affected by this update. We are required to adopt this standard on March 1, 2020, the beginning of our fiscal 2021. We do not anticipate this pronouncement will have a significant impact on our consolidated financial statements upon adoption.
In June 2016, the FASB issued ASU 2016-13, Financial Instruments - Credit Losses (Topic 326): Measurement of Credit Losses on Financial Instruments. The new standard amends the impairment model to utilize an expected loss methodology in place of the currently used incurred loss methodology. As a result, we will be required to use a forward-looking expected credit loss model for trade receivables. This pronouncement is effective for fiscal years beginning after December 15, 2019. We are required to adopt this standard on March 1, 2020, the beginning of our fiscal 2021. We do not anticipate this pronouncement will have a significant impact on our consolidated financial statements upon adoption.
70
Certain prior year amounts in Note 1 related to disaggregated revenue for contracts have been reclassified to conform to the fiscal 2020 presentation, with no effect on total amount.
NOTE 2 – ACQUISITIONS
We acquired Tracker UK, LoJack Mexico and Synovia in February 2019, March 2019 and April 2019, respectively. The following are the final purchase price allocations as of February 29, 2020 for the three acquisitions (in thousands):
|
|
|
Tracker UK |
|
|
LoJack Mexico |
|
|
Synovia |
|
|||||||||||||||
|
Purchase price |
|
|
|
|
|
$ |
13,097 |
|
|
|
|
|
|
$ |
14,306 |
|
|
|
|
|
|
$ |
29,500 |
|
|
Add debt paid at closing |
|
|
|
|
|
|
- |
|
|
|
|
|
|
|
- |
|
|
|
|
|
|
|
20,296 |
|
|
Less cash acquired, net of debt assumed |
|
|
|
|
|
|
(65 |
) |
|
|
|
|
|
|
(1,586 |
) |
|
|
|
|
|
|
(889 |
) |
|
Net cash paid |
|
|
|
|
|
|
13,032 |
|
|
|
|
|
|
|
12,720 |
|
|
|
|
|
|
|
48,907 |
|
|
Less provisional amount of working capital claim against escrowed consideration |
|
|
|
|
|
|
(973 |
) |
|
|
|
|
|
|
- |
|
|
|
|
|
|
|
- |
|
|
Net consideration |
|
|
|
|
|
|
12,059 |
|
|
|
|
|
|
|
12,720 |
|
|
|
|
|
|
|
48,907 |
|
|
Add previously held interest |
|
|
|
|
|
|
- |
|
|
|
|
|
|
|
2,021 |
|
|
|
|
|
|
|
- |
|
|
Fair value of net assets and liabilities assumed: |
|
|
|
|
|
|
|
|
|
|
|
|
|
|
|
|
|
|
|
|
|
|
|
|
|
Current assets other than cash |
|
$ |
3,549 |
|
|
|
|
|
|
$ |
4,537 |
|
|
|
|
|
|
$ |
9,637 |
|
|
|
|
|
|
Property and equipment |
|
|
1,008 |
|
|
|
|
|
|
|
3,652 |
|
|
|
|
|
|
|
24,840 |
|
|
|
|
|
|
Customer relationships |
|
|
2,354 |
|
|
|
|
|
|
|
7,000 |
|
|
|
|
|
|
|
16,700 |
|
|
|
|
|
|
Trade name |
|
|
2,354 |
|
|
|
|
|
|
|
- |
|
|
|
|
|
|
|
1,600 |
|
|
|
|
|
|
Developed technology |
|
|
1,830 |
|
|
|
|
|
|
|
- |
|
|
|
|
|
|
|
3,800 |
|
|
|
|
|
|
Deferred tax assets |
|
|
- |
|
|
|
|
|
|
|
- |
|
|
|
|
|
|
|
2,061 |
|
|
|
|
|
|
Other non-current assets |
|
|
104 |
|
|
|
|
|
|
|
1,301 |
|
|
|
|
|
|
|
177 |
|
|
|
|
|
|
Current liabilities |
|
|
(3,130 |
) |
|
|
|
|
|
|
(2,586 |
) |
|
|
|
|
|
|
(4,645 |
) |
|
|
|
|
|
Due to factors |
|
|
- |
|
|
|
|
|
|
|
- |
|
|
|
|
|
|
|
(19,692 |
) |
|
|
|
|
|
Deferred revenue |
|
|
(3,162 |
) |
|
|
|
|
|
|
(4,507 |
) |
|
|
|
|
|
|
(4,319 |
) |
|
|
|
|
|
Deferred tax liability |
|
|
(874 |
) |
|
|
|
|
|
|
(943 |
) |
|
|
|
|
|
|
- |
|
|
|
|
|
|
Other non-current liabilities |
|
|
(270 |
) |
|
|
|
|
|
|
- |
|
|
|
|
|
|
|
- |
|
|
|
|
|
|
Total fair value of net assets acquired |
|
|
|
|
|
|
3,763 |
|
|
|
|
|
|
|
8,454 |
|
|
|
|
|
|
|
30,159 |
|
|
Goodwill |
|
|
|
|
|
$ |
8,296 |
|
|
|
|
|
|
$ |
6,287 |
|
|
|
|
|
|
$ |
18,748 |
|
We paid a premium (i.e., goodwill) over the fair value of the net tangible and identified intangible assets acquired for the three acquisitions as we believe the extensive customer relationships with these businesses will expand our fleet management and vehicle safety services portfolio and increase our customer reach by gaining access to a base of high-value and low-churn subscribers in those geographic regions.
We incurred approximately $1.2 million for the acquisition of these entities in fiscal 2020 and $0.9 million in fiscal 2019. The acquisition-related costs were primarily legal expenses, which were recorded as part of our general and administrative expenses.
Pro forma financial information for the fiscal years ended February 29, 2020 and February 28, 2019 for the acquired companies is not disclosed as the results are not material to our consolidated financial statements.
71
Effective February 25, 2019, we acquired Tracker Network (UK) Limited, a LoJack licensee, for a total purchase price of £10.0 million, or approximately $13.0 million, which was funded from our cash on hand. As a result of the acquisition, Tracker UK became a wholly-owned subsidiary and was consolidated with our financial statements beginning February 25, 2019 as a component of our Software and Subscription Services reportable segment.
The goodwill arising from the acquisition of Tracker UK is not deductible for income tax purposes.
LoJack Mexico
On March 19, 2019, we acquired LoJack Mexico, the exclusive licensee of LoJack technology for the Mexican market. LoJack Mexico will leverage our telematics and software-as-a-service solutions to expand product offering to its substantial subscriber base as well as serve auto dealers and OEMs, insurance providers and leasing companies throughout Mexico. We purchased the remaining 87.5% of LoJack Mexico shares that we did not own for a cash purchase price of $14.3 million. Our previously held 12.5% equity interest in LoJack Mexico was determined to have a fair value of $2.0 million at acquisition date which resulted in a gain of $0.3 million, which was recorded as investment income in our consolidated statements of comprehensive income (loss) for the fiscal year ended February 29, 2020. LoJack Mexico is consolidated with our financial statements effective March 19, 2019 as a component of our Software & Subscription Services reportable segment.
The goodwill arising from the acquisition of LoJack Mexico is not deductible for income tax purposes.
Synovia
On April 12, 2019, we acquired Synovia, a North American market leader in fleet safety and management for K-12 school bus and state and local government fleets, for a total cash purchase price of $49.8 million. The Synovia acquisition expands our fleet management and vehicle safety services portfolio as well as accelerates our transformation to high-value subscription based services. Synovia is consolidated with our financial statements effective April 12, 2019 as a component of our Software & Subscription Services reportable segment.
The goodwill arising from the acquisition of Synovia is deductible for income tax purposes.
NOTE 3 – CONCENTRATION OF CUSTOMERS AND SUPPLIERS
Significant Customers
We sell telematics products to large global enterprises in the industrial equipment, telecommunications and automotive market verticals. Some of these customers accounted for more than 10% of our revenue or accounts receivable as follows:
|
|
Year Ended February 29/28, |
|
|||||||||
|
|
2020 |
|
|
2019 |
|
|
2018 |
|
|||
|
Net sales: |
|
|
|
|
|
|
|
|
|
|
|
|
Customer A |
|
14 |
% |
|
|
15 |
% |
|
|
12 |
% |
|
|
|
|
|
|
|
|
|
|
|
|
|
|
|
As of February 29/28, |
|
|||||||||
|
|
2020 |
|
|
2019 |
|
|
2018 |
|
|||
|
Accounts receivable: |
|
|
|
|
|
|
|
|
|
|
|
|
Customer A |
|
19 |
% |
|
|
14 |
% |
|
|
15 |
% |
|
Customer B |
|
8 |
% |
|
|
3 |
% |
|
|
13 |
% |
Customer B represents customers that are affiliated under common control.
72
We purchase a significant amount of our inventory from certain manufacturers or suppliers including components, assemblies and electronic manufacturing parts. These suppliers are located in Asia, including China. The inventory is purchased under standard supply agreements that outline the terms of the product delivery. The title and risk of loss of the product generally pass to us upon shipment from the manufacturers’ plant or warehouse. For the fiscal year ended February 29, 2020, four of our suppliers accounted for approximately 48% of our total inventory purchases and for the fiscal years ended February 28, 2019 and 2018, three of our suppliers accounted for approximately 57% and 58% of total inventory purchases, respectively. Some of these manufacturers accounted for more than 10% of accounts payable as follows:
|
|
As of February 29/28, |
|
|||||||||
|
|
2020 |
|
|
2019 |
|
|
2018 |
|
|||
|
Accounts Payable: |
|
|
|
|
|
|
|
|
|
|
|
|
Supplier A |
|
0 |
% |
|
|
30 |
% |
|
|
40 |
% |
|
Supplier B |
|
11 |
% |
|
|
18 |
% |
|
|
16 |
% |
|
Supplier C |
|
11 |
% |
|
|
0 |
% |
|
|
0 |
% |
We are currently reliant upon these suppliers for products. Although we believe that we can obtain products from other sources, the loss of a significant supplier could have a material impact on our financial condition and results of operations as the products that are being purchased may not be available on the same terms from another supplier.
NOTE 4 – CASH, CASH EQUIVALENTS AND INVESTMENTS
The following tables summarize our financial instrument assets (in thousands):
|
|
As of February 29, 2020 |
|
|||||||||||||||||||||
|
|
|
|
|
|
|
|
|
|
|
|
|
|
Balance Sheet Classification of Fair Value |
|
|||||||||
|
|
|
|
|
|
Unrealized |
|
|
|
|
|
|
Cash and |
|
|
Short-Term |
|
|
|
|
|
|||
|
|
|
|
|
|
Gains |
|
|
Fair |
|
|
Cash |
|
|
Marketable |
|
|
Other |
|
|||||
|
|
Cost |
|
|
(Losses) |
|
|
Value |
|
|
Equivalents |
|
|
Securities |
|
|
Assets |
|
||||||
|
Cash |
$ |
31,895 |
|
|
$ |
- |
|
|
$ |
31,895 |
|
|
$ |
31,895 |
|
|
$ |
- |
|
|
$ |
- |
|
|
Level 1: |
|
|
|
|
|
|
|
|
|
|
|
|
|
|
|
|
|
|
|
|
|
|
|
|
Money market funds |
|
5,508 |
|
|
|
- |
|
|
|
5,508 |
|
|
|
5,508 |
|
|
|
- |
|
|
|
- |
|
|
Mutual funds (1) |
|
3,926 |
|
|
|
26 |
|
|
|
3,952 |
|
|
|
- |
|
|
|
- |
|
|
|
3,952 |
|
|
Level 2: |
|
|
|
|
|
|
|
|
|
|
|
|
|
|
|
|
|
|
|
|
|
|
|
|
Repurchase agreements |
|
60,000 |
|
|
|
- |
|
|
|
60,000 |
|
|
|
60,000 |
|
|
|
- |
|
|
|
- |
|
|
Corporate bonds |
|
10,001 |
|
|
|
- |
|
|
|
10,001 |
|
|
|
10,001 |
|
|
|
- |
|
|
|
- |
|
|
Total |
$ |
111,330 |
|
|
$ |
26 |
|
|
$ |
111,356 |
|
|
$ |
107,404 |
|
|
$ |
- |
|
|
$ |
3,952 |
|
73
|
|
As of February 28, 2019 |
|
|||||||||||||||||||||
|
|
|
|
|
|
|
|
|
|
|
|
|
|
Balance Sheet Classification of Fair Value |
|
|||||||||
|
|
|
|
|
|
Unrealized |
|
|
|
|
|
|
Cash and |
|
|
Short-Term |
|
|
|
|
|
|||
|
|
|
|
|
|
Gains |
|
|
Fair |
|
|
Cash |
|
|
Marketable |
|
|
Other |
|
|||||
|
|
Cost |
|
|
(Losses) |
|
|
Value |
|
|
Equivalents |
|
|
Securities |
|
|
Assets |
|
||||||
|
Cash |
$ |
26,084 |
|
|
$ |
- |
|
|
$ |
26,084 |
|
|
$ |
26,084 |
|
|
$ |
- |
|
|
$ |
- |
|
|
Level 1: |
|
|
|
|
|
|
|
|
|
|
|
|
|
|
|
|
|
|
|
|
|
|
|
|
Money market funds |
|
154,428 |
|
|
|
- |
|
|
|
154,428 |
|
|
|
154,428 |
|
|
|
- |
|
|
|
- |
|
|
Mutual funds (1) |
|
6,023 |
|
|
|
390 |
|
|
|
6,413 |
|
|
|
- |
|
|
|
- |
|
|
|
6,413 |
|
|
International equities |
|
296 |
|
|
|
(73 |
) |
|
|
223 |
|
|
|
- |
|
|
|
- |
|
|
|
223 |
|
|
Level 2: |
|
|
|
|
|
|
|
|
|
|
|
|
|
|
|
|
|
|
|
|
|
|
|
|
Repurchase agreements |
|
72,000 |
|
|
|
- |
|
|
|
72,000 |
|
|
|
72,000 |
|
|
|
- |
|
|
|
- |
|
|
Corporate bonds |
|
21,502 |
|
|
|
(2 |
) |
|
|
21,500 |
|
|
|
3,988 |
|
|
|
17,512 |
|
|
|
- |
|
|
Total |
$ |
280,333 |
|
|
$ |
315 |
|
|
$ |
280,648 |
|
|
$ |
256,500 |
|
|
$ |
17,512 |
|
|
$ |
6,636 |
|
|
|
(1) |
Amounts represent various equities, bond and money market mutual funds held in a “Rabbi Trust” and are restricted for payment obligations to non-qualified deferred compensation plan participants. In addition to the mutual funds above, our “Rabbi Trust” also included Corporate-Owned Life Insurance (COLI) starting in fiscal 2020. As of February 29, 2020, the cash surrender value of COLI was $2.2 million. See Note 9 for discussion of the deferred compensation plan. |
NOTE 5 – ACCOUNTS RECEIVABLE
Accounts receivable consist of the following (in thousands):
|
|
|
February 29/28, |
|
|||||
|
|
|
2020 |
|
|
2019 |
|
||
|
Accounts receivable |
|
$ |
75,344 |
|
|
$ |
79,835 |
|
|
Allowance for doubtful accounts |
|
|
(3,071 |
) |
|
|
(1,756 |
) |
|
|
|
$ |
72,273 |
|
|
$ |
78,079 |
|
NOTE 6 – INVENTORIES
Inventories consist of the following (in thousands):
|
|
|
February 29/28, |
|
|||||
|
|
|
2020 |
|
|
2019 |
|
||
|
Raw materials |
|
$ |
18,118 |
|
|
$ |
14,141 |
|
|
Work in process |
|
|
- |
|
|
|
72 |
|
|
Finished goods |
|
|
18,660 |
|
|
|
17,820 |
|
|
|
|
$ |
36,778 |
|
|
$ |
32,033 |
|
74
NOTE 7 – PROPERTY AND EQUIPMENT
Property and equipment consist of the following (in thousands):
|
|
Useful |
|
February 29/28, |
|
|||||
|
|
Life |
|
2020 |
|
|
2019 |
|
||
|
Leasehold improvements |
5 - 10 years |
|
$ |
9,425 |
|
|
$ |
3,522 |
|
|
LoJack system components and law enforcement tracking units |
7 to 10 years |
|
|
17,096 |
|
|
|
20,326 |
|
|
Leased devices |
2 to 5 years |
|
|
30,646 |
|
|
|
- |
|
|
Plant equipment and tooling |
2 - 5 years |
|
|
13,026 |
|
|
|
13,078 |
|
|
Office equipment, computers and furniture |
3 - 5 years |
|
|
11,598 |
|
|
|
11,553 |
|
|
Software |
3 - 7 years |
|
|
50,760 |
|
|
|
31,349 |
|
|
|
|
|
|
132,551 |
|
|
|
79,828 |
|
|
Less accumulated depreciation and amortization |
|
|
|
(81,079 |
) |
|
|
(58,641 |
) |
|
|
|
|
|
51,472 |
|
|
|
21,187 |
|
|
Fixed assets not yet in service |
|
|
|
4,406 |
|
|
|
5,836 |
|
|
|
|
|
$ |
55,878 |
|
|
$ |
27,023 |
|
Depreciation expense was $19.7 million, $8.6 million, and $8.0 million in fiscal years ended February 29, 2020, February 28, 2019 and 2018, respectively.
A portion of the LoJack system components and law enforcement tracking units above represent the software development for and equipment attached to our tower infrastructure. During fiscal year ended February 29, 2020, we recorded impairment losses aggregating $0.5 million, which represented the net book value of tower equipment in various leases that were terminated or planned to be terminated. This impairment loss is included within the total Impairment loss shown separately in the operating expenses in our consolidated statement of comprehensive income (loss).
Fixed assets not yet in service consist primarily of capitalized internal-use software and certain tooling and other equipment that have not been placed into service.
NOTE 8 – GOODWILL AND OTHER INTANGIBLE ASSETS
Changes in goodwill are as follows (in thousands):
|
|
|
Telematics Systems |
|
|
Software & Subscription Services |
|
|
Total |
|
|||
|
Balance as of February 28, 2019 |
|
$ |
51,203 |
|
|
$ |
29,602 |
|
|
$ |
80,805 |
|
|
Acquisition of Tracker, Synovia and LoJack Mexico |
|
|
- |
|
|
|
25,810 |
|
|
|
25,810 |
|
|
Effect of exchange rate change on goodwill |
|
|
- |
|
|
|
(280 |
) |
|
|
(280 |
) |
|
Balance as of February 29, 2020 |
|
$ |
51,203 |
|
|
$ |
55,132 |
|
|
$ |
106,335 |
|
75
Other intangible assets are comprised as follows (in thousands, except years):
|
|
|
|
|
Gross |
|
|
Accumulated Amortization |
|
|
Effect of Foreign Currency Translation |
|
|
Net |
|
||||||||||||||||||||||||||||
|
|
|
Useful |
|
Feb. 28, |
|
|
Addi- |
|
|
Impair- |
|
|
Feb. 29, |
|
|
Feb. 28, |
|
|
|
|
|
|
Feb. 29, |
|
|
Feb. 29, |
|
|
Feb. 28, |
|
|
Feb. 29, |
|
|||||||||
|
|
|
Life |
|
2019 |
|
|
tions |
|
|
ment |
|
|
2020 |
|
|
2019 |
|
|
Expense |
|
|
2020 |
|
|
2020 |
|
|
2019 |
|
|
2020 |
|
||||||||||
|
Developed technology |
|
2-7 years |
|
$ |
23,603 |
|
|
|
3,800 |
|
|
|
- |
|
|
$ |
27,403 |
|
|
$ |
18,253 |
|
|
|
3,184 |
|
|
$ |
21,437 |
|
|
$ |
(40 |
) |
|
$ |
5,350 |
|
|
$ |
5,926 |
|
|
Tradenames |
|
10 years |
|
|
40,091 |
|
|
|
1,600 |
|
|
|
(11,540 |
) |
|
|
30,151 |
|
|
|
12,644 |
|
|
|
3,659 |
|
|
|
16,303 |
|
|
|
(58 |
) |
|
|
27,447 |
|
|
|
13,790 |
|
|
Customer lists |
|
4-7 years |
|
|
25,304 |
|
|
|
- |
|
|
|
- |
|
|
|
25,304 |
|
|
|
21,307 |
|
|
|
1,596 |
|
|
|
22,903 |
|
|
|
- |
|
|
|
3,997 |
|
|
|
2,401 |
|
|
Dealer and customer relationships |
|
7-12 years |
|
|
16,850 |
|
|
|
23,700 |
|
|
|
(6,194 |
) |
|
|
34,356 |
|
|
|
6,908 |
|
|
|
3,845 |
|
|
|
10,753 |
|
|
|
(217 |
) |
|
|
9,942 |
|
|
|
23,386 |
|
|
Patents |
|
5 years |
|
|
589 |
|
|
|
- |
|
|
|
- |
|
|
|
589 |
|
|
|
160 |
|
|
|
37 |
|
|
|
197 |
|
|
|
- |
|
|
|
429 |
|
|
|
392 |
|
|
|
|
|
|
$ |
106,437 |
|
|
$ |
29,100 |
|
|
$ |
(17,734 |
) |
|
$ |
117,803 |
|
|
$ |
59,272 |
|
|
$ |
12,321 |
|
|
$ |
71,593 |
|
|
$ |
(315 |
) |
|
$ |
47,165 |
|
|
$ |
45,895 |
|
Intangible assets with finite lives are amortized on a straight-line basis over the expected period to be benefited by future cash flows. We monitor and assess these assets for impairment on a periodic basis. Our assessment includes various new product lines and services, which leverage the existing intangible assets as well as consideration of historical and projected revenues and cash flows. In the fourth quarter of fiscal 2020, we determined that the prolonged secular decline in legacy LoJack US SVR products revenue coupled with the slower than anticipated market penetration of our telematics solutions in the U.S. automotive dealership channel represented determinate indications of impairment. As a result, we performed an assessment of the carrying amount of the related intangible assets supporting these products including the LoJack tradename and dealer and customer relationships. Our assessment of the future cash flows generates by these assets concluded that an impairment loss was present. For the fiscal year ended February 29, 2020, we recorded an impairment loss aggregating $17.7 million, which was attributable to $11.5 million of the LoJack Tradename and $6.2 million of US Dealer relationships. This impairment loss is included within the total Impairment loss shown separately in operating expenses in our consolidated statement of comprehensive income (loss).
Amortization expense of intangible assets was $12.3 million, $11.4 million and $15.0 million in fiscal years ended February 29, 2020, February 28, 2019 and 2018, respectively.
Estimated future amortization expense as of February 29, 2020 is as follows (in thousands):
|
2021 |
|
$ |
7,625 |
|
|
2022 |
|
|
5,990 |
|
|
2023 |
|
|
5,771 |
|
|
2024 |
|
|
4,539 |
|
|
2025 |
|
|
4,410 |
|
|
Thereafter |
|
|
17,560 |
|
|
|
|
$ |
45,895 |
|
NOTE 9 – OTHER ASSETS
Other assets consist of the following (in thousands):
|
|
|
February 29/28, |
|
|||||
|
|
|
2020 |
|
|
2019 |
|
||
|
Deferred product cost |
|
$ |
7,818 |
|
|
$ |
10,094 |
|
|
Deferred compensation plan assets |
|
|
6,041 |
|
|
|
6,413 |
|
|
Lease receivables, non-current |
|
|
5,992 |
|
|
|
- |
|
|
Prepaid commissions |
|
|
2,318 |
|
|
|
- |
|
|
Other |
|
|
2,599 |
|
|
|
6,003 |
|
|
|
|
$ |
24,768 |
|
|
$ |
22,510 |
|
76
We have a non-qualified deferred compensation plan in which certain members of management and all non-employee directors are eligible to participate. Participants may defer a portion of their compensation until retirement or another date specified by them in accordance with the plan. We are funding the plan obligations through cash deposits to a Rabbi Trust that are invested in various equity, bond, COLI and money market mutual funds in generally the same proportion as investment elections made by the participants. The deferred compensation plan liability is included in Other Non-Current Liabilities in the accompanying consolidated balance sheets.
In September 2015, we invested $2.2 million for a 49% minority ownership interest in Smart Driver Club Limited (“Smart Driver Club”), a technology and insurance startup company located in the United Kingdom. This investment was accounted for under the equity method since we had significant influence over the investee. Since September 2015 through March 2019, we made loans aggregating $8.0 million. We recognized equity in net loss of $5.3 million. As of February 28, 2019, we determined that this equity method investment was subject to other than temporary impairment. This decision was dictated by the continuing operating losses and deteriorating liquidity position of Smart Driver Club. Accordingly, we recorded an impairment charge of $5.0 million in fiscal 2019 and $0.5 million in March 2019.
NOTE 10 – FINANCING ARRANGEMENTS
Balances attributable to our financing arrangements consist of the following (in thousands):
|
|
|
Maturity |
|
Effective |
|
|
February 29/28, |
|
||||||
|
|
|
Date |
|
Interest Rate |
|
|
2020 |
|
|
2019 |
|
|||
|
2020 Convertible Notes, 1.625% fixed rate |
|
May 15, 2020 |
|
6.20% |
|
|
$ |
27,599 |
|
|
$ |
122,527 |
|
|
|
2025 Convertible Notes, 2.00% fixed rate |
|
August 1, 2025 |
|
7.56% |
|
|
|
230,000 |
|
|
|
230,000 |
|
|
|
Due to factors under revenue assignments |
|
2020 - 2024 |
|
4.70% |
|
|
|
14,371 |
|
|
|
- |
|
|
|
Total term debt |
|
|
|
|
|
|
|
|
271,970 |
|
|
|
352,527 |
|
|
Unamortized discount and issuance costs |
|
|
|
|
|
|
|
|
(61,763 |
) |
|
|
(76,622 |
) |
|
Less: current portion of long-term term debt |
|
|
|
|
|
|
|
|
(33,119 |
) |
|
|
- |
|
|
Long-term debt, net of current portion |
|
|
|
|
|
|
|
$ |
177,088 |
|
|
$ |
275,905 |
|
The effective interest rates for the convertible notes include the interest on the notes and debt discount. As of February 29, 2020 and February 28, 2019, the fair value of the convertible notes, based on Level 2 inputs, was $225 million and $303 million, respectively.
Revolving Credit Facility
On March 30, 2018, we entered into a revolving credit facility with J.P. Morgan Chase Bank that provides for borrowings of up to $50 million. This revolving credit facility was extended on March 27, 2020 with a new maturity date of March 30, 2022. At our election, the borrowings under this revolving credit facility bear interest at either a LIBOR-based variable rate plus an applicable margin, or at the greater of the Prime Rate, the NYFRB Rate plus an applicable margin rate and one-month LIBOR-based variable rate plus an applicable margin rate (each as defined in the Credit Agreement) determined based on our senior leverage ratio from time to time. The net proceeds available under the revolving credit facility can be used for working capital and general corporate purposes. There were no borrowings outstanding under this revolving credit facility at February 29, 2020.
The revolving credit facility contains certain negative and affirmative covenants including financial covenants that require us to maintain a minimum level of earnings before interest, income taxes, depreciation, amortization and other non-cash charges (Adjusted EBITDA) to interest ratio, a minimum senior indebtedness ratio and a total indebtedness coverage ratio, all measured on a quarterly basis. As of February 29, 2020, we were in compliance with our covenants under the revolving credit facility.
77
Convertible Senior Unsecured Notes
We have two outstanding convertible senior unsecured notes – a $27.6 million aggregate principal amount of convertible senior unsecured notes due in May 2020 (“2020 Convertible Notes”) and a $230.0 million aggregate principal amount of convertible senior unsecured notes due in August 2025 (“2025 Convertible Notes”, and collectively with the 2020 Convertible Notes, the “Notes”). The Notes are carried at their principal face amount, less unamortized debt discount and issuance costs, and are not carried at fair value at each period end.
Accounting guidance requires that convertible debt that can be settled for cash be separated into the liability and equity component at issuance and each be assigned a value. The value assigned to the liability component is the estimated fair value, as of the issuance date, of a similar debt without the conversion feature. The difference between the principal amount of the debt and the estimated fair value of the liability component, representing the value of the embedded conversion option assigned to the equity component, is recorded as a debt discount on the issuance date. The fair value of the liability component is generally determined using a discounted cash flow analysis, in which the projected interest and principal payments are discounted back to the issuance date at a market interest rate that represents a Level 3 fair value measurement. The debt discount is amortized to interest expense using the effective interest method with an effective interest rate equal to the aforementioned market interest rate over the term of the debt. The remaining gross proceeds net of the liability component represents the fair value of the embedded conversion feature that was recorded as an increase in additional paid-in capital within the stockholders’ equity section. The associated deferred tax effect was recorded as a reduction of additional paid-in capital. The amounts recorded in additional paid-in capital is not to be remeasured as long as the embedded conversion option continues to meet the conditions for equity classification. As of February 29, 2020, the Notes continue to meet the conditions for equity classification.
Further, the issuance costs related to the debt are also allocated to the liability and equity components based on the relative fair values. Issuance costs attributable to the liability component were recorded as a direct deduction from the carrying value of the debt and are being amortized to expense over the term of the debt using the effective interest method. The issuance costs attributable to the equity component were recorded as a charge to the additional paid-in capital within stockholders’ equity. Lastly, the deferred tax effect related to the equity component of the issuance costs was also recorded to additional paid-in capital as such costs are deductible for tax purposes.
The table below summarizes the liability and equity components of the Notes, the issuance costs and the applicable assumptions used for the calculation (in millions except initial conversion rate and per share amounts):
|
|
2020 Convertible Notes |
|
|
2025 Convertible Notes |
|
||
|
Initial conversion rate (shares per $1,000 principal amount) |
|
36.2398 |
|
|
|
32.5256 |
|
|
Initial conversion price per share |
$ |
27.5940 |
|
|
$ |
30.7450 |
|
|
|
|
|
|
|
|
|
|
|
Fair value of liability component upon issuance |
$ |
138.9 |
|
|
$ |
160.8 |
|
|
Fair value measurement level |
Level 3 |
|
|
Level 3 |
|
||
|
Fair value of embedded equity component upon issuance |
$ |
33.6 |
|
|
$ |
69.2 |
|
|
Deferred tax asset effect |
$ |
16.0 |
|
|
$ |
17.3 |
|
|
|
|
|
|
|
|
|
|
|
Total issuance cost |
$ |
4.3 |
|
|
$ |
7.3 |
|
|
Equity component |
$ |
1.0 |
|
|
$ |
2.2 |
|
|
Deferred tax asset effect |
$ |
0.4 |
|
|
$ |
0.5 |
|
2020 Convertible Notes
In May 2015, we issued $172.5 million aggregate principal amount of the 2020 Convertible Notes. The 2020 Convertible Notes are senior unsecured obligations and bear interest at a rate of 1.625% per year payable in cash on May 15 and November 15 of each year. The 2020 Convertible Notes mature on May 15, 2020 and we expect to repay the outstanding amount in cash. As of February 29, 2020, none of the holders of the 2020 Convertible Notes elected to convert the Notes into common stock as our shares have been trading under the initial conversion price.
78
In July, 2018, we entered into separate, privately negotiated purchase agreements to repurchase approximately $50 million in aggregate principal amount of our 2020 Convertible Notes for $53.8 million including accrued interest, by using a portion of the net proceeds from the 2025 Convertible Notes. The repurchase was accounted for as an extinguishment of debt, not a modification of debt. We allocated the repurchase price of $53.7 million between the fair value of the liability of $47.6 million and the equity component of $6.1 million. The fair value of the liability component was determined using a discounted cash flow analysis at a market interest rate for nonconvertible debt of 4.36% based on the remaining maturity of the 2020 Convertible Notes, which represented a Level 3 fair value measurement. The carrying value of the repurchased notes was $45.6 million, resulting in a loss on extinguishment of debt of $2.0 million. We also received proceeds of $3.1 million from the unwinding of the note hedge and warrants, which was recorded as additional paid-in capital.
In October and November 2019, we entered into separate, privately negotiated purchase agreements to repurchase approximately $94.9 million in aggregate principal amount of these notes for $94.7 million. The repurchase is accounted for as an extinguishment of debt. The entire repurchase price of $94.7 million was considered as the fair value of the liability as the equity component was de minimis. The fair value of the liability was determined using a discounted cash flow analysis at a market interest rate for nonconvertible debt based on the remaining maturity of the 2020 Convertible Notes, which represented a Level 3 fair value measurement. The carrying value of the repurchased notes was $92.3 million, resulting in a loss on extinguishment of debt of $2.4 million.
2025 Convertible Notes
On July 20, 2018, we issued $230.0 million aggregate principal amount of the 2025 Convertible Notes. These notes were issued under an indenture, dated July 20, 2018 (the “2025 Indenture”) between us and The Bank of New York Mellon Trust Company, N.A., as trustee.
The proceeds from the sale of the 2025 Convertible Notes were $222.7 million, after deducting issuance costs of $7.3 million. We initially used approximately $90.0 million of the net proceeds from this offering to (i) pay the cost of the capped call transactions of $21.2 million; (ii) repurchase shares of our common stock of approximately $15.0 million; and (iii) repurchase in privately negotiated transactions approximately $50 million principal of our outstanding 2020 Convertible Notes for approximately $53.8 million.
The 2025 Indenture contains customary terms and conditions, including that upon certain events of default occurring and continuing, either the trustee, by notice to us, or the holders of at least 25% in aggregate principal amount of the then outstanding Notes, by notice to us and the trustee, may declare the principal amount of, and all accrued and unpaid interest on, all of the 2025 Convertible Notes then outstanding to become due and payable immediately. Such events of default include, without limitation, the default by us or any of our subsidiaries with respect to indebtedness for borrowed money in excess of $10 million and the entry of judgments for the payment of $15 million or more against us or any of our subsidiaries, which are not paid, discharged or stayed within 60 days.
The 2025 Convertible Notes bear interest at 2.00% per year payable semiannually in arrears in cash on February 1 and August 1 of each year, beginning on February 1, 2019. The 2025 Convertible Notes will mature on August 1, 2025, unless earlier converted, redeemed or repurchased by us in accordance with their terms. We may redeem the Notes at our option at any time on or after August 6, 2022 at a cash redemption price equal to the principal amount plus accrued interest, but only if the last reported sale price per share of our stock exceeds 130% of the conversion price on (i) each of at least 20 trading days, whether or not consecutive, during the 30 consecutive trading days ending on, and including, the trading day immediately before the date we send the related redemption notice; and (ii) the trading day immediately before the date we send such notice. The 2025 Convertible Notes rank senior in right of payment to any existing or future indebtedness which is subordinated by its terms, ranks equally in right of payment to any indebtedness that is not so subordinated, is structurally subordinated to all indebtedness and liabilities of our subsidiaries and is effectively junior to our secured indebtedness to the extent of the value of the assets securing such indebtedness.
79
The 2025 Convertible Notes are convertible into cash, shares of our common stock or a combination of both, at our election, based on an initial conversion rate and initial conversion price as noted above. Holders may convert their 2025 Convertible Notes at their option upon the occurrence of certain events, as defined in the 2025 Indenture.
Upon the occurrence of a “make-whole fundamental change”, we will in certain circumstances increase the conversion rate for a specific period of time. Additionally, upon the occurrence of a “fundamental change”, holders of the notes may require us to repurchase their notes at a cash repurchase price equal to the principal amount of the notes to be repurchased, plus any accrued and unpaid interest. As of February 29, 2020, none of the conditions allowing the holders of the 2025 Convertible Notes to convert have been met.
In July 2018, in connection with the 2025 Convertible Notes, we entered into capped call transactions with certain option counterparties who were initial purchasers of the 2025 Convertible Notes. The capped call transactions are expected to reduce the potential dilution of earnings per share upon conversion of the 2025 Convertible Notes. Under the capped call transactions, we purchased options that in the aggregate relate to the total number shares of 7.48 million shares of common stock underlying the notes, with a strike price equal to the conversion price of the notes and with a cap price equal to $41.3875. We paid $21.2 million for the note hedges and as a result, approximately $15.9 million, net of tax, was recorded as a reduction to additional paid-in capital within stockholders’ equity.
We elected to integrate the note hedges and capped call with the Notes for federal income tax purposes pursuant to applicable U.S. Treasury Regulations. Accordingly, the cost of the note hedges and capped call will be deductible for income tax purposes as original issue discount interest over the term of Notes.
Synovia Revenue Assignments
In conjunction with the acquisition of Synovia on April 12, 2019, we assumed the rights and obligations under certain revenue assignment arrangements with several financial institutions (the “Factors”). Pursuant to the terms of the arrangements, Synovia sold to the Factors rights to all future revenues of certain subscription contracts on a non-recourse basis for credit approved accounts. The sales price paid represents a percentage of the total contract value (generally 80%) due to Synovia at the beginning of the contract, with the total customer contract balance to be paid by the customers to the Factors over the contract period. The cost of the transaction was recorded as a contra-liability, and was recognized as interest expense over the term of the subscription contract using the effective interest method, while the assigned customer obligation is amortized to subscription revenues using the straight-line method.
These arrangements with the Factors met the criteria in ASC 470-10-25, Sales of Future Revenues or Various Other Measures of Income (“ASC 470”), which relates to cash received from an investor in exchange for a specified percentage or amount of revenue or other measure of income of a contractual right for a defined period. Under this guidance, the arrangement qualified as a debt instrument for accounting purposes due to Synovia’s significant continuing involvement in the generation of cash flows due to the Factors. Further, under ASC 805, Business Combination, we recorded the amounts due to the Factors as a debt obligation at fair value in the opening balance sheet and the outstanding amount is presented as part of our long-term debt in our consolidated balance sheet. The fair value of this debt of $19.7 million was determined using a pre-tax cost of debt of 4.7% at the time of our acquisition of Synovia. The discount of $1.5 million will be amortized under the interest method. During fiscal year ended February 29, 2020, we recognized $0.7 million of interest expense related to this debt. The non-cash revenues recognized from this arrangement of $6.8 million are included as a non-cash activity in our consolidated statements of cash flows for fiscal year ended February 29, 2020.
Paycheck Protection Program
On April 16, 2020, we received proceeds from a loan in the amount of $10 million (the “PPP Loan”) from JPMorgan Chase Bank, N.A., as lender, pursuant to the Small Business Association (“SBA”) Paycheck Protection Program (the “PPP”) of the Coronavirus Aid, Relief, and Economic Security Act. At the time we applied for the PPP loan, we believed that we qualified to receive the funds pursuant to the PPP. On April 23, 2020, the SBA, in consultation with the Department of Treasury, issued new guidance that creates uncertainty regarding the qualification requirements for a PPP loan. Out of an abundance of caution and in light of the new guidance, we repaid in full the principal and interest on the PPP Loan on April 27, 2020.
80
NOTE 11 – RESTRUCTURING CHARGES
In fiscal 2019, we commenced a plan (the “Plan”) to capture certain synergies and cost savings related to streamlining our global operations and sales organization, as well as rationalize certain leased properties that are not fully occupied. Our Plan is aligned with our strategy to integrate the global sales organization and further outsource manufacturing functions in order to drive operational efficiency, increase supplier geographic diversity, and reduce operating expenses. To date, total restructuring charges were $12.4 million, comprised primarily of $6.8 million in severance and employee related costs, $5.6 million for vacant office and manufacturing facility. Restructuring charges related to vacant office and manufacturing facility space were due primarily to the vacancy in Canton, Massachusetts of $3.3 million. Substantially all charges related to severance and employee costs were under the Telematics Systems reportable segment. As a result of the adoption of ASC 842, effective March 1, 2019, the balance of the restructuring liability related to certain facility leases have been reclassified as a reduction of the Operating lease right-of-use assets in our consolidated balance sheet.
For fiscal year ended February 29, 2020, total restructuring charges were $4.4 million, comprised of $2.5 million in severance and employee related costs and $1.9 million for manufacturing facility. Substantially all charges were recorded under the Telematics Systems reportable segment. The impairment of $1.2 million for the vacant office space was recorded as a reduction of Operating lease right-of-use assets in our consolidated balance sheet as of February 29, 2020. The restructuring liabilities related to personnel were included in Accrued payroll and employee benefits in our consolidated balance sheets as of February 29, 2020 and February 28, 2019.
The following table summarizes the charges resulting from the implementation of the restructuring plan for the fiscal years ended February 29, 2020 and February 28, 2019 (in thousands):
|
|
Years ended February 29/28, |
|
|||||||||||||||||||||
|
|
2020 |
|
|
2019 |
|
||||||||||||||||||
|
|
Personnel |
|
|
Facilities |
|
|
Total |
|
|
Personnel |
|
|
Facilities |
|
|
Total |
|
||||||
|
Cost of revenue |
$ |
493 |
|
|
$ |
1,853 |
|
|
$ |
2,346 |
|
|
$ |
1,585 |
|
|
$ |
1,001 |
|
|
$ |
2,586 |
|
|
Research and development |
|
222 |
|
|
|
- |
|
|
|
222 |
|
|
|
412 |
|
|
|
803 |
|
|
|
1,215 |
|
|
Selling and marketing |
|
601 |
|
|
|
- |
|
|
|
601 |
|
|
|
1,228 |
|
|
|
1,388 |
|
|
|
2,616 |
|
|
General and administrative |
|
1,231 |
|
|
|
- |
|
|
|
1,231 |
|
|
|
1,050 |
|
|
|
548 |
|
|
|
1,598 |
|
|
Total |
$ |
2,547 |
|
|
$ |
1,853 |
|
|
$ |
4,400 |
|
|
$ |
4,275 |
|
|
$ |
3,740 |
|
|
$ |
8,015 |
|
The following table summarizes the activity resulting from the implementation of the restructuring plan within other current and non-current liabilities (in thousands):
|
|
|
Personnel |
|
|
Facilities |
|
|
Total |
|
|||
|
Restructuring liabilities as of February 28, 2018 |
|
$ |
— |
|
|
$ |
— |
|
|
$ |
— |
|
|
Charges |
|
|
4,275 |
|
|
|
3,740 |
|
|
|
8,015 |
|
|
Payments |
|
|
(1,496 |
) |
|
|
(763 |
) |
|
|
(2,259 |
) |
|
Restructuring liabilities as of February 28, 2019 |
|
$ |
2,779 |
|
|
$ |
2,977 |
|
|
$ |
5,756 |
|
|
Cease-use liability reclassified as reduction of Operating lease right-of-use assets |
|
|
- |
|
|
|
(2,977 |
) |
|
|
(2,977 |
) |
|
Charges |
|
|
2,547 |
|
|
|
644 |
|
|
|
3,191 |
|
|
Payments |
|
|
(2,943 |
) |
|
|
(285 |
) |
|
|
(3,228 |
) |
|
Restructuring liabilities as of February 29, 2020 |
|
$ |
2,383 |
|
|
$ |
359 |
|
|
$ |
2,742 |
|
|
|
|
|
|
|
|
|
|
|
|
|
|
|
The anticipated rent payments for the ceased-use leased facilities will be made through December 2025.
81
On March 1, 2019, we adopted Accounting Standard Codification 842, Leases. We applied the transition requirements on the adoption date, rather than at the beginning of the earliest comparative period presented. In addition, we elected the package of practical expedients permitted under the transition guidance, which does not require reassessment of prior conclusions related to contracts containing a lease, lease classification and initial direct lease costs. As an accounting policy election, we excluded short-term leases (term of 12 months or less) from the balance sheet presentation and accounted for non-lease and lease components in a contract as a single lease component for certain asset classes.
We have various non-cancelable operating leases for our offices in California, Texas, Massachusetts, Indiana, Minnesota and Virginia in the United States, and Italy, Mexico and the United Kingdom. We also have various non-cancelable operating leases for towers and vehicles throughout the United States, Italy and Mexico. These leases expire at various times through 2028. Certain lease agreements contain renewal options, rent abatement, and escalation clauses that are factored into our determination of lease payments when appropriate.
During the third quarter of fiscal 2020, we identified certain immaterial adjustments related to amounts recorded for the adoption of ASC 842. The revised amounts for ROU assets and lease liabilities as of March 1, 2019 are $25.6 million and $29.1 million, respectively.
The table below presents lease-related assets and liabilities recorded on the consolidated balance sheet (in thousands):
|
|
|
Classification |
|
February 29, 2020 |
|
|
|
Assets |
|
|
|
|
|
|
|
Operating lease right-of-use assets |
|
Operating lease right-of-use assets |
|
$ |
20,626 |
|
|
|
|
|
|
|
|
|
|
Liabilities |
|
|
|
|
|
|
|
Operating lease liabilities (current) |
|
Other current liabilities |
|
$ |
4,662 |
|
|
Operating lease liabilities (noncurrent) |
|
Operating lease liabilities |
|
|
24,279 |
|
|
Total lease liabilities |
|
|
|
$ |
28,941 |
|
|
|
|
|
|
|
|
|
As a result of the adoption of ASC 842, effective March 1, 2019, the balance of the restructuring liability related to certain facility leases have been reclassified as a reduction of the Operating lease right-of-use assets in our consolidated balance sheet. During fiscal year ended February 29, 2020, we further impaired our operating lease right-of-use assets for the Canton facility by $1.2 million and recorded as a restructuring cost.
Additionally, we also recorded an impairment loss aggregating $0.6 million, which represented total operating lease right-of-use assets from various tower leases that were terminated or planned to be terminated as of February 29, 2020. This impairment loss is included within the total Impairment loss shown in the operating expenses in our consolidated statement of comprehensive income (loss).
82
The following lease costs were included in our consolidated statements of comprehensive income (loss) as follows (in thousands):
|
|
|
Year Ended February 29, 2020 |
|
|
|
Operating lease cost |
|
$ |
6,497 |
|
|
Short-term lease cost |
|
|
848 |
|
|
Variable lease cost |
|
|
315 |
|
|
Total lease cost |
|
$ |
7,660 |
|
|
|
|
|
|
|
Supplemental Information
The table below presents supplemental information related to operating leases during the fiscal year ended February 29, 2020 (in thousands, except weighted-average information):
|
Cash paid for amounts included in the measurement of operating lease liabilities |
|
|
|
$ |
6,624 |
|
|
Right-of-use assets obtained in exchange for new operating lease liabilities |
|
|
|
$ |
4,071 |
|
|
Weighted average remaining lease term |
|
|
|
7.3 years |
|
|
|
Weighted average discount rate |
|
|
|
5.45% |
|
|
Undiscounted Cash Flows
The table below reconciles the undiscounted cash flows for each of the first five years and total of the remaining years to the operating lease liabilities recorded on the consolidated balance sheet as of February 29, 2020 (in thousands):
|
2021 |
|
$ |
6,087 |
|
|
2022 |
|
|
5,485 |
|
|
2023 |
|
|
5,342 |
|
|
2024 |
|
|
5,076 |
|
|
2025 |
|
|
3,554 |
|
|
Thereafter |
|
|
9,952 |
|
|
Total minimum lease payments |
|
|
35,496 |
|
|
Less imputed interest |
|
|
(6,555 |
) |
|
Present value of future minimum lease payments |
|
|
28,941 |
|
|
Less current obligations under leases |
|
|
(4,662 |
) |
|
Long-term lease obligations |
|
$ |
24,279 |
|
83
Disclosures Related to Periods Prior to Adoption of New Lease Standard
Minimum lease payments under operating leases with non-cancelable terms in excess of one year as of February 28, 2019, were as follows (in thousands):
|
2020 |
|
$ |
7,565 |
|
|
2021 |
|
|
6,386 |
|
|
2022 |
|
|
6,242 |
|
|
2023 |
|
|
6,199 |
|
|
2024 |
|
|
6,126 |
|
|
Thereafter |
|
|
7,659 |
|
|
Total minimum lease payments |
|
$ |
40,177 |
|
NOTE 13 – INCOME TAXES
Our income (loss) before income taxes and equity in net loss of affiliate consists of the following (in thousands):
|
|
|
Year Ended February 29/28, |
|
|||||||||
|
|
|
2020 |
|
|
2019 |
|
|
2018 |
|
|||
|
Domestic |
|
$ |
(59,133 |
) |
|
$ |
21,367 |
|
|
$ |
13,898 |
|
|
Foreign |
|
|
813 |
|
|
|
2,488 |
|
|
|
14,811 |
|
|
Total income (loss) before income taxes and equity in net loss of affiliate |
|
$ |
(58,320 |
) |
|
$ |
23,855 |
|
|
$ |
28,709 |
|
The components of income tax benefit (provision) consists of the following (in thousands):
|
|
|
Year Ended February 29/28, |
|
|||||||||
|
|
|
2020 |
|
|
2019 |
|
|
2018 |
|
|||
|
Current: |
|
|
|
|
|
|
|
|
|
|
|
|
|
Federal |
|
$ |
- |
|
|
$ |
404 |
|
|
$ |
(412 |
) |
|
State |
|
|
(273 |
) |
|
|
(256 |
) |
|
|
(694 |
) |
|
Foreign |
|
|
(1,629 |
) |
|
|
(62 |
) |
|
|
(2,204 |
) |
|
Total current |
|
|
(1,902 |
) |
|
|
86 |
|
|
|
(3,310 |
) |
|
Deferred: |
|
|
|
|
|
|
|
|
|
|
|
|
|
Federal |
|
|
(12,852 |
) |
|
|
(2,015 |
) |
|
|
(6,156 |
) |
|
State |
|
|
(10,645 |
) |
|
|
(1,183 |
) |
|
|
(1,458 |
) |
|
Foreign |
|
|
4,945 |
|
|
|
4,442 |
|
|
|
243 |
|
|
Total deferred |
|
|
(18,552 |
) |
|
|
1,244 |
|
|
|
(7,371 |
) |
|
Income tax benefit (provision) |
|
$ |
(20,454 |
) |
|
$ |
1,330 |
|
|
$ |
(10,681 |
) |
84
The income tax benefit (provision) differs from the amount obtained by applying the statutory rate as follows (in thousands):
|
|
|
Year Ended February 29/28, |
|
|||||||||
|
|
|
2020 |
|
|
2019 |
|
|
2018 |
|
|||
|
Income tax benefit (provision) at U.S. statutory federal rate |
|
$ |
12,248 |
|
|
$ |
(5,010 |
) |
|
$ |
(9,400 |
) |
|
State income tax benefit (provision), net of federal income tax effect |
|
|
1,218 |
|
|
|
(1,300 |
) |
|
|
(574 |
) |
|
Foreign taxes benefit (provision) |
|
|
(50 |
) |
|
|
(31 |
) |
|
|
2,923 |
|
|
Impact of tax reform |
|
|
- |
|
|
|
- |
|
|
|
(8,955 |
) |
|
U.S. taxes on foreign income |
|
|
(571 |
) |
|
|
|
|
|
|
|
|
|
Valuation allowance reductions (increases) |
|
|
(34,631 |
) |
|
|
5,915 |
|
|
|
3,046 |
|
|
Research and other tax credits |
|
|
2,594 |
|
|
|
1,658 |
|
|
|
1,034 |
|
|
Tax benefits on vested and exercised equity awards |
|
|
(606 |
) |
|
|
- |
|
|
|
937 |
|
|
Other, net |
|
|
(656 |
) |
|
|
98 |
|
|
|
308 |
|
|
Total income tax benefit (provision) |
|
$ |
(20,454 |
) |
|
$ |
1,330 |
|
|
$ |
(10,681 |
) |
The components of net deferred income tax assets for income tax purposes are as follows (in thousands):
|
|
|
February 29/28, |
|
|||||
|
|
|
2020 |
|
|
2019 |
|
||
|
Net operating loss carryforwards |
|
$ |
22,500 |
|
|
$ |
19,269 |
|
|
Depreciation, amortization and impairments |
|
|
(10,528 |
) |
|
|
(11,945 |
) |
|
Research and development credits |
|
|
20,603 |
|
|
|
19,189 |
|
|
Stock-based compensation |
|
|
2,556 |
|
|
|
2,783 |
|
|
Other tax credits |
|
|
2,172 |
|
|
|
1,018 |
|
|
Capitalized research costs |
|
|
3,389 |
|
|
|
- |
|
|
Lease liabilities |
|
|
7,455 |
|
|
|
- |
|
|
Payroll and employee benefit accruals |
|
|
2,077 |
|
|
|
2,220 |
|
|
Allowance for doubtful accounts |
|
|
965 |
|
|
|
454 |
|
|
Other accrued liabilities |
|
|
4,887 |
|
|
|
6,208 |
|
|
Convertible debt |
|
|
(9,477 |
) |
|
|
(10,822 |
) |
|
Other, net |
|
|
3,276 |
|
|
|
4,218 |
|
|
Gross deferred tax assets |
|
|
49,875 |
|
|
|
32,592 |
|
|
Valuation allowance |
|
|
(45,560 |
) |
|
|
(10,929 |
) |
|
Net deferred tax assets |
|
$ |
4,315 |
|
|
$ |
21,663 |
|
|
|
|
|
|
|
|
|
|
|
|
Reported as: |
|
|
|
|
|
|
|
|
|
Deferred tax assets |
|
$ |
4,437 |
|
|
$ |
22,626 |
|
|
Deferred tax liabilities |
|
|
(122 |
) |
|
|
(963 |
) |
|
Net deferred tax assets |
|
$ |
4,315 |
|
|
$ |
21,663 |
|
85
As of February 29, 2020, we maintained a valuation allowance with respect to certain of our deferred tax assets relating primarily to net operating losses and tax credits in U.S. and certain non-U.S. jurisdictions for which we cannot assert that they are more likely than not going to be realized. For the fiscal year ended February 29, 2020, we considered positive and negative evidence, in assessing our ability to realize our domestic net deferred tax assets and concluded that it is more likely than not that our domestic net deferred tax assets will not be realized. As such, we increased the valuation allowance against our domestic net deferred tax asset by approximately $33.0 million. For the fiscal year ended February 29, 2020, we increased the non-US valuation allowance against our net deferred tax assets related to net operating loss carryforwards by approximately $1.6 million. The amount of the net deferred tax assets considered realizable, however, could be adjusted in future periods in the event sufficient evidence is present to support a conclusion that it is more likely than not that all or a portion of our domestic deferred tax assets will be realized.
At February 29, 2020, we had net operating loss carryforwards of approximately $38.9 million, $36.8 million and $35.4 million for federal, state and foreign purposes, respectively, expiring at various dates through fiscal 2039. Approximately $18.5 million of foreign net operating loss carryforwards do not expire. The federal net operating loss carryforwards are subject to various limitations under Section 382 of the Internal Revenue Code. If substantial changes in our ownership were to occur, there may be certain annual limitations on the amount of the NOL carryforwards that can be utilized.
As of February 29, 2020, we had R&D tax credit carryforwards of $9.8 million and $9.8 million for federal and state income tax purposes, respectively. The federal R&D tax credits expire at various dates through 2039. A substantial portion of the state R&D tax credits have no expiration date. As of February 29, 2020, we had foreign tax credit carryforwards of $1.9 million for federal income tax purposes which expire beginning in fiscal 2022 through fiscal 2030.
We accounted for stock-based compensation pursuant to ASU 2016-09 and we have tax deductions on exercised stock options and vested restricted stock awards that did not exceed stock compensation expense amounts recognized for financial reporting purposes in fiscal 2020. The gross shortfall was $2.4 million in fiscal year 2020. In fiscal 2019 and 2018, there were excess tax deductions of $2.9 million and $2.6 in fiscal years 2019 and 2018, respectively. Under ASU 2016-09, all excess tax benefits and tax deficiencies are recognized in the income statement as they occur. We follow ASC Topic 740, “Income Taxes,” which clarifies the accounting for income taxes by prescribing a minimum recognition threshold that a tax position is required to meet before being recognized in the financial statements. Management determined based on our evaluation of our income tax positions that we have uncertain tax benefit of $2.2 million, $3.2 million and $1.0 million at February 29, 2020, February 28, 2019 and 2018, respectively, for which we have not yet recognized an income tax benefit for financial reporting purposes.
At February 29, 2020, we decreased the uncertain tax benefits related to certain foreign net operating loss carryforwards and domestic tax credits by $0.9 million and $0.1 million, respectively. At February 28, 2019, we increased the uncertain tax benefits related to certain foreign net operating loss carryforwards. Such deferred tax assets were previously offset by a valuation allowance so that the increase in the unrecognized tax benefit coupled with the reduction of the valuation allowance on such net operating losses did not result in an income tax expense during the current fiscal year. If total uncertain tax benefits were realized in a future period, it would result in a tax benefit of $2.2 million. As of February 29, 2020, our liabilities for uncertain tax benefits were netted against our deferred tax assets on our consolidated balance sheet. It is reasonably possible the amount of unrecognized tax benefits could be reduced within the next 12 months by at least $0.5 million.
86
We recognize interest and/or penalties related to uncertain tax positions in income tax expense. No amounts of interest and/or penalties have been accrued as of February 29, 2020.
|
|
Year Ended February 28/29, |
|
|||||||||
|
|
2020 |
|
|
2019 |
|
|
2018 |
|
|||
|
Gross amounts of unrecognized tax benefits as of the beginning of the period |
$ |
3,201 |
|
|
$ |
1,029 |
|
|
$ |
1,029 |
|
|
Increases related to prior period tax positions |
|
- |
|
|
|
2,241 |
|
|
|
- |
|
|
Decreases related to prior period tax positions |
|
(1,029 |
) |
|
|
(69 |
) |
|
|
- |
|
|
Increases related to current period tax positions |
|
- |
|
|
|
- |
|
|
|
- |
|
|
Settlements |
|
- |
|
|
|
- |
|
|
|
- |
|
|
Gross amounts of unrecognized tax benefits as of the end of the period |
$ |
2,172 |
|
|
$ |
3,201 |
|
|
$ |
1,029 |
|
We file income tax returns in the U.S. federal jurisdiction, various U.S. states and Puerto Rico, Canada, Ireland, Italy, United Kingdom, the Netherlands, Brazil, Mexico, Japan, Hong Kong and New Zealand. Certain income tax returns for the years 2015 through 2018 remain open to examination by U.S. federal and state tax authorities. To the extent allowed by law, the tax authorities may have the right to examine prior periods in which net operating losses or tax credits were generated and carried forward, and to make adjustments up to the net operating loss or tax credit carryforward amount. Our tax returns in the foreign jurisdictions remain open for examination for varying years by jurisdiction with certain jurisdictions being open for examination from 2014 to the present.
In fiscal 2019, we considered the earnings of our Irish subsidiary not to be indefinitely reinvested and we recorded a state income tax expense of approximately $0.3 million related to outside basis differences. We continue to assert our intention to indefinitely reinvest foreign earnings in all other remaining non-U.S. subsidiaries and accordingly, recorded no deferred income taxes on outside basis differences.
NOTE 14 – STOCKHOLDERS' EQUITY
Stock Repurchase
We repurchased our common stock under share repurchase programs approved by our Board of Directors. The following table contains information with respect to these repurchases:
|
Fiscal Year |
|
Total Number of Shares Purchased |
|
|
Average Price Paid per Share |
|
|
Total Purchased |
|
|||
|
Fiscal 2019 |
|
|
2,496,422 |
|
|
$ |
19.63 |
|
|
$ |
49,000,000 |
|
There were no repurchases for the fiscal years ended February 28, 2018 and February 29, 2020.
Employee Stock Purchase Plan
On June 7, 2018, our Board of Directors adopted the CalAmp Corp. 2018 Employee Stock Purchase Plan (the “ESPP”), which was approved by our stockholders on July 25, 2018. The ESPP provides for the issuance of 1,750,000 shares of our common stock. The first enrollment under the ESPP Plan commenced in February 2019. There are two enrollment periods each year that commence on February 1st and August 1st and lasts for six months. Stock-based compensation expense related to the ESPP Plan for the year ended February 29, 2020 was $0.5 million and de minimis for the year ended February 28, 2019.
87
Our Board of Directors adopted the 2004 Incentive Stock Plan (the 2004 Plan) effective July 30, 2004, which provides for the granting of qualified and nonqualified stock options, restricted stock, performance stock units (PSUs), restricted stock units (RSUs), phantom stock and bonus stock to employees and directors. The primary purpose of the 2004 Plan is to enhance our ability to attract, motivate, and retain the services of qualified employees, officers and directors. Any stock options under the 2004 Plan will have a term of not more than 10 years and the vesting of the awards will be at the discretion of the Compensation Committee of the Board of Directors but is not expected to exceed four years. We treat equity awards with multiple vesting tranches as a single award for expense attribution purposes and recognize compensation expense on a straight-line basis over the requisite service period of the entire award. As of February 29, 2020, there were 482,871 award units in the 2004 Plan that were available for grant.
The following table summarizes our stock option activity (number of options and aggregate intrinsic value in thousands):
|
|
|
Number of Options |
|
|
Weighted Average Exercise Price |
|
|
Weighted average remaining contractual life (years) |
|
|
Aggregate intrinsic value |
|
||||
|
Outstanding at February 28, 2017 |
|
|
955 |
|
|
$ |
8.60 |
|
|
|
5.5 |
|
|
|
|
|
|
Granted |
|
|
165 |
|
|
|
19.31 |
|
|
|
|
|
|
|
|
|
|
Exercised |
|
|
(140 |
) |
|
|
2.36 |
|
|
|
|
|
|
|
|
|
|
Forfeited or expired |
|
|
- |
|
|
|
- |
|
|
|
|
|
|
|
|
|
|
Outstanding at February 28, 2018 |
|
|
980 |
|
|
$ |
11.29 |
|
|
|
5.9 |
|
|
|
|
|
|
Granted |
|
|
140 |
|
|
|
23.08 |
|
|
|
|
|
|
|
|
|
|
Exercised |
|
|
(66 |
) |
|
|
1.87 |
|
|
|
|
|
|
|
|
|
|
Forfeited or expired |
|
|
- |
|
|
|
- |
|
|
|
|
|
|
|
|
|
|
Outstanding at February 28, 2019 |
|
|
1,054 |
|
|
$ |
13.44 |
|
|
|
5.8 |
|
|
|
|
|
|
Granted |
|
|
171 |
|
|
|
11.11 |
|
|
|
|
|
|
|
|
|
|
Exercised |
|
|
(154 |
) |
|
|
2.44 |
|
|
|
|
|
|
|
|
|
|
Forfeited or expired |
|
|
- |
|
|
|
- |
|
|
|
|
|
|
|
|
|
|
Outstanding at February 29, 2020 |
|
|
1,071 |
|
|
$ |
14.65 |
|
|
|
6.2 |
|
|
$ |
850 |
|
|
|
|
|
|
|
|
|
|
|
|
|
|
|
|
|
|
|
|
Exercisable at: |
|
|
|
|
|
|
|
|
|
|
|
|
|
|
|
|
|
February 28, 2018 |
|
|
590 |
|
|
$ |
7.54 |
|
|
|
4.1 |
|
|
$ |
9,349 |
|
|
February 28, 2019 |
|
|
698 |
|
|
$ |
10.22 |
|
|
|
4.4 |
|
|
$ |
3,360 |
|
|
February 29, 2020 |
|
|
633 |
|
|
$ |
13.21 |
|
|
|
4.7 |
|
|
$ |
850 |
|
|
|
|
Year ended February 28/29, |
|
|||||||||
|
|
|
2020 |
|
|
2019 |
|
|
2018 |
|
|||
|
Weighted average grant date fair value of stock options granted during the year |
|
$ |
4.82 |
|
|
$ |
11.94 |
|
|
$ |
10.20 |
|
88
We use the Black-Scholes-Merton option pricing model for valuation of stock option awards. Calculating the fair value of stock option awards requires the input of subjective assumptions. Other reasonable assumptions could provide differing results. The fair value of stock options at the grant date was determined using the following assumptions:
|
|
|
Year Ended February 29/28, |
|
|||||
|
Black-Scholes Valuation Assumptions |
|
2020 |
|
|
2019 |
|
2018 |
|
|
Expected life (years) |
|
6 |
|
|
2 - 6 |
|
6 |
|
|
Expected volatility |
|
43% |
|
|
36% - 43% |
|
46% |
|
|
Risk-free interest rates |
|
1.9% |
|
|
2.5% - 2.9% |
|
2.0% |
|
|
Expected dividend yield |
|
0% |
|
|
0% |
|
0% |
|
For the years ended February 29, 2020, February 28, 2019 and 2018, the expected life of options was determined using historical experience of our stock option grants and forfeiture activities. The expected volatility is based on the historical volatility of our stock price. The risk-free interest rate is based on the implied yield currently available on U.S. Treasuries with terms which approximate the expected life of the stock options.
Changes in our outstanding restricted stock shares, PSUs and RSUs for the fiscal years ended February 29, 2020, February 28, 2019 and 2018 were as follows (shares in thousands):
|
|
|
Number of Restricted Shares, PSUs and RSUs |
|
|
Weighted Average Grant Date Fair Value |
|
|
Shares Retained to Cover Statutory Minimum Withholding Taxes |
|
|||
|
Outstanding at February 28, 2017 |
|
|
1,239 |
|
|
$ |
15.94 |
|
|
|
|
|
|
Granted |
|
|
770 |
|
|
|
19.55 |
|
|
|
|
|
|
Vested |
|
|
(399 |
) |
|
|
15.92 |
|
|
|
133 |
|
|
Forfeited |
|
|
(176 |
) |
|
|
17.34 |
|
|
|
|
|
|
Outstanding at February 28, 2018 |
|
|
1,434 |
|
|
$ |
17.72 |
|
|
|
|
|
|
Granted |
|
|
787 |
|
|
|
22.05 |
|
|
|
|
|
|
Vested |
|
|
(478 |
) |
|
|
17.32 |
|
|
|
162 |
|
|
Forfeited |
|
|
(236 |
) |
|
|
19.59 |
|
|
|
|
|
|
Outstanding at February 28, 2019 |
|
|
1,507 |
|
|
$ |
19.77 |
|
|
|
|
|
|
Granted |
|
|
1,597 |
|
|
|
11.28 |
|
|
|
|
|
|
Vested |
|
|
(521 |
) |
|
|
18.67 |
|
|
|
177 |
|
|
Forfeited |
|
|
(368 |
) |
|
|
16.27 |
|
|
|
|
|
|
Outstanding at February 29, 2020 |
|
|
2,215 |
|
|
$ |
14.47 |
|
|
|
|
|
Stock-based compensation expense is included in the following captions of the consolidated statements of comprehensive income (loss) (in thousands):
|
|
|
Year Ended February 29/28, |
|
|||||||||
|
|
|
2020 |
|
|
2019 |
|
|
2018 |
|
|||
|
Cost of revenues |
|
$ |
675 |
|
|
$ |
723 |
|
|
$ |
653 |
|
|
Research and development |
|
|
2,458 |
|
|
|
2,061 |
|
|
|
1,471 |
|
|
Selling and marketing |
|
|
3,255 |
|
|
|
2,863 |
|
|
|
2,314 |
|
|
General and administrative |
|
|
6,033 |
|
|
|
5,382 |
|
|
|
4,860 |
|
|
|
|
$ |
12,421 |
|
|
$ |
11,029 |
|
|
$ |
9,298 |
|
89
As of February 29, 2020, there was $26.3 million of unrecognized stock-based compensation cost related to non-vested equity awards, which is expected to be recognized over a weighted-average remaining vesting period of 3.4 years.
Tax Benefits from Exercise of Stock Options and Vesting of Restricted Stock and RSU Awards
The aggregate fair value of stock options exercised and vested restricted stock and RSU awards as of the exercise date or vesting date was $9.6 million, $8.6 million and $6.9 million for fiscal years ended February 29, 2020, February 28, 2019 and 2018, respectively. In connection with these equity awards, the excess stock compensation tax deductions were $0, $2.9 and $2.6 million for fiscal years ended February 29, 2020, February 28, 2019 and 2018, respectively.
NOTE 15 – EARNINGS (LOSS) PER SHARE
Basic earnings (loss) per share is computed by dividing net income (loss) by the weighted average number of common shares outstanding during the period. Diluted earnings per share is computed by dividing net income by the weighted average number of common shares outstanding during the period plus the dilutive effect of outstanding stock options and restricted stock-based awards using the treasury stock method. The following table sets forth the computation of basic and diluted earnings (loss) per share (in thousands, except per share amounts):
|
|
Year Ended February 29/28, |
|
|||||||||
|
|
2020 |
|
|
2019 |
|
|
2018 |
|
|||
|
Net income (loss) |
$ |
(79,304 |
) |
|
$ |
18,398 |
|
|
$ |
16,617 |
|
|
Basic weighted average number of common shares outstanding |
|
33,670 |
|
|
|
34,589 |
|
|
|
35,250 |
|
|
Effect of stock options and restricted stock units computed on treasury stock method |
|
- |
|
|
|
705 |
|
|
|
889 |
|
|
Diluted weighted average number of common shares outstanding |
|
33,670 |
|
|
|
35,294 |
|
|
|
36,139 |
|
|
Earnings (loss) per share: |
|
|
|
|
|
|
|
|
|
|
|
|
Basic |
$ |
(2.36 |
) |
|
$ |
0.53 |
|
|
$ |
0.47 |
|
|
Diluted |
$ |
(2.36 |
) |
|
$ |
0.52 |
|
|
$ |
0.46 |
|
All outstanding stock options and restricted stock-based awards in the amount of 0.9 million and 0.7 million, respectively, were excluded from the computation of diluted earnings per share for the fiscal year ended February 29, 2020 because the effect of inclusion would be antidilutive. Shares subject to anti-dilutive stock options and restricted stock-based awards of 1.9 million and 0.2 million for the fiscal years ended February 28, 2019 and 2018, respectively, were excluded from the calculations of diluted earnings per share for the years then ended.
We have the option to pay cash, issue shares of common stock or any combination thereof for the aggregate amount due upon conversion of the convertible senior notes. It is our intent to settle the principal amount of these notes with cash, and therefore, we use the treasury stock method for calculating any potential dilutive effect of the conversion option on diluted earnings (loss) per share. From the time of the issuance of the notes, the average market price of our common stock has been less than the initial conversion price of the notes, and consequently no shares have been included in diluted earnings per share for the conversion value of the notes.
90
NOTE 16 – COMPREHENSIVE INCOME (LOSS)
The following table shows the changes in our accumulated other comprehensive income (loss) for the fiscal years ended February 29, 2020, February 28, 2019 and 2018 (in thousands):
|
|
|
Cumulative Foreign Currency Translation |
|
|
Unrealized Gains/Losses on Marketable Securities |
|
|
Total |
|
|||
|
Balances at February 28, 2017 |
|
|
(506 |
) |
|
|
(35 |
) |
|
|
(541 |
) |
|
Other comprehensive income (loss), net of tax |
|
|
(122 |
) |
|
|
464 |
|
|
|
342 |
|
|
Balances at February 28, 2018 |
|
|
(628 |
) |
|
|
429 |
|
|
|
(199 |
) |
|
Other comprehensive income (loss), net of tax |
|
|
(33 |
) |
|
|
(429 |
) |
|
|
(462 |
) |
|
Balances at February 28, 2019 |
|
|
(661 |
) |
|
$ |
- |
|
|
|
(661 |
) |
|
Other comprehensive income (loss), net of tax |
|
|
(714 |
) |
|
|
- |
|
|
|
(714 |
) |
|
Balances at February 29, 2020 |
|
$ |
(1,375 |
) |
|
$ |
- |
|
|
$ |
(1,375 |
) |
NOTE 17 – EMPLOYEE RETIREMENT PLAN
We maintain a 401(k) defined-contribution plan allowing eligible U.S.-based employees to contribute up to an annual maximum amount as set periodically by the Internal Revenue Service. The current matching contribution to the plan is equal to 100% of the first 3% of participants’ compensation contribution plus 50% of the next 2% contributed by the participant. We recorded expense for the matching contributions of $2.1 million, $2.1 million and $2.0 million in fiscal years ended February 29, 2020, February 28, 2019 and 2018, respectively.
NOTE 18 – OTHER FINANCIAL INFORMATION
Supplemental Balance Sheet Information
Other current liabilities consist of the following (in thousands):
|
|
|
February 29/28, |
|
|||||
|
|
|
2020 |
|
|
2019 |
|
||
|
Operating lease liabilities |
|
$ |
4,662 |
|
|
$ |
- |
|
|
Litigation reserve |
|
|
1,500 |
|
|
|
1,500 |
|
|
Customer deposits |
|
|
1,377 |
|
|
|
546 |
|
|
Warranty reserves |
|
|
987 |
|
|
|
1,398 |
|
|
Other |
|
|
7,627 |
|
|
|
7,178 |
|
|
|
|
$ |
16,153 |
|
|
$ |
10,622 |
|
91
Other non-current liabilities consist of the following (in thousands):
|
|
|
February 29/28, |
|
|||||
|
|
|
2020 |
|
|
2019 |
|
||
|
Deferred revenue |
|
$ |
27,452 |
|
|
$ |
27,106 |
|
|
Deferred compensation plan liability |
|
|
5,919 |
|
|
|
6,409 |
|
|
Accrued restructuring costs |
|
|
- |
|
|
|
2,175 |
|
|
Deferred tax liability |
|
|
122 |
|
|
|
963 |
|
|
Deferred rent |
|
|
- |
|
|
|
365 |
|
|
Other |
|
|
1,551 |
|
|
|
1,458 |
|
|
|
|
$ |
35,044 |
|
|
$ |
38,476 |
|
Supplemental Income Statement Information
Interest expense consists of the following (in thousands):
|
|
|
Year Ended February 29/28, |
|
|||||||||
|
|
|
2020 |
|
|
2019 |
|
|
2018 |
|
|||
|
Interest expense on 2020 Convertible Notes: |
|
|
|
|
|
|
|
|
|
|
|
|
|
Stated interest at 1.625% per annum |
|
$ |
1,464 |
|
|
$ |
2,308 |
|
|
$ |
2,806 |
|
|
Amortization of discount and issuance costs |
|
|
4,336 |
|
|
|
6,484 |
|
|
|
7,472 |
|
|
|
|
|
5,800 |
|
|
|
8,792 |
|
|
|
10,278 |
|
|
Interest expense on 2025 Convertible Notes: |
|
|
|
|
|
|
|
|
|
|
|
|
|
Stated interest at 2.00% per annum |
|
|
4,613 |
|
|
|
2,811 |
|
|
|
- |
|
|
Amortization of discount and issuance costs |
|
|
8,750 |
|
|
|
4,980 |
|
|
|
- |
|
|
|
|
|
13,363 |
|
|
|
7,791 |
|
|
|
- |
|
|
Other interest expense |
|
|
933 |
|
|
|
143 |
|
|
|
2 |
|
|
Total interest expense |
|
$ |
20,096 |
|
|
$ |
16,726 |
|
|
$ |
10,280 |
|
Supplemental Cash Flow Information
“Net cash provided by operating activities” in the consolidated statements of cash flows includes cash payments for interest and income taxes. The following is our supplemental schedule of cash payments for interest and income taxes and non-cash investing and financing activities (in thousands):
|
|
Year Ended February 29/28, |
|
|||||||||
|
|
2020 |
|
|
2019 |
|
|
2018 |
|
|||
|
Cash payments for interest and income taxes: |
|
|
|
|
|
|
|
|
|
|
|
|
Interest expense paid |
$ |
6,762 |
|
|
$ |
5,057 |
|
|
$ |
2,844 |
|
|
Income tax paid, net of refunds |
$ |
220 |
|
|
$ |
964 |
|
|
$ |
3,498 |
|
|
Non-cash investing and financing activities: |
|
|
|
|
|
|
|
|
|
|
|
|
Accrued liability for capital expenditures |
$ |
(283 |
) |
|
$ |
881 |
|
|
$ |
- |
|
|
Conversion of receivables to equity investment |
$ |
- |
|
|
$ |
300 |
|
|
$ |
2,674 |
|
92
Valuation and Qualifying Accounts
Following is our schedule of valuation and qualifying accounts for the last three years (in thousands):
|
|
|
Balance at beginning of year |
|
|
Charged (credited) to costs and expenses |
|
|
Deductions |
|
|
Other |
|
|
Balance at end of year |
|
|||||
|
Allowance for doubtful accounts: |
|
|||||||||||||||||||
|
Fiscal 2018 |
|
|
962 |
|
|
|
685 |
|
|
|
(461 |
) |
|
|
- |
|
|
|
1,186 |
|
|
Fiscal 2019 |
|
|
1,186 |
|
|
|
1,230 |
|
|
|
(660 |
) |
|
|
- |
|
|
|
1,756 |
|
|
Fiscal 2020 |
|
|
1,756 |
|
|
|
2,989 |
|
|
|
(1,674 |
) |
|
|
- |
|
|
|
3,071 |
|
|
Warranty reserve: |
|
|||||||||||||||||||
|
Fiscal 2018 |
|
|
6,518 |
|
|
|
1,331 |
|
|
|
(2,115 |
) |
|
|
- |
|
|
|
5,734 |
|
|
Fiscal 2019 |
|
|
5,734 |
|
|
|
1,126 |
|
|
|
(5,462 |
) |
|
|
- |
|
|
|
1,398 |
|
|
Fiscal 2020 |
|
|
1,398 |
|
|
|
729 |
|
|
|
(1,140 |
) |
|
|
|
|
|
|
987 |
|
|
Deferred tax assets valuation allowance: |
|
|||||||||||||||||||
|
Fiscal 2018 |
|
|
6,587 |
|
|
|
- |
|
|
|
(4,835 |
) |
|
|
15,092 |
|
|
|
16,844 |
|
|
Fiscal 2019 |
|
|
16,844 |
|
|
|
799 |
|
|
|
(6,714 |
) |
|
|
- |
|
|
|
10,929 |
|
|
Fiscal 2020 |
|
|
10,929 |
|
|
|
34,631 |
|
|
|
- |
|
|
|
- |
|
|
|
45,560 |
|
|
|
|
|
|
|
|
|
|
|
|
|
|
|
|
|
|
|
|
|
|
|
NOTE 19 – COMMITMENTS AND CONTINGENCIES
Legal Proceedings
Omega patent infringement claim
On May 22, 2017, we filed motions with the court seeking judgment as a matter of law and for a new trial in response to the patent infringement lawsuit filed by Omega Patents, LLC (“Omega”) that was decided against us in 2016. The court denied our motions on November 14, 2017. We then appealed to the Court of Appeals for the Federal Circuit (the “Federal Circuit”). The appeal was fully briefed, and the court heard oral argument on January 9, 2019. On April 8, 2019, the Federal Circuit vacated the compensatory and enhanced damages and attorney’s fees awarded by the trial court to Omega. The Federal Circuit also set aside the jury’s verdict that our alleged infringement was willful, and remanded the case for a new trial. As a result, substantially all of the previously reserved legal provisions of $19.1 million as of November 30, 2018 was reversed as of our fiscal year-end. The reversal was recorded as a reduction of general and administrative expenses in our consolidated statement of comprehensive income (loss) for the fiscal year ended February 28, 2019.
The new trial began on September 23, 2019 in the U.S. District Court for the Middle District of Florida (“Trial Court”), and on September 30, 2019, the jury determined that the Company infringed two of the four patents; however, the jury found that there was no willful infringement. On the first patent (U.S. Pat. No. 7,671,727), the jury found only one unit infringed, and assessed $1 in damages. On the second patent (U.S. Pat. No. 8,032,278), the jury found direct infringement and awarded damages at a rate of $5 per unit, for total damages of approximately $4.6 million. On November 26, 2019 the Trial Court entered judgment, awarding Omega damages of $4.6 million, together with pre-judgment interest in the amount of $0.8 million through September 30, 2019. We filed motions with the Trial Court seeking judgment as a matter of law (“JMOL”) in our favor and, alternatively, a new trial. On March 20, 2020, the Trial Court denied our motion for JMOL, a new trial, and remittitur of damages. Also, on March 20, 2020, the Trial Court denied Omega’s motion for a new trial on willfulness. On April 1, 2020, the Trial Court denied Omega’s motion to enhance the royalty rate beyond the jury’s award of $5 per unit and motion to conduct post-trial discovery on CalAmp’s other OBD-II compliant LMUs. On April 3, 2020, the Trial Court denied Omega’s final motion regarding infringement of the VPODs. On April 30, 2020, we filed a notice of appeal at the Federal Circuit. Also on April 30, 2020, Omega filed notices of cross-appeal at the Federal Circuit.
93
We also initiated ex parte reexamination proceedings filed in the U.S. Patent and Trademark Office seeking to invalidate a number of Omega’s patents involved in the litigation. Those proceedings currently remain pending. We continue to believe that our products do not infringe on any of Omega’s patents. While it is not feasible to predict with certainty the outcome of this litigation, we believe that its ultimate resolution would not have a material adverse effect on our consolidated results of operations, financial condition and cash flows.
In connection with this claim, we have accrued our best estimate of the probable liability based on reasonable royalty rates for similar technologies. It is reasonably possible that the judgement and amounts described above could be upheld, which would exceed the amounts we have accrued.
EVE battery claim
On October 27, 2014, LoJack and LoJack Equipment Ireland DAC (“LJEI”), a wholly-owned subsidiary of LoJack, commenced arbitration proceedings against EVE Energy Co., Ltd. (“EVE”) by filing a notice of arbitration with a tribunal (the “Tribunal”) before the Hong Kong International Arbitration Centre (the “HKIAC”). LoJack and LJEI alleged that EVE breached representations and warranties made in supply agreements relating to the quality and performance of battery packs supplied by EVE. On June 2, 2017, we were notified that the Tribunal rendered a decision and awarded damages to us (the “Damage Award”) for EVE’s breach of contract. On June 9, 2017, we entered into a settlement agreement with EVE and its controlling shareholder EVE Holdings Limited to resolve the Damage Award by having EVE Holdings Limited, the parent company of EVE, make payments to us in the aggregate amount of $46.6 million, which amount is net of attorneys’ fees and insurance subrogation payment (the “Settlement”). As of February 28, 2019, we had received the entire Settlement, of which $18.3 million was received in fiscal 2019 and $28.3 million was received in fiscal 2018. The Settlement amounts were reported and disclosed as other non-operating income in our consolidated statement of comprehensive income for the fiscal years ended February 28, 2019 and 2018.
Tracker South Africa claim
On December 9, 2016, Tracker Connect (Pty) LTD (“Tracker”), an international licensee of LoJack located in South Africa, commenced arbitration proceedings against LoJack Ireland by filing a notice of arbitration with the International Centre for Dispute Resolution. The filing alleged breaches of the license agreement as well as misrepresentations and violation of Massachusetts General Laws chapter 93A. Tracker was seeking various relief, including monetary damages and recovery of attorneys’ fees. On March 3, 2017, LoJack Ireland filed its response to Tracker’s notice, denying their allegations and filing counterclaims against Tracker for material breaches of the parties’ license agreement and bad faith conduct. The arbitral tribunal was selected and the arbitration was conducted in March 2018 with closing arguments heard on June 25, 2018. On December 6, 2018, the arbitral tribunal issued its confidential final ruling by awarding $6.2 million to Tracker, which was paid on December 18, 2018. In connection with this legal matter, we accrued a contingent liability of $4.0 million and therefore the net effect of the final award is recorded in General & Administrative expenses in our consolidated statements of comprehensive income (loss) for the fiscal year ended February 28, 2019.
At this time, we believe that all outstanding legal matters related to the EVE and Tracker matters are complete.
In addition to the foregoing matters, from time to time as a normal consequence of doing business, various claims and litigation may be asserted or commenced against us. In particular, we may receive claims concerning contract performance or claims that our products or services infringe the intellectual property of third parties which are in the ordinary course of business. While the outcome of any such claims or litigation cannot be predicted with certainty, management does not believe that the outcome of such matters existing at the present time would have a material adverse effect on our consolidated results of operations, financial condition or cash flows.
94
NOTE 20 – SEGMENT AND GEOGRAPHIC DATA
We operate under two reportable segments: Telematics Systems and Software & Subscription Services. Our organizational structure is based on a number of factors that our former CEO, the Chief Operating Decision Maker (“CODM”), uses to evaluate and operate the business, which include customer base, homogeneity of products, and technology for the fiscal years presented.
Our Telematics Systems segment offers a portfolio of wireless data communications products, which includes asset tracking units, SVR units in the U.S., mobile telematics devices, fixed and mobile wireless gateways and routers. These wireless networking devices underpin a wide range of our own and third party software and service solutions worldwide and are critical for applications demanding secure, reliable and business-critical communications. Telematics Systems segment revenues consist primarily of stand-alone product sales.
Our Software & Subscription Services segment offers cloud-based, application enablement and telematics service platforms that facilitate integration of our own applications, as well as those of third parties, through open Applications Programing Interfaces (“APIs”) to deliver full-featured IoT solutions to a wide range of customers and markets. Our scalable proprietary SaaS offerings enable rapid and cost-effective deployment of high-value solutions for customers all around the globe. Software & Subscription Services segment revenues includes SaaS, professional services, devices sold with monitoring services and amortization of revenues and costs for customized devices functional only with application subscriptions that are not sold separately.
Information by business segment is as follows (in thousands):
|
|
|
Year ended February 29, 2020 |
|
|||||||||||||
|
|
|
Operating Segments |
|
|
|
|
|
|
|
|
|
|||||
|
|
|
Telematics Systems |
|
|
Software & Subscription Services |
|
|
Corporate Expenses |
|
|
Total |
|
||||
|
Revenues |
|
$ |
241,212 |
|
|
$ |
124,895 |
|
|
|
|
|
|
$ |
366,107 |
|
|
Gross profit |
|
$ |
86,558 |
|
|
$ |
56,745 |
|
|
|
|
|
|
$ |
143,303 |
|
|
Gross margin |
|
|
35.9 |
% |
|
|
45.4 |
% |
|
|
|
|
|
|
39.1 |
% |
|
Adjusted EBITDA |
|
$ |
19,682 |
|
|
$ |
21,747 |
|
|
$ |
(4,528 |
) |
|
$ |
36,901 |
|
|
|
|
Year ended February 28, 2019 |
|
|||||||||||||
|
|
|
Operating Segments |
|
|
|
|
|
|
|
|||||||
|
|
|
Telematics Systems |
|
|
Software & Subscription Services |
|
|
Corporate Expenses |
|
|
Total |
|
||||
|
Revenues |
|
$ |
287,370 |
|
|
$ |
76,430 |
|
|
|
|
|
|
$ |
363,800 |
|
|
Gross profit |
|
$ |
110,542 |
|
|
$ |
37,222 |
|
|
|
|
|
|
$ |
147,764 |
|
|
Gross margin |
|
|
38.5 |
% |
|
|
48.7 |
% |
|
|
|
|
|
|
40.6 |
% |
|
Adjusted EBITDA |
|
$ |
40,821 |
|
|
$ |
13,093 |
|
|
$ |
(5,699 |
) |
|
$ |
48,215 |
|
|
|
|
Year ended February 28, 2018 |
|
|||||||||||||
|
|
|
Operating Segments |
|
|
|
|
|
|||||||||
|
|
|
Telematics Systems |
|
|
Software & Subscription Services |
|
|
Corporate Expenses |
|
|
Total |
|
||||
|
Revenues |
|
$ |
302,126 |
|
|
$ |
63,786 |
|
|
|
|
|
|
$ |
365,912 |
|
|
Gross profit |
|
$ |
120,774 |
|
|
$ |
30,116 |
|
|
|
|
|
|
$ |
150,890 |
|
|
Gross margin |
|
|
40.0 |
% |
|
|
47.2 |
% |
|
|
|
|
|
|
41.2 |
% |
|
Adjusted EBITDA |
|
$ |
48,943 |
|
|
$ |
8,233 |
|
|
$ |
(4,794 |
) |
|
$ |
52,382 |
|
95
The amount shown for each period in the “Corporate Expenses” column above consists of expenses that are not allocated to the business segments. These unallocated corporate expenses include salaries and benefits of certain corporate staff and expenses such as audit fees, investor relations, stock listing fees, director and officer liability insurance, and director fees and expenses.
Our CODM evaluates each segment based primarily on revenue and Adjusted Earnings Before Interest, Taxes, Depreciation and Amortization (“Adjusted EBITDA”), and we therefore consider Adjusted EBITDA to be a primary measure of operating performance of our operating segments. We define Adjusted EBITDA as earnings before investment income, interest expense, taxes, depreciation, amortization and stock-based compensation, impairment loss and other adjustments as identified below. The adjustments to our financial results prepared in accordance with U.S. generally accepted accounting principles (“GAAP”) to calculate Adjusted EBITDA are itemized below (in thousands):
|
|
|
Year Ended February 29/28, |
|
|||||||||
|
|
|
2020 |
|
|
2019 |
|
|
2018 |
|
|||
|
Net income (loss) |
|
$ |
(79,304 |
) |
|
$ |
18,398 |
|
|
$ |
16,617 |
|
|
Investment income |
|
|
(4,497 |
) |
|
|
(5,258 |
) |
|
|
(2,256 |
) |
|
Interest expense |
|
|
20,096 |
|
|
|
16,726 |
|
|
|
10,280 |
|
|
Income tax provision (benefits) |
|
|
20,454 |
|
|
|
(1,330 |
) |
|
|
10,681 |
|
|
Depreciation and amortization |
|
|
31,987 |
|
|
|
20,016 |
|
|
|
22,957 |
|
|
Stock-based compensation |
|
|
12,421 |
|
|
|
11,029 |
|
|
|
9,298 |
|
|
Impairment loss and equity in net loss of affiliate |
|
|
530 |
|
|
|
6,787 |
|
|
|
1,411 |
|
|
Loss on extinguishment of debt |
|
|
2,408 |
|
|
|
2,033 |
|
|
|
- |
|
|
Acquisition and integration related expenses |
|
|
2,210 |
|
|
|
935 |
|
|
|
- |
|
|
Non-recurring legal expenses, net of reversal of litigation provision |
|
|
6,213 |
|
|
|
(11,020 |
) |
|
|
10,738 |
|
|
Gain on LoJack battery performance legal Settlement |
|
|
- |
|
|
|
(18,333 |
) |
|
|
(28,333 |
) |
|
Restructuring |
|
|
4,400 |
|
|
|
8,015 |
|
|
|
- |
|
|
Impairment loss |
|
|
19,143 |
|
|
|
- |
|
|
|
- |
|
|
Other |
|
|
840 |
|
|
|
217 |
|
|
|
989 |
|
|
Adjusted EBITDA |
|
$ |
36,901 |
|
|
$ |
48,215 |
|
|
$ |
52,382 |
|
Our CODM does not obtain identifiable assets by segment because our businesses share resources, functions and facilities.
We do not have significant long-lived assets outside the United States.
Revenue by geographic area are as follows (in thousands):
|
|
|
Year Ended February 29/28, |
|
|||||||||
|
|
|
2020 |
|
|
2019 |
|
|
2018 |
|
|||
|
United States |
|
$ |
266,413 |
|
|
$ |
268,453 |
|
|
$ |
265,613 |
|
|
Europe, Middle East and Africa |
|
|
55,185 |
|
|
|
49,496 |
|
|
|
45,830 |
|
|
South America |
|
|
21,235 |
|
|
|
15,134 |
|
|
|
20,699 |
|
|
Asia and Pacific Rim |
|
|
9,166 |
|
|
|
13,958 |
|
|
|
12,873 |
|
|
All other |
|
|
14,108 |
|
|
|
16,759 |
|
|
|
20,897 |
|
|
|
|
$ |
366,107 |
|
|
$ |
363,800 |
|
|
$ |
365,912 |
|
Revenues by geographic area are based upon the country of billing. The geographic location of distributors and OEM customers may be different from the geographic location of the ultimate end users of the products and services provided by us. No single non-U.S. country accounted for more than 10% of our revenue in fiscal years ended February 29, 2020, February 28, 2019 and 2018.
96
NOTE 21 – QUARTERLY FINANCIAL INFORMATION (UNAUDITED)
The following summarizes certain quarterly statement of operations data for each of the quarters in fiscal years 2020 and 2019 (in thousands, except percentages and per share data). The operating results in any quarter are not necessarily indicative of the results that may be expected for any future period. We derived this data from the unaudited consolidated interim financial statements that, in our opinion, have been prepared on substantially the same basis as the audited financial statements contained elsewhere in this report and include all normal recurring adjustments necessary for a fair presentation of the financial information for the periods presented. These unaudited quarterly results should be read in conjunction with the financial statements and notes thereto included elsewhere in this report.
|
|
|
Fiscal 2020 |
|
|||||||||||||||||
|
|
|
First Quarter |
|
|
Second Quarter |
|
|
Third Quarter |
|
|
Fourth Quarter |
|
|
Total |
|
|||||
|
Revenues |
|
$ |
89,070 |
|
|
$ |
93,236 |
|
|
$ |
96,597 |
|
|
$ |
87,204 |
|
|
$ |
366,107 |
|
|
Gross profit |
|
|
35,411 |
|
|
|
37,670 |
|
|
|
36,884 |
|
|
|
33,338 |
|
|
|
143,303 |
|
|
Gross margin |
|
|
39.8 |
% |
|
|
40.4 |
% |
|
|
38.2 |
% |
|
|
38.2 |
% |
|
|
39.1 |
% |
|
Net income (loss) |
|
|
(8,693 |
) |
|
|
(7,369 |
) |
|
|
(7,415 |
) |
|
|
(55,827 |
) |
|
|
(79,304 |
) |
|
Earnings (loss) per diluted share |
|
$ |
(0.26 |
) |
|
$ |
(0.22 |
) |
|
$ |
(0.22 |
) |
|
$ |
(1.65 |
) |
|
$ |
(2.36 |
) |
|
|
|
Fiscal 2019 |
|
|||||||||||||||||
|
|
|
First Quarter |
|
|
Second Quarter |
|
|
Third Quarter |
|
|
Fourth Quarter |
|
|
Total |
|
|||||
|
Revenues |
|
$ |
94,888 |
|
|
$ |
96,037 |
|
|
$ |
88,495 |
|
|
$ |
84,380 |
|
|
$ |
363,800 |
|
|
Gross profit |
|
|
38,091 |
|
|
|
39,821 |
|
|
|
36,381 |
|
|
|
33,471 |
|
|
|
147,764 |
|
|
Gross margin |
|
|
40.1 |
% |
|
|
41.5 |
% |
|
|
41.1 |
% |
|
|
39.7 |
% |
|
|
40.6 |
% |
|
Net income (loss) |
|
|
8,511 |
|
|
|
(854 |
) |
|
|
(522 |
) |
|
|
11,263 |
|
|
|
18,398 |
|
|
Earnings (loss) per diluted share |
|
$ |
0.23 |
|
|
$ |
(0.02 |
) |
|
$ |
(0.02 |
) |
|
$ |
0.33 |
|
|
$ |
0.52 |
|
The net loss in fiscal 2020 fourth quarter included a $19.1 million impairment loss from long-lived assets and ROU assets and a $34.6 million increase of the valuation allowance against our net deferred tax assets. The impairment loss is described in Note 1 – Description of Business and Summary of Significant Accounting Policies. The increase of the valuation allowance is described in Note 13 – Income Taxes.
The net loss in fiscal 2020 third quarter included a loss of $2.4 million from extinguishment of debt. The loss was described in Note 10 – Financing Arrangements.
The net income (loss) in the fiscal 2019 first, third and fourth quarter included a gain from legal settlement of $13.3 million, $2.5 million and $2.5 million, respectively. Substantially all of the previously reserved legal provision of $19.1 million as of November 30, 2018 relating to an alleged patent infringement was reversed in the fourth quarter of fiscal 2019. These matters are described in Note 19 – Commitments and Contingencies. The net loss in fiscal 2019 second quarter included a loss of $2.0 million from extinguishment of debt. The loss on extinguishment is described in Note 10 – Financing Arrangements. As of February 28, 2019, we determined that our investment in Smart Driver Club was subject to other than temporary impairment of $5.0 million, which is reported as part of equity in net loss of affiliate and related impairment loss in our consolidated statement of comprehensive income (loss). The impairment is described in Note 9 – Other Assets.
97
Not applicable.
Evaluation of Disclosure Controls and Procedures
Our principal executive officer and principal financial officer have concluded, based on their evaluation of disclosure controls and procedures (as defined in Rules 13a-15(e) and 15d-15(e) of the Exchange Act) as of February 29, 2020, that our disclosure controls and procedures are effective, at the reasonable assurance level, to ensure that the information required to be disclosed in reports that are filed or submitted under the Exchange Act is accumulated and communicated to management, including the principal executive officer and principal financial officer, as appropriate, to allow timely decisions regarding required disclosure and to allow such information to be recorded, processed, summarized and reported within the time periods specified in the rules and forms of the Securities Exchange Commission.
Management's Report on Internal Control over Financial Reporting
Our management is responsible for establishing and maintaining adequate internal control over financial reporting, as defined in Rules 13a-15(f) and 15d-15(f) under the Exchange Act.
Our management has assessed the effectiveness of our internal control over financial reporting as of February 29, 2020. In making this assessment, management used criteria set forth in Internal Control – Integrated Framework (2013) issued by the Committee of Sponsoring Organizations of the Treadway Commission. Based on our assessment, we have concluded that as of February 29, 2020 our internal control over financial reporting is effective based on those criteria.
In March and April 2019, we acquired Car Track, S.A. de C.V. (“LoJack Mexico”) and Synovia Solutions (“Synovia”), respectively, whose financial statements constitute 9% and 2% of total assets, respectively, 9% and 3% of revenues, respectively, of the consolidated financial statements of the Company as of and for the year ended February 29, 2020. As permitted by the guidance issued by the Office of the Chief Accountant of the Securities and Exchange Commission, management excluded both LoJack Mexico and Synovia from our assessment of the effectiveness of our internal control over financial reporting for the fiscal year ended February 29, 2020.
The effectiveness of our internal control over financial reporting as of February 29, 2020 has been audited by Deloitte & Touche, LLP, an independent registered public accounting firm, as stated in their report, which is included below.
Changes in Internal Control over Financial Reporting
In connection with our initiative to integrate and enhance our global information technology systems and business processes, we initiated the phased implementation of a new ERP system. The ERP system is being implemented in phases throughout fiscal 2020 and continuing into fiscal 2021. The first phase was completed during the second quarter of fiscal 2020. As a result of this implementation, we modified certain existing internal controls over financial reporting as well as implemented new controls and procedures related to the new ERP system. Other than the continued implementation of our ERP system, there were no changes in our internal controls over financial reporting (as defined in Rules 13a-15(f) and 15d 15(f) under the Exchange Act) that occurred during the fourth quarter of fiscal 2020 that have materially affected, or are reasonably likely to materially affect, our internal controls over financial reporting.
98
Report of Independent Registered Public Accounting Firm
To the stockholders and the Board of Directors of CalAmp Corp.
Opinion on Internal Control over Financial Reporting
We have audited the internal control over financial reporting of CalAmp Corp. and subsidiaries (the “Company”) as of February 29, 2020, based on criteria established in Internal Control — Integrated Framework (2013) issued by the Committee of Sponsoring Organizations of the Treadway Commission (COSO). In our opinion, the Company maintained, in all material respects, effective internal control over financial reporting as of February 29, 2020, based on criteria established in Internal Control — Integrated Framework (2013) issued by COSO.
We have also audited, in accordance with the standards of the Public Company Accounting Oversight Board (United States) (PCAOB), the consolidated financial statements as of and for the fiscal year ended February 29, 2020, of the Company and our report dated May 5, 2020 expressed an unqualified opinion on those financial and included explanatory paragraphs regarding the Company’s adoption of Accounting Standards Update 2016-02, Leases, in the fiscal year ended February 29, 2020 and the Company’s adoption of Accounting Standards Update 2014-09, Revenue from Contracts with Customers, in the fiscal year ended February 28, 2019.
As described in Management’s Report on Internal Control over Financial Reporting, management excluded from its assessment the internal control over financial reporting at Synovia Solutions (“Synovia”) and Car Track, S.A. de C.V. (“LoJack Mexico”), which were acquired in March 2019 and April 2019, respectively, and whose financial statements constitute 9% and 2% of total assets, respectively, 9% and 3% of revenues, respectively, of the consolidated financial statements of the Company as of and for the year ended February 29, 2020. Accordingly, our audit did not include the internal control over financial reporting for Synovia and LoJack Mexico.
Basis for Opinion
The Company’s management is responsible for maintaining effective internal control over financial reporting and for its assessment of the effectiveness of internal control over financial reporting, included in the accompanying Management’s Report on Internal Control over Financial Reporting. Our responsibility is to express an opinion on the Company’s internal control over financial reporting based on our audit. We are a public accounting firm registered with the PCAOB and are required to be independent with respect to the Company in accordance with the U.S. federal securities laws and the applicable rules and regulations of the Securities and Exchange Commission and the PCAOB.
We conducted our audit in accordance with the standards of the PCAOB. Those standards require that we plan and perform the audit to obtain reasonable assurance about whether effective internal control over financial reporting was maintained in all material respects. Our audit included obtaining an understanding of internal control over financial reporting, assessing the risk that a material weakness exists, testing and evaluating the design and operating effectiveness of internal control based on the assessed risk, and performing such other procedures as we considered necessary in the circumstances. We believe that our audit provides a reasonable basis for our opinion.
99
Definition and Limitations of Internal Control over Financial Reporting
A company’s internal control over financial reporting is a process designed to provide reasonable assurance regarding the reliability of financial reporting and the preparation of financial statements for external purposes in accordance with generally accepted accounting principles. A company’s internal control over financial reporting includes those policies and procedures that (1) pertain to the maintenance of records that, in reasonable detail, accurately and fairly reflect the transactions and dispositions of the assets of the company; (2) provide reasonable assurance that transactions are recorded as necessary to permit preparation of financial statements in accordance with generally accepted accounting principles, and that receipts and expenditures of the company are being made only in accordance with authorizations of management and directors of the company; and (3) provide reasonable assurance regarding prevention or timely detection of unauthorized acquisition, use, or disposition of the company’s assets that could have a material effect on the financial statements.
Because of its inherent limitations, internal control over financial reporting may not prevent or detect misstatements. Also, projections of any evaluation of effectiveness to future periods are subject to the risk that controls may become inadequate because of changes in conditions, or that the degree of compliance with the policies or procedures may deteriorate.
/s/ Deloitte & Touche LLP
Costa Mesa, CA
May 5, 2020
100
Compensatory Arrangements of Executive Officers
On April 21, 2020, our Board of Directors, upon the recommendation of the Compensation Committee, established the target bonuses and performance goals under the fiscal 2021 executive officer incentive compensation plan. The individuals covered by the fiscal 2021 executive officer incentive compensation plan are:
|
• |
Kurtis Binder |
|
Executive Vice President, Chief Financial Officer |
|
• |
Arym Diamond |
|
Senior Vice President, Chief Revenue Officer |
|
• |
Anand Rau |
|
Senior Vice President, Engineering |
Messrs. Binder, Diamond and Rau are eligible for target bonuses of up to 75%, 100% and 50%, respectively, of their annual salaries. The target bonus amounts for all executive officers are based on us attaining certain levels of consolidated revenue, consolidated earnings before interest, taxes, depreciation, amortization and certain other adjustments (Adjusted EBITDA) and their individual performance targets for the first six months of fiscal 2021. The performance targets for the second half of fiscal 2021 have not been determined.
101
The information required by this Item will be included in our 2020 Proxy Statement, which will be filed with the SEC and is incorporated herein by reference.
The information required by this Item will be included in our 2020 Proxy Statement, which will be filed with the SEC and is incorporated herein by this reference.
|
ITEM 12. |
SECURITY OWNERSHIP OF CERTAIN BENEFICIAL OWNERS AND MANAGEMENT AND RELATED STOCKHOLDER MATTERS |
The information required by this Item will be included in our 2020 Proxy Statement, which will be filed with the SEC and is incorporated herein by this reference.
The information required by this Item will be included in our 2020 Proxy Statement, which will be filed with the SEC and is incorporated herein by this reference.
The information required by this Item will be included in our 2020 Proxy Statement, which will be filed with the SEC and is incorporated herein by this reference.
102
(a) The following documents are filed as part of this Report:
|
|
1. |
The following consolidated financial statements of CalAmp Corp. and subsidiaries are filed as part of this report under Item 8 – Financial Statements and Supplementary Data: |
|
|
|
Form 10-K |
|
|
|
Page No. |
|
|
56 |
|
|
|
57 |
|
|
|
58 |
|
|
|
59 |
|
|
|
60 |
|
|
|
61 |
|
|
2. |
Financial Statements Schedules: |
Schedule II – Valuation and Qualifying Accounts information is included in Note 18 to the consolidated financial statements which are filed as part of this report under Item 8 – Financial Statements and Supplementary Data.
All other financial statement schedules for which provision is made in the applicable accounting regulations of the Securities and Exchange Commission are not required under the related instructions or are inapplicable and, therefore, have been omitted.
|
|
3. |
Exhibits |
Exhibits required to be filed as part of this report are:
|
Exhibit Number |
|
Description |
|
|
|
|
|
2.1 |
|
|
|
|
|
|
|
3.1 |
|
|
|
|
|
|
|
3.2 |
|
|
|
|
|
|
|
4.1 |
|
|
|
|
|
|
|
4.2 |
|
|
|
|
|
|
|
4.3 |
|
|
|
|
|
|
|
4.4 |
|
103
|
Exhibit Number |
|
Description |
|
|
|
|
|
|
||
|
|
|
|
|
10. |
|
Material Contracts: |
|
|
|
(i) Other than Compensatory Plans or Arrangements: |
|
|
|
|
|
|
|
|
|
10.1 |
|
|
|
|
|
|
|
|
|
|
|
10.2 |
|
|
|
|
|
|
|
10.3 |
|
|
|
|
|
|
|
10.4 |
|
|
|
|
|
|
|
10.5 |
|
|
|
|
|
|
|
10.6 |
|
|
|
|
|
|
|
10.7 |
|
|
|
|
|
|
|
10.8 |
|
|
|
|
|
|
|
10.9 |
|
|
|
|
|
|
|
10.10 |
|
|
|
|
|
|
|
10.11 |
|
|
|
|
|
|
|
10.12 |
|
|
|
|
|
|
|
10.13 |
|
104
|
Exhibit Number |
|
Description |
|
|
|
|
|
|
||
|
|
|
|
|
10.15 |
|
|
|
|
|
|
|
10.16 |
|
|
|
|
|
|
|
10.17 |
|
|
|
|
|
|
|
10.18 |
|
|
|
|
|
|
|
10.19 |
|
|
|
|
|
|
|
10.20 |
|
|
|
|
|
|
|
10.21 |
|
|
|
|
|
|
|
10.22 |
|
|
|
|
|
|
|
10.23 |
|
|
|
|
|
|
|
10.24 |
|
|
|
|
|
|
|
10.25 |
|
|
|
|
|
|
|
10.26 |
|
|
|
|
|
|
105
|
Exhibit Number |
|
Description |
|
|
|
|
|
|
||
|
|
|
|
|
|
|
(ii) Compensatory Plans or Arrangements required to be filed as Exhibits to this Report pursuant to Item 15 (b) of this Report: |
|
|
|
|
|
10.28 |
|
|
|
|
|
|
|
10.29 |
|
|
|
|
|
|
|
10.30 |
|
|
|
|
|
|
|
|
|
|
|
|
|
|
|
10.31 |
|
|
|
|
|
|
|
10.32 |
|
|
|
|
|
|
|
10.33 |
|
|
|
|
|
|
|
|
|
|
|
10.34 |
|
|
|
|
|
|
|
|
|
|
|
10.35 |
|
|
|
|
|
|
|
10.36 |
|
|
|
|
|
|
|
10.37 |
|
|
|
|
|
|
|
10.38 |
|
Amendment No. 1 to Employment Agreement between the Company and Kurtis Binder dated May 31, 2018. |
|
|
|
|
|
10.39 |
|
|
|
|
|
|
|
10.40 |
|
|
|
|
|
|
|
10.41 |
|
|
|
|
|
|
|
21 |
|
106
|
Exhibit Number |
|
Description |
|
|
|
|
|
|
|
|
|
23.1 |
|
|
|
|
|
|
|
31.1 |
|
Certification of Chief Executive Officer pursuant to Section 302 of the Sarbanes-Oxley Act of 2002. |
|
|
|
|
|
31.2 |
|
Certification of Chief Financial Officer pursuant to Section 302 of the Sarbanes-Oxley Act of 2002. |
|
|
|
|
|
32 |
|
|
|
|
|
|
|
101 |
|
Interactive Data Files Pursuant to Rule 405 of Regulation S-T: (i) Consolidated Balance Sheets as of February 29, 2020 and 2019, (ii) Consolidated Statements of Comprehensive Income for the years ended February 29, 2020, 2019 and 2018, (iii) Consolidated Statement of Stockholders’ Equity for the years ended February 29, 2020, February 28, 2019 and 2018, (iv) Consolidated Statements of Cash Flows for the years ended February 29, 2020, February 28, 2019 and 2018, and (v) Notes to Consolidated Financial Statements. |
None.
107
Pursuant to the requirements of Section 13 or 15(d) of the Securities Exchange Act of 1934, the registrant has duly caused this report to be signed on its behalf by the undersigned, thereunto duly authorized, on May 5, 2020.
|
CALAMP CORP. |
|
|
|
|
|
By: |
/s/ Jeffery Gardner |
|
|
Jeffery Gardner |
Pursuant to the requirements of the Securities Exchange Act of 1934, this report has been signed below by the following persons on behalf of the registrant and in the capacities and on the dates indicated.
|
Signature |
|
Title |
|
Date |
|
|
|
|
|
|
|
/s/ A.J. Moyer |
|
Chairman of the Board of Directors |
|
May 5, 2020 |
|
A.J. Moyer |
|
|
|
|
|
|
||||
|
/s/ Scott Arnold |
|
Director |
|
May 5, 2020 |
|
Scott Arnold |
|
|
|
|
|
|
||||
|
/s/ Jason Cohenour |
|
Director |
|
May 5, 2020 |
|
Jason Cohenour |
||||
|
|
||||
|
/s/ Amal Johnson |
|
Director |
|
May 5, 2020 |
|
Amal Johnson |
|
|
|
|
|
|
|
|
|
|
|
/s/ Roxanne Oulman |
|
Director |
|
May 5, 2020 |
|
Roxanne Oulman |
|
|
|
|
|
|
|
|
|
|
|
/s/ Jorge Titinger |
|
Director |
|
May 5, 2020 |
|
Jorge Titinger |
|
|
|
|
|
|
||||
|
/s/ Larry Wolfe |
|
Director |
|
May 5, 2020 |
|
Larry Wolfe |
|
|
|
|
|
|
||||
|
/s/ Jeffery Gardner |
|
Interim President, Chief Executive Officer and |
|
|
|
Jeffery Gardner |
|
Director (principal executive officer) |
|
May 5, 2020 |
|
|
||||
|
/s/ Kurtis Binder |
|
Executive Vice President, Chief Financial Officer |
|
|
|
Kurtis Binder |
|
(principal accounting and financial officer) |
|
May 5, 2020 |
108