Attached files
| file | filename |
|---|---|
| EX-99.1 - EXHIBIT 99.1 - CHIMERA INVESTMENT CORP | pressrelease-q12020.htm |
| 8-K - 8-K - CHIMERA INVESTMENT CORP | chimera8-kq1x20pressre.htm |
FINANCIAL SUPPLEMENT 1st Quarter 2020
DISCLAIMER This presentation includes “forward-looking statements” within the meaning of the safe harbor provisions of the United States Private Securities Litigation Reform Act of 1995. Actual results may differ from expectations, estimates and projections and, consequently, readers should not rely on these forward-looking statements as predictions of future events. Words such as “goal” “expect,” “target,” “assume,” “estimate,” “project,” “budget,” “forecast,” “anticipate,” “intend,” “plan,” “may,” “will,” “could,” “should,” “believe,” “predicts,” “potential,” “continue,” and similar expressions are intended to identify such forward-looking statements. These forward-looking statements involve significant risks and uncertainties that could cause actual results to differ materially from expected results, including, among other things, those described in our most recent Annual Report on Form 10-K, and any subsequent Quarterly Reports on Form 10-Q and Current Report on Form 8-K, under the caption “Risk Factors.” Factors that could cause actual results to differ include, but are not limited to:our business and investment strategy; our ability to accurately forecast the payment of future dividends on our common and preferred stock, and the amount of such dividends; our ability to determine accurately the fair market value of our assets; availability of investment opportunities in real estate-related and other securities, including our valuation of potential opportunities that may arise as a result of current and future market dislocations; effect of the novel coronavirus (or COVID-19) pandemic on real estate market, financial markets and our Company, including the impact on the value, availability, financing and liquidity of mortgage assets; how COVID-19 may affect us, our operations and our personnel; our expected investments; changes in the value of our investments, including negative changes resulting in margin calls related to the financing of our assets; changes in interest rates and mortgage prepayment rates; prepayments of the mortgage and other loans underlying our mortgage-backed securities, or RMBS, or other asset-backed securities, or ABS; rates of default, delinquencies or decreased recovery rates on our investments; general volatility of the securities markets in which we invest; our ability to maintain existing financing arrangements and our ability to obtain future financing arrangements; our ability to effect our strategy to securitize residential mortgage loans; interest rate mismatches between our investments and our borrowings used to finance such purchases; effects of interest rate caps on our adjustable-rate investments; the degree to which our hedging strategies may or may not protect us from interest rate volatility; the impact of and changes to various government programs, including in response to COVID-19; impact of and changes in governmental regulations, tax law and rates, accounting guidance, and similar matters; market trends in our industry, interest rates, the debt securities markets or the general economy; estimates relating to our ability to make distributions to our stockholders in the future; our understanding of our competition; availability of qualified personnel; our ability to maintain our classification as a real estate investment trust, or, REIT, for U.S. federal income tax purposes; our ability to maintain our exemption from registration under the Investment Company Act of 1940, as amended, or 1940 Act; our expectations regarding materiality or significance; and the effectiveness of our disclosure controls and procedures. Readers are cautioned not to place undue reliance upon any forward-looking statements, which speak only as of the date made. Chimera does not undertake or accept any obligation to release publicly any updates or revisions to any forward-looking statement to reflect any change in its expectations or any change in events, conditions or circumstances on which any such statement is based. Additional information concerning these and other risk factors is contained in Chimera’s most recent filings with the Securities and Exchange Commission (SEC). All subsequent written and oral forward-looking statements concerning Chimera or matters attributable to Chimera or any person acting on its behalf are expressly qualified in their entirety by the cautionary statements above. This presentation may include industry and market data obtained through research, surveys, and studies conducted by third parties and industry publications. We have not independently verified any such market and industry data from third-party sources. This presentation is provided for discussion purposes only and may not be relied upon as legal or investment advice, nor is it intended to be inclusive of all the risks and uncertainties that should be considered. This presentation does not constitute an offer to purchase or sell any securities, nor shall it be construed to be indicative of the terms of an offer that the parties or their respective affiliates would accept. Readers are advised that the financial information in this presentation is based on company data available at the time of this presentation and, in certain circumstances, may not have been audited by the company’s independent auditors. Information is unaudited, estimated and subject to change.
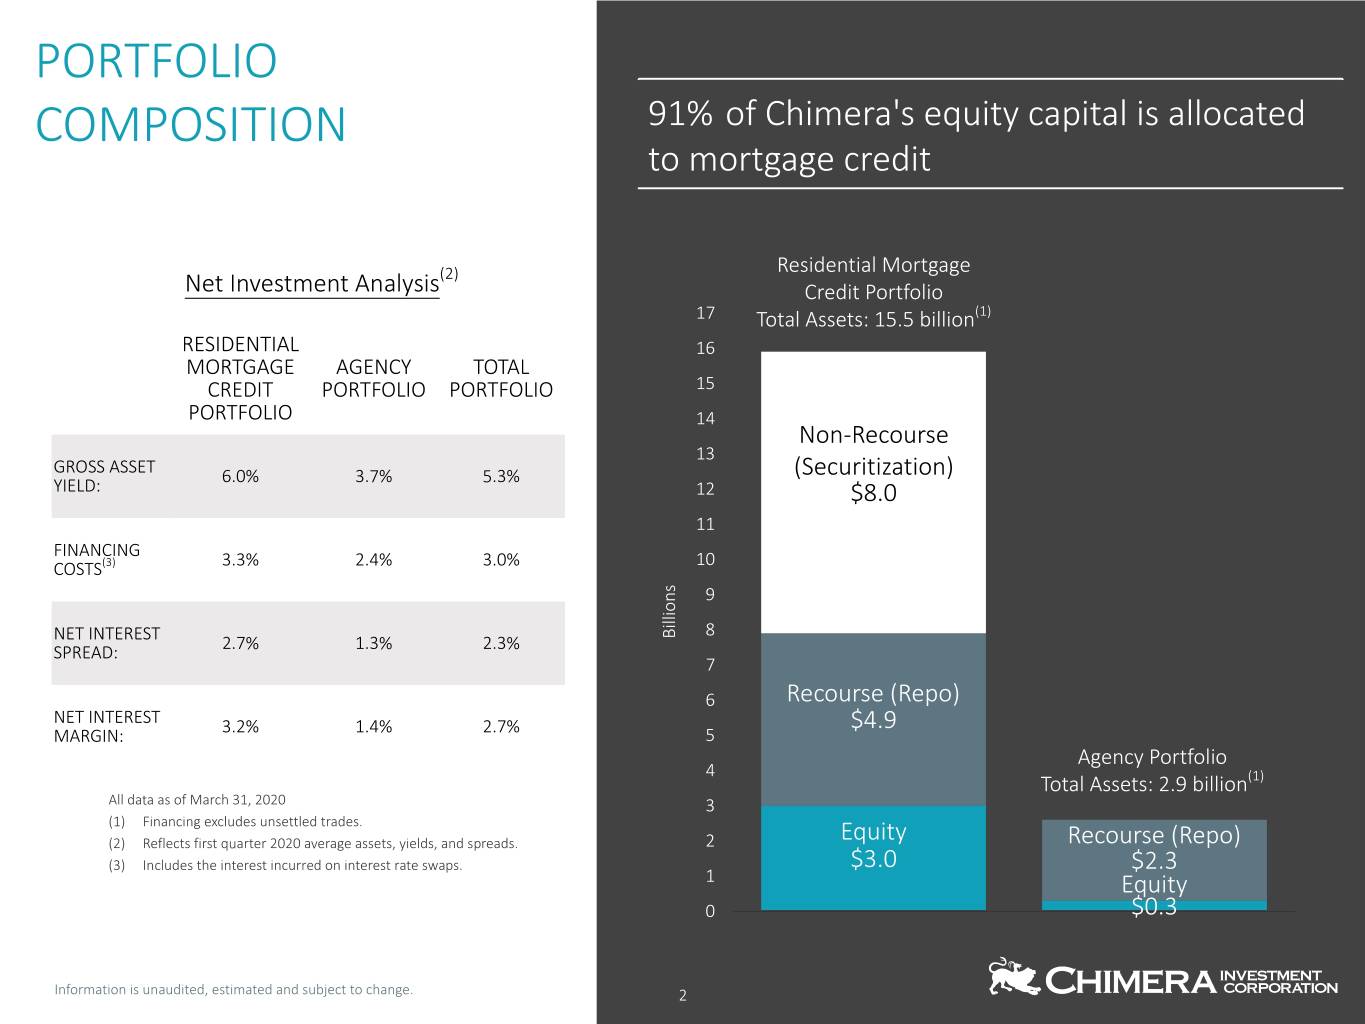
PORTFOLIO COMPOSITION 91% of Chimera's equity capital is allocated to mortgage credit (2) Residential Mortgage Net Investment Analysis Credit Portfolio 17 Total Assets: 15.5 billion(1) RESIDENTIAL 16 MORTGAGE AGENCY TOTAL CREDIT PORTFOLIO PORTFOLIO 15 PORTFOLIO 14 Non-Recourse 13 GROSS ASSET 6.0% 3.7% 5.3% (Securitization) YIELD: 12 $8.0 11 FINANCING (3) 10 COSTS 3.3% 2.4% 3.0% s n 9 o i l l i NET INTEREST B 8 SPREAD: 2.7% 1.3% 2.3% 7 6 Recourse (Repo) NET INTEREST $4.9 MARGIN: 3.2% 1.4% 2.7% 5 Agency Portfolio 4 Total Assets: 2.9 billion(1) All data as of March 31, 2020 3 (1) Financing excludes unsettled trades. (2) Reflects first quarter 2020 average assets, yields, and spreads. 2 Equity Recourse (Repo) (3) Includes the interest incurred on interest rate swaps. $3.0 $2.3 1 Equity 0 $0.3 Information is unaudited, estimated and subject to change. 2
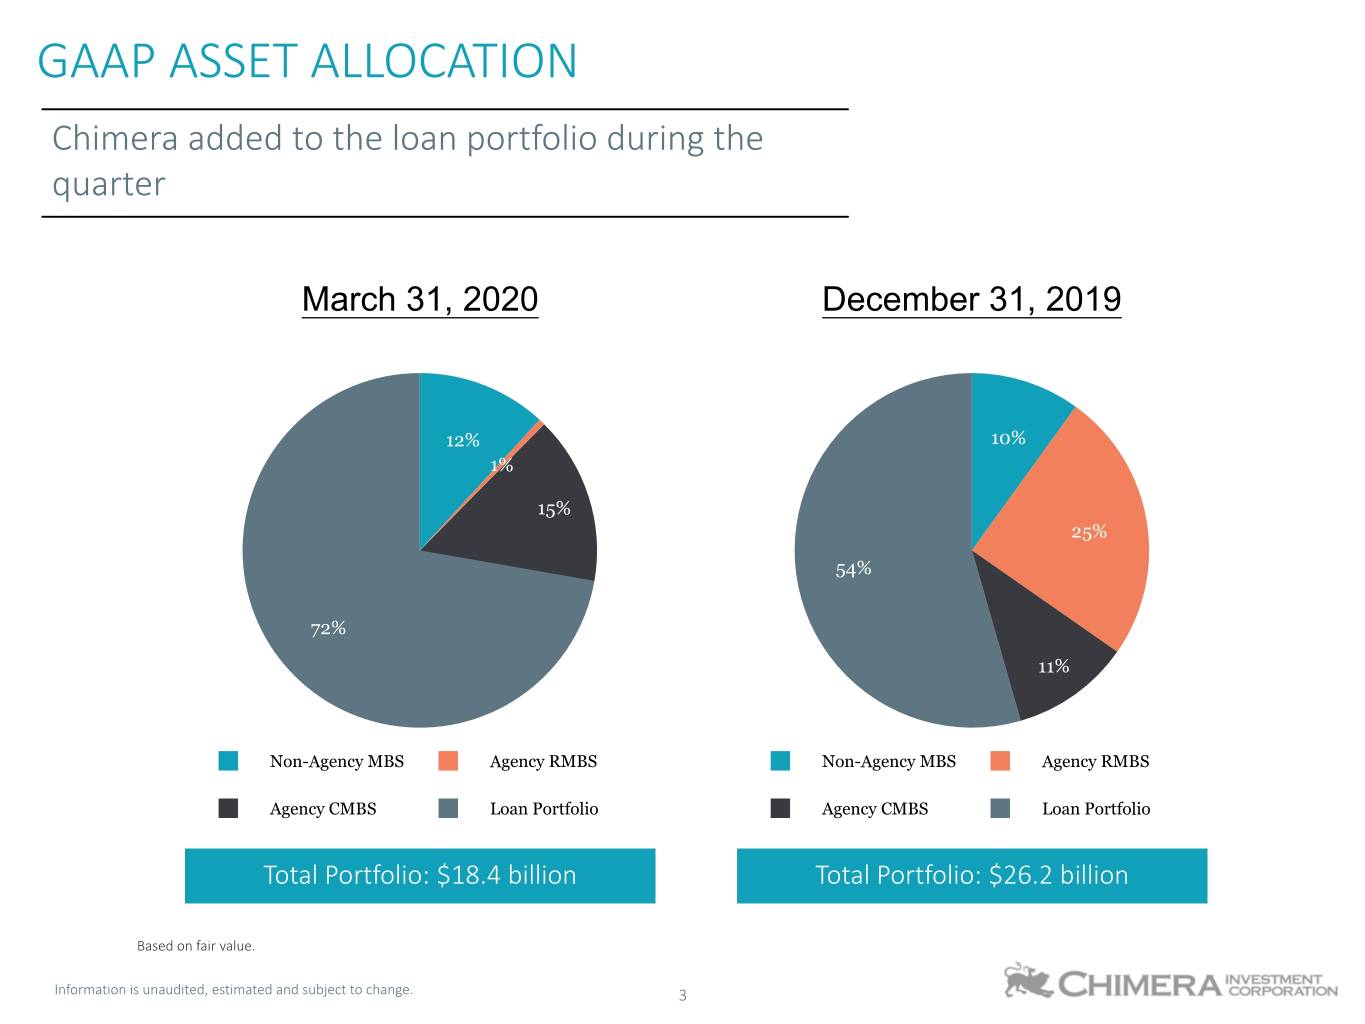
GAAP ASSET ALLOCATION Chimera added to the loan portfolio during the quarter March 31, 2020 December 31, 2019 12% 10% 1% 15% 25% 54% 72% 11% Non-Agency MBS Agency RMBS Non-Agency MBS Agency RMBS Agency CMBS Loan Portfolio Agency CMBS Loan Portfolio Total Portfolio: $18.4 billion Total Portfolio: $26.2 billion Based on fair value. Information is unaudited, estimated and subject to change. 3
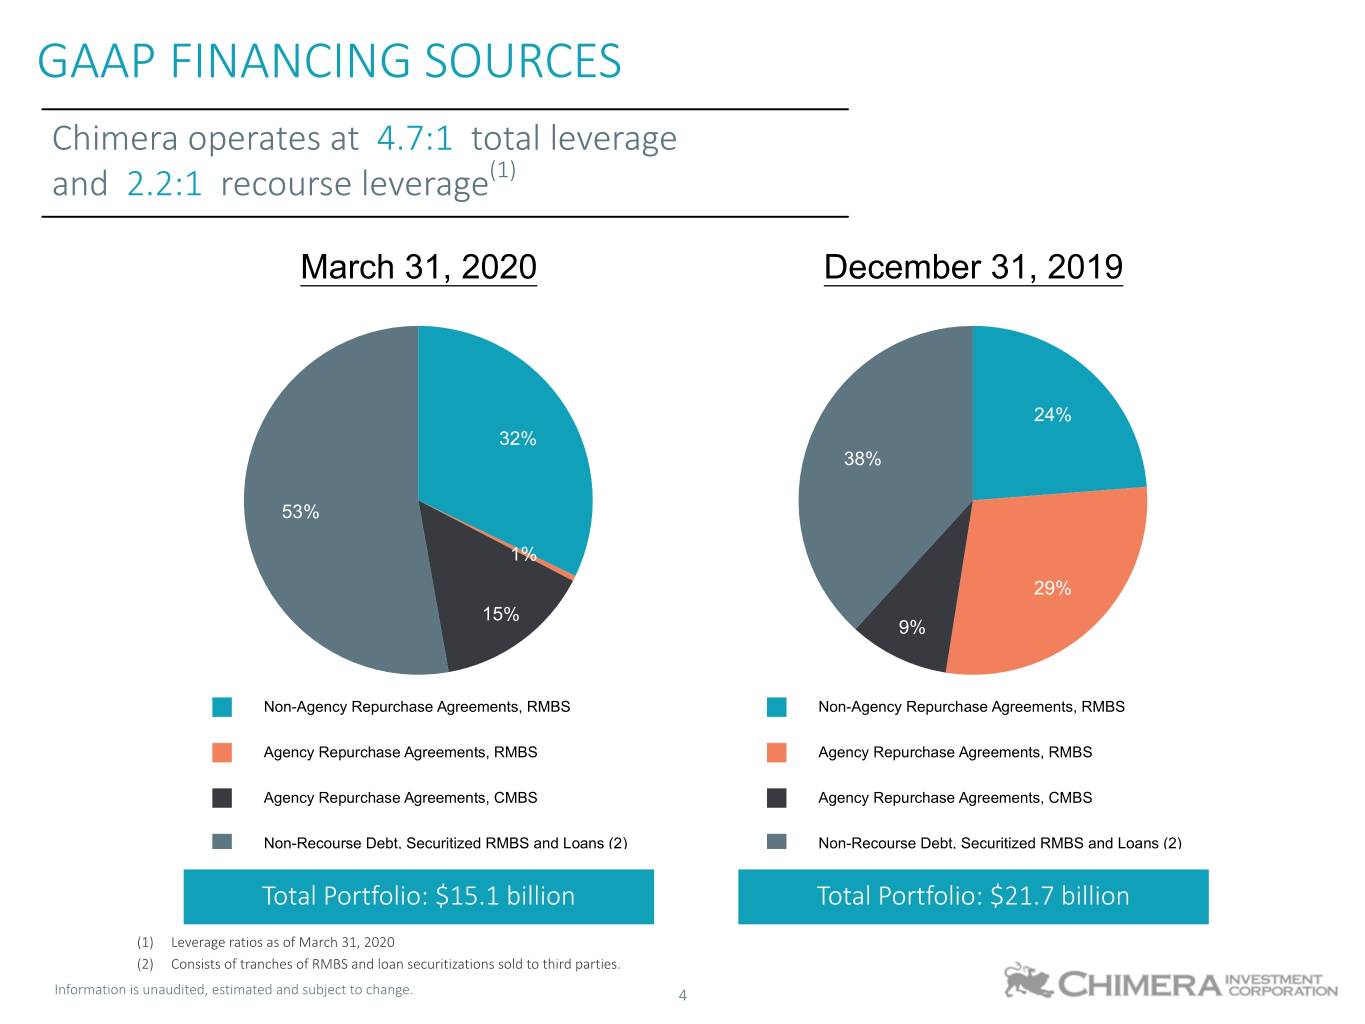
GAAP FINANCING SOURCES Chimera operates at 4.7:1 total leverage and 2.2:1 recourse leverage(1) March 31, 2020 December 31, 2019 24% 32% 38% 53% 1% 29% 15% 9% Non-Agency Repurchase Agreements, RMBS Non-Agency Repurchase Agreements, RMBS Agency Repurchase Agreements, RMBS Agency Repurchase Agreements, RMBS Agency Repurchase Agreements, CMBS Agency Repurchase Agreements, CMBS Non-Recourse Debt, Securitized RMBS and Loans (2) Non-Recourse Debt, Securitized RMBS and Loans (2) Total Portfolio: $15.1 billion Total Portfolio: $21.7 billion (1) Leverage ratios as of March 31, 2020 (2) Consists of tranches of RMBS and loan securitizations sold to third parties. Information is unaudited, estimated and subject to change. 4
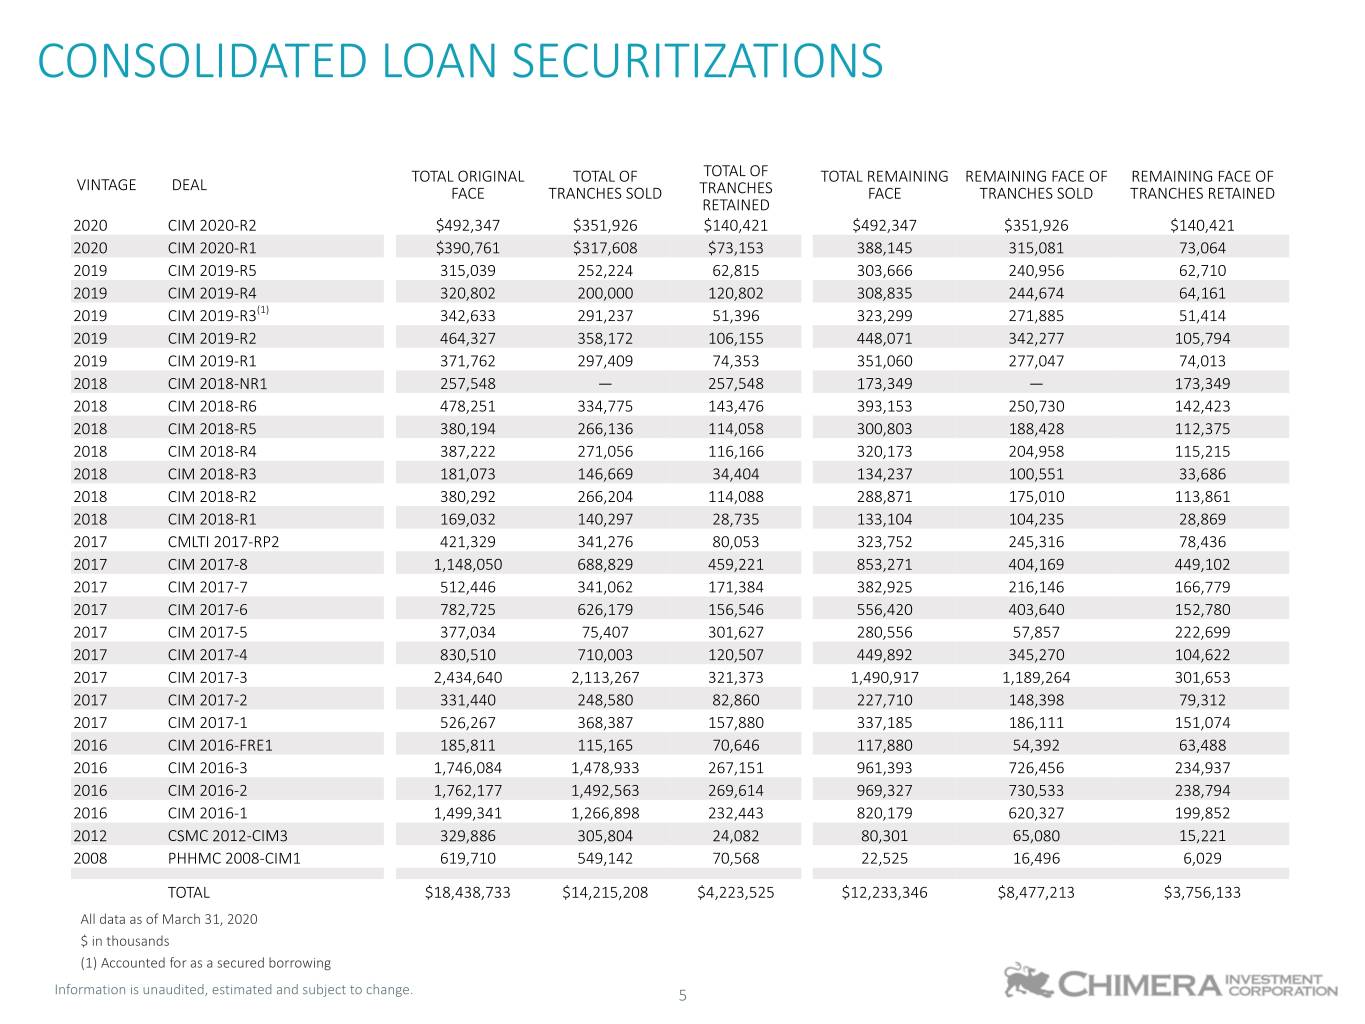
CONSOLIDATED LOAN SECURITIZATIONS TOTAL ORIGINAL TOTAL OF TOTAL OF TOTAL REMAINING REMAINING FACE OF REMAINING FACE OF VINTAGE DEAL FACE TRANCHES SOLD TRANCHES FACE TRANCHES SOLD TRANCHES RETAINED RETAINED 2020 CIM 2020-R2 $492,347 $351,926 $140,421 $492,347 $351,926 $140,421 2020 CIM 2020-R1 $390,761 $317,608 $73,153 388,145 315,081 73,064 2019 CIM 2019-R5 315,039 252,224 62,815 303,666 240,956 62,710 2019 CIM 2019-R4 320,802 200,000 120,802 308,835 244,674 64,161 2019 CIM 2019-R3(1) 342,633 291,237 51,396 323,299 271,885 51,414 2019 CIM 2019-R2 464,327 358,172 106,155 448,071 342,277 105,794 2019 CIM 2019-R1 371,762 297,409 74,353 351,060 277,047 74,013 2018 CIM 2018-NR1 257,548 — 257,548 173,349 — 173,349 2018 CIM 2018-R6 478,251 334,775 143,476 393,153 250,730 142,423 2018 CIM 2018-R5 380,194 266,136 114,058 300,803 188,428 112,375 2018 CIM 2018-R4 387,222 271,056 116,166 320,173 204,958 115,215 2018 CIM 2018-R3 181,073 146,669 34,404 134,237 100,551 33,686 2018 CIM 2018-R2 380,292 266,204 114,088 288,871 175,010 113,861 2018 CIM 2018-R1 169,032 140,297 28,735 133,104 104,235 28,869 2017 CMLTI 2017-RP2 421,329 341,276 80,053 323,752 245,316 78,436 2017 CIM 2017-8 1,148,050 688,829 459,221 853,271 404,169 449,102 2017 CIM 2017-7 512,446 341,062 171,384 382,925 216,146 166,779 2017 CIM 2017-6 782,725 626,179 156,546 556,420 403,640 152,780 2017 CIM 2017-5 377,034 75,407 301,627 280,556 57,857 222,699 2017 CIM 2017-4 830,510 710,003 120,507 449,892 345,270 104,622 2017 CIM 2017-3 2,434,640 2,113,267 321,373 1,490,917 1,189,264 301,653 2017 CIM 2017-2 331,440 248,580 82,860 227,710 148,398 79,312 2017 CIM 2017-1 526,267 368,387 157,880 337,185 186,111 151,074 2016 CIM 2016-FRE1 185,811 115,165 70,646 117,880 54,392 63,488 2016 CIM 2016-3 1,746,084 1,478,933 267,151 961,393 726,456 234,937 2016 CIM 2016-2 1,762,177 1,492,563 269,614 969,327 730,533 238,794 2016 CIM 2016-1 1,499,341 1,266,898 232,443 820,179 620,327 199,852 2012 CSMC 2012-CIM3 329,886 305,804 24,082 80,301 65,080 15,221 2008 PHHMC 2008-CIM1 619,710 549,142 70,568 22,525 16,496 6,029 TOTAL $18,438,733 $14,215,208 $4,223,525 $12,233,346 $8,477,213 $3,756,133 All data as of March 31, 2020 $ in thousands (1) Accounted for as a secured borrowing Information is unaudited, estimated and subject to change. 5
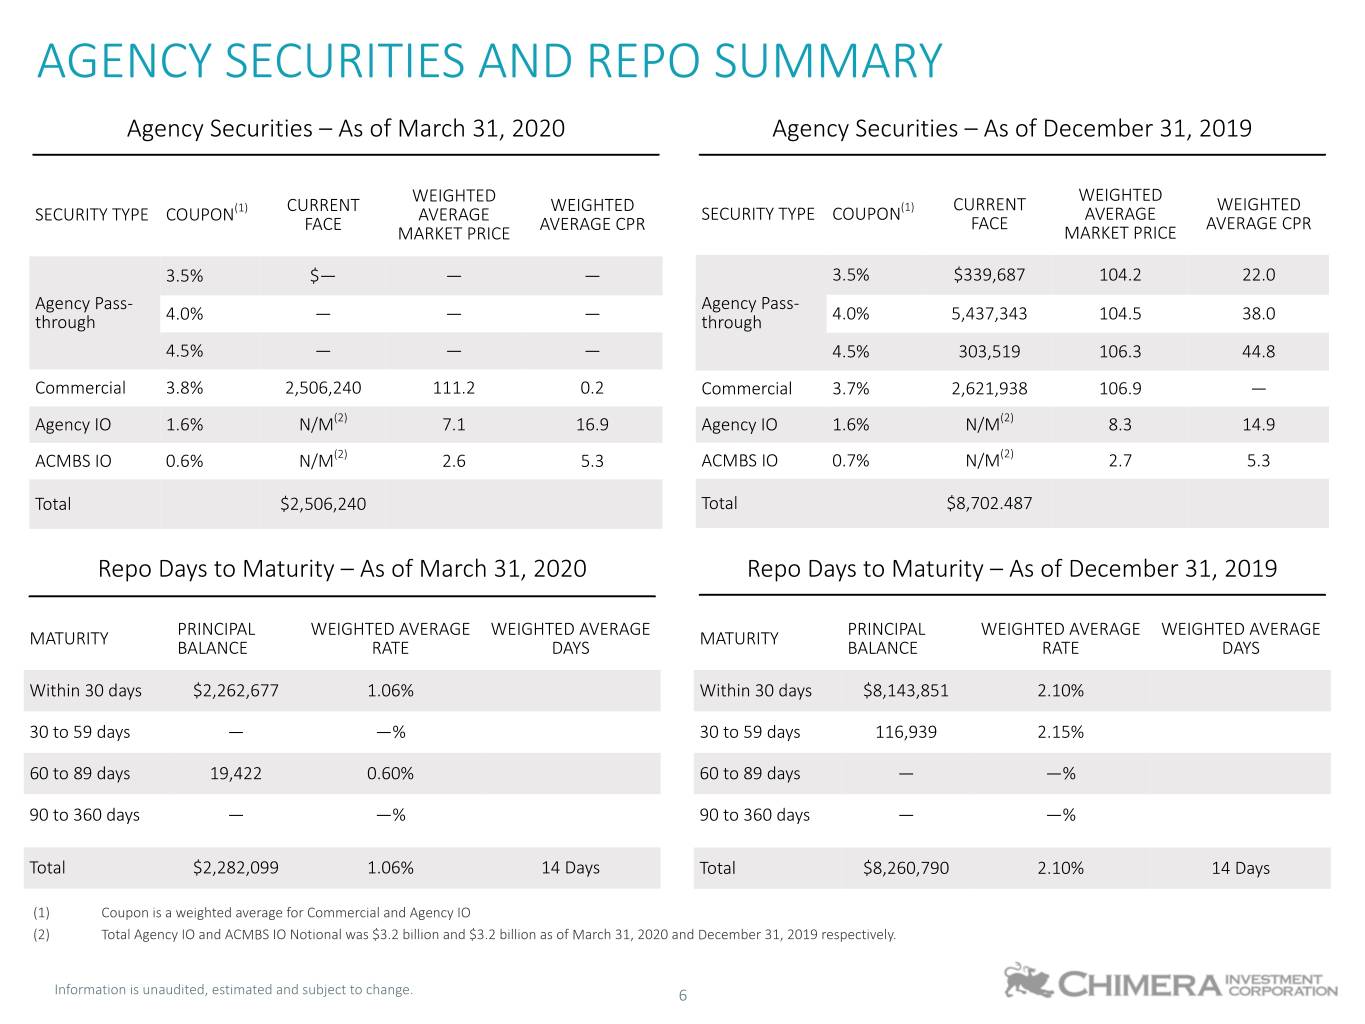
AGENCY SECURITIES AND REPO SUMMARY Agency Securities – As of March 31, 2020 Agency Securities – As of December 31, 2019 WEIGHTED WEIGHTED (1) CURRENT WEIGHTED (1) CURRENT WEIGHTED SECURITY TYPE COUPON AVERAGE SECURITY TYPE COUPON FACE AVERAGE AVERAGE CPR FACE MARKET PRICE AVERAGE CPR MARKET PRICE 3.5% $— — — 3.5% $339,687 104.2 22.0 Agency Pass- Agency Pass- through 4.0% — — — through 4.0% 5,437,343 104.5 38.0 4.5% — — — 4.5% 303,519 106.3 44.8 Commercial 3.8% 2,506,240 111.2 0.2 Commercial 3.7% 2,621,938 106.9 — Agency IO 1.6% N/M(2) 7.1 16.9 Agency IO 1.6% N/M(2) 8.3 14.9 ACMBS IO 0.6% N/M(2) 2.6 5.3 ACMBS IO 0.7% N/M(2) 2.7 5.3 Total $2,506,240 Total $8,702.487 Repo Days to Maturity – As of March 31, 2020 Repo Days to Maturity – As of December 31, 2019 PRINCIPAL WEIGHTED AVERAGE WEIGHTED AVERAGE PRINCIPAL WEIGHTED AVERAGE WEIGHTED AVERAGE MATURITY BALANCE RATE DAYS MATURITY BALANCE RATE DAYS Within 30 days $2,262,677 1.06% Within 30 days $8,143,851 2.10% 30 to 59 days — —% 30 to 59 days 116,939 2.15% 60 to 89 days 19,422 0.60% 60 to 89 days — —% 90 to 360 days — —% 90 to 360 days — —% Total $2,282,099 1.06% 14 Days Total $8,260,790 2.10% 14 Days (1) Coupon is a weighted average for Commercial and Agency IO (2) Total Agency IO and ACMBS IO Notional was $3.2 billion and $3.2 billion as of March 31, 2020 and December 31, 2019 respectively. Information is unaudited, estimated and subject to change. 6

chimerareit.com
