Attached files
| file | filename |
|---|---|
| EX-99.2 - EX-99.2 - CARVANA CO. | ex992q12020.htm |
| 8-K - 8-K - CARVANA CO. | cvna-20200506.htm |
Exhibit 99.1
Dear Shareholders,
A lot has changed since we last reported. The COVID-19 pandemic has brought unprecedented change at an unprecedented pace.
For all of us, this pandemic is a battle on two fronts: personal health and financial health. Carvana is addressing both proactively and decisively. Our initial response was to quickly adopt policies across the business to keep our team and our customers safe, including implementing a touchless delivery experience, reconfiguring our inspection centers and field locations to support social distancing and other CDC guidance, providing masks to our field employees, and executing a work from home solution for as many people as possible.
On the financial health front, we took numerous strides to position the business for this new environment. Our focus has been to thoughtfully manage risks to our baseline assumptions, fortify our financial position, and to ensure that, even as we make necessary changes, we preserve and improve what is most important to our long-term success—delivering the best experience available anywhere when buying or selling a car. These experiences are powered by our unique culture, technology, and supply chain. Maintaining our leadership in these areas is central to every decision we make.
We think that, so far, we have been successful in achieving these goals. Our team, at every level, has risen to the occasion and come together to take on this crisis. We have always believed in the power of a culture that emerges from a team of mission-driven people who find meaning in their work, and the last two months have cemented that belief. We have an incredible team.
Today, the immediate future is even more difficult than usual to predict. There will undoubtedly be additional challenges in the coming weeks and months as the world continues to evolve, and those challenges are obscured by the fog of the pandemic and economic uncertainty. But we have the right team to handle those challenges, and we are confident that we will continue to execute and delight our customers with a safer way to buy or sell a car.
Looking further into the future, we remain as optimistic as ever and potentially more so. In our minds, the most enduring things that have changed are that our team has grown stronger and our offering more desirable.
COVID-19 is an unexpected detour, but it hasn’t changed the destination.
Summary of Q1 2020 Results
All financial comparisons stated below are versus Q1 2019, unless otherwise noted. Complete financial tables appear at the end of this letter. In prior periods we calculated certain non-GAAP measures including Gross Profit per Unit ex-Gift, EBITDA Margin ex-Gift, and Adjusted Net Loss to exclude the impact of the 100k Milestone Gift program. This program has now concluded and is no longer material to current or future periods, and the adjustment is no longer included within our reported results.
Q1 2020 Financial Results:
•Retail units sold totaled 52,427, an increase of 43%
•Revenue totaled $1.098 billion, an increase of 45%
•Total gross profit was $138.4 million, an increase of 56%
•Total gross profit per unit was $2,640, an increase of $232 1
•Net loss was $183.6 million, an increase of 122%
•EBITDA margin was (12.6%), a decrease from (7.8%) 2
◦Includes (2.4%) impact from non-cash adjustments to asset carrying values related to COVID-19
1 Includes a $10 and $21 impact for the current and prior year period, respectively from the 100K Milestone Gift
2 Includes a 0.0% and 0.4% impact for the current and prior year period, respectively from the 100K Milestone Gift
1
•GAAP basic and diluted net loss per Class A share was $1.19 based on 50.4 million shares of Class A common stock outstanding
•Adjusted net loss per Class A share, a non-GAAP measure, was $1.18, based on 155.6 million adjusted shares of Class A common stock outstanding, assuming the exchange of all outstanding LLC Units for shares of Class A common stock
Q1 2020 Other Results:
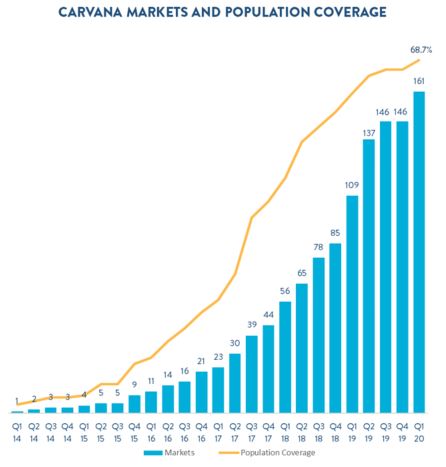
•Opened 15 new markets and 1 vending machine, bringing our end-of-quarter totals to 161 and 24, respectively.
•Completed our first nonprime securitization selling $495 million in principal balances.
•Transitioned to selling our prime loans through our existing forward flow agreement due to securitization market volatility late in the quarter.
•Amended our forward flow agreement with Ally, upsizing the purchase commitment to $2 billion, extending it to March 2021, and broadening the set of customers it covers.
Recent Events
We would also like to highlight a recent notable accomplishment:
•Closed a $600 million registered direct offering of 13.3 million Class A common shares placed with certain existing shareholders, including $25 million each from Ernest Garcia III, the Company’s founder and CEO, and Ernest Garcia II, the Company's largest shareholder.
For more information regarding the non-GAAP financial measures discussed in this letter, please see the reconciliations of our non-GAAP measurements to their most directly comparable GAAP-based financial measurements included at the end of this letter.
2
Outlook
2020 was off to a very strong start, and prior to the COVID-19 outbreak we were on track to meet or exceed our annual guidance on all key financial metrics. As previously communicated, in light of the ongoing uncertainty surrounding COVID-19, we withdrew our 2020 full year guidance provided on February 26 and we are not providing guidance at this time.
In an effort to be helpful in this uncertain environment, we are providing recent sales performance data. In mid-March, demand slowed following the various state and local government orders to shelter in place. This slowdown persisted into April with weekly retail unit sales down approximately 30% year-over-year early in the month. In recent weeks, sales have rebounded to approximately 20-30% growth year-over-year, significantly outperforming the industry.
3
Managing the Business Through COVID-19
As we face COVID-19, our approach has been to decisively position the business for this new environment while preserving and enhancing our customer experience and our other long-term advantages. We are ensuring the business remains lean and flexible by managing near-term expenses lower to align with current demand levels. We are also closely monitoring macroeconomic factors impacting our business and are proactively responding to changes in demand, retail prices, wholesale prices, and the credit environment.
Our business model and our culture drove triple digit growth rates for 6 consecutive years and position us to scale up to meet additional customer demand when COVID-19 impacts subside.
People
Carvana’s customers and team are at the heart of everything we do. Our first priority is ensuring everyone’s health and safety. Our company values have been key drivers of Carvana’s success from the beginning, and as we manage through this difficult time, our values provide the framework for our decision making.
Our Team: Throughout the COVID-19 crisis, we carefully monitored state and local orders and conferred with relevant officials as necessary to ensure we could safely operate across our markets. After temporarily pausing operations in several states pursuant to local orders, we are currently operating in all 33 states we serve. This has been and will likely remain a fluid situation as the pandemic evolves. We’ve taken precautionary measures by transitioning corporate and customer care functions to work from home, rolling out enhanced sanitation processes, enforcing social distancing policies, and mandating additional safety equipment for those in the field. To keep remote team members informed and connected, we’ve increased the frequency of company-wide communications, recognized employees who are exemplifying our core values by making our internal awards show (the HALOs) virtual, and implemented a ‘We’re All In This Together Fund’ to help employees impacted by reduced hours (more details below).
Customers: Now, more than ever, it’s important that we’re here for our customers. We’re committed to providing the safest and easiest way to buy or sell a car. With our ‘Touchless Delivery’ offering, our customers can now purchase a vehicle online and have it delivered without having any face-to-face contact. In addition, last month we designed and implemented a flexible financing solution for our customers, allowing certain customers who finance with Carvana up to 90 days to make their first payment.

4
Risk Mitigation
In light of the current economic uncertainty we think it’s prudent to take a conservative approach and focus on managing risk.
Cost structure: In response to the demand slowdown, we prioritized reducing expenses in ways that are easily reversible when demand rebounds. To this end, we temporarily paused new market openings and vending machine launches and significantly reduced discretionary growth expenditures on new hiring, travel, facilities, and IT investments. We have also rebalanced our marketing, staffing, and purchasing levels to align with demand, while closely monitoring key metrics to determine when and how quickly to adjust.
We also made the difficult decision to substantially reduce working hours for our operations and customer care teams. Our goals were to protect our team’s jobs, ensure they keep access to their benefits, and align costs with lower demand.
To offset the financial impact of reduced hours, we also launched the ‘We’re All In This Together Fund’. Over 500 employees voluntarily participated and donated a portion of their salary into the fund, including our executive team and Board of Directors, who all donated 100% of their salaries during this time. This money is being distributed to those who lost hours.
Effectively managing the business to rapidly increase volumes to pre-COVID-19 levels and bring our operations and customer care teams back to full schedules has become an additional and powerful source of motivation inside Carvana.
Inventory: In mid-March we paused inventory acquisitions in anticipation of lower demand and pricing uncertainty. We have been continuing to recondition our work-in-process units and bring down absolute inventory levels to match current demand. As of May 6, 2020, we have reduced total inventory by approximately 30% compared to the end of the first quarter. Because inventory levels have declined and demand has begun to increase, we are selectively acquiring vehicles again. As we gain greater clarity on demand and industry pricing, we will continue adapting our policies to maintain an attractive selection of vehicles for our customers.
Financial Flexibility: In March and April, we took action to fortify our balance sheet and increase our financial flexibility. We upsized our loan purchase agreement with Ally to $2 billion of capacity, demonstrating the strength of our partnership. As a result of the volatility in the securitization market, we sold our Q1 prime loans that were originally intended to be part of our two-shelf securitization program through our forward flow agreement. We also successfully completed a $600 million registered direct equity offering bringing our total liquidity resources to over $1 billion as of April 1st. We believe we have sufficient liquidity resources to provide multiple years of runway even under a deep stress scenario.
Long-Term Opportunity
Our mission is to change the way people buy cars. To accomplish this, we built a business model and supporting culture that delivers the experiences customers want. At inception, we arrived at three pillars of the customer experience we wanted to create: the best selection, the best price, and the simplest, easiest, and most fun experience.
Those pillars have informed every process and product design decision we have made and they have powered 6 straight years of triple-digit growth. These are enduring customer preferences that aren’t likely to change, and therefore the long-term opportunity and our approach to unlocking that opportunity won’t change either.
What may have changed after this pandemic is a new customer awareness of safety and a preference for less contact when shopping. We don’t know how strong this new preference will be or how long it will last, but we do know our business is well positioned to meet it.
Accordingly, we view this period as an opportunity. It is an opportunity to evolve around the edges to meet this new customer preference. It is an opportunity to come together as a team to fight and scrap to adapt, and
5
it is an opportunity to take advantage of secular trends accelerating. In turbulent times, evolution often happens more quickly. Change forces progress.
Our goal is to look back on this unprecedented change as a time that strengthened us and accelerated our progress.

Expansion
Our markets, vending machines, inspection and reconditioning centers (IRCs), and the logistics network that connects them are the backbone of Carvana’s differentiated supply chain. Prior to COVID-19, we launched 15 new markets and 1 vending machine in Q1, bringing our total markets to 161, our total U.S. population coverage to 68.7%, and our total vending machines to 24 as of March 31, 2020.
During this period of heightened uncertainty, we took several steps to reduce discretionary capital expenditures, including pausing new market openings and new vending machine and IRC purchases. Even with this reduced capex, we have ample capacity for growth within our existing footprint. We are currently operating in 8 IRCs with an annual production capacity of approximately 400k units at full utilization. We are also continuing construction on three previously identified new IRCs with existing sale-leaseback agreements in place, bringing an additional approximately 200k units of annual production capacity at full utilization when completed.
While we view these steps as prudent in light of the present uncertainty, the pandemic has also made our offering even more valuable to many consumers. As a result, we expect to open many smaller markets that can be efficiently served from our existing logistics and last-mile delivery infrastructure with limited incremental investment, which will increase our population coverage to approximately 73% in the near term.
6
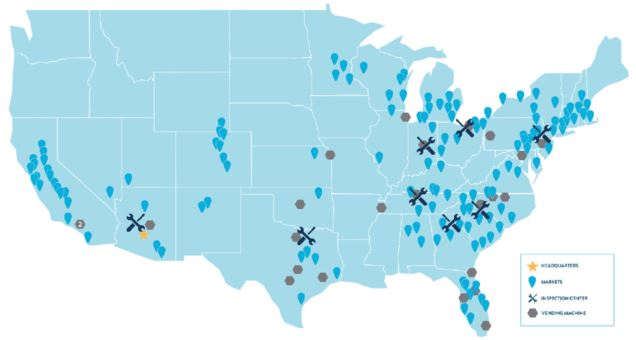
*Represents facilities and markets as of May 6, 2020
For a complete list of our market opening history, estimated populations, and estimated total industry used vehicle sales by market, along with details on our IRCs, please see: investors.carvana.com/resources/investor-materials.
7
Management Objectives
As discussed in previous shareholder letters, our management team focuses on delivering an exceptional and unparalleled customer experience while simultaneously growing the business rapidly and achieving our financial objectives. We firmly believe wowing the customer is the core of our model and drives all other metrics. To realize our long-term vision, our three primary financial objectives remain unchanged: (1) Grow Retail Units and Revenue; (2) Increase Total Gross Profit Per Unit; and (3) Demonstrate Operating Leverage. We believe continued focus on these goals will lead to a strong long-term financial model.
Below we present our long-term financial model that we introduced at our Analyst Day on November 29, 2018. We believe this is the appropriate frame through which to evaluate our results and progress towards each of our financial objectives.
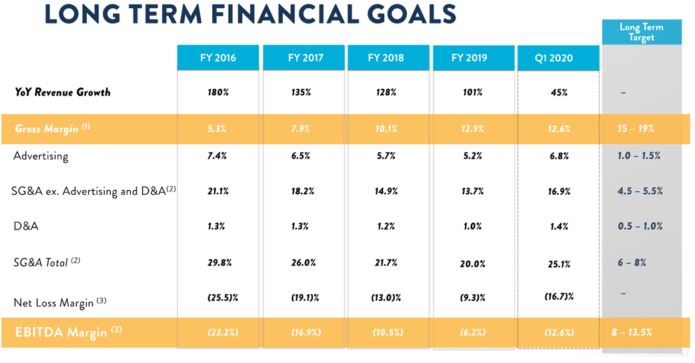
(1) Gift impact of 0.2%, 0.1%, and 0.0% in 2018, 2019, and Q1 2020, respectively.
(2) Gift impact of 0.4%, 0.2%, and 0.0% in 2018, 2019, and Q1 2020, respectively.
(3) Gift impact of 0.6%, 0.4%, and 0.0% in 2018, 2019, and Q1 2020, respectively.
Note: Numbers may not foot due to rounding
8
Objective #1: Grow Retail Units and Revenue
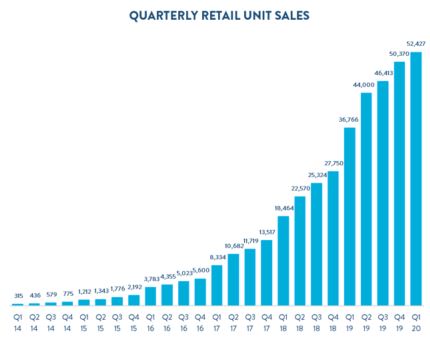
Retail units and revenue grew significantly this quarter despite lower demand starting in mid-March due to COVID-19. Retail units sold increased to 52,427, up 43% from 36,766 in Q1 2019. Revenue in Q1 grew to $1.098 billion, up 45% from $755 million.
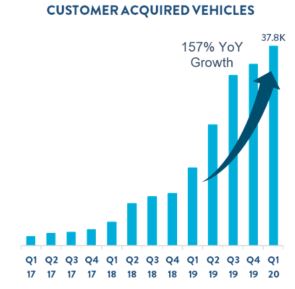
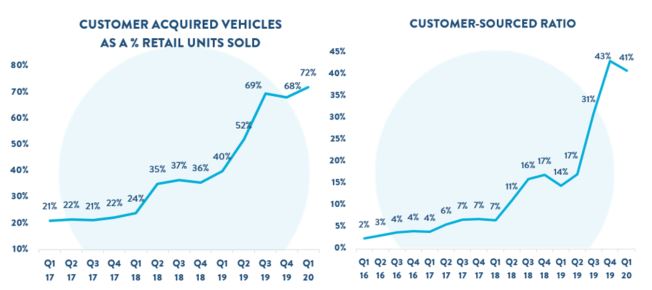
Buying Cars from Customers
Our offering of buying cars from customers continued to gain momentum. In Q1 2020 total vehicles acquired from customers grew 157% year-over-year. This translates to buying 72% as many vehicles from customers as we sold to them, up from 40% in Q1 2019. In Q1 2020, 41% of retail units sold were sourced from customers, up from 14% in Q1 2019. Due to the uncertainty in demand and industry-wide used vehicle pricing from COVID-19, we temporarily paused standalone vehicle purchases from customers in March; however, we are now beginning to selectively acquire vehicles from customers again as demand has increased and our inventory level has declined. We will continue to monitor demand and industry pricing trends and plan to further expand this offering over time with a bias toward risk mitigation until a more normalized environment returns. Buying cars from customers is integral to simplifying the automotive value chain and accessing high-quality selection while simultaneously benefiting GPU.
9
Objective #2: Increase Total Gross Profit Per Unit
We achieved another strong quarter of total GPU growth, primarily driven by strength in retail GPU, partially offset by a decrease in finance GPU. Retail GPU was the highest in company history, and our finance GPU remained resilient despite an environment of extreme volatility.
For Q1 2020:
•Total
◦Total GPU was $2,640 vs. $2,408 in Q1 20193
•Retail
◦Retail GPU was $1,581 vs. $1,282 in Q1 20193
◦Changes in retail vehicle GPU were primarily driven by increases in buying cars from customers partially offset by an adjustment to the value of our unsold inventory to reflect current market conditions.
•Wholesale
◦Wholesale GPU was $23 vs. $83 in Q1 20193
◦Changes in wholesale GPU were driven by a reduction in gross profit per wholesale unit sold to $114 from $453, primarily driven by an adjustment to the value of our unsold inventory to reflect current market conditions.
•Other
◦Other GPU was $1,036 vs. $1,044 in Q1 2019
◦Changes in Other GPU were driven by higher attachment of VSC and GAP waiver coverage, and lower finance GPU. Total finance GPU was $528 in Q1 compared to $625 in Q1 2019. We completed our inaugural nonprime securitization in March and sold our prime loans under our forward flow agreement in place of a prime securitization. Due to significant market volatility following COVID-19, the premiums we earned on both pools were less than we earned on similar loan pools sold in Q4, leading to a sequential reduction in finance GPU of $451.
3 Total GPU includes a $10 and $21 impact in Q1 2020 and Q1 2019, respectively, from the 100K milestone Gift. This includes a $10 and $20 impact, respectively, in retail GPU and a $0 and $1 impact, respectively, in wholesale GPU.
10
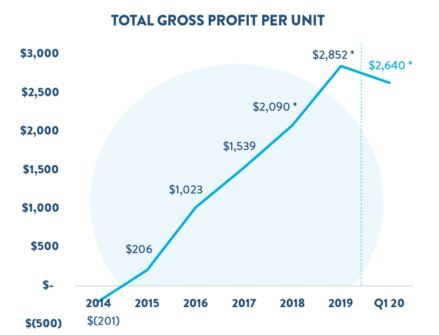
*2018, 2019, and Q1 2020 include a $43, $31, and $10 impact from the 100K Milestone Gift, respectively
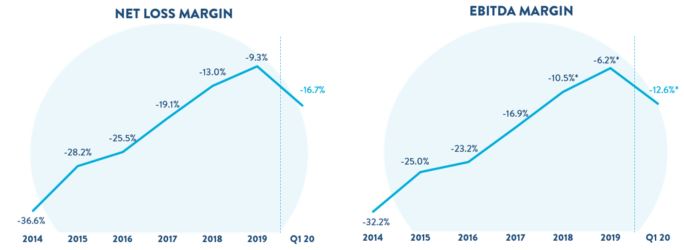
Objective #3: Demonstrate Operating Leverage
Following the spread of COVID-19, we made swift changes to reduce SG&A expenses to better match the lower demand caused by the pandemic. However, the reduction in sales and the transitional expenses associated with rapidly changing our operations outweighed these cost reductions, leading to increased SG&A as a percentage of revenue.
For Q1 2020, as a percentage of revenue:
•Total SG&A increased by 4.6% as a percentage of revenue, primarily reflecting spending in anticipation of higher volumes that didn’t materialize to the extent expected due to COVID-19.4
•Compensation and benefits increased by 0.9%4, Advertising increased by 1.6%, Logistics and Market occupancy increased by 0.3%, and Other SG&A increased by 1.8%, also primarily driven by impacts from COVID-19.
*2018, 2019, and Q1 2020 include a 0.6%, 0.4%, and 0.0% impact from the 100K Milestone Gift, respectively
4 Prior year period includes a 0.3% impact from the 100k Milestone Gift, contained within Compensation and Benefits
11
Summary
This pandemic has been an incredible test for us so far. It is testing our business model and it is testing our people. We came into it a team of passionate people who had been tested by the trials of building a company, but not by the trials of a global crisis. We are now facing these tests, at least the first wave of them. And we are incredibly proud of how we are faring.
We have always been a company with ambitious goals, and we’ve known that fulfilling that ambition would require passing several tests. A good indicator of your ability to pass any given test is whether your last test strengthened or weakened you. This test is strengthening us. Our team is standing tall. We know this battle isn’t over, and we know it won’t be our last. We also know that there is no other team we would rather be a part of as we face these battles together.
We remain firmly on the path to selling 2 million+ cars and to becoming the largest and most profitable automotive retailer.
Sincerely,
Ernie Garcia, III, Chairman and CEO
Mark Jenkins, CFO
12
Appendix
Conference Call Details
Carvana will host a conference call today, May 6, 2020, at 5:30 p.m. EDT (2:30 p.m. PDT) to discuss financial results. To participate in the live call, analysts and investors should dial (833) 255-2830 or (412) 902-6715, and ask for “Carvana Earnings.” A live audio webcast of the conference call along with supplemental financial information will also be accessible on the company's website at investors.carvana.com. Following the webcast, an archived version will also be available on the Investor Relations section of the company’s website. A telephonic replay of the conference call will be available until May 13, 2020, by dialing (877) 344-7529 or (412) 317-0088 and entering passcode 10142237#.
Forward Looking Statements
This letter contains forward-looking statements within the meaning of the Private Securities Litigation Reform Act of 1995. These forward-looking statements reflect Carvana’s current expectations and projections with respect to, among other things, its financial condition, results of operations, plans, objectives, future performance, and business. These statements may be preceded by, followed by or include the words "aim," "anticipate," "believe," "estimate," "expect," "forecast," "intend," "likely," "outlook," "plan," "potential," "project," "projection," "seek," "can," "could," "may," "should," "would," "will," the negatives thereof and other words and terms of similar meaning.
Forward-looking statements include all statements that are not historical facts. Such forward-looking statements are subject to various risks and uncertainties. Accordingly, there are or will be important factors that could cause actual outcomes or results to differ materially from those indicated in these statements. Among these factors are risks related to the “Risk Factors” identified in our Annual Report on Form 10-K for 2019 and our Quarterly Report on Form 10-Q for Q1 2020.
There is no assurance that any forward-looking statements will materialize. You are cautioned not to place undue reliance on forward-looking statements, which reflect expectations only as of this date. Carvana does not undertake any obligation to publicly update or review any forward-looking statement, whether as a result of new information, future developments, or otherwise.
Use of Non-GAAP Financial Measures
As appropriate, we supplement our results of operations determined in accordance with U.S. generally accepted accounting principles (“GAAP”) with certain non-GAAP financial measurements that are used by management, and which we believe are useful to investors, as supplemental operational measurements to evaluate our financial performance. These measurements should not be considered in isolation or as a substitute for reported GAAP results because they may include or exclude certain items as compared to similar GAAP-based measurements, and such measurements may not be comparable to similarly-titled measurements reported by other companies. Rather, these measurements should be considered as an additional way of viewing aspects of our operations that provide a more complete understanding of our business. We strongly encourage investors to review our consolidated financial statements included in publicly filed reports in their entirety and not rely solely on any one, single financial measurement or communication.
Reconciliations of our non-GAAP measurements to their most directly comparable GAAP-based financial measurements are included at the end of this letter.
Investor Relations Contact Information: Mike Levin, investors@carvana.com
13
CARVANA CO. AND SUBSIDIARIES
CONDENSED CONSOLIDATED BALANCE SHEETS
(Unaudited)
(In thousands)
| March 31, 2020 | December 31, 2019 | ||||||||||
| ASSETS | |||||||||||
| Current assets: | |||||||||||
| Cash and cash equivalents | $ | 72,435 | $ | 76,016 | |||||||
| Restricted cash | 72,600 | 42,443 | |||||||||
| Accounts receivable, net | 26,591 | 39,864 | |||||||||
| Finance receivables held for sale, net | 199,045 | 286,969 | |||||||||
| Vehicle inventory | 844,681 | 762,696 | |||||||||
| Beneficial interests in securitizations | 118,923 | 98,780 | |||||||||
| Other current assets | 59,309 | 52,654 | |||||||||
| Total current assets | 1,393,584 | 1,359,422 | |||||||||
| Property and equipment, net | 645,485 | 543,471 | |||||||||
Operating lease right-of-use assets, including $43,677 and $44,583, respectively, from leases with related parties | 169,741 | 123,420 | |||||||||
| Intangible assets, net | 6,685 | 7,232 | |||||||||
| Goodwill | 9,353 | 9,353 | |||||||||
Other assets, including $8,372 and $6,138, respectively, due from related parties | 14,370 | 14,850 | |||||||||
| Total assets | $ | 2,239,218 | $ | 2,057,748 | |||||||
| LIABILITIES & STOCKHOLDERS' EQUITY | |||||||||||
| Current liabilities: | |||||||||||
Accounts payable and accrued liabilities, including $10,173 and $9,549, respectively, due to related parties | $ | 246,783 | $ | 234,443 | |||||||
| Short-term revolving facilities | 812,214 | 568,840 | |||||||||
| Current portion of long-term debt | 53,286 | 48,731 | |||||||||
Other current liabilities, including $4,436 and $4,518, respectively, from leases with related parties | 16,141 | 12,856 | |||||||||
| Total current liabilities | 1,128,424 | 864,870 | |||||||||
Long-term debt, excluding current portion, including $15,000 held by a related party | 936,121 | 883,060 | |||||||||
Operating lease liabilities, excluding current portion, including $40,732 and $41,829, respectively, from leases with related parties | 159,751 | 116,071 | |||||||||
| Other liabilities | 1,696 | 1,808 | |||||||||
| Total liabilities | 2,225,992 | 1,865,809 | |||||||||
| Commitments and contingencies | |||||||||||
| Stockholders' equity: | |||||||||||
Preferred stock, $0.01 par value - 50,000 shares authorized; none issued and outstanding as of March 31, 2020 and December 31, 2019 | — | — | |||||||||
Class A common stock, $0.001 par value - 500,000 shares authorized; 50,660 and 50,507 shares issued and outstanding as of March 31, 2020 and December 31, 2019, respectively | 51 | 51 | |||||||||
Class B common stock, $0.001 par value - 125,000 shares authorized; 101,200 and 101,219 shares issued and outstanding as of March 31, 2020 and December 31, 2019, respectively | 101 | 101 | |||||||||
| Additional paid-in capital | 285,874 | 280,994 | |||||||||
| Accumulated deficit | (242,921) | (183,034) | |||||||||
| Total stockholders' equity attributable to Carvana Co. | 43,105 | 98,112 | |||||||||
| Non-controlling interests | (29,879) | 93,827 | |||||||||
| Total stockholders' equity | 13,226 | 191,939 | |||||||||
| Total liabilities & stockholders' equity | $ | 2,239,218 | $ | 2,057,748 | |||||||
14
CARVANA CO. AND SUBSIDIARIES
CONDENSED CONSOLIDATED STATEMENTS OF OPERATIONS
(Unaudited)
(In thousands, except per share amounts)
| Three Months Ended March 31, | |||||||||||
| 2020 | 2019 | ||||||||||
| Sales and operating revenues: | |||||||||||
| Used vehicle sales, net | $ | 964,279 | $ | 683,829 | |||||||
| Wholesale vehicle sales | 79,606 | 33,030 | |||||||||
Other sales and revenues, including $20,562 and $10,573, respectively, from related parties | 54,331 | 38,375 | |||||||||
| Net sales and operating revenues | 1,098,216 | 755,234 | |||||||||
Cost of sales, including $842 and $1,273, respectively, to related parties | 959,794 | 666,702 | |||||||||
| Gross profit | 138,422 | 88,532 | |||||||||
Selling, general and administrative expenses, including $4,426 and $2,735, respectively, to related parties | 275,711 | 155,241 | |||||||||
Interest expense, including $333 to related parties | 28,862 | 15,648 | |||||||||
| Other expense, net | 17,406 | 239 | |||||||||
| Net loss before income taxes | (183,557) | (82,596) | |||||||||
| Income tax provision | — | — | |||||||||
| Net loss | (183,557) | (82,596) | |||||||||
| Net loss attributable to non-controlling interests | (123,670) | (59,481) | |||||||||
| Net loss attributable to Carvana Co. | $ | (59,887) | $ | (23,115) | |||||||
| Net loss per share of Class A common stock, basic and diluted | $ | (1.19) | $ | (0.56) | |||||||
Weighted-average shares of Class A common stock, basic and diluted (1) | 50,399 | 41,352 | |||||||||
(1) Weighted-average shares of Class A common stock outstanding have been adjusted for unvested restricted stock awards.
15
CARVANA CO. AND SUBSIDIARIES
CONDENSED CONSOLIDATED STATEMENTS OF CASH FLOWS
(Unaudited)
(In thousands)
| Three Months Ended March 31, | |||||||||||
| 2020 | 2019 | ||||||||||
| Cash Flows from Operating Activities: | |||||||||||
| Net loss | $ | (183,557) | $ | (82,596) | |||||||
| Adjustments to reconcile net loss to net cash used in operating activities: | |||||||||||
| Depreciation and amortization expense | 15,811 | 7,943 | |||||||||
| Loss on disposal of property and equipment | 145 | 49 | |||||||||
| Provision for bad debt and valuation allowance | 5,213 | 1,385 | |||||||||
| Gain on loan sales | (12,976) | (19,200) | |||||||||
| Equity-based compensation expense | 5,940 | 7,711 | |||||||||
| Amortization and write-off of debt issuance costs and bond premium | 1,932 | 979 | |||||||||
| Originations of finance receivables | (782,240) | (532,066) | |||||||||
| Proceeds from sale of finance receivables, net | 812,868 | 601,557 | |||||||||
| Purchase of finance receivables | — | (127,710) | |||||||||
| Principal payments received on finance receivables held for sale | 25,653 | 11,227 | |||||||||
| Unrealized loss on beneficial interests in securitization | 11,405 | — | |||||||||
| Changes in assets and liabilities: | |||||||||||
| Accounts receivable | 12,995 | (5,435) | |||||||||
| Vehicle inventory | (80,014) | (112,536) | |||||||||
| Other assets | (3,985) | (12,873) | |||||||||
| Accounts payable and accrued liabilities | 1,820 | 48,632 | |||||||||
| Operating lease right-of-use assets | (46,321) | (1,262) | |||||||||
| Operating lease liabilities | 46,965 | 68 | |||||||||
| Other liabilities | (112) | (382) | |||||||||
| Net cash used in operating activities | (168,458) | (214,509) | |||||||||
| Cash Flows from Investing Activities: | |||||||||||
Purchases of property and equipment, including $0 and $4,257, respectively, from related parties | (89,433) | (43,199) | |||||||||
| Principal payments received on beneficial interests in securitizations | 725 | — | |||||||||
| Net cash used in investing activities | (88,708) | (43,199) | |||||||||
| Cash Flows from Financing Activities: | |||||||||||
| Proceeds from short-term revolving facilities | 1,964,496 | 807,890 | |||||||||
| Payments on short-term revolving facilities | (1,721,122) | (570,076) | |||||||||
| Proceeds from issuance of long-term debt | 51,963 | 41,817 | |||||||||
| Payments on long-term debt | (5,912) | (3,003) | |||||||||
| Payments of debt issuance costs | (3,472) | (567) | |||||||||
| Proceeds from exercise of stock options | 145 | 426 | |||||||||
| Tax withholdings related to restricted stock awards | (2,356) | (433) | |||||||||
| Net cash provided by financing activities | 283,742 | 276,054 | |||||||||
| Net increase in cash, cash equivalents and restricted cash | 26,576 | 18,346 | |||||||||
| Cash, cash equivalents and restricted cash at beginning of period | 118,459 | 88,709 | |||||||||
| Cash, cash equivalents and restricted cash at end of period | $ | 145,035 | $ | 107,055 | |||||||
16
CARVANA CO. AND SUBSIDIARIES
RECONCILIATION OF GAAP TO NON-GAAP FINANCIAL MEASURES
(Unaudited)
In prior periods we calculated non-GAAP measures including Gross Profit ex-Gift, Gross Profit per Unit ex-Gift, EBITDA ex-Gift, EBITDA Margin ex-Gift, Adjusted Net Loss and Adjusted Net Loss per Share, to exclude the impact of the 100k Milestone Gift program. As this program has concluded it is not material to current or future years and the adjustment is no longer included within similar calculations. For the three months ended March 31, 2020, there was approximately $0.5 million of stock based compensation related to the 100k Milestone Gift program within cost of sales, which would impact all measures. For the three months ended March 31, 2019, there was approximately $3.0 million of stock based compensation related to the 100k Milestone Gift program impacting the calculation of EBITDA ex-Gift, EBITDA Margin ex-Gift, Adjusted Net Loss, and Adjusted Net Loss per Share, including approximately $0.8 million within cost of sales impacting the calculation of Gross Profit ex-Gift and Gross Profit per Unit ex-Gift.
Adjusted Net Loss and Adjusted Net Loss per Share
Adjusted net loss represents net loss attributable to Carvana Co. assuming the full exchange of all outstanding LLC Units for shares of Class A common stock. Adjusted net loss per share is calculated by dividing adjusted net loss by the weighted-average shares of Class A common stock outstanding assuming the full exchange of all outstanding LLC Units.
Adjusted net loss and adjusted net loss per share are supplemental measures of operating performance that do not represent and should not be considered alternatives to net loss and net loss per share, as determined under GAAP. We believe that by assuming the full exchange of all outstanding LLC Units, adjusted net loss and adjusted net loss per share supplement GAAP measures and enable us and our investors to more effectively evaluate our performance period-over-period and relative to our competitors that have different organizational and tax structures because the assumption eliminates the effect of any changes in net loss attributable to Carvana Co. driven by increases in our ownership of Carvana Group, LLC, which are unrelated to our operating performance.
A reconciliation of adjusted net loss to net loss attributable to Carvana Co., the most directly comparable GAAP measure, and the computation of adjusted net loss per share are as follows (in thousands, except per share amounts):
| Three Months Ended March 31, | |||||||||||||||||
| 2020 | 2019 | ||||||||||||||||
| Numerator: | |||||||||||||||||
| Net loss attributable to Carvana Co. | $ | (59,887) | $ | (23,115) | |||||||||||||
| Net loss attributable to non-controlling interests | (123,670) | (59,481) | |||||||||||||||
Adjusted net loss attributable to Carvana Co. Class A common stock (2) | $ | (183,557) | $ | (82,596) | |||||||||||||
| Denominator: | |||||||||||||||||
Weighted-average shares of Class A common stock outstanding(1) | 50,399 | 41,352 | |||||||||||||||
| Adjustments: | |||||||||||||||||
| Weighted-average assumed exchange of LLC Units for shares of Class A common stock | 105,241 | 108,974 | |||||||||||||||
| Adjusted shares of Class A common stock outstanding | 155,640 | 150,326 | |||||||||||||||
Adjusted net loss per share (3) | $ | (1.18) | $ | (0.55) | |||||||||||||
(1) Excludes approximately 1.1 million and 0.7 million nonvested service-based restricted stock awards and units outstanding at March 31, 2020 and 2019, respectively, and 1.3 million vested and nonvested stock options outstanding at both March 31, 2020 and 2019 because they were determined to be anti-dilutive.
(2) Includes $0.5 million and $3.0 million, respectively, related to the 100k Milestone Gift.
(3) Includes $0.00 and $0.02 per share, respectively, related to the 100k Milestone Gift.
17
CARVANA CO. AND SUBSIDIARIES
RECONCILIATION OF GAAP TO NON-GAAP FINANCIAL MEASURES (continued)
(Unaudited)
EBITDA and EBITDA Margin
EBITDA and EBITDA Margin are supplemental measures of operating performance that do not represent and should not be considered an alternative to net loss or cash flow from operations, as determined by GAAP. EBITDA is defined as net loss before interest expense, income tax expense, and depreciation and amortization expense. EBITDA Margin is EBITDA as a percentage of total revenues. We use EBITDA to measure the operating performance of our business and EBITDA Margin to measure our operating performance relative to our total revenues. We believe that EBITDA and EBITDA Margin are useful measures to us and to our investors because they exclude certain financial and capital structure items that we do not believe directly reflect our core operations and may not be indicative of our recurring operations, in part because they may vary widely across time and within our industry independent of the performance of our core operations. We believe that excluding these items enables us to more effectively evaluate our performance period-over-period and relative to our competitors. EBITDA and EBITDA Margin may not be comparable to similarly titled measures provided by other companies due to potential differences in methods of calculations. A reconciliation of EBITDA to net loss is the most directly comparable GAAP measure, and calculation of EBITDA Margin is as follows (dollars in thousands):
| Three Months Ended | ||||||||||||||||||||||||||||||||
| Mar 31, 2019 | Jun 30, 2019 | Sep 30, 2019 | Dec 31, 2019 | Mar 31, 2020 | ||||||||||||||||||||||||||||
Net loss (1) | $ | (82,596) | $ | (64,059) | $ | (92,244) | $ | (125,740) | $ | (183,557) | ||||||||||||||||||||||
| Depreciation and amortization expense | 7,943 | 8,887 | 10,675 | 13,760 | 15,811 | |||||||||||||||||||||||||||
| Interest expense | 15,648 | 19,315 | 20,990 | 24,653 | 28,862 | |||||||||||||||||||||||||||
| EBITDA | $ | (59,005) | $ | (35,857) | $ | (60,579) | $ | (87,327) | $ | (138,884) | ||||||||||||||||||||||
| Total revenues | $ | 755,234 | $ | 986,221 | $ | 1,094,854 | $ | 1,103,587 | $ | 1,098,216 | ||||||||||||||||||||||
| Net Loss Margin | (10.9) | % | (6.5) | % | (8.4) | % | (11.4) | % | (16.7) | % | ||||||||||||||||||||||
EBITDA Margin (2) | (7.8) | % | (3.6) | % | (5.5) | % | (7.9) | % | (12.6) | % | ||||||||||||||||||||||
(1) Includes $3.0 million, $3.3 million, $4.4 million, $2.5 million, and $0.5 million, respectively, related to the 100k Milestone Gift.
(2) Includes 0.4%, 0.3%, 0.4%, 0.2%, and 0.0%, respectively, related to the 100k Milestone Gift.
| Years Ended December 31, | |||||||||||||||||||||||||||||||||||
| 2015 | 2016 | 2017 | 2018 | 2019 | |||||||||||||||||||||||||||||||
Net loss (1) | $ | (36,780) | $ | (93,112) | $ | (164,316) | $ | (254,745) | $ | (364,639) | |||||||||||||||||||||||||
| Depreciation and amortization expense | 2,800 | 4,658 | 11,568 | 23,539 | 41,265 | ||||||||||||||||||||||||||||||
| Interest expense | 1,412 | 3,587 | 7,659 | 25,018 | 80,606 | ||||||||||||||||||||||||||||||
| EBITDA | $ | (32,568) | $ | (84,867) | $ | (145,089) | $ | (206,188) | $ | (242,768) | |||||||||||||||||||||||||
| Total revenues | $ | 130,392 | $ | 365,148 | $ | 858,870 | $ | 1,955,467 | $ | 3,939,896 | |||||||||||||||||||||||||
| Net Loss Margin | (28.2) | % | (25.5) | % | (19.1) | % | (13.0) | % | (9.3) | % | |||||||||||||||||||||||||
EBITDA Margin (2) | (25.0) | % | (23.2) | % | (16.9) | % | (10.5) | % | (6.2) | % | |||||||||||||||||||||||||
(1) Includes $0.0 million, $0.0 million, $0.0 million, $11.8 million, and $13.2 million, respectively, related to the 100k Milestone Gift.
(2) Includes 0.0%, 0.0%, 0.0%, 0.6%, and 0.4%, respectively, related to the 100k Milestone Gift.
18
CARVANA CO. AND SUBSIDIARIES
RESULTS OF OPERATIONS
(Unaudited)
| Three Months Ended March 31, | ||||||||||||||||||||
| 2020 | 2019 | Change | ||||||||||||||||||
| (dollars in thousands, except per unit amounts) | ||||||||||||||||||||
| Net sales and operating revenues: | ||||||||||||||||||||
| Used vehicle sales, net | $ | 964,279 | $ | 683,829 | 41.0 | % | ||||||||||||||
| Wholesale vehicle sales | 79,606 | 33,030 | 141.0 | % | ||||||||||||||||
Other sales and revenues (1) | 54,331 | 38,375 | 41.6 | % | ||||||||||||||||
| Total net sales and operating revenues | $ | 1,098,216 | $ | 755,234 | 45.4 | % | ||||||||||||||
| Gross profit: | ||||||||||||||||||||
Used vehicle gross profit(3) | $ | 82,862 | $ | 47,122 | 75.8 | % | ||||||||||||||
Wholesale vehicle gross profit(4) | 1,229 | 3,035 | (59.5) | % | ||||||||||||||||
Other gross profit (1) | 54,331 | 38,375 | 41.6 | % | ||||||||||||||||
| Total gross profit | $ | 138,422 | $ | 88,532 | 56.4 | % | ||||||||||||||
| Market information: | ||||||||||||||||||||
| Markets, beginning of period | 146 | 85 | 71.8 | % | ||||||||||||||||
| Market launches | 15 | 24 | (37.5) | % | ||||||||||||||||
| Markets, end of period | 161 | 109 | 47.7 | % | ||||||||||||||||
| Unit sales information: | ||||||||||||||||||||
| Used vehicle unit sales | 52,427 | 36,766 | 42.6 | % | ||||||||||||||||
| Wholesale vehicle unit sales | 10,754 | 6,701 | 60.5 | % | ||||||||||||||||
| Per unit selling prices: | ||||||||||||||||||||
| Used vehicles | $ | 18,393 | $ | 18,599 | (1.1) | % | ||||||||||||||
| Wholesale vehicles | $ | 7,402 | $ | 4,929 | 50.2 | % | ||||||||||||||
Per unit gross profit:(2) | ||||||||||||||||||||
Used vehicle gross profit(3) | $ | 1,581 | $ | 1,282 | 23.3 | % | ||||||||||||||
Wholesale vehicle gross profit(4) | $ | 114 | $ | 453 | (74.8) | % | ||||||||||||||
| Other gross profit | $ | 1,036 | $ | 1,044 | (0.8) | % | ||||||||||||||
| Total gross profit | $ | 2,640 | $ | 2,408 | 9.6 | % | ||||||||||||||
(1) Includes $20,562 and $10,573 for the three months ended March 31, 2020 and 2019, respectively, of other sales and revenues from related parties.
(2) All gross profit per unit amounts are per used vehicle sold, except wholesale vehicle gross profit, which is per wholesale vehicle sold.
(3) Includes $510 and $764, or $10 and $20 per unit, related to the 100k Milestone Gift.
(4) Includes $17 and $22, or $2 and $3 per wholesale unit, related to the 100k Milestone Gift.
19
CARVANA CO. AND SUBSIDIARIES
COMPONENTS OF SG&A
(Unaudited)
| Three Months Ended | ||||||||||||||||||||||||||||||||
| Mar 31, 2019 | Jun 30, 2019 | Sep 30, 2019 | Dec 31, 2019 | Mar 31, 2020 | ||||||||||||||||||||||||||||
| (in thousands) | ||||||||||||||||||||||||||||||||
Compensation and benefits (1) | $ | 48,804 | $ | 54,184 | $ | 60,655 | $ | 72,939 | $ | 84,250 | ||||||||||||||||||||||
| 100k Milestone Gift | 2,188 | 1,415 | 2,903 | 1,263 | — | |||||||||||||||||||||||||||
| Advertising | 39,522 | 50,367 | 55,264 | 58,867 | 74,788 | |||||||||||||||||||||||||||
Market occupancy (2) | 4,370 | 4,720 | 5,517 | 6,644 | 8,103 | |||||||||||||||||||||||||||
Logistics (3) | 12,249 | 13,643 | 14,068 | 18,090 | 18,914 | |||||||||||||||||||||||||||
Other (4) | 48,108 | 57,514 | 69,563 | 83,860 | 89,656 | |||||||||||||||||||||||||||
| Total | $ | 155,241 | $ | 181,843 | $ | 207,970 | $ | 241,663 | $ | 275,711 | ||||||||||||||||||||||
(1) Compensation and benefits includes all payroll and related costs, including benefits, payroll taxes, and equity-based compensation, except those related to preparing vehicles for sale, which are included in cost of sales, those related to the development of software products for internal use, which are capitalized to software and depreciated over the estimated useful lives of the related assets, and those related to the 100k Milestone Gift.
(2) Market occupancy costs includes occupancy costs of our vending machine and hubs. It excludes occupancy costs related to reconditioning vehicles which are included in cost of sales and the portion related to corporate occupancy which are included in other costs.
(3) Logistics includes fuel, maintenance and depreciation related to operating our own transportation fleet, and third party transportation fees, except the portion related to inbound transportation, which is included in cost of sales.
(4) Other costs include all other selling, general and administrative expenses such as IT expenses, corporate occupancy, professional services and insurance, limited warranty, and title and registration.
20
CARVANA CO. AND SUBSIDIARIES
LIQUIDITY RESOURCES
(Unaudited)
| March 31, 2020 | December 31, 2019 | ||||||||||
| (in thousands) | |||||||||||
| Cash and cash equivalents | $ | 72,435 | $ | 76,016 | |||||||
Availability under short-term revolving facilities (1) | 163,775 | 279,080 | |||||||||
Availability under sale-leaseback agreements (2)(3) | 103,317 | 104,680 | |||||||||
| Committed liquidity resources available | $ | 339,527 | $ | 459,776 | |||||||
(1) Based on pledging all eligible vehicles and finance receivables under the available capacity in the Floor Plan Facility and Finance Receivable Facilities, excluding the impact to restricted cash requirements.
(2) We have $75.0 million available for sale and leaseback transactions under the Master Sale-Leaseback Agreement with VMRE, and an additional $28.3 million and $29.7 million as of March 31, 2020 and December 31, 2019, respectively, available under sale-leaseback agreements with other parties.
(3) We have $174.8 million and $158.7 million of total unfunded gross real estate assets as of March 31, 2020 and December 31, 2019, respectively.
As of March 31, 2020 and December 31, 2019, the short-term revolving facilities had total capacity of $1,875.0 million and $1,600.0 million, an outstanding balance of $812.2 million and $568.8 million, and unused capacity of $1,062.8 million and $1,031.2 million, respectively.
We also had $87.1 million and $137.7 million of committed funds for future construction costs of four IRCs with unfinished construction as of March 31, 2020 and December 31, 2019, respectively. In addition, we had $49.0 million and $13.5 million of total unpledged beneficial interests in securitizations as of March 31, 2020 and December 31, 2019, respectively.
Additionally, on April 1, 2020, we completed a registered direct offering of approximately 13.3 million shares of our Class A common stock and received net proceeds from the offering of approximately $599.5 million.
21