Attached files
| file | filename |
|---|---|
| 8-K - WESTROCK COMPANY 8-K - WestRock Co | a52214394.htm |
| EX-99.1 - EXHIBIT 99.1 - WestRock Co | a52214394ex99_1.htm |
Exhibit 99.2

Q2 FY20 Results May 5, 2020 Ward Dickson Chief Financial Officer Jeff Chalovich Chief Commercial
Officer and President, Corrugated Packaging Pat Lindner Chief Innovation Officer and President, Consumer Packaging Steve Voorhees Chief Executive Officer
Forward Looking Statements:This presentation contains forward-looking statements within the meaning of
the Private Securities Litigation Reform Act of 1995, including but not limited to the statements on the slides entitled “End Market Demand Trends Are Changing Quickly”, “Withdrawing Guidance Due to COVID-19”, “Anticipated Cash Impact of
Pandemic Action Plan”, “Mill Maintenance Schedule” and “Key Commodity Annual Consumption Volumes” that give guidance or estimates for future periods as well as statements regarding, among other things, (1) that e-commerce demand may remain
robust for some time; (2) that demand for certain categories of products that benefited from pantry stocking in March are expected to revert to normal levels; (3) that recent disruptions in protein are likely transitory; (4) that we will
reinstitute guidance when conditions stabilize; (5) that we expect $1 billion in additional cash to be available for debt reduction through the end of FY21 due to the actions we plan to take in response to the COVID-19 pandemic, including
pursuant to the WestRock Pandemic Action Plan, as set forth on slide 14; (6) the mill maintenance schedule on slide 19; and (7) the key commodity annual consumption volumes on slide 20.Forward-looking statements are based on our current
expectations, beliefs, plans or forecasts and are typically identified by words or phrases such as "may," "will," "could," "should," "would," "anticipate," "estimate," "expect," "project," "intend," "plan," "believe," "target," "prospects,"
"potential" and "forecast," and other words, terms and phrases of similar meaning. Forward-looking statements involve estimates, expectations, projections, goals, forecasts, assumptions, risks and uncertainties. WestRock cautions readers that
a forward-looking statement is not a guarantee of future performance and that actual results could differ materially from those contained in the forward-looking statement. WestRock’s businesses are subject to a number of general risks that
would affect any such forward-looking statements, including, among others, developments related to the COVID-19 pandemic, including the severity, magnitude and duration of the pandemic, negative global economic conditions arising from the
pandemic, impacts of governments' responses to the pandemic on our operations, impacts of the pandemic on commercial activity, our customers and consumer preferences and demand, supply chain disruptions, and disruptions in the credit or
financial markets; decreases in demand for their products; increases in energy, raw materials, shipping and capital equipment costs; reduced supply of raw materials; fluctuations in selling prices and volumes; intense competition; the
potential loss of certain customers; the scope, costs, timing and impact of any restructuring of our operations and corporate and tax structure; the occurrence of a natural disaster, such as hurricanes or other unanticipated problems, such as
labor difficulties, equipment failure or unscheduled maintenance and repair; risks associated with integrating KapStone’s operations into our operations and our ability to realize anticipated synergies and productivity improvements; risks
associated with completing our strategic capital projects on the anticipated timelines and realizing our anticipated EBITDA improvements; benefits that we expect to realize from actions that we are taking and plan to take in response to
COVID-19; and adverse changes in general market and industry conditions. Such risks and other factors that may impact management's assumptions are more particularly described in our filings with the Securities and Exchange Commission,
including in Item 1A under the caption "Risk Factors" in our Annual Report on Form 10-K for the year ended September 30, 2019. The information contained herein speaks as of the date hereof and WestRock does not have or undertake any
obligation to update or revise its forward-looking statements, whether as a result of new information, future events or otherwise.Non-GAAP Financial Measures:We may from time to time be in possession of certain information regarding WestRock
that applicable law would not require us to disclose to the public in the ordinary course of business, but would require us to disclose if we were engaged in the purchase or sale of our securities. This presentation shall not be considered to
be part of any solicitation of an offer to buy or sell WestRock securities. This presentation also may not include all of the information regarding WestRock that you may need to make an investment decision regarding WestRock securities. Any
investment decision should be made on the basis of the total mix of information regarding WestRock that is publicly available as of the date of the investment decision.We report our financial results in accordance with accounting principles
generally accepted in the United States ("GAAP"). However, management believes certain non-GAAP financial measures provide users with additional meaningful financial information that should be considered when assessing our ongoing
performance. Management also uses these non-GAAP financial measures in making financial, operating and planning decisions and in evaluating our performance. Non-GAAP financial measures should be viewed in addition to, and not as an
alternative for, our GAAP results. The non-GAAP financial measures we present may differ from similarly captioned measures presented by other companies. Forward Looking Statements; Non-GAAP Financial Measures 2

Key Takeaways 3 Non-GAAP Financial Measure. See Non-GAAP Financial Measures and Reconciliations in
the Appendix. Adapted quickly to COVID-19 challengesFocused on safety of our teammates Met critical supply needs of our customersLeveraged the scale and breadth of our mill and converting networkGenerated solid financial results with Q2 FY20
Adjusted Segment EBITDA of $708 million; at high end of guidance(1)Executing our differentiated strategy with financial strength and substantial liquidityWestRock is focused on meeting the needs of our customers, supporting the health, safety
and well-being of our teammates, and further building on our foundation of financial strength

WestRock’s Pandemic Action Plan 4 Protecting the safety and well-being of our teammatesContinuing to
match our supply with our customers’ demandDecreasing salaries and retainers by up to 25% for senior executive team and board of directors in addition to reducing discretionary expensesUsing our company stock to pay our annual incentives and
make our company funded 401(k) contributions in 2020Reducing FY20 capital investments by approximately $150 million to a level of $950 million; reducing FY21 capital investment to a range of $600 to $800 millionResetting our quarterly
dividend to $0.20 per share for an annual rate of $0.80 per share We are adapting quickly to changes in market conditions and expect these and other actions to provide an additional $1 billion in cash available for debt reduction through the
end of FY21 that will sustain our business under a range of economic and market conditions and ensure WestRock remains well positioned for long-term success

Supporting Teammates, Customers, Communities 5 Practicing safety protocols, including social
distancing, temperature checks and deep cleaningProviding one-time recognition awards to our manufacturing and operating teammates in Q3 FY20Administering a work-from-home policy for team members whose jobs can be performed remotely First
and Foremost is the safety and health of WestRock Teammates Helping our customers keep essential supply chains operating for items such as food and medical suppliesAdapting to a rapidly changing demand environment while prioritizing critical
orders, ensuring quality and delivering on-time Providing manufacturing support for production of more than 200,000 face shields for medical personnelProducing and donating boxes for food banks and community aid organizationsDonating more
than 50,000 N95 masks to hospitals Customers Teammates Communities We are adapting to our customers’ new challenges to provide for their needs We are working to help our communities with products and services

Key Q2 FY20 Highlights Net sales of $4.4 billionAdjusted Segment EBITDA of $708
million(1); Adjusted Segment EBITDA margin of 15.9%(1)North American Corrugated Packaging Adjusted Segment EBITDA margin of 19.0%(1)Consumer Packaging Adjusted Segment EBITDA margin of 13.7%(1)Adjusted EPS of $0.67(2) Strong end to March
quarter, with some recent softening in demandScale and strong execution enabled us to quickly adapt our integrated supply chain to help customers respond to the rapidly changing demand environment Advanced our differentiated strategy with
strong growth in machinery placements and enterprise customers >$2.5 billion in available long-term committed liquidity and cash to fund our businessLimited debt maturities until March 2022Net Leverage Ratio of 3.13x(1)US qualified
pension plan 102% funded as of March 31 6 Financial Performance Markets and Operations Balance Sheet and Liquidity Non-GAAP Financial Measure. See Non-GAAP Financial Measures and Reconciliations in the Appendix.Non-GAAP Financial
Measure. On a GAAP basis, earnings per diluted share were $0.57 in Q2 FY20. See Non-GAAP Financial Measures and Reconciliations in the Appendix.

Q2 FY20 WestRock Results 7 Non-GAAP Financial Measure. See Non-GAAP Financial Measures and
Reconciliations in the Appendix.Non-GAAP Financial Measure. On a GAAP basis, earnings per diluted share were $0.57 in Q2 FY20 and $0.62 in Q2 FY19. See Non-GAAP Financial Measures and Reconciliations in the Appendix. Higher export and
domestic containerboard volumes and domestic box shipmentsYear-over-year price declines in export and domestic containerboard, box, pulp and kraft paper Cost deflation driven by lower virgin fiber, recycled fiber, natural gas and chemical
costsMill and converting system performed well in dynamic environment SECOND QUARTER $ in millions, EXCEPT PER SHARE ITEMS FY20 FY19 Net Sales $4,447 $4,620 Adjusted Segment Income(1) $342 $383 Adjusted Segment
EBITDA(1) $708 $757 % Margin(1) 15.9% 16.4% Adjusted Earnings Per Diluted Share(2) $0.67 $0.80 Adjusted Operating Cash Flow(1) $177 $374 Adjusted Segment EBITDA(1) ($ in millions) Key Factors

Q2 FY20 Corrugated Packaging Results 8 Non-GAAP Financial Measure. See Non-GAAP Financial
Measures and Reconciliations in the Appendix. SECOND QUARTER $ in millions FY20 FY19 Net Sales $2,883 $2,991 Adjusted Segment Income(1) $271 $319 Adjusted Segment EBITDA(1) $502 $553 % Margin(1) 18.0% 19.1% North
American Adjusted Segment EBITDA Margin(1) 19.0% 20.4% Brazil Adjusted Segment EBITDA Margin(1) 27.7% 22.2% Key Factors Growth in domestic and export containerboard, e-commerce channels, processed foods and protein Box shipments up
1.3% on absolute basisLower pricing in all channelsCommodity deflation driven by lower natural gas and fiber costsMill and converting system operated wellContainerboard inventories down 67,000 tons KapStone synergy run-rate of approximately
$125 million at end of quarterKapStone footprint optimization led to five box plant closures since May 2019 Adjusted Segment EBITDA(1) ($ in millions)
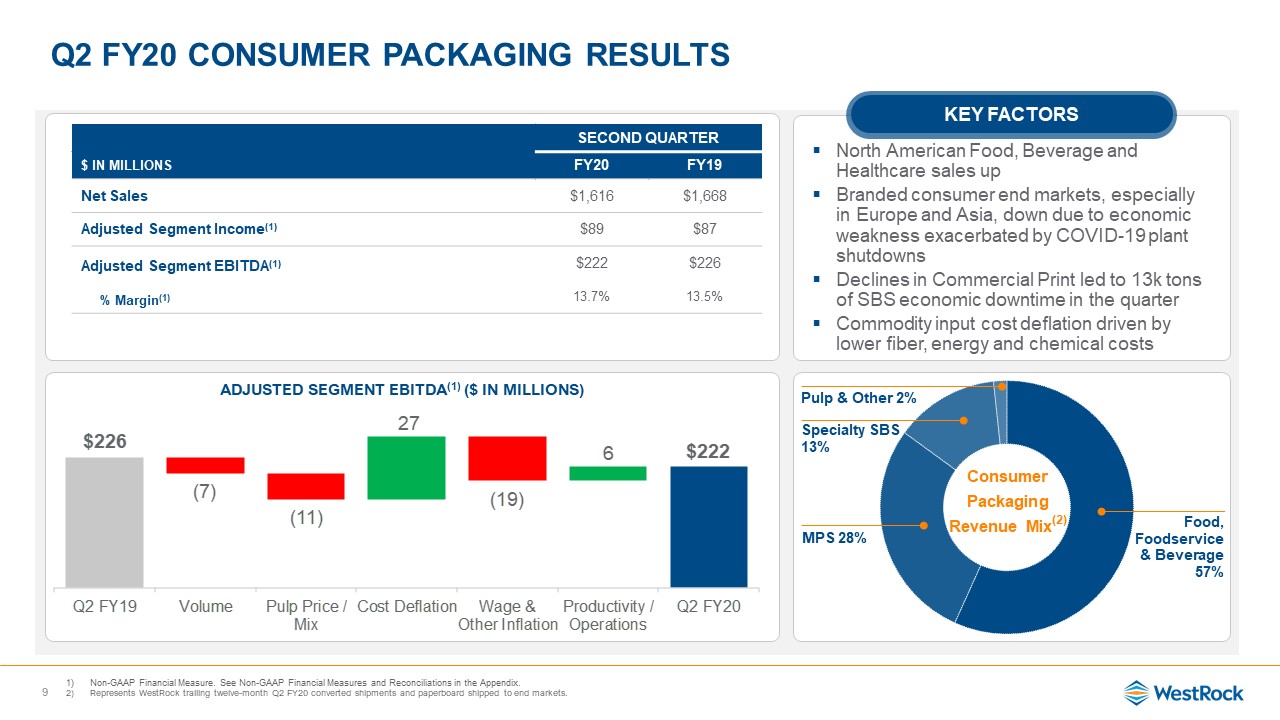
Q2 FY20 Consumer Packaging Results 9 SECOND QUARTER $ in millions FY20 FY19 Net
Sales $1,616 $1,668 Adjusted Segment Income(1) $89 $87 Adjusted Segment EBITDA(1) $222 $226 % Margin(1) 13.7% 13.5% Adjusted Segment EBITDA(1) ($ in millions) North American Food, Beverage and Healthcare sales up Branded consumer
end markets, especially in Europe and Asia, down due to economic weakness exacerbated by COVID-19 plant shutdownsDeclines in Commercial Print led to 13k tons of SBS economic downtime in the quarterCommodity input cost deflation driven by
lower fiber, energy and chemical costs Non-GAAP Financial Measure. See Non-GAAP Financial Measures and Reconciliations in the Appendix.Represents WestRock trailing twelve-month Q2 FY20 converted shipments and paperboard shipped to end
markets. Key Factors
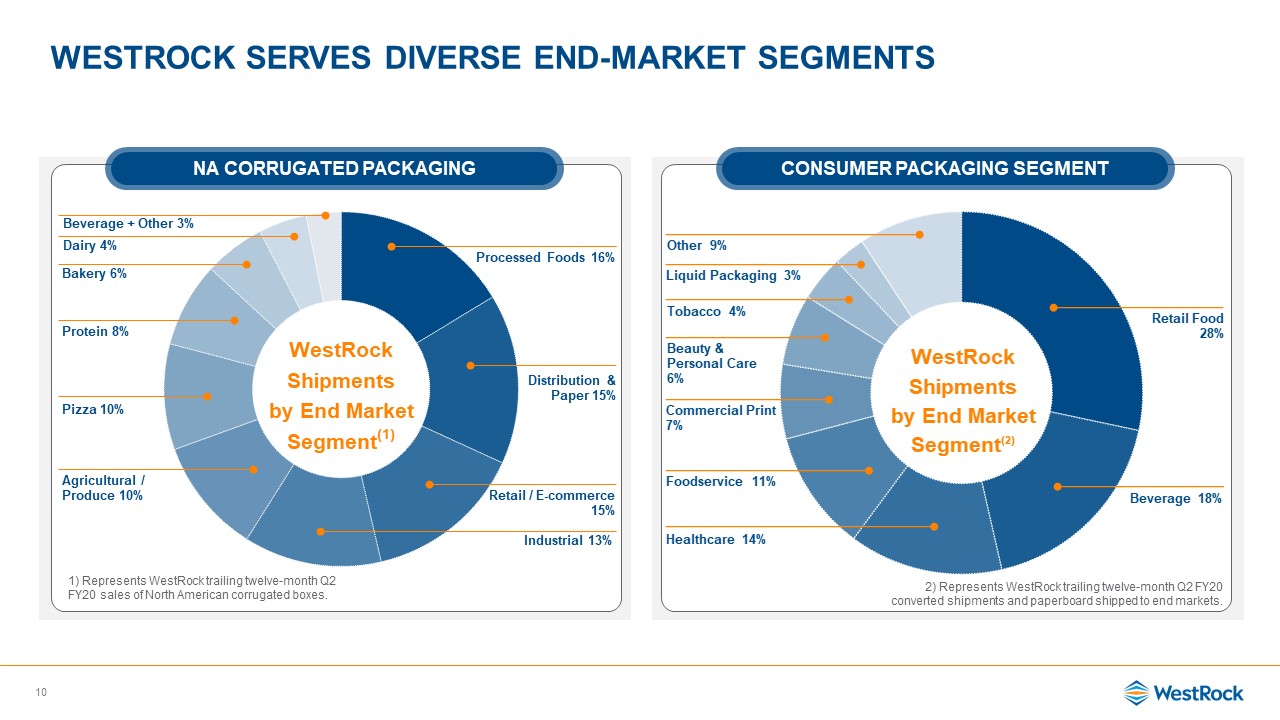
Westrock Serves Diverse End-Market segments 10 NA Corrugated Packaging Consumer
Packaging Segment 2) Represents WestRock trailing twelve-month Q2 FY20 converted shipments and paperboard shipped to end markets.
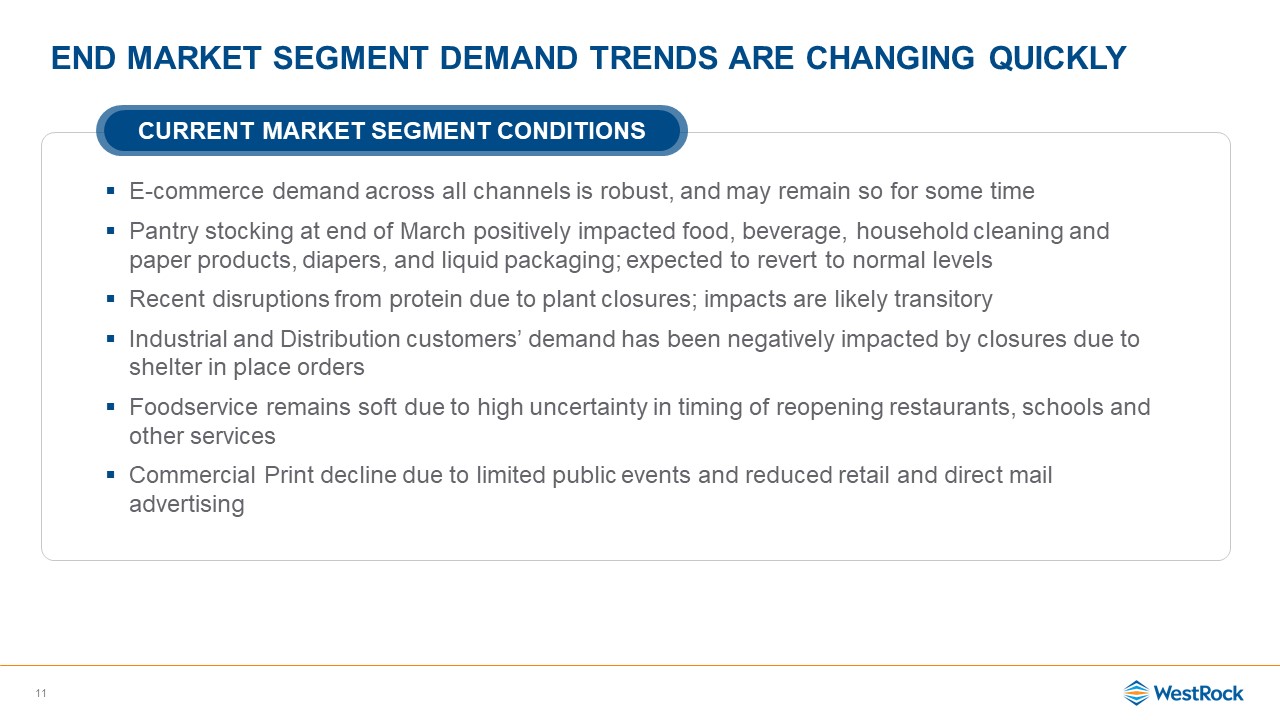
End market Segment demand trends are changing quickly 11 E-commerce demand across all channels is
robust, and may remain so for some timePantry stocking at end of March positively impacted food, beverage, household cleaning and paper products, diapers, and liquid packaging; expected to revert to normal levelsRecent disruptions from
protein due to plant closures; impacts are likely transitoryIndustrial and Distribution customers’ demand has been negatively impacted by closures due to shelter in place ordersFoodservice remains soft due to high uncertainty in timing of
reopening restaurants, schools and other servicesCommercial Print decline due to limited public events and reduced retail and direct mail advertising Current Market Segment Conditions

Debt maturity profile provides financial flexibility 12 >$2.5 billion in committed long-term
liquidity and cashLimited debt maturities until March 2022Significant financial covenant cushionInvestment grade credit ratings Resilient Debt Profile Debt Maturities($ in millions) Note: As of March 31, 2020 excluding supplier financing
and commercial card programs, fair value of debt step-up, deferred financing costs and unamortized bond discounts..

Shape and duration of economic downturn and recovery is uncertainEnd market demand trends are changing
quicklyRecycled fiber costs have risen dramaticallyWithdrawing full year FY20 guidance including:Net SalesAdjusted Segment EBITDAAdjusted Operating Cash FlowAdjusted Free Cash FlowWill reinstitute guidance when conditions
stabilize Withdrawing Guidance due to COVID-19 13

Anticipated Cash Impact of pandemic Action plan 14 CARES Act $120 Payroll tax deferral
benefit Cash Payments Replaced with Equity $100 Paying 2020 incentive and 401(k) contributions in stock Capex Reduction $300 - $500 FY20 investment level of $950 millionFY21 investment level of $600 to $800 million Dividend
Reduction $400 Reset annual dividend to $0.80 per share Action CashImpact Comments Expect $1 billionin additional cash available for debt reduction through end of FY21 (Estimated $ in Millions)
Executing on our differentiated strategy from a position of financial strength and substantial
liquidityFocusing on meeting the needs of our customers, supporting the health, safety and well-being of our teammates, and further building on our foundation of financial strengthImplementing WestRock’s Pandemic Action Plan, which is
expected to provide an additional $1 billion in cash available for debt reduction through the end of FY21 Delivering our value proposition, with the right strategy and right team to position WestRock for long-term success Summary 15

Appendix 16
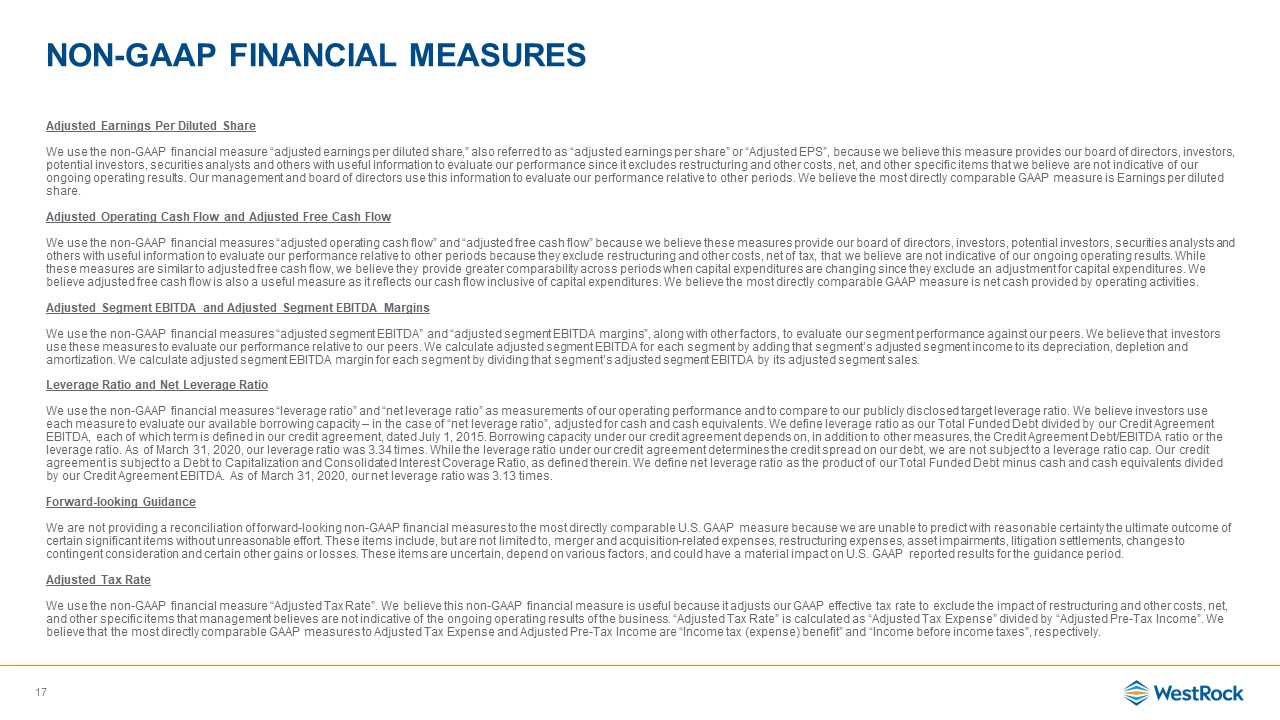
Non-GAAP Financial Measures Adjusted Earnings Per Diluted ShareWe use the non-GAAP financial measure
“adjusted earnings per diluted share,” also referred to as “adjusted earnings per share” or “Adjusted EPS”, because we believe this measure provides our board of directors, investors, potential investors, securities analysts and others with
useful information to evaluate our performance since it excludes restructuring and other costs, net, and other specific items that we believe are not indicative of our ongoing operating results. Our management and board of directors use this
information to evaluate our performance relative to other periods. We believe the most directly comparable GAAP measure is Earnings per diluted share.Adjusted Operating Cash Flow and Adjusted Free Cash FlowWe use the non-GAAP financial
measures “adjusted operating cash flow” and “adjusted free cash flow” because we believe these measures provide our board of directors, investors, potential investors, securities analysts and others with useful information to evaluate our
performance relative to other periods because they exclude restructuring and other costs, net of tax, that we believe are not indicative of our ongoing operating results. While these measures are similar to adjusted free cash flow, we believe
they provide greater comparability across periods when capital expenditures are changing since they exclude an adjustment for capital expenditures. We believe adjusted free cash flow is also a useful measure as it reflects our cash flow
inclusive of capital expenditures. We believe the most directly comparable GAAP measure is net cash provided by operating activities. Adjusted Segment EBITDA and Adjusted Segment EBITDA MarginsWe use the non-GAAP financial measures “adjusted
segment EBITDA” and “adjusted segment EBITDA margins”, along with other factors, to evaluate our segment performance against our peers. We believe that investors use these measures to evaluate our performance relative to our peers. We
calculate adjusted segment EBITDA for each segment by adding that segment’s adjusted segment income to its depreciation, depletion and amortization. We calculate adjusted segment EBITDA margin for each segment by dividing that segment’s
adjusted segment EBITDA by its adjusted segment sales. Leverage Ratio and Net Leverage RatioWe use the non-GAAP financial measures “leverage ratio” and “net leverage ratio” as measurements of our operating performance and to compare to our
publicly disclosed target leverage ratio. We believe investors use each measure to evaluate our available borrowing capacity – in the case of “net leverage ratio”, adjusted for cash and cash equivalents. We define leverage ratio as our Total
Funded Debt divided by our Credit Agreement EBITDA, each of which term is defined in our credit agreement, dated July 1, 2015. Borrowing capacity under our credit agreement depends on, in addition to other measures, the Credit Agreement
Debt/EBITDA ratio or the leverage ratio. As of March 31, 2020, our leverage ratio was 3.34 times. While the leverage ratio under our credit agreement determines the credit spread on our debt, we are not subject to a leverage ratio cap. Our
credit agreement is subject to a Debt to Capitalization and Consolidated Interest Coverage Ratio, as defined therein. We define net leverage ratio as the product of our Total Funded Debt minus cash and cash equivalents divided by our Credit
Agreement EBITDA. As of March 31, 2020, our net leverage ratio was 3.13 times. Forward-looking GuidanceWe are not providing a reconciliation of forward-looking non-GAAP financial measures to the most directly comparable U.S. GAAP measure
because we are unable to predict with reasonable certainty the ultimate outcome of certain significant items without unreasonable effort. These items include, but are not limited to, merger and acquisition-related expenses, restructuring
expenses, asset impairments, litigation settlements, changes to contingent consideration and certain other gains or losses. These items are uncertain, depend on various factors, and could have a material impact on U.S. GAAP reported results
for the guidance period.Adjusted Tax RateWe use the non-GAAP financial measure “Adjusted Tax Rate”. We believe this non-GAAP financial measure is useful because it adjusts our GAAP effective tax rate to exclude the impact of restructuring and
other costs, net, and other specific items that management believes are not indicative of the ongoing operating results of the business. “Adjusted Tax Rate” is calculated as “Adjusted Tax Expense” divided by “Adjusted Pre-Tax Income”. We
believe that the most directly comparable GAAP measures to Adjusted Tax Expense and Adjusted Pre-Tax Income are “Income tax (expense) benefit” and “Income before income taxes”, respectively. 17
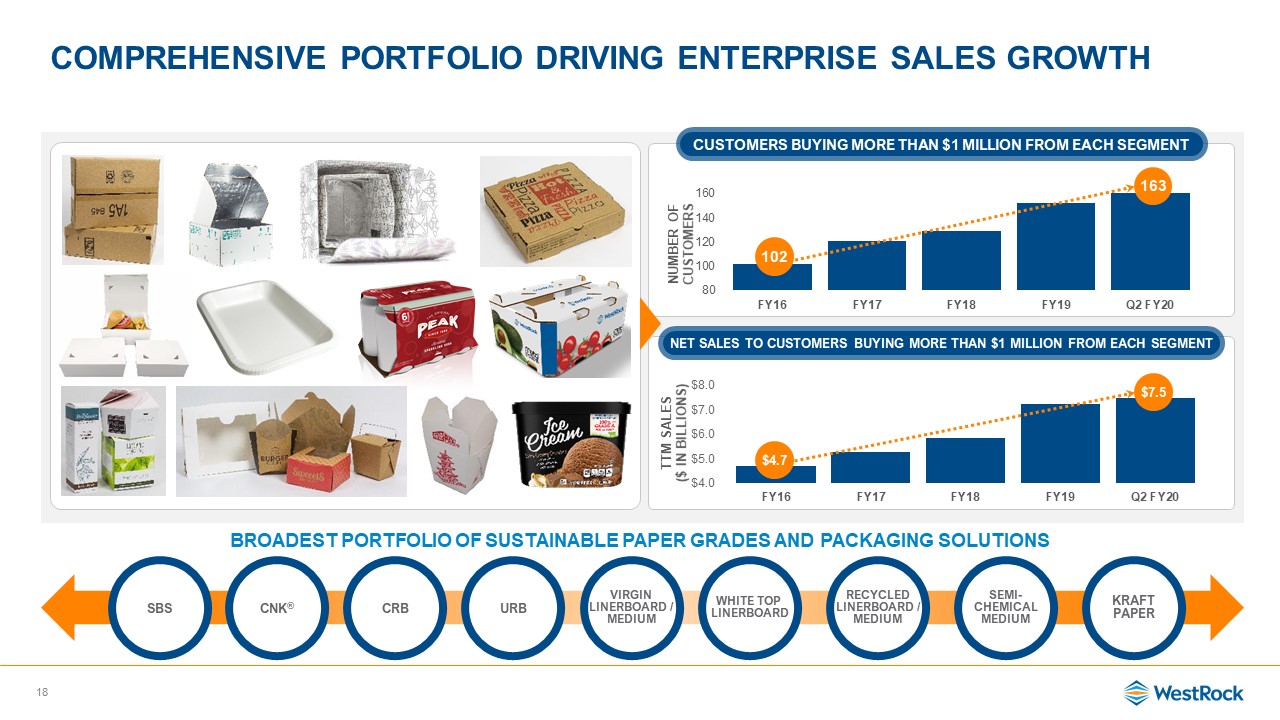
Comprehensive portfolio driving enterprise sales growth 18 Broadest Portfolio of
SUSTAINABLE Paper Grades and Packaging Solutions SBS URB CRB CNK® White Top Linerboard Recycled Linerboard / Medium Semi-Chemical Medium Kraft Paper Virgin Linerboard / Medium Customers buying more than $1 million from
each segment 102 163 Net Sales to Customers Buying More than $1 Million from Each Segment $4.7 $7.5
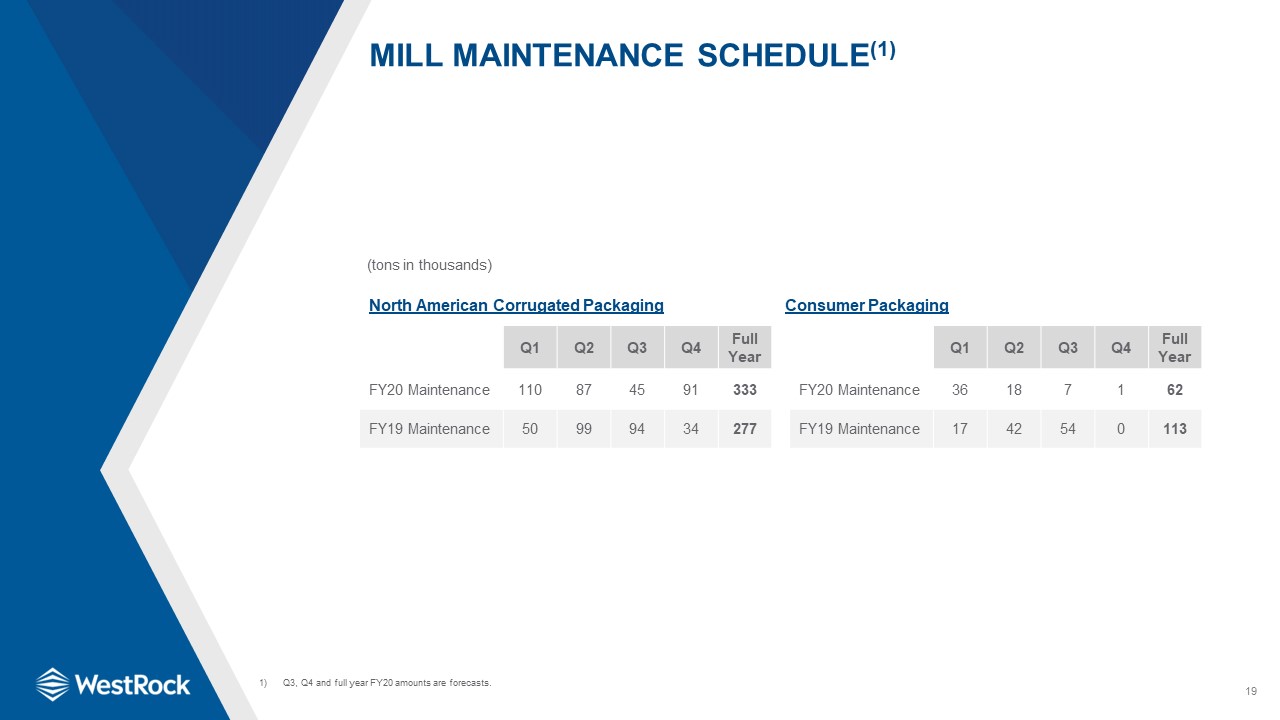
19 Mill Maintenance Schedule(1) (tons in thousands) Q1 Q2 Q3 Q4 Full Year FY20
Maintenance 110 87 45 91 333 FY19 Maintenance 50 99 94 34 277 North American Corrugated Packaging Q1 Q2 Q3 Q4 Full Year FY20 Maintenance 36 18 7 1 62 FY19 Maintenance 17 42 54 0 113 Consumer Packaging Q3, Q4
and full year FY20 amounts are forecasts.
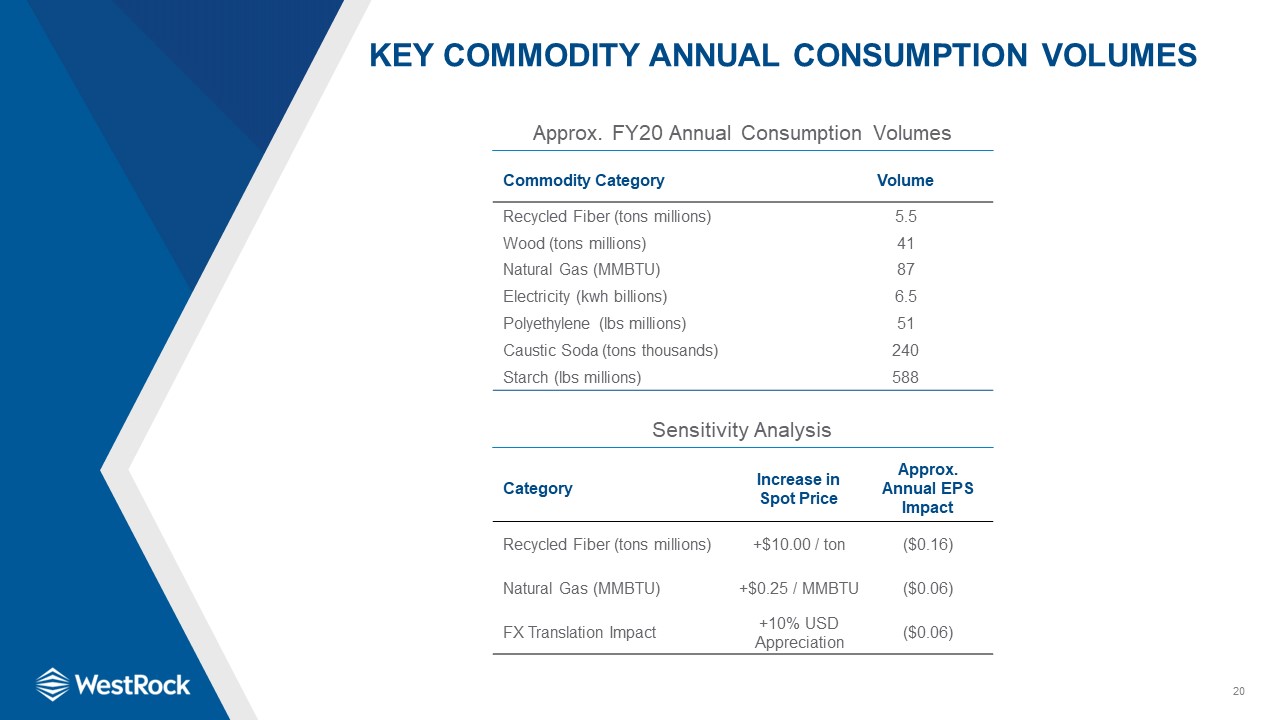
20 Key Commodity Annual Consumption Volumes Commodity Category Volume Recycled Fiber (tons
millions) 5.5 Wood (tons millions) 41 Natural Gas (MMBTU) 87 Electricity (kwh billions) 6.5 Polyethylene (lbs millions) 51 Caustic Soda (tons thousands) 240 Starch (lbs millions) 588 Approx. FY20 Annual Consumption
Volumes Sensitivity Analysis Category Increase in Spot Price Approx. Annual EPS Impact Recycled Fiber (tons millions) +$10.00 / ton ($0.16) Natural Gas (MMBTU) +$0.25 / MMBTU ($0.06) FX Translation Impact +10% USD
Appreciation ($0.06)
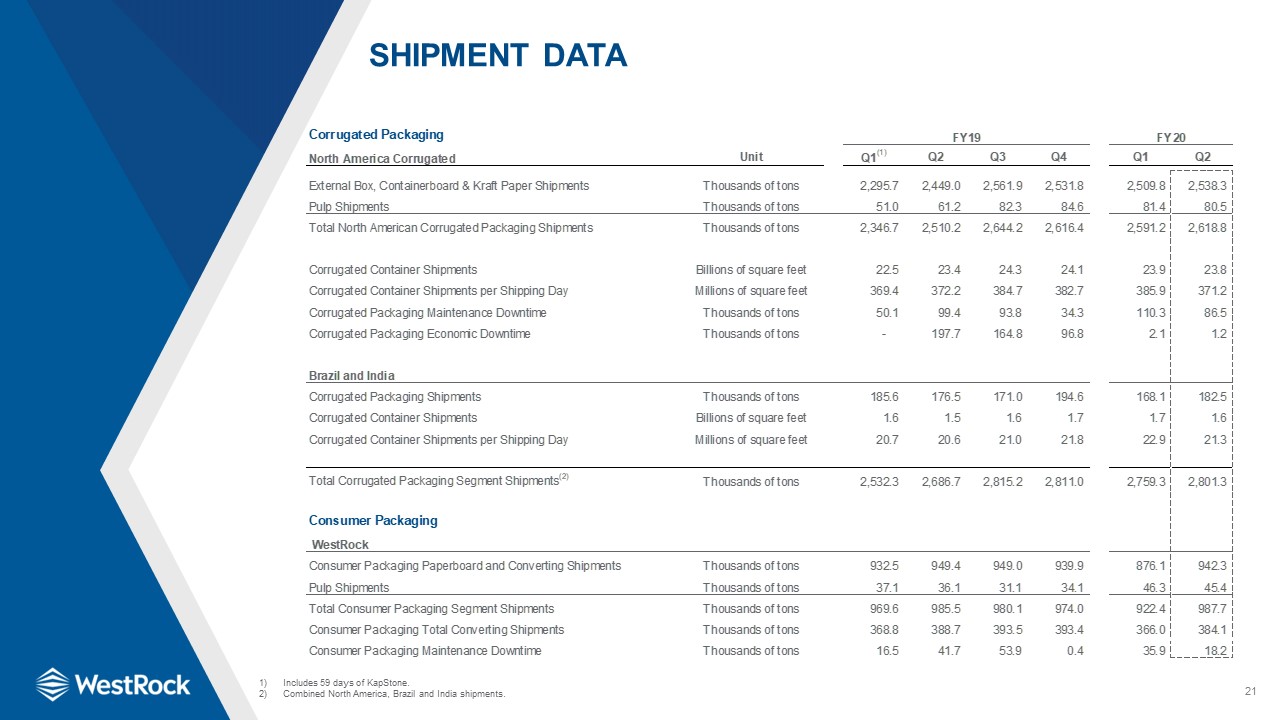
21 Shipment Data Includes 59 days of KapStone.Combined North America, Brazil and India shipments.
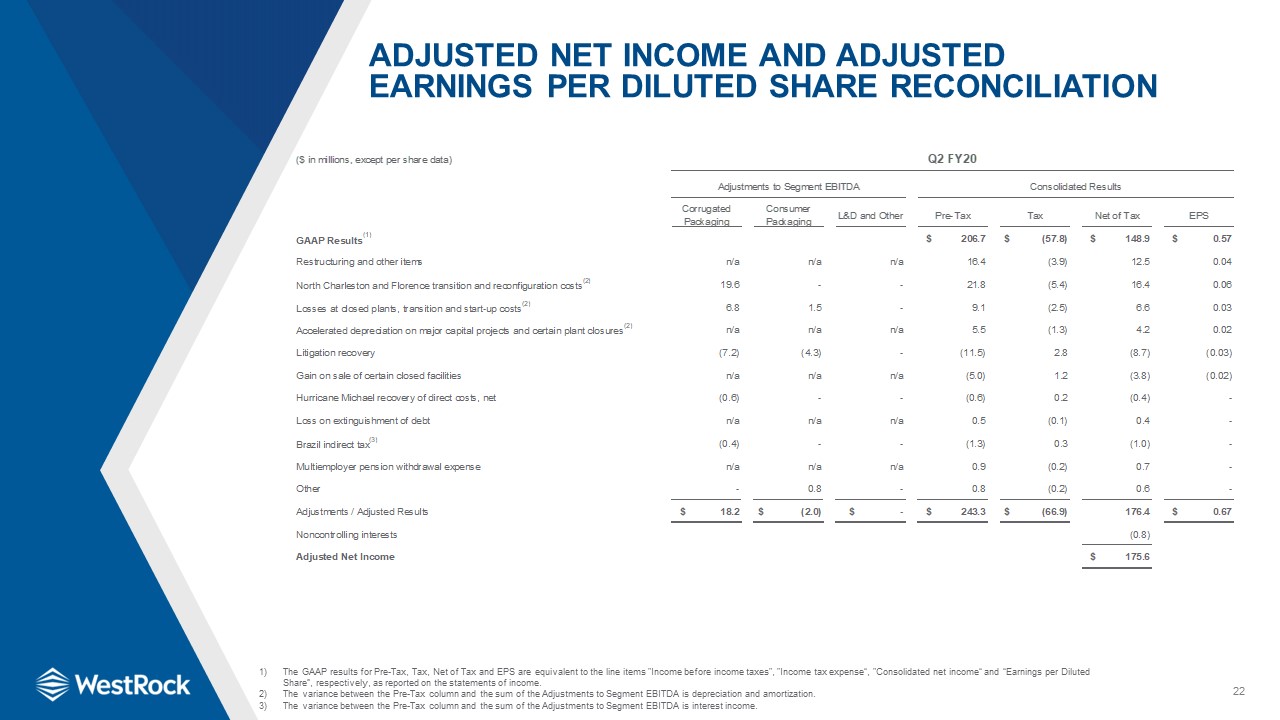
22 Adjusted Net Income and Adjusted Earnings Per Diluted Share Reconciliation The GAAP results for
Pre-Tax, Tax, Net of Tax and EPS are equivalent to the line items "Income before income taxes", "Income tax expense“, "Consolidated net income“ and “Earnings per Diluted Share”, respectively, as reported on the statements of income.The
variance between the Pre-Tax column and the sum of the Adjustments to Segment EBITDA is depreciation and amortization.The variance between the Pre-Tax column and the sum of the Adjustments to Segment EBITDA is interest income.

23 Adjusted Net Income and Adjusted Earnings Per Diluted Share Reconciliation The GAAP results for
Pre-Tax, Tax, Net of Tax and EPS are equivalent to the line items "Income before income taxes", "Income tax expense“, "Consolidated net income“ and “Earnings per Diluted Share”, respectively, as reported on the statements of income.The
variance between the Pre-Tax column and the sum of the Adjustments to Segment EBITDA is depreciation and amortization.Includes a $13.0 million impairment of mineral rights.

24 Adjusted Operating Cash Flow and Free Cash Flow Reconciliation

25 Adjusted Segment Sales, Adjusted Segment EBITDA and Adjusted Segment Income(1) Segment EBITDA
Margins are calculated using Segment / Net sales, Corrugated Packaging and Consumer Packaging Adjusted Segment EBITDA Margins are calculated using Adjusted Segment Sales; the Consolidated Adjusted Segment EBITDA Margin is calculated using
Segment / Net sales.Segment income includes pension and other postretirement income (expense).See the Adjusted Net Income table on slide 22 for adjustments.
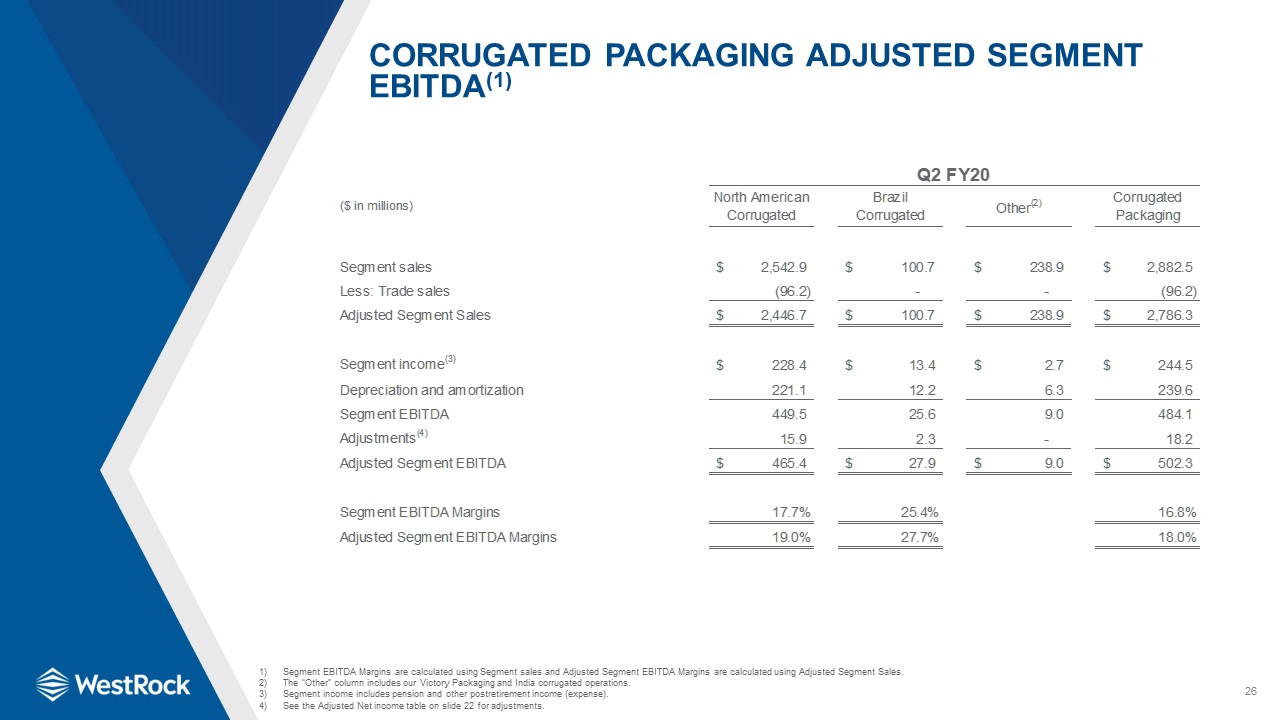
26 Corrugated Packaging Adjusted Segment EBITDA(1) Segment EBITDA Margins are calculated using
Segment sales and Adjusted Segment EBITDA Margins are calculated using Adjusted Segment Sales.The “Other” column includes our Victory Packaging and India corrugated operations.Segment income includes pension and other postretirement income
(expense).See the Adjusted Net income table on slide 22 for adjustments.

27 Adjusted Segment Sales, Adjusted Segment EBITDA and Adjusted Segment Income(1) Segment EBITDA
Margins are calculated using Segment / Net sales, Corrugated Packaging and Consumer Packaging Adjusted Segment EBITDA Margins are calculated using Adjusted Segment Sales; the Consolidated Adjusted Segment EBITDA Margin is calculated using
Segment / Net sales. Segment income includes pension and other postretirement income (expense).See the Adjusted Net Income table on slide 23 for adjustments.

28 Corrugated Packaging Adjusted Segment EBITDA(1) Segment EBITDA Margins are calculated using
Segment sales and Adjusted Segment EBITDA Margins are calculated using Adjusted Segment Sales.The “Other” column includes our Victory Packaging and India corrugated operations.Segment income includes pension and other postretirement income
(expense).See the Adjusted Net Income table on slide 23 for adjustments.

29 Reconciliation of Net Income to Adjusted Segment EBITDA Schedule adds back expense or subtracts
income for certain financial statement and segment footnote items to compute segment income, Segment EBITDA and Adjusted Segment EBITDA.Segment income includes pension and other postretirement income (expense).See the Adjusted Net Income
tables on slides 22 and 23 for adjustments.
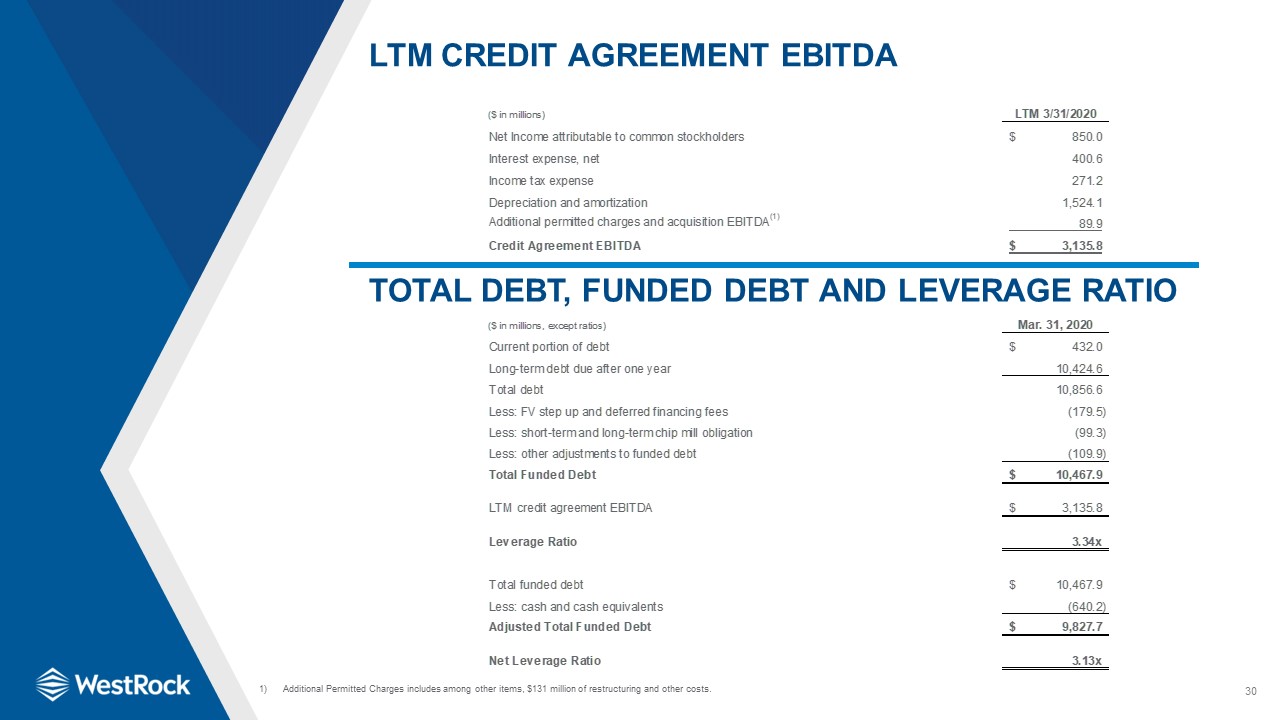
30 LTM Credit Agreement EBITDA Total Debt, Funded Debt and Leverage Ratio Additional Permitted
Charges includes among other items, $131 million of restructuring and other costs.
