Attached files
| file | filename |
|---|---|
| EX-99.1 - EXHIBIT 99.1 - Quotient Technology Inc. | a52214743ex99_1.htm |
| 8-K - QUOTIENT TECHNOLOGY INC. 8-K - Quotient Technology Inc. | a52214743.htm |
Exhibit 99.2
Q1 2020 FINANCIAL RESULTS May 5, 2020 https://investors.quotient.com
Q1 2020 FINANCIAL RESULTS AND BUSINESS UPDATE 1 Quotient
Technology Inc. Dear stockholders, I hope you, and everyone around you, are healthy and staying safe while managing through these unprecedented times. It’s been truly remarkable to see people and communities unite and adapt so quickly, paving the
way for essential services and businesses to do the same. I want to take a moment to acknowledge the hard work and dedication of so many people: first responders, health care workers, delivery drivers, food and grocery staff, and all other
community members that help bring essential needs and services to everyone. Our number one priority is the safety and well-being of our employees, customers, partners and shoppers. Since March 13, 2020, Quotient’s global workforce has been
working remotely, at full capacity, under a well-established business continuity program, and we don’t foresee any significant operational impact from working remotely. I’m incredibly proud of the entire Quotient team. Their dedication, focus,
and agility has been inspiring as we continue to service our industry given this “new normal.” Shopper behavior has rapidly changed as a result of COVID-19. What we consume and how we shop reflects our immediate need to stay healthy, purchase
essential items, provide for our loved ones, save time, and add convenience where we need it the most. Our purpose - Transforming shopping to make life better - has never been more important than in these past two months. Quotient is leveraging
its data and analytics, helping brands and retailers to understand shopper behaviors and enabling them to react in real-time to the quickly changing environment.
Q1 2020 FINANCIAL RESULTS AND BUSINESS UPDATE 2 Quotient Technology Inc. Business
Update Revenue in the first quarter was $98.8 million, below our guidance range of $106 million to $109 million. In the last few weeks of the quarter, consumer packaged goods manufacturers (“CPGs”) and brands delayed or paused marketing campaigns
due to COVID-19, primarily impacting our media revenue. We delivered $5.1 million of Adjusted EBITDA, well above the top end of our range, due to a higher proportion of revenue from promotions coupled with a focus on cost controls within the
quarter that lowered total operating expenses. Our promotions offerings carry a higher gross margin than our media offerings, and with the unemployment rate at its highest level in recent memory, we expect promotions to continue to be a focus for
our CPG and retailer partners for the foreseeable future. January and February delivered revenue as expected, with impact from COVID-19 starting in mid-March. Many retailers and CPGs have experienced significantly higher sales over these past weeks
as shoppers stocked pantries, cooked more at home, and prepared for shelter-in-place mandates for extended periods of time. Additionally, shopper demand for eCommerce grocery has surged to unprecedented levels. These changes create short-term
challenges for CPGs and retailers, experiencing empty store shelves and stressed supply chains. As a result, marketing campaigns were paused or delayed. As supply chains stabilize, CPGs are starting to re-invest so they stay top of mind with
shoppers. We believe mid-March, April and early May will be impacted the most. Early signs are positive with brands starting to re-book delayed or paused campaigns for June and into Q3. Already, bookings for Q3 are higher than historical trends at
this point in Q2 and our pipeline is strong.

Q1 2020 FINANCIAL RESULTS AND BUSINESS UPDATE 3 Quotient
Technology Inc. Many CPGs have been reporting increased sales in March and April as shoppers stocked up on necessities. Maintaining brand awareness and market share remains a key focus for CPGs as they think about marketing investments over the
next year. Among recent key themes from CPG executives is renewed marketing spend, specifically on brand awareness and working media, and the importance of shifting dollars to digital, to be where shoppers are spending their time. COVID-19, a
black swan event, is accelerating the shift to digital for CPGs and retailers. “This is a moment to really, what I would call it, attack the market and be strong in the second half of the year… we are shifting a lot of our investment to working
media” -Dirk Van de Put, Chairman and CEO, Mondelez International New Retailers Added to Network We recently signed 7-Eleven to Retailer iQ, adding a new vertical, the Convenience Store (“C-Store”), to the Quotient Network, and bringing digital
savings directly to shoppers through their 7-Rewards loyalty program. 7-Eleven has been widely recognized as an innovator in digital initiatives with a focus on shopper engagement and loyalty. 7-Eleven is the largest retailer of beer sales in the
U.S., and now adult beverage brands can utilize our national alcohol rebate solution to drive sales to millions of 7-Eleven shoppers across the U.S. Last week, Shipt, launched Quotient digital paperless coupons across its 90+ retailer network.
This partnership represents our first same-day delivery service and marketplace retailer on the Quotient Retail Network and comes at an unprecedented time when
Q1 2020 FINANCIAL RESULTS AND BUSINESS UPDATE 4 Quotient Technology Inc. online
grocery delivery services have seen significant growth and increased consumer demand. Through Retailer iQ, we now bring the same CPG value to Shipt members in 5,000 cities through their website and app. We are excited to welcome both 7-Eleven and
Shipt to the Quotient Network, and with an active pipeline of additional retailers and verticals, we look forward to additional network expansion announcements over the next several months. Quotient Platforms Help Retailers and Brands Shift to
Digital and eCommerce Grocery eCommerce has surged since mid-March as shoppers take precautionary measures and opt for their groceries to be delivered at home, or through curb-side pickup. Retailers and delivery services have reported significant
increases in sales and traffic, in addition to strong growth in mobile app downloads and usage. Online grocery was already predicted to grow approximately 19% in 20201, but today’s environment will likely push this growth rate even higher for the
foreseeable future. • Quotient eCommerce: As traffic and sales grow for eCommerce, it’s imperative that brands direct dollars to digital to capture the shift in shopper spend. As shoppers build their digital carts, brands must create awareness at
that point-of-purchase. Our sponsored product listings solution gives brands the opportunity to drive sales within retailers’ growing eCommerce channels. “In-store placements have less impact when people are strictly shopping off lists or queuing
up orders online…So you need media campaigns that 1 eMarketer, April 2019: Grocery Ecommerce
2019 Q1 2020 FINANCIAL RESULTS AND BUSINESS UPDATE 5
Quotient Technology Inc. put products in consumer’s heads and on grocery lists.” – James Hercher, AdExchanger Offline paper coupons are finally starting to reach their end of life. The offline free-standing inserts (FSIs) are expected to lose
over 20% of their coupon distribution from leading CPGs over the course of 2020 and 2021. As a result, the value of the FSI diminishes. We expect other CPGs will follow and a portion of these dollars will shift to digital. As the market leader in
digital promotions, we expect Quotient to benefit from this shift. Some retailers, as a result of COVID-19, have stopped accepting paper coupons all-together and have directed shoppers to their digital paperless coupon programs. Many
grocery-delivery services have also stopped accepting paper coupons. These precautionary measures eliminate the need for unnecessary contact between shoppers and store, or delivery employees. We believe these measures will accelerate the adoption
of digital paperless coupons. Digital coupons remain one of the most effective and efficient ways for CPGs to spend marketing dollars. Recessionary periods have historically experienced higher coupon usage, and with a high unemployment rate, CPGs
need to maintain sales, market share and brand equity. In 2009, CPGs distributed more coupons than any year in the preceding three decades, and redemption rates increased 27% over 2008.2 2 CNN, January 29, 2010: “As Recession Lingers, Coupon Use
Jumps 27 Percent”
Q1 2020 FINANCIAL RESULTS AND BUSINESS UPDATE 6 Quotient Technology Inc. Below is
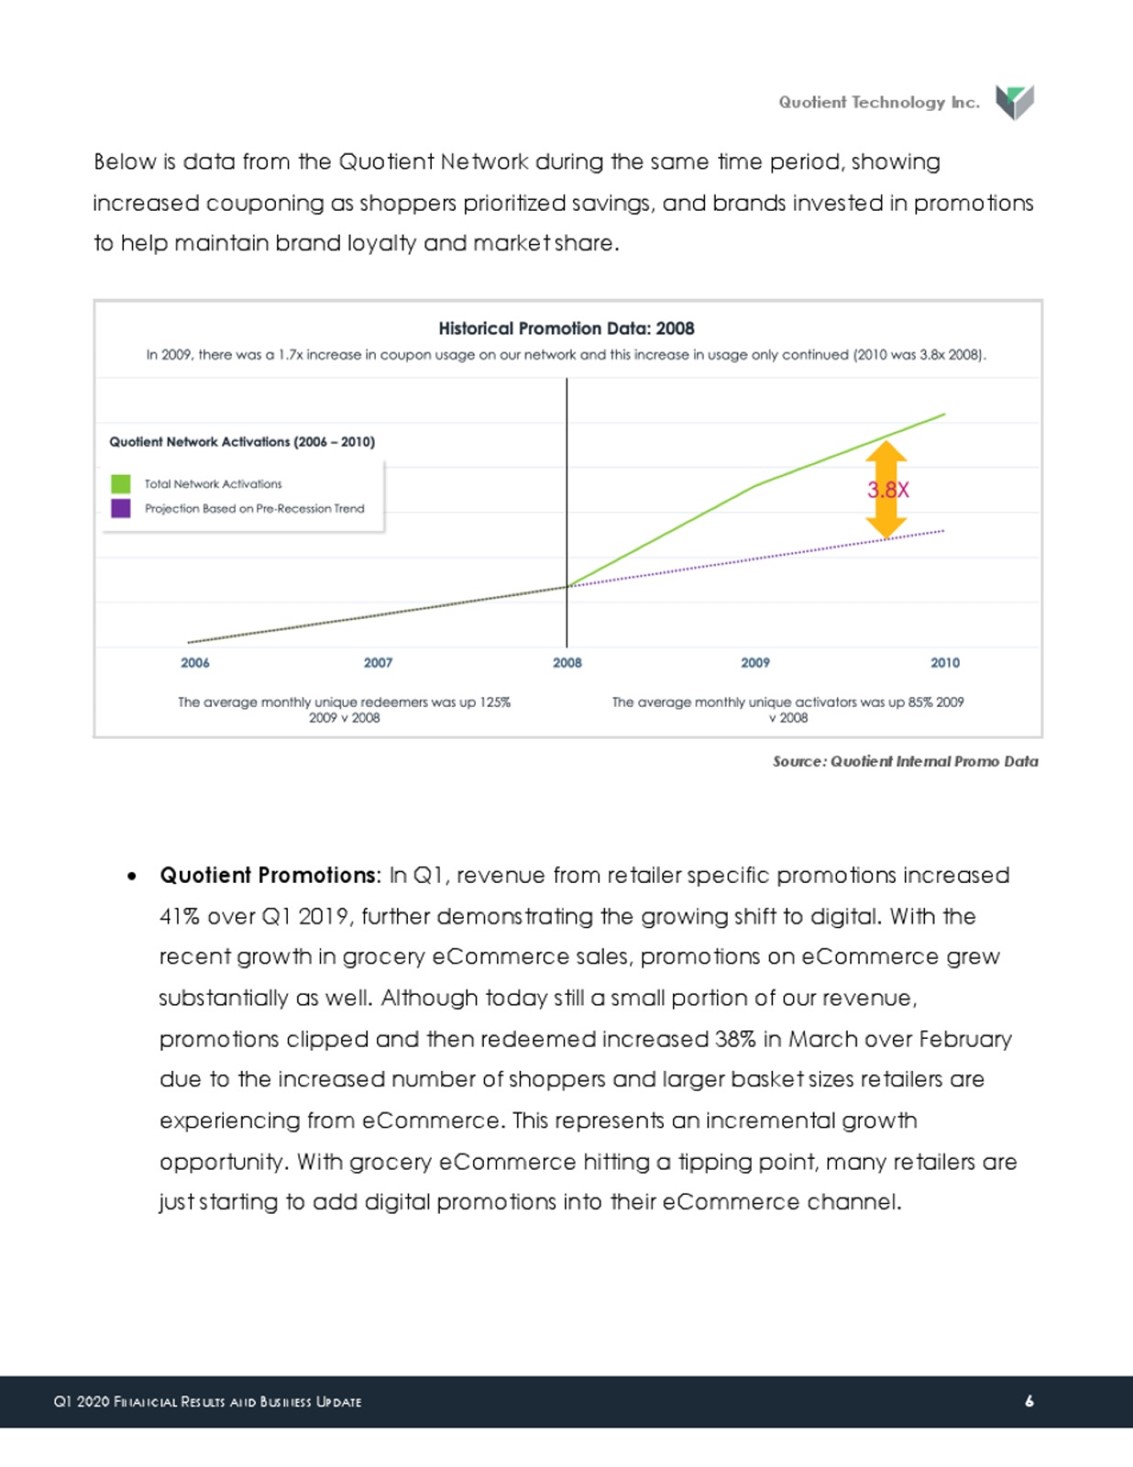
data from the Quotient Network during the same time period, showing increased couponing as shoppers prioritized savings, and brands invested in promotions to help maintain brand loyalty and market share. Source: Quotient Internal Promo Data •
Quotient Promotions: In Q1, revenue from retailer specific promotions increased 41% over Q1 2019, further demonstrating the growing shift to digital. With the recent growth in grocery eCommerce sales, promotions on eCommerce grew substantially as
well. Although today still a small portion of our revenue, promotions clipped and then redeemed increased 38% in March over February due to the increased number of shoppers and larger basket sizes retailers are experiencing from eCommerce. This
represents an incremental growth opportunity. With grocery eCommerce hitting a tipping point, many retailers are just starting to add digital promotions into their eCommerce channel.
Q1 2020 FINANCIAL RESULTS AND BUSINESS UPDATE 7 Quotient Technology Inc. Retail
Media is gaining momentum across the industry and remains a large opportunity to shift dollars from in-store merchandising to digital. Recent growth in eCommerce is compounding the need for retailers to offer digital media capabilities. • Quotient
Retail Performance Media: Quotient’s retail partners continue to push digital initiatives forward, working closely with CPGs to shift up to 1.5% of their gross sales into their digital marketing platform. As a result, CPGs are committing to annual
plans to meet these goals. Retail media is a growing and profitable business for retailers, CPGs and ultimately for shoppers who benefit from analytics driven targeting of offers and marketing. And lastly, we believe digital will benefit from the
millions of dollars that CPGs had planned to spend on sponsored events, professional sports and specifically the Olympics. With events now cancelled, we expect that those marketing campaigns will have to be re-scoped and dollars redeployed.
Quotient is ideally positioned to help shift those dollars to working media and drive sales. “Chief financial officer Jon Moeller confirmed the company would be putting its foot down on media spend, rather than taking it off in an effort to bank
cash.” - The Drum, April 17, 2020: P&G ramps up marketing amid coronavirus demand: ‘This is not a time to go off-air’ Market-Leading Strength for Long-Term Growth We’ve built our business around a large secular shift to digital. The current
environment is accelerating this shift faster than ever, as consumers drive swift changes in shopping behaviors, and retailers and CPGs rise to meet the challenges of these new demands.
Q1 2020 FINANCIAL RESULTS AND BUSINESS UPDATE 8 Quotient Technology Inc. The
strategic value Quotient provides, differentiates us from others and keeps us focused on both the immediate-term industry needs, and the long-term opportunities of tomorrow. Vertically Focused on Essential Retail: We are resilient, a market-leader
in an essential vertical where consumers will always need to spend money on grocery, food and household items. Consumers have choices on what to spend and where, with CPGs and retailers competing for market share, whether in good or challenging
times. Strategic Mix of Products: We have limited exposure to a single product offering. Our portfolio of products brings choices to our customers and partners, allowing for flexibility and quick responses to changing marketplace dynamics. Strong
Call-To-Action: Our solutions are designed to drive a specific call-to-action – or direct response - from shoppers. These include measurable actions and insights from a shopper’s use of a coupon, signaling purchase intent, entering search terms,
click through rates, store locations, adding items to shopping carts, or even entering a contest. Campaign Performance and Measurability: We drive incremental sales volume at scale, with higher than industry average ROIs on promotion and media
spend. Broad Consumer Reach: Our platform provides at-scale reach into shoppers’ path-to-purchase and is the largest, cross-retailer network of CPG sales in the U.S. This will not be a winner take all game, nor do we believe online-only retailers
have the advantage. For CPGs, the retailers that generate the bulk of their sales provide a logical place to direct a greater proportion of marketing and promotional spend.
Q1 2020 FINANCIAL RESULTS AND BUSINESS UPDATE 9 Quotient
Technology Inc. “The best response to what we are challenged with today is to push forward, not to pull back, and that's exactly what we intend to do.” - John Moller, Chief Financial Officer of P&G Financial Review First Quarter 2020 Summary
Results • We delivered revenue of $98.8 million, up 0.7% over Q1 2019 • Adjusted EBITDA was $5.1 million, representing a 5.1% margin • GAAP gross margin was 38.1%, compared to 42.1% in Q1 2019 • Non-GAAP gross margin was 45.1%, compared to 48.1%
in Q1 2019 • GAAP operating expenses were 51.8% of revenue, compared to 53.6% of revenue in Q1 2019 • Non-GAAP operating expenses were 41.6% of revenue, flat compared to Q1 2019 • We recorded a GAAP net loss of $16.7 million, compared to a loss
of $13.2 million in Q1 2019. Loss Per Share in the quarter was $0.19, compared to $0.14 in
Q1 2019 Q1 2020 FINANCIAL RESULTS AND BUSINESS UPDATE 10
Quotient Technology Inc. Revenue Details We delivered $98.8 million of revenue in Q1 2020, relatively flat over last year. This is down from our guidance we gave in February primarily due to the impact of COVID-19 on our media business in the
last two weeks of March. Total revenue for January and February was up 12% year over year. Starting in mid-March we began to see paused or delayed campaigns as a result of COVID-19. Despite these impacts, media revenue in the quarter grew 13%
over last year. Media impacted by COVID-19 was primarily in programmatic display and social influencer, as brands and retailers paused brand advertising given the challenges in the current environment, out-of-stock situations and rapidly changing
consumer shopping behavior. Promotions revenue declined 6% over last year, driven by anticipated year over year declines in digital print and specialty retail, 27% and 20% respectively. Digital paperless was just slightly down at 0.9% year over
year. Our three Customer Cohorts: (1) top 20 customers, (2) customers 20-40, and (3) the rest of our customers, continued to grow in the first quarter. On a trailing twelve months basis, we saw overall growth of 12% across our customer cohorts.
Growth in our top 20 customer cohort grew 22% over the comparable trailing twelve-month period. Gross Margin Non-GAAP gross margin excludes stock-based compensation expense, amortization of acquired intangible assets, and restructuring charges.
Q1 2020 FINANCIAL RESULTS AND BUSINESS UPDATE 11 Quotient Technology Inc. We have
many product offerings, each with a different gross margin profile. Overall, promotion offerings carry higher gross margins than media. This product mix can fluctate in any given quarter. In Q1, GAAP gross margins were down approximately 400 basis
points over Q1 last year due to lower promotion revenue contribution, an increase in amortization of intangible assets and an increase of $0.8 million in fixed costs, primarily from headcount investments made in anticipation of delivering higher
revenue. Non-GAAP gross margins in Q1 2020 were down approximately 300 basis points over Q1 2019 due to lower promotion revenue contribution, and an increase in fixed costs primarily from headcount investments. We continue to be highly focused on
improving gross margins. As a step toward improvement, we set a goal of 50% Non-GAAP gross margin by the end of the year. This goal is predicated on two things: certain initiatives around process and operations that will drive improvements, and
product mix. In February we outlined several initiatives that continue to be underway and we expect to see improvements starting in Q2 from these: • Changes in the delivery of some of our media products to enhance the customer experience, resulting
in revenue from these products being recognized on a net basis, as oppsed to gross. The timing of this started on April 1, 2020, and will be reflected in our Q2 2020 financial reporting. • Cost efficiences through the acquisition of Ubimo. •
Improved automation across the company.
Q1 2020 FINANCIAL RESULTS AND BUSINESS UPDATE 12 Quotient Technology Inc. Product
mix, however, is harder to forecast given the current environment. We are not backing off the goal of reaching 50% Non-GAAP gross margins but product mix throughout the rest of the year could affect the timing slightly, positively or negatively.
Operating Expenses Non-GAAP operating expenses exclude stock-based compensation, the change in fair value of contingent consideration, amortization of acquired intangible assets, certain acquisition related costs, and restructuring charges. We
continued to manage costs and invest where appropriate while driving greater efficiencies in the business. For example, we implemented a more efficient go-to-market model and revised our commission structure. We also slowed hiring and reduced
marketing spend in the quarter. As a result, GAAP and Non-GAAP operating expenses were better than we anticipated. GAAP operating expenses declined by $1.4 million over the prior year primarily due to lower fair value of contingent consideration.
Non-GAAP operating expenses were slightly up year over year, primarily due to the acquisition of Ubimo and growth in headcount, offset by a revised sales commission structure, higher capitalization of R&D costs and lower marketing spend.
Quarter over quarter, GAAP and Non-GAAP operating expenses declined by a couple of million dollars due to lower sales commission and higher capitalization of R&D costs, partially offset by a full quarter of expenses from the Ubimo acquisition
and the payroll tax reset at the beginning of the year.
Q1 2020 FINANCIAL RESULTS AND BUSINESS UPDATE 13 Quotient Technology Inc. Adjusted
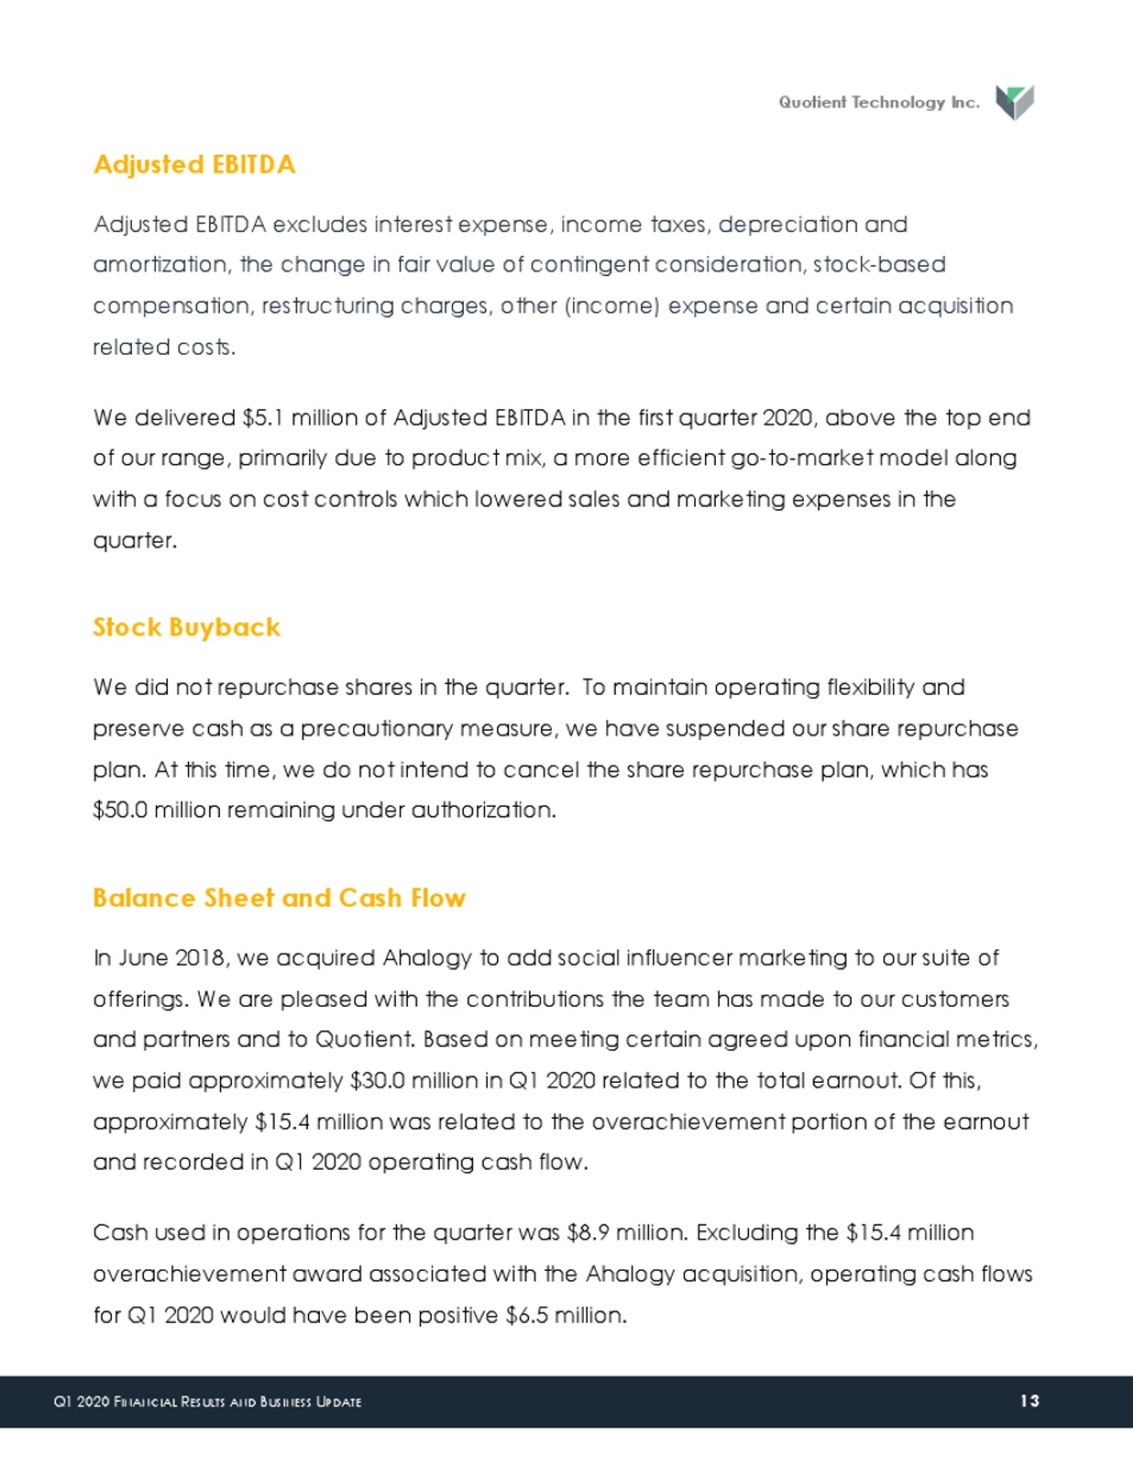
EBITDA Adjusted EBITDA excludes interest expense, income taxes, depreciation and amortization, the change in fair value of contingent consideration, stock-based compensation, restructuring charges, other (income) expense and certain acquisition
related costs. We delivered $5.1 million of Adjusted EBITDA in the first quarter 2020, above the top end of our range, primarily due to product mix, a more efficient go-to-market model along with a focus on cost controls which lowered sales and
marketing expenses in the quarter. Stock Buyback We did not repurchase shares in the quarter. To maintain operating flexibility and preserve cash as a precautionary measure, we have suspended our share repurchase plan. At this time, we do not
intend to cancel the share repurchase plan, which has $50.0 million remaining under authorization. Balance Sheet and Cash Flow In June 2018, we acquired Ahalogy to add social influencer marketing to our suite of offerings. We are pleased with the
contributions the team has made to our customers and partners and to Quotient. Based on meeting certain agreed upon financial metrics, we paid approximately $30.0 million in Q1 2020 related to the total earnout. Of this, approximately $15.4 million
was related to the overachievement portion of the earnout and recorded in Q1 2020 operating cash flow. Cash used in operations for the quarter was $8.9 million. Excluding the $15.4 million overachievement award associated with the Ahalogy
acquisition, operating cash flows for Q1 2020 would have been positive $6.5 million.
Q1 2020 FINANCIAL RESULTS AND BUSINESS UPDATE 14 Quotient
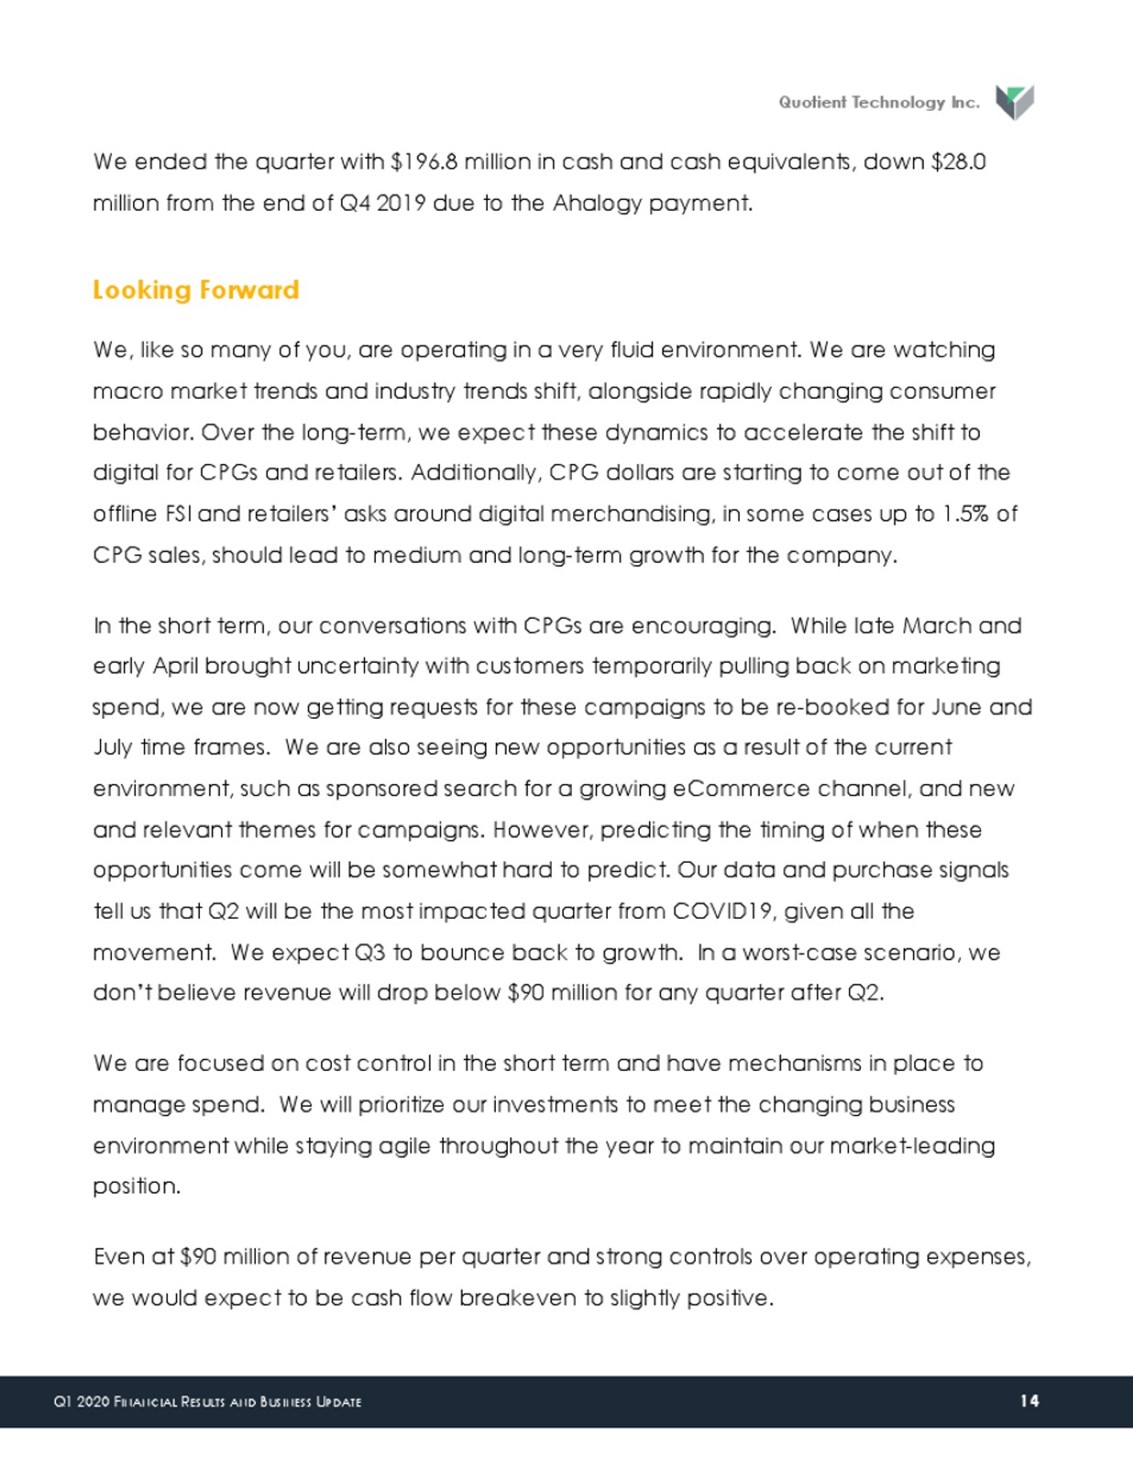
Technology Inc. We ended the quarter with $196.8 million in cash and cash equivalents, down $28.0 million from the end of Q4 2019 due to the Ahalogy payment. Looking Forward We, like so many of you, are operating in a very fluid environment. We
are watching macro market trends and industry trends shift, alongside rapidly changing consumer behavior. Over the long-term, we expect these dynamics to accelerate the shift to digital for CPGs and retailers. Additionally, CPG dollars are
starting to come out of the offline FSI and retailers’ asks around digital merchandising, in some cases up to 1.5% of CPG sales, should lead to medium and long-term growth for the company. In the short term, our conversations with CPGs are
encouraging. While late March and early April brought uncertainty with customers temporarily pulling back on marketing spend, we are now getting requests for these campaigns to be re-booked for June and July time frames. We are also seeing new
opportunities as a result of the current environment, such as sponsored search for a growing eCommerce channel, and new and relevant themes for campaigns. However, predicting the timing of when these opportunities come will be somewhat hard to
predict. Our data and purchase signals tell us that Q2 will be the most impacted quarter from COVID19, given all the movement. We expect Q3 to bounce back to growth. In a worst-case scenario, we don’t believe revenue will drop below $90 million
for any quarter after Q2. We are focused on cost control in the short term and have mechanisms in place to manage spend. We will prioritize our investments to meet the changing business environment while staying agile throughout the year to
maintain our market-leading position. Even at $90 million of revenue per quarter and strong controls over operating expenses, we would expect to be cash flow breakeven to slightly positive.
Q1 2020 FINANCIAL RESULTS AND BUSINESS UPDATE 15 Quotient
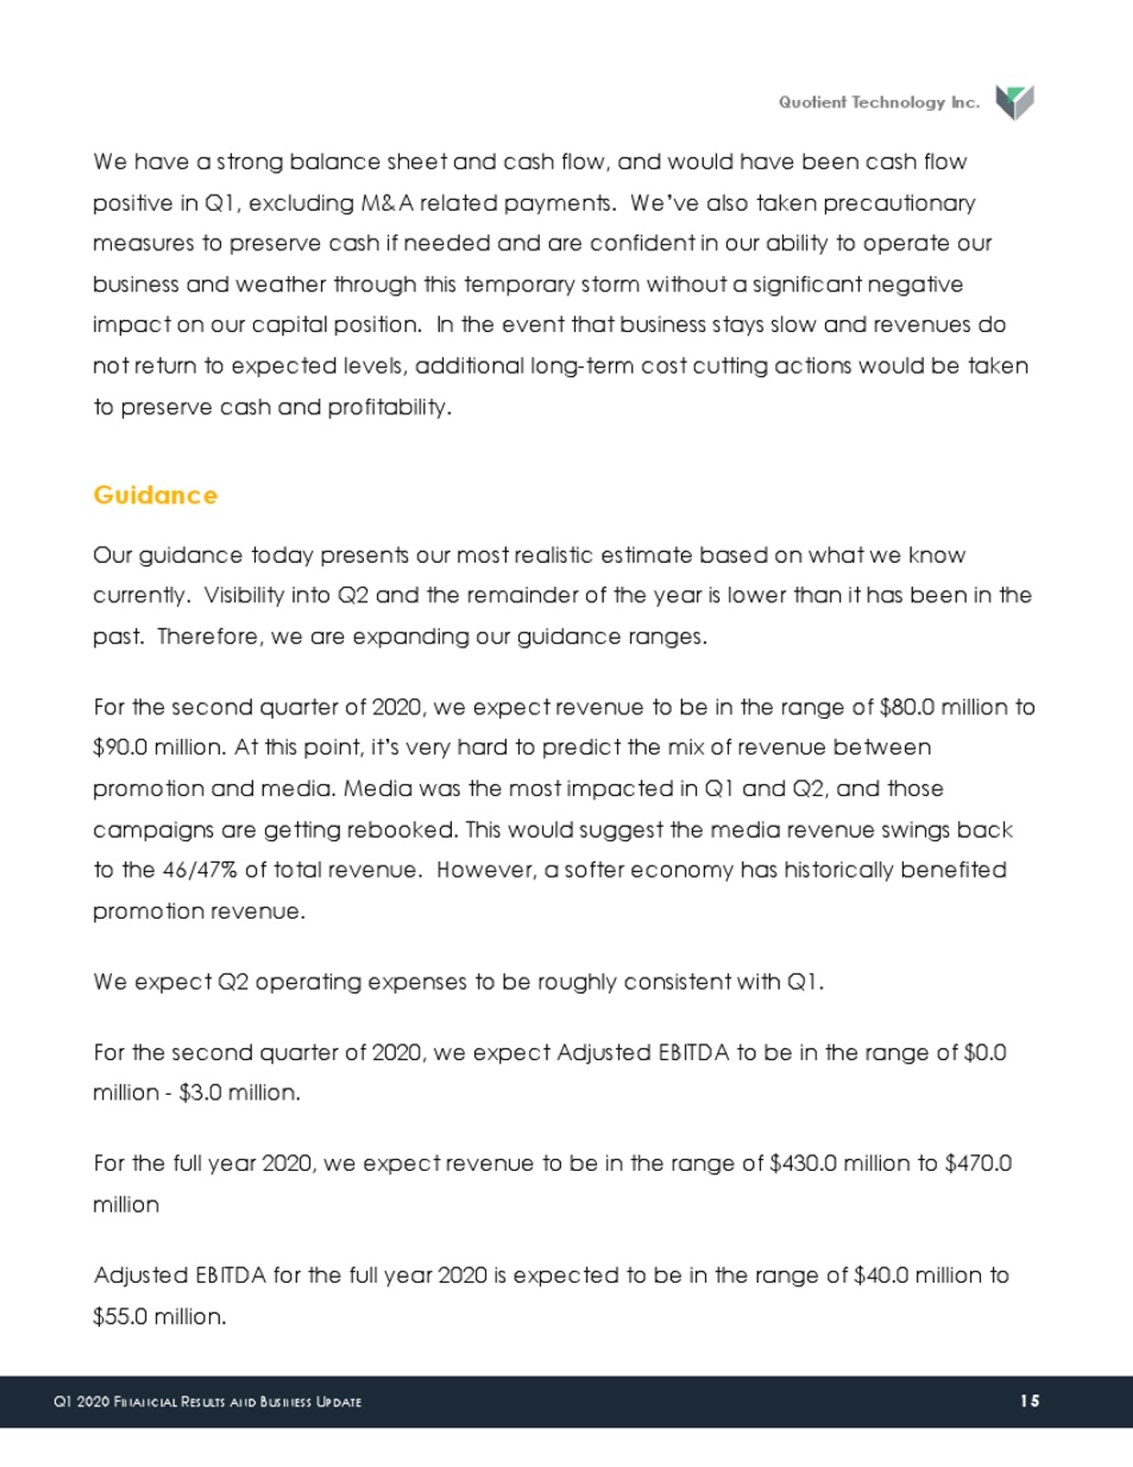
Technology Inc. We have a strong balance sheet and cash flow, and would have been cash flow positive in Q1, excluding M&A related payments. We’ve also taken precautionary measures to preserve cash if needed and are confident in our ability to
operate our business and weather through this temporary storm without a significant negative impact on our capital position. In the event that business stays slow and revenues do not return to expected levels, additional long-term cost cutting
actions would be taken to preserve cash and profitability. Guidance Our guidance today presents our most realistic estimate based on what we know currently. Visibility into Q2 and the remainder of the year is lower than it has been in the past.
Therefore, we are expanding our guidance ranges. For the second quarter of 2020, we expect revenue to be in the range of $80.0 million to $90.0 million. At this point, it’s very hard to predict the mix of revenue between promotion and media.
Media was the most impacted in Q1 and Q2, and those campaigns are getting rebooked. This would suggest the media revenue swings back to the 46/47% of total revenue. However, a softer economy has historically benefited promotion revenue. We expect
Q2 operating expenses to be roughly consistent with Q1. For the second quarter of 2020, we expect Adjusted EBITDA to be in the range of $0.0 million - $3.0 million. For the full year 2020, we expect revenue to be in the range of $430.0 million to
$470.0 million Adjusted EBITDA for the full year 2020 is expected to be in the range of $40.0 million to $55.0 million.
Q1 2020 FINANCIAL RESULTS AND BUSINESS UPDATE 16 Quotient Technology Inc. We expect
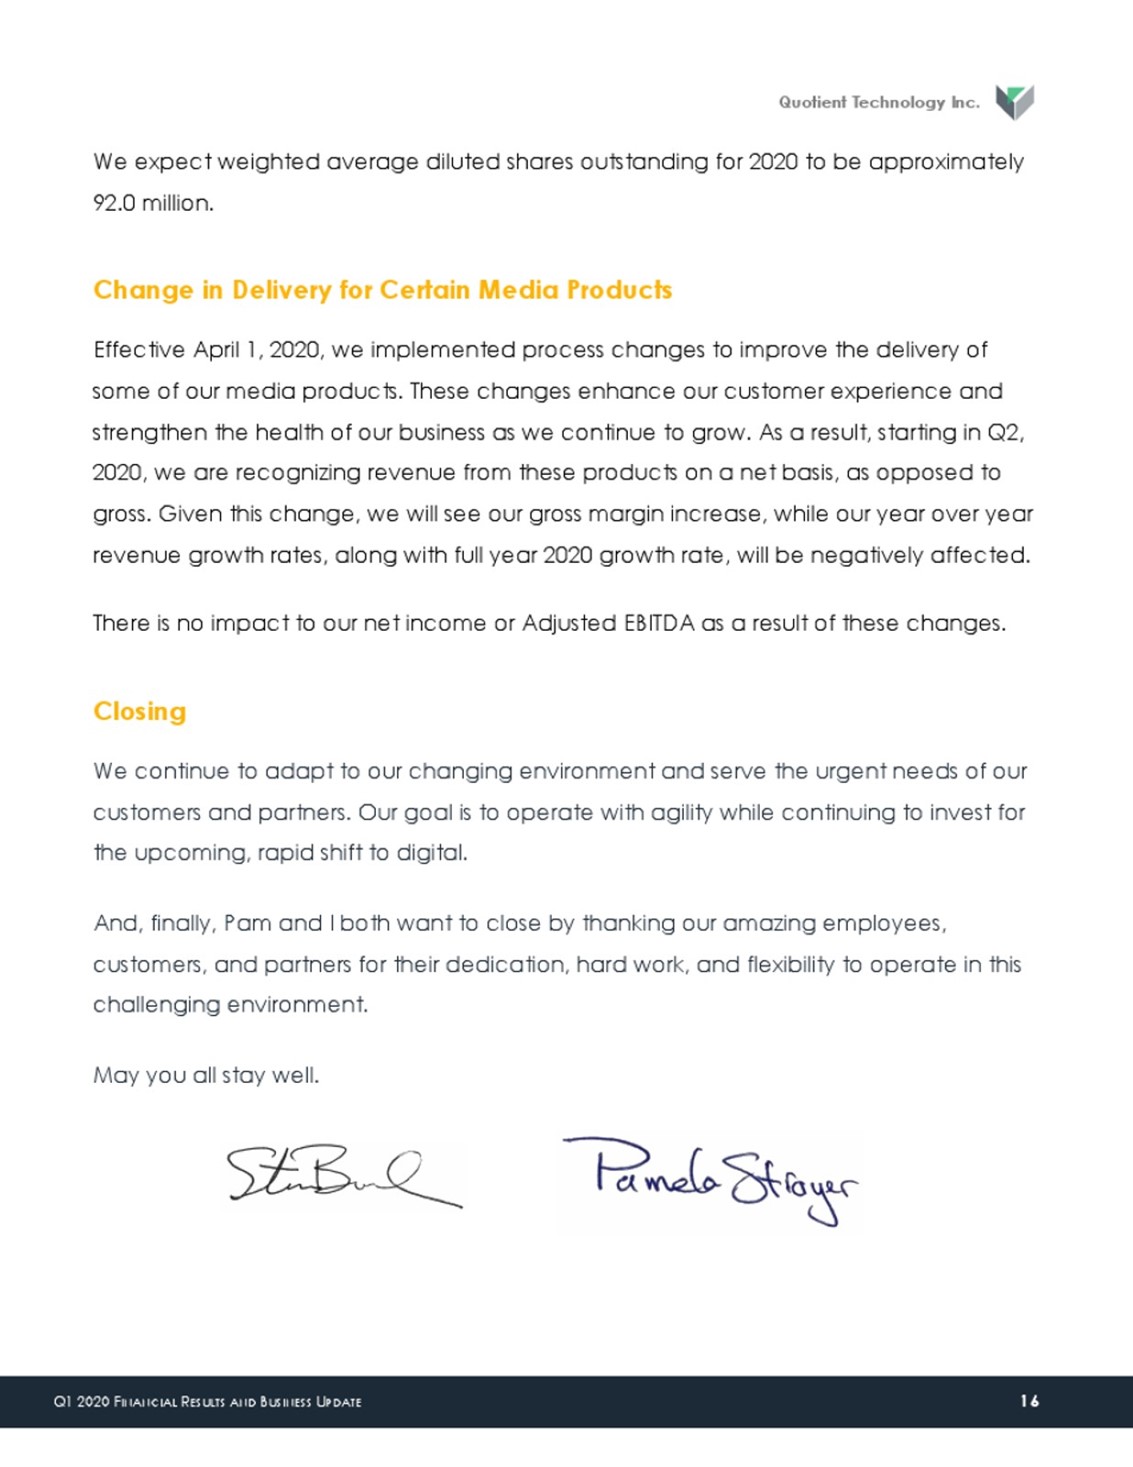
weighted average diluted shares outstanding for 2020 to be approximately 92.0 million. Change in Delivery for Certain Media Products Effective April 1, 2020, we implemented process changes to improve the delivery of some of our media products.
These changes enhance our customer experience and strengthen the health of our business as we continue to grow. As a result, starting in Q2, 2020, we are recognizing revenue from these products on a net basis, as opposed to gross. Given this
change, we will see our gross margin increase, while our year over year revenue growth rates, along with full year 2020 growth rate, will be negatively affected. There is no impact to our net income or Adjusted EBITDA as a result of these changes.
Closing We continue to adapt to our changing environment and serve the urgent needs of our customers and partners. Our goal is to operate with agility while continuing to invest for the upcoming, rapid shift to digital. And, finally, Pam and I both
want to close by thanking our amazing employees, customers, and partners for their dedication, hard work, and flexibility to operate in this challenging environment. May you all stay well.
Q1 2020 FINANCIAL RESULTS AND BUSINESS UPDATE 17 Quotient Technology Inc. Forward
Looking Statements This stockholder letter includes forward-looking statements that include projections for our second quarter and full year 2020, expectations about our ability to grow revenues, gross margin and Adjusted EBITDA, the impact of our
shift to recognize certain media services on a net basis, our expectations for our solutions, partnerships, the Quotient Network, product launches; our ability to manage our business and liquidity during and after the COVID-19 pandemic; growth in
eCommerce including sponsored products; our ability to capture marketing dollars of CPGs on Retail Media as demanded by our retail partners or that was made available upon the cancellation of sponsored events including sporting events; the
importance of promotions to CPGs during recessionary periods; the effectiveness of our cost control measures; CPGs’ plans to reduce spending in offline free-standing inserts; the future demands and behaviors of consumers, retailers and CPGs,
particularly in light of the effects of the COVID-19 pandemic; brands’ plan to rebook paused or delayed campaigns later in the year; as well as the expected growth of, and investments in, our business generally and the expected ability to leverage
investments and operating expenses. Forward-looking statements are based on information available to and the good faith beliefs of our Management team as of the time of this call and are subject to known and unknown risks and uncertainties that
could cause actual performances or results to differ materially. Additional information about factors that could potentially impact our financial results can be found in today's press release and in the risk factors identified in our Annual Report
on Form 10-K filed with the SEC on March 2, 2020. We disclaim any obligation to update information contained in these forward-looking statements, whether as a result of new information, future events, or otherwise. Please note that with the
exception of revenues, operating expenses, gross margins and net loss, financial measures discussed today are on a non-GAAP basis and have been adjusted to exclude certain expenses. A reconciliation between GAAP and non-GAAP measures can be found
in the financial result press release issued today and on the slide deck posted on the Company's website. Financial Tables
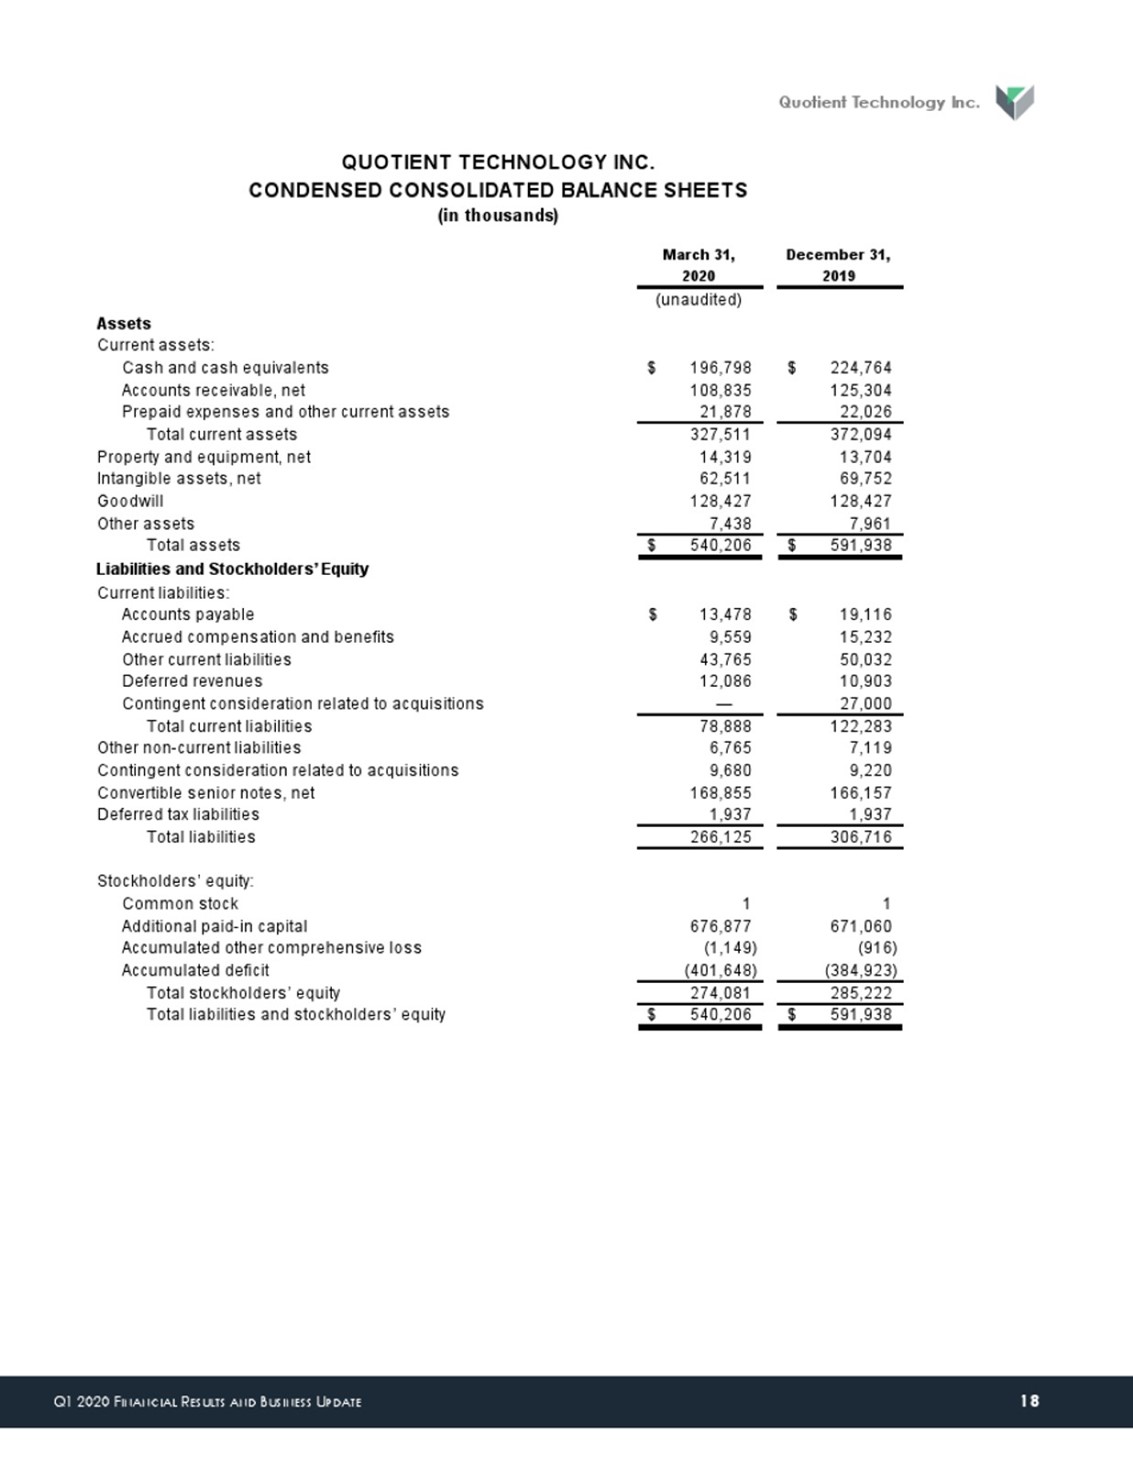
Q1 2020 FINANCIAL RESULTS AND BUSINESS UPDATE 18 Quotient Technology Inc. March
31,2020December 31,2019(unaudited)AssetsCurrent assets:Cash and cash equivalents196,798$ 224,764$ Accounts receivable, net 108,835 125,304 Prepaid expenses and other current assets 21,878 22,026 Total current assets 327,511 372,094 Property and
equipment, net 14,319 13,704 Intangible assets, net 62,511 69,752 Goodwill 128,427 128,427 Other assets 7,438 7,961 Total assets 540,206$ 591,938$ Liabilities and Stockholders’ EquityCurrent liabilities:Accounts payable 13,478$ 19,116$ Accrued
compensation and benefits 9,559 15,232 Other current liabilities 43,765 50,032 Deferred revenues 12,086 10,903 Contingent consideration related to acquisitions— 27,000 Total current liabilities 78,888 122,283 Other non-current liabilities 6,765
7,119 Contingent consideration related to acquisitions9,680 9,220 Convertible senior notes, net168,855 166,157 Deferred tax liabilities 1,937 1,937 Total liabilities 266,125 306,716 Stockholders’ equity:Common stock1 1 Additional paid-in capital
676,877 671,060 Accumulated other comprehensive loss(1,149) (916) Accumulated deficit (401,648) (384,923) Total stockholders’ equity 274,081 285,222 Total liabilities and stockholders’ equity 540,206$ 591,938$ QUOTIENT TECHNOLOGY INC.CONDENSED
CONSOLIDATED BALANCE SHEETS(in thousands)
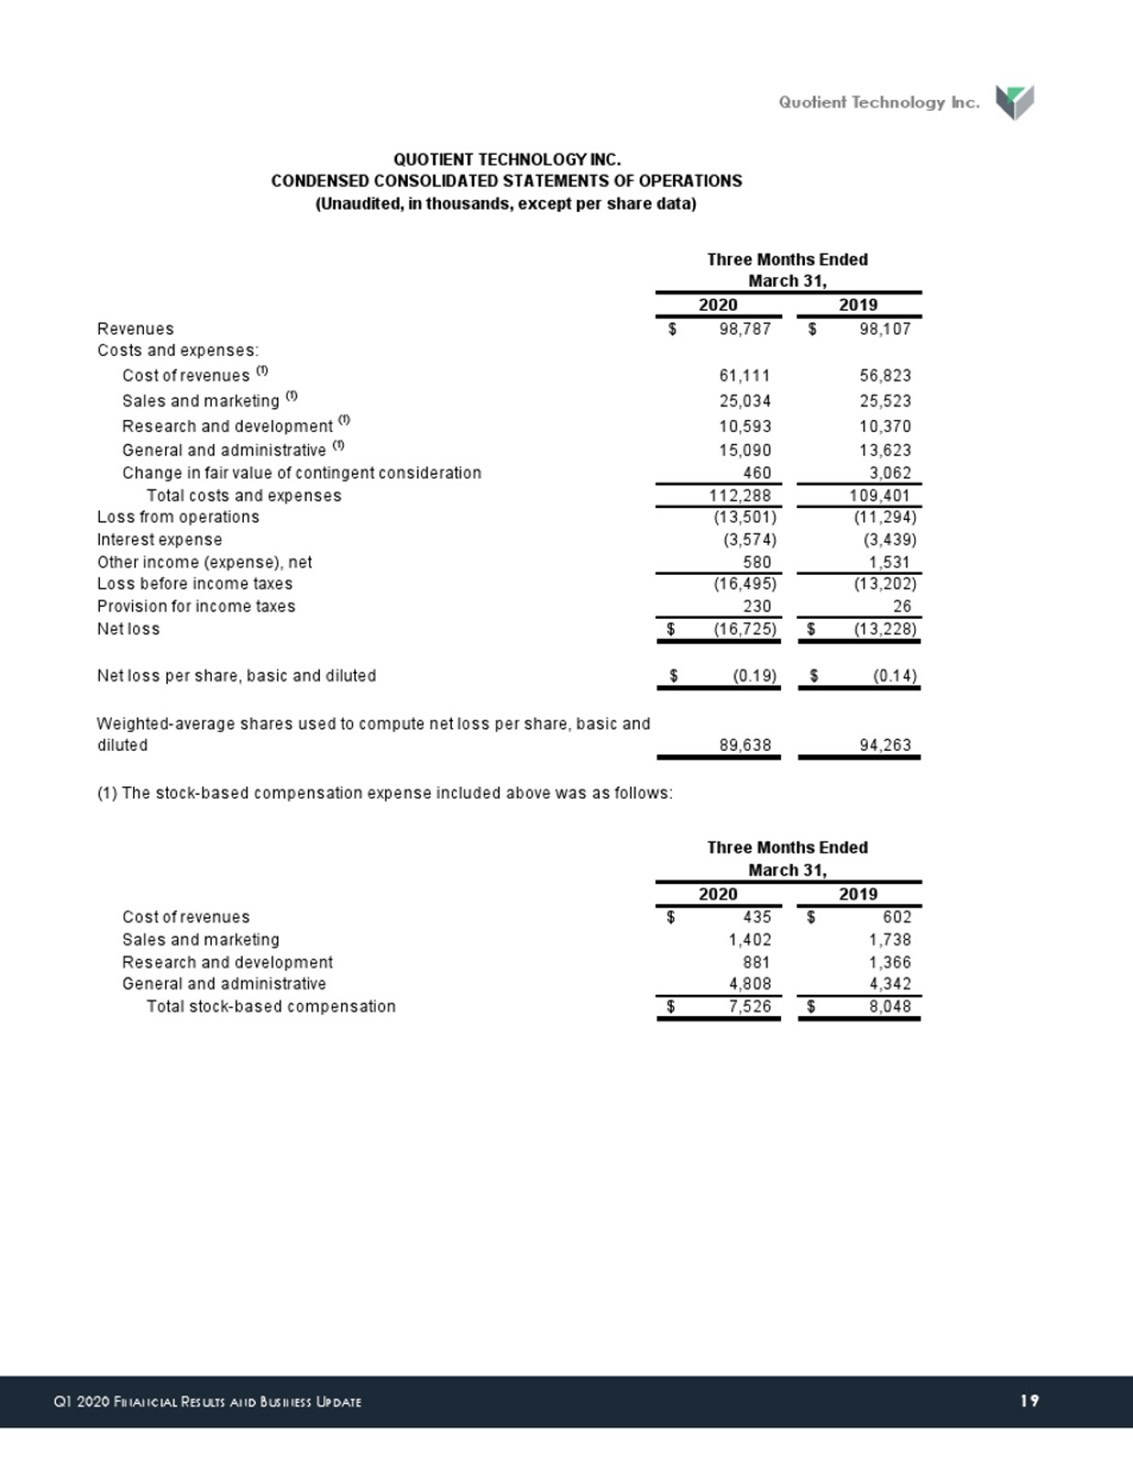
Q1 2020 FINANCIAL RESULTS AND BUSINESS UPDATE 19 Quotient
Technology Inc. 20202019Revenues 98,787$ 98,107$ Costs and expenses:Cost of revenues (1)61,111 56,823 Sales and marketing (1)25,034 25,523 Research and development (1)10,593 10,370 General and administrative (1)15,090 13,623 Change in fair value
of contingent consideration460 3,062 Total costs and expenses 112,288 109,401 Loss from operations (13,501) (11,294) Interest expense(3,574) (3,439) Other income (expense), net 580 1,531 Loss before income taxes (16,495) (13,202) Provision for
income taxes 230 26 Net loss(16,725)$ (13,228)$ Net loss per share, basic and diluted(0.19)$ (0.14)$ Weighted-average shares used to compute net loss per share, basic and diluted89,638 94,263 20202019Cost of revenues 435$ 602$ Sales and
marketing1,402 1,738 Research and development881 1,366 General and administrative4,808 4,342 Total stock-based compensation 7,526$ 8,048$ Three Months EndedMarch 31,Three Months EndedMarch 31,QUOTIENT TECHNOLOGY INC.CONDENSED CONSOLIDATED
STATEMENTS OF OPERATIONS(Unaudited, in thousands, except per share data)(1) The stock-based compensation expense included above was as follows:
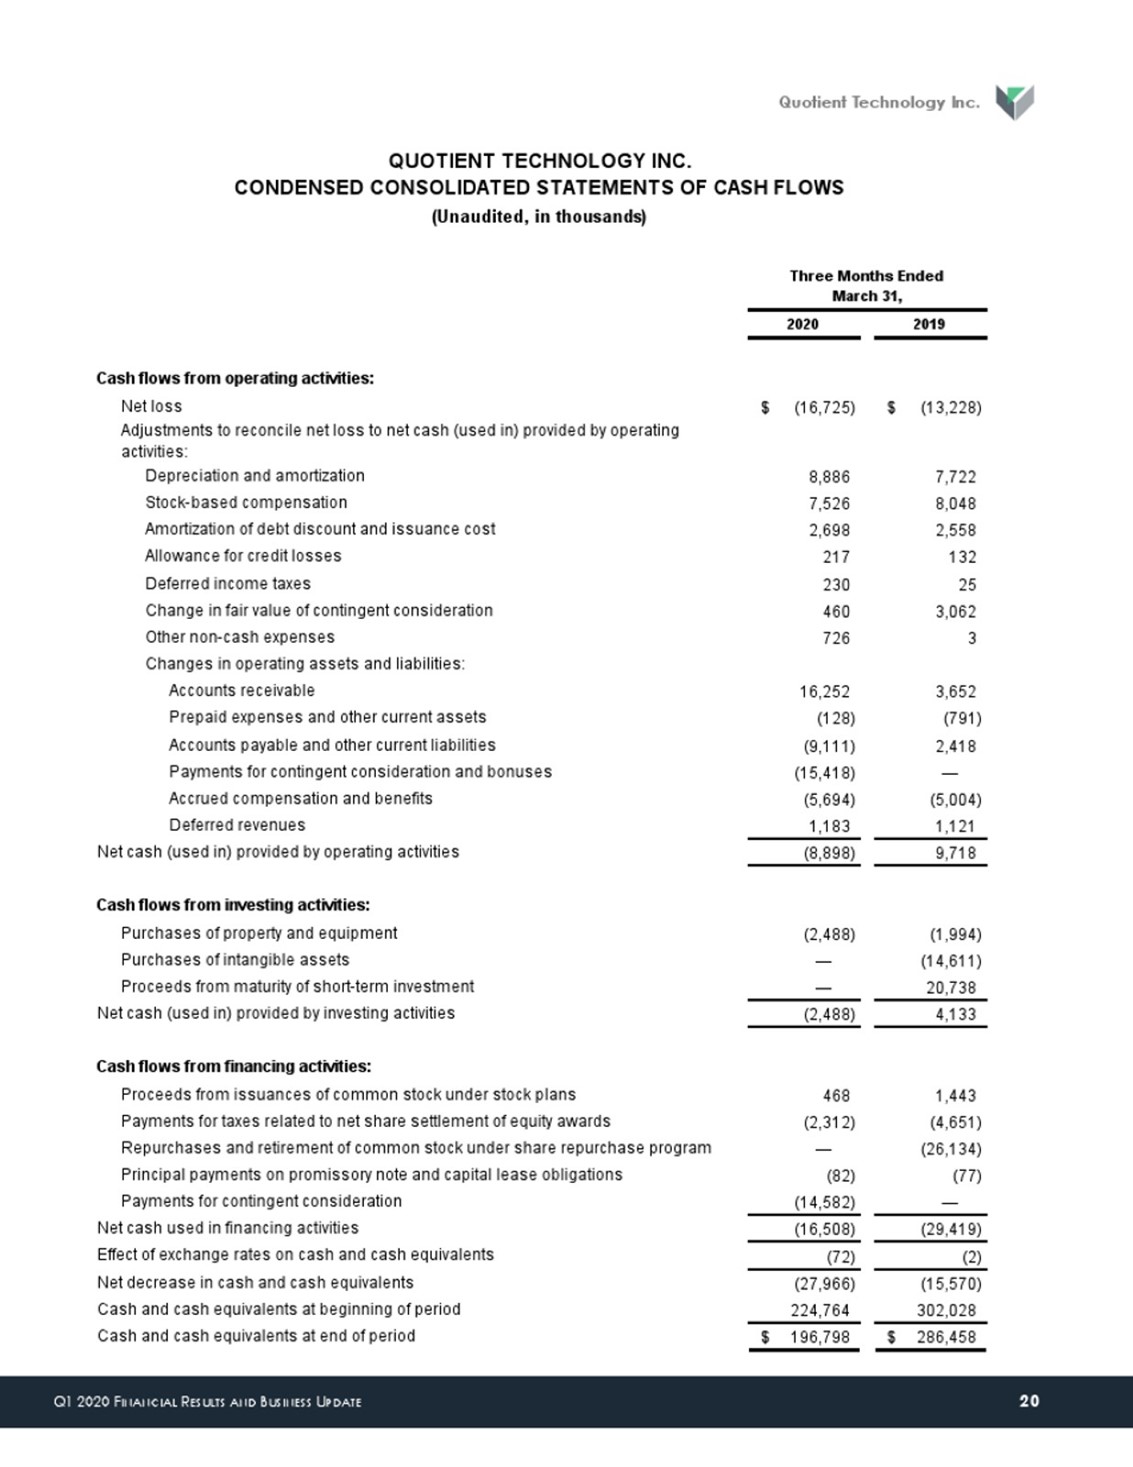
Q1 2020 FINANCIAL RESULTS AND BUSINESS UPDATE 20 Quotient Technology Inc.
20202019Cash flows from operating activities:Net loss (16,725)$ (13,228)$ Adjustments to reconcile net loss to net cash (used in) provided by operating activities:Depreciation and amortization 8,886 7,722 Stock-based compensation 7,526 8,048
Amortization of debt discount and issuance cost2,698 2,558 Allowance for credit losses217 132 Deferred income taxes 230 25 Change in fair value of contingent consideration460 3,062 Other non-cash expenses726 3 Changes in operating assets and
liabilities:Accounts receivable 16,252 3,652 Prepaid expenses and other current assets (128) (791) Accounts payable and other current liabilities (9,111) 2,418 Payments for contingent consideration and bonuses(15,418) — Accrued compensation and
benefits (5,694) (5,004) Deferred revenues 1,183 1,121 Net cash (used in) provided by operating activities (8,898) 9,718 Cash flows from investing activities:Purchases of property and equipment (2,488) (1,994) Purchases of intangible assets—
(14,611) Proceeds from maturity of short-term investment— 20,738 Net cash (used in) provided by investing activities (2,488) 4,133 Cash flows from financing activities:Proceeds from issuances of common stock under stock plans468 1,443 Payments for
taxes related to net share settlement of equity awards(2,312) (4,651) Repurchases and retirement of common stock under share repurchase program— (26,134) Principal payments on promissory note and capital lease obligations (82) (77) Payments for
contingent consideration(14,582) — Net cash used in financing activities (16,508) (29,419) Effect of exchange rates on cash and cash equivalents (72) (2) Net decrease in cash and cash equivalents (27,966) (15,570) Cash and cash equivalents at
beginning of period 224,764 302,028 Cash and cash equivalents at end of period 196,798$ 286,458$ Three Months EndedMarch 31,QUOTIENT TECHNOLOGY INC.CONDENSED CONSOLIDATED STATEMENTS OF CASH FLOWS(Unaudited, in thousands)
Q1 2020 FINANCIAL RESULTS AND BUSINESS UPDATE 21Quotient
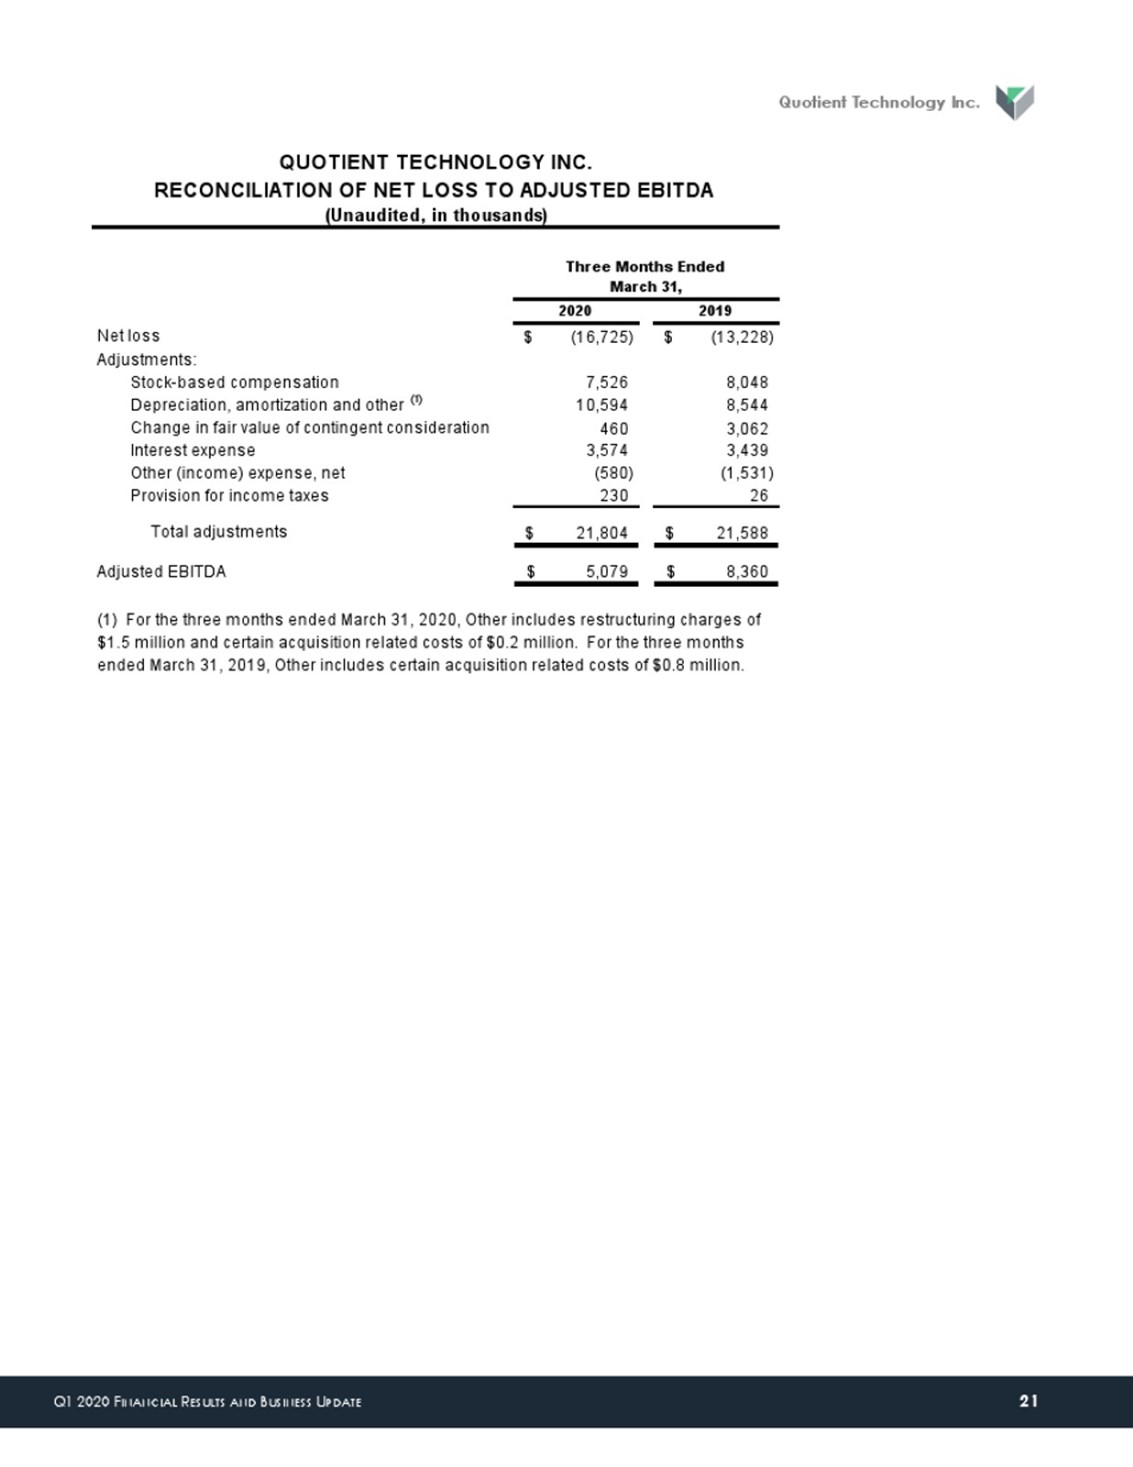
Technology Inc. 20202019Net loss(16,725)$ (13,228)$ Adjustments: Stock-based compensation 7,526 8,048 Depreciation, amortization and other (1)10,594 8,544 Change in fair value of contingent consideration460 3,062 Interest expense3,574 3,439 Other
(income) expense, net (580) (1,531) Provision for income taxes 230 26 Total adjustments 21,804$ 21,588$ Adjusted EBITDA 5,079$ 8,360$ RECONCILIATION OF NET LOSS TO ADJUSTED EBITDA QUOTIENT TECHNOLOGY INC.(1) For the three months ended March 31,
2020, Other includes restructuring charges of $1.5 million and certain acquisition related costs of $0.2 million. For the three months ended March 31, 2019, Other includes certain acquisition related costs of $0.8 million.Three Months EndedMarch
31,(Unaudited, in thousands)
Q1 2020 FINANCIAL RESULTS AND BUSINESS UPDATE 22 Quotient
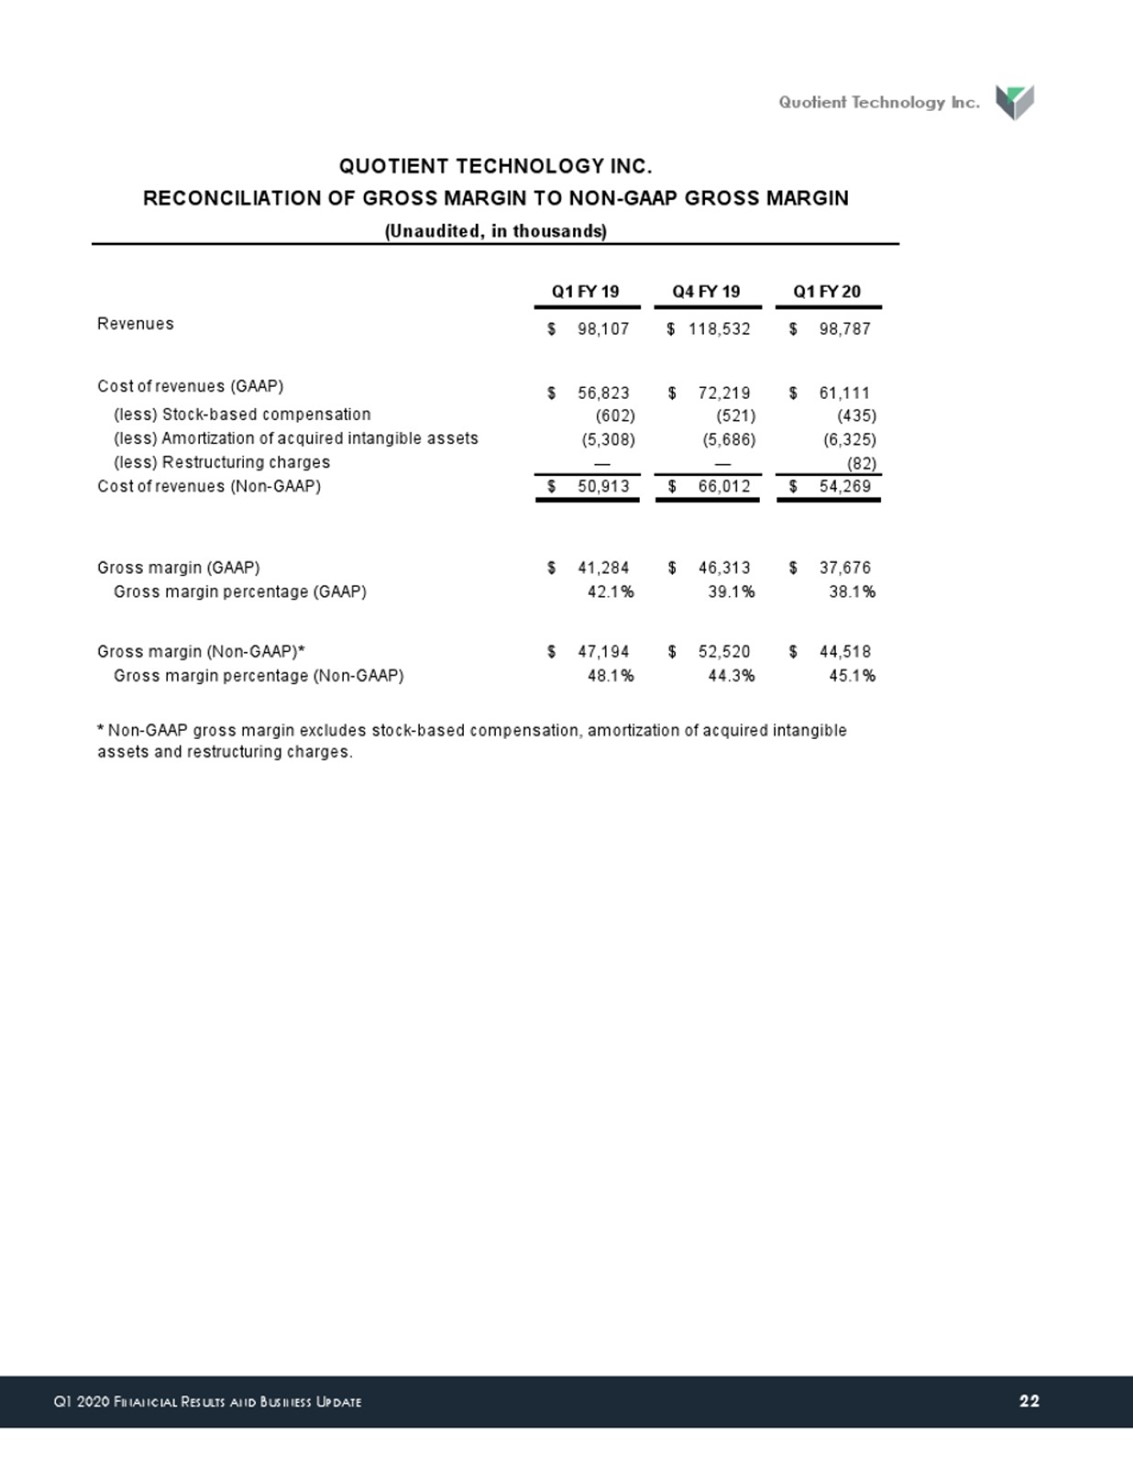
Technology Inc. Q1 FY 19Q4 FY 19Q1 FY 20Revenues98,107$ 118,532$ 98,787$ Cost of revenues (GAAP)56,823$ 72,219$ 61,111$ (less) Stock-based compensation(602) (521) (435) (less) Amortization of acquired intangible assets(5,308) (5,686) (6,325)
(less) Restructuring charges— — (82) Cost of revenues (Non-GAAP)50,913$ 66,012$ 54,269$ Gross margin (GAAP)41,284$ 46,313$ 37,676$ Gross margin percentage (GAAP)42.1%39.1%38.1%Gross margin (Non-GAAP)*47,194$ 52,520$ 44,518$ Gross margin
percentage (Non-GAAP)48.1%44.3%45.1%QUOTIENT TECHNOLOGY INC.RECONCILIATION OF GROSS MARGIN TO NON-GAAP GROSS MARGIN(Unaudited, in thousands)* Non-GAAP gross margin excludes stock-based compensation, amortization of acquired intangible assets and
restructuring charges.
Q1 2020 FINANCIAL RESULTS AND BUSINESS UPDATE 23 Quotient Technology Inc. Q1 FY
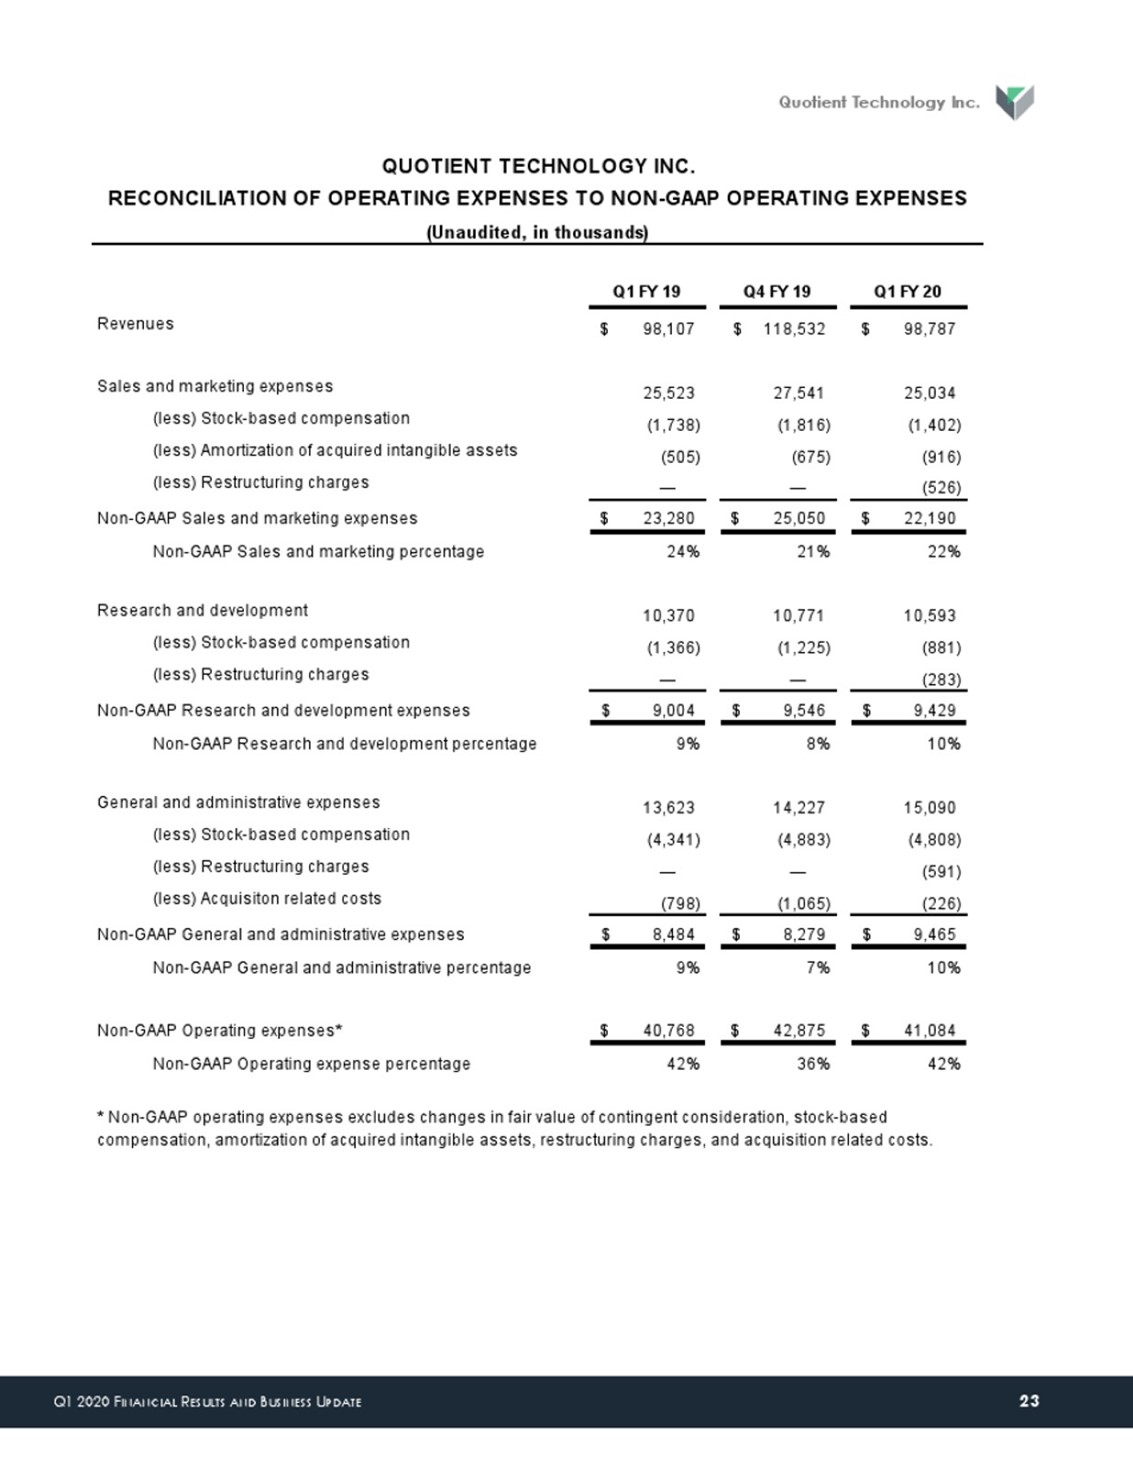
19Q4 FY 19Q1 FY 20Revenues98,107$ 118,532$ 98,787$ Sales and marketing expenses25,523 27,541 25,034 (less) Stock-based compensation(1,738) (1,816) (1,402) (less) Amortization of acquired intangible assets(505) (675) (916) (less) Restructuring
charges— — (526) Non-GAAP Sales and marketing expenses23,280$ 25,050$ 22,190$ Non-GAAP Sales and marketing percentage24%21%22%Research and development10,370 10,771 10,593 (less) Stock-based compensation(1,366) (1,225) (881) (less) Restructuring
charges— — (283) Non-GAAP Research and development expenses9,004$ 9,546$ 9,429$ Non-GAAP Research and development percentage9%8%10%General and administrative expenses13,623 14,227 15,090 (less) Stock-based compensation(4,341) (4,883) (4,808) (less)
Restructuring charges— — (591) (less) Acquisiton related costs(798) (1,065) (226) Non-GAAP General and administrative expenses8,484$ 8,279$ 9,465$ Non-GAAP General and administrative percentage9%7%10%Non-GAAP Operating expenses*40,768$ 42,875$
41,084$ Non-GAAP Operating expense percentage42%36%42%QUOTIENT TECHNOLOGY INC.RECONCILIATION OF OPERATING EXPENSES TO NON-GAAP OPERATING EXPENSES(Unaudited, in thousands)* Non-GAAP operating expenses excludes changes in fair value of contingent
consideration, stock-based compensation, amortization of acquired intangible assets, restructuring charges, and acquisition related costs.
