Attached files
| file | filename |
|---|---|
| 8-K - 8-K - Meridian Corp | tmb-20200505x8k.htm |
Exhibit 99.1
| 1st QTR Investor Presentation May 6, 2020 NASDAQ: MRBK ® |
| 2 Meridian Corporation Forward-Looking Statements Meridian Corporation (the “Corporation”) may from time to time make written or oral “forward-looking statements” within the meaning of the “safe harbor” provisions of the Private Securities Litigation Reform Act of 1995. These forward-looking statements include statements with respect to Meridian Corporation’s strategies, goals, beliefs, expectations, estimates, intentions, capital raising efforts, financial condition and results of operations, future performance and business. Statements preceded by, followed by, or that include the words “may,” “could,” “should,” “pro forma,” “looking forward,” “would,” “believe,” “expect,” “anticipate,” “estimate,” “intend,” “plan,” or similar expressions generally indicate a forward-looking statement. These forward-looking statements involve risks and uncertainties that are subject to change based on various important factors (some of which, in whole or in part, are beyond Meridian Corporation’s control). Numerous competitive, economic, regulatory, legal and technological factors, risks and uncertainties that could cause actual results to differ materially include, without limitation, the current COVID-19 pandemic and government responses thereto, among others, could cause Meridian Corporation’s financial performance to differ materially from the goals, plans, objectives, intentions and expectations expressed in such forward-looking statements. Meridian Corporation cautions that the foregoing factors are not exclusive, and neither such factors nor any such forward-looking statement takes into account the impact of any future events. All forward- looking statements and information set forth herein are based on management’s current beliefs and assumptions as of the date hereof and speak only as of the date they are made. For a more complete discussion of the assumptions, risks and uncertainties related to our business, you are encouraged to review Meridian Corporation’s filings with the Securities and Exchange Commission, including our Annual Report on Form 10-K for the year ended December 31, 2019 and subsequently filed quarterly reports on Form 10-Q and current reports on Form 8-K that update or provide information in addition to the information included in the Form 10-K and Form 10-Q filings, if any. Meridian Corporation does not undertake to update any forward- looking statement whether written or oral, that may be made from time to time by Meridian Corporation or by or on behalf of Meridian Bank. |
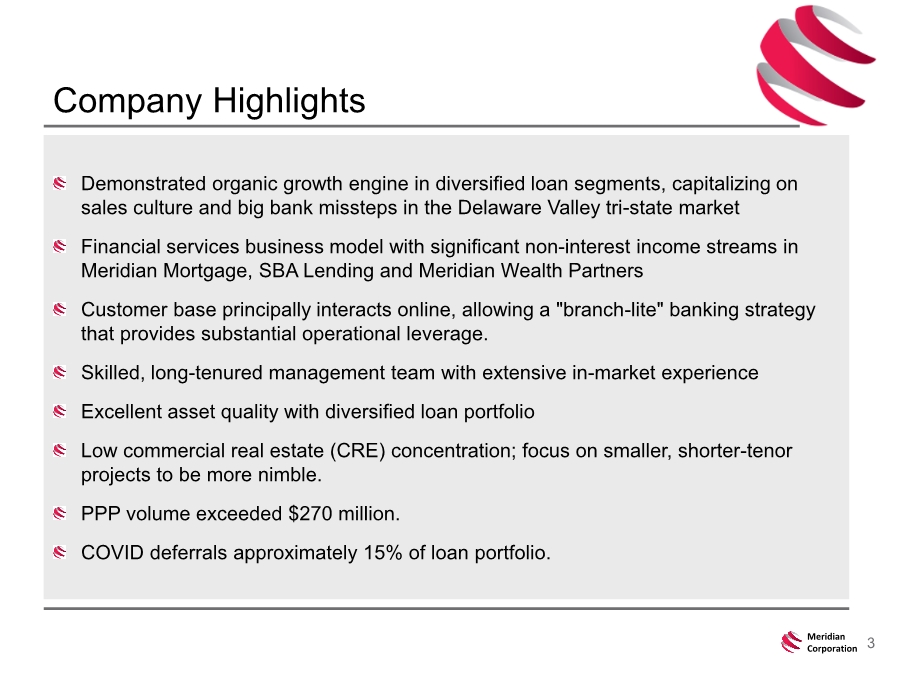
| 3 Meridian Corporation Company Highlights Demonstrated organic growth engine in diversified loan segments, capitalizing on sales culture and big bank missteps in the Delaware Valley tri-state market Financial services business model with significant non-interest income streams in Meridian Mortgage, SBA Lending and Meridian Wealth Partners Customer base principally interacts online, allowing a "branch-lite" banking strategy that provides substantial operational leverage. Skilled, long-tenured management team with extensive in-market experience Excellent asset quality with diversified loan portfolio Low commercial real estate (CRE) concentration; focus on smaller, shorter-tenor projects to be more nimble. PPP volume exceeded $270 million. COVID deferrals approximately 15% of loan portfolio. |
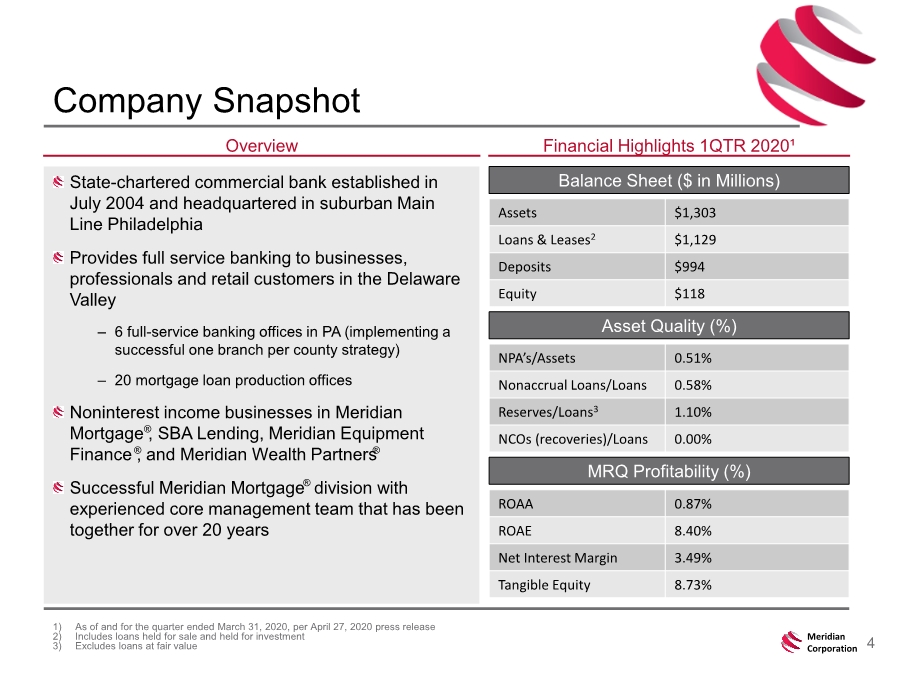
| 4 Meridian Corporation Company Snapshot 1) As of and for the quarter ended March 31, 2020, per April 27, 2020 press release 2) Includes loans held for sale and held for investment 3) Excludes loans at fair value Overview Financial Highlights 1QTR 2020¹ Balance Sheet ($ in Millions) Asset Quality (%) MRQ Profitability (%) Assets $1,303 Loans & Leases2 $1,129 Deposits $994 Equity $118 NPA’s/Assets 0.51% Nonaccrual Loans/Loans 0.58% Reserves/Loans3 1.10% NCOs (recoveries)/Loans 0.00% ROAA 0.87% ROAE 8.40% Net Interest Margin 3.49% Tangible Equity 8.73% State-chartered commercial bank established in July 2004 and headquartered in suburban Main Line Philadelphia Provides full service banking to businesses, professionals and retail customers in the Delaware Valley – 6 full-service banking offices in PA (implementing a successful one branch per county strategy) – 20 mortgage loan production offices Noninterest income businesses in Meridian Mortgage , SBA Lending, Meridian Equipment Finance , and Meridian Wealth Partners Successful Meridian Mortgage division with experienced core management team that has been together for over 20 years ® ® ® ® |
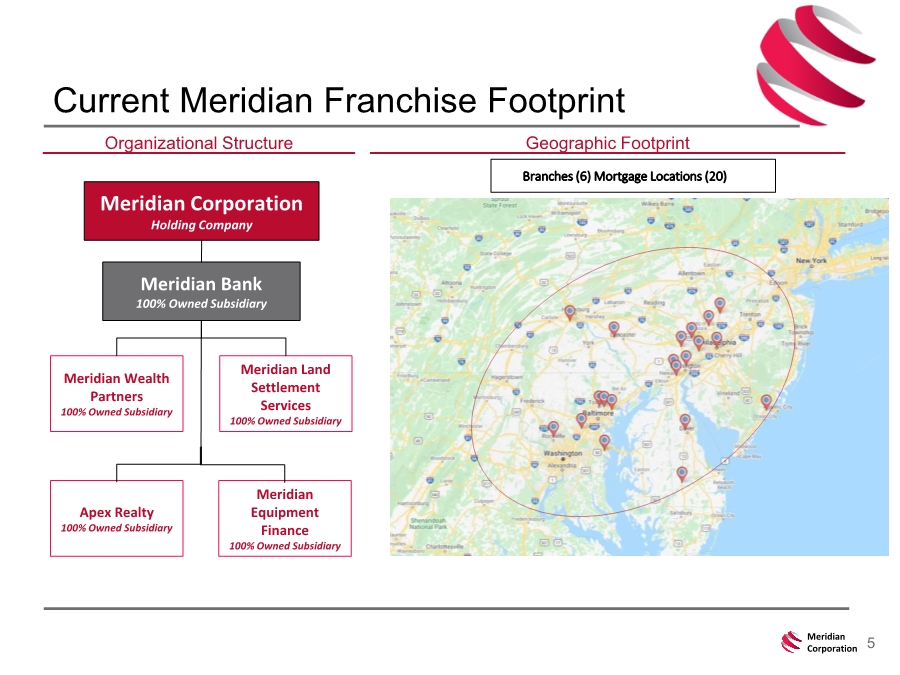
| 5 Meridian Corporation Current Meridian Franchise Footprint Geographic Footprint Meridian Corporation Holding Company Meridian Bank 100% Owned Subsidiary Organizational Structure Meridian Wealth Partners 100% Owned Subsidiary Apex Realty 100% Owned Subsidiary Meridian Land Settlement Services 100% Owned Subsidiary Branches (6) Mortgage Locations (20) Meridian Equipment Finance 100% Owned Subsidiary |
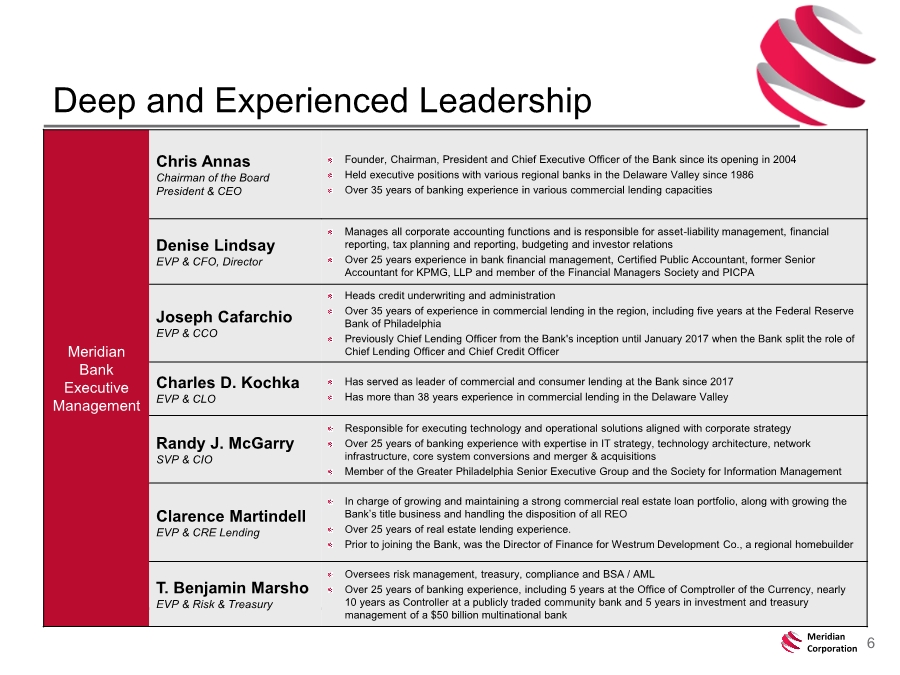
| 6 Meridian Corporation Deep and Experienced Leadership Meridian Bank Executive Management Chris Annas Chairman of the Board President & CEO Founder, Chairman, President and Chief Executive Officer of the Bank since its opening in 2004 Held executive positions with various regional banks in the Delaware Valley since 1986 Over 35 years of banking experience in various commercial lending capacities Denise Lindsay EVP & CFO, Director Manages all corporate accounting functions and is responsible for asset-liability management, financial reporting, tax planning and reporting, budgeting and investor relations Over 25 years experience in bank financial management, Certified Public Accountant, former Senior Accountant for KPMG, LLP and member of the Financial Managers Society and PICPA Joseph Cafarchio EVP & CCO Heads credit underwriting and administration Over 35 years of experience in commercial lending in the region, including five years at the Federal Reserve Bank of Philadelphia Previously Chief Lending Officer from the Bank's inception until January 2017 when the Bank split the role of Chief Lending Officer and Chief Credit Officer Charles D. Kochka EVP & CLO Has served as leader of commercial and consumer lending at the Bank since 2017 Has more than 38 years experience in commercial lending in the Delaware Valley Randy J. McGarry SVP & CIO Responsible for executing technology and operational solutions aligned with corporate strategy Over 25 years of banking experience with expertise in IT strategy, technology architecture, network infrastructure, core system conversions and merger & acquisitions Member of the Greater Philadelphia Senior Executive Group and the Society for Information Management Clarence Martindell EVP & CRE Lending In charge of growing and maintaining a strong commercial real estate loan portfolio, along with growing the Bank’s title business and handling the disposition of all REO Over 25 years of real estate lending experience. Prior to joining the Bank, was the Director of Finance for Westrum Development Co., a regional homebuilder T. Benjamin Marsho EVP & Risk & Treasury Oversees risk management, treasury, compliance and BSA / AML Over 25 years of banking experience, including 5 years at the Office of Comptroller of the Currency, nearly 10 years as Controller at a publicly traded community bank and 5 years in investment and treasury management of a $50 billion multinational bank |
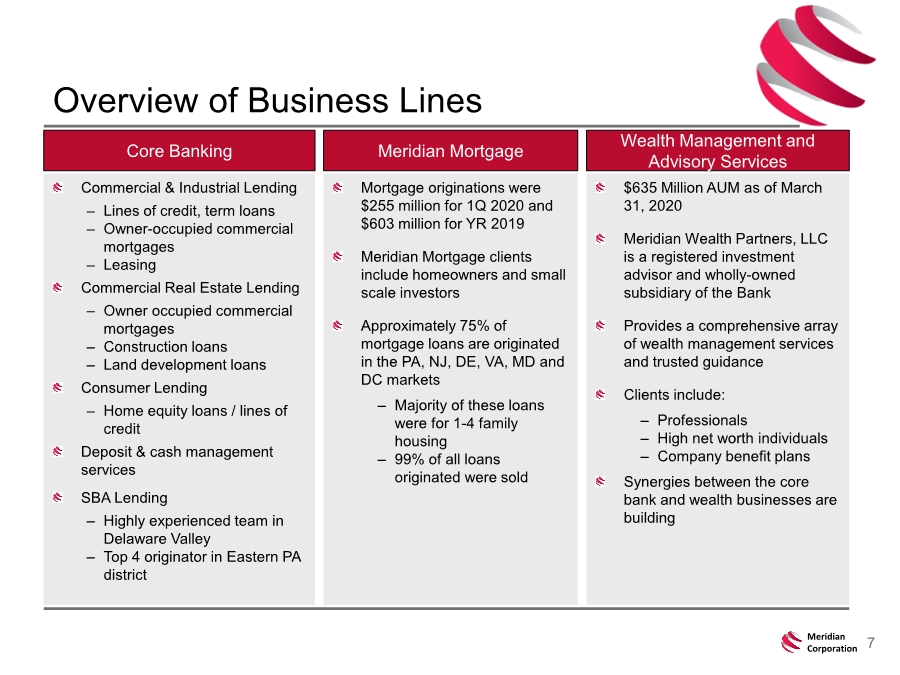
| 7 Meridian Corporation Overview of Business Lines Commercial & Industrial Lending – Lines of credit, term loans – Owner-occupied commercial mortgages – Leasing Commercial Real Estate Lending – Owner occupied commercial mortgages – Construction loans – Land development loans Consumer Lending – Home equity loans / lines of credit Deposit & cash management services SBA Lending – Highly experienced team in Delaware Valley – Top 4 originator in Eastern PA district Core Banking Meridian Mortgage Wealth Management and Advisory Services Mortgage originations were $255 million for 1Q 2020 and $603 million for YR 2019 Meridian Mortgage clients include homeowners and small scale investors Approximately 75% of mortgage loans are originated in the PA, NJ, DE, VA, MD and DC markets – Majority of these loans were for 1-4 family housing – 99% of all loans originated were sold $635 Million AUM as of March 31, 2020 Meridian Wealth Partners, LLC is a registered investment advisor and wholly-owned subsidiary of the Bank Provides a comprehensive array of wealth management services and trusted guidance Clients include: – Professionals – High net worth individuals – Company benefit plans Synergies between the core bank and wealth businesses are building |
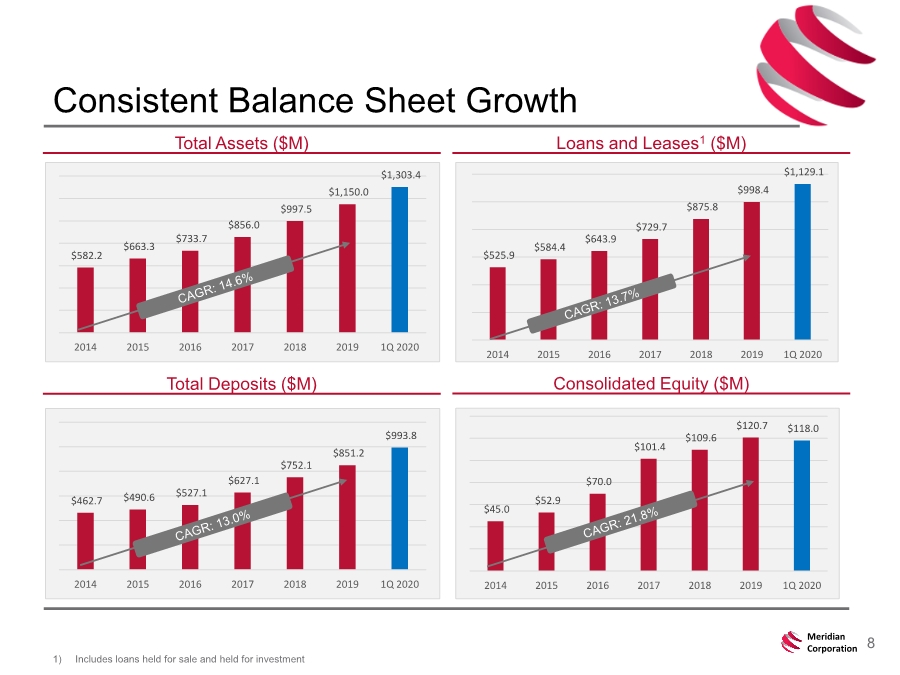
| 8 Meridian Corporation Consistent Balance Sheet Growth 1) Includes loans held for sale and held for investment Total Assets ($M) Loans and Leases1 ($M) Total Deposits ($M) Consolidated Equity ($M) $582.2 $663.3 $733.7 $856.0 $997.5 $1,150.0 $1,303.4 2014 2015 2016 2017 2018 2019 1Q 2020 $525.9 $584.4 $643.9 $729.7 $875.8 $998.4 $1,129.1 2014 2015 2016 2017 2018 2019 1Q 2020 $462.7 $490.6 $527.1 $627.1 $752.1 $851.2 $993.8 2014 2015 2016 2017 2018 2019 1Q 2020 $45.0 $52.9 $70.0 $101.4 $109.6 $120.7 $118.0 2014 2015 2016 2017 2018 2019 1Q 2020 |
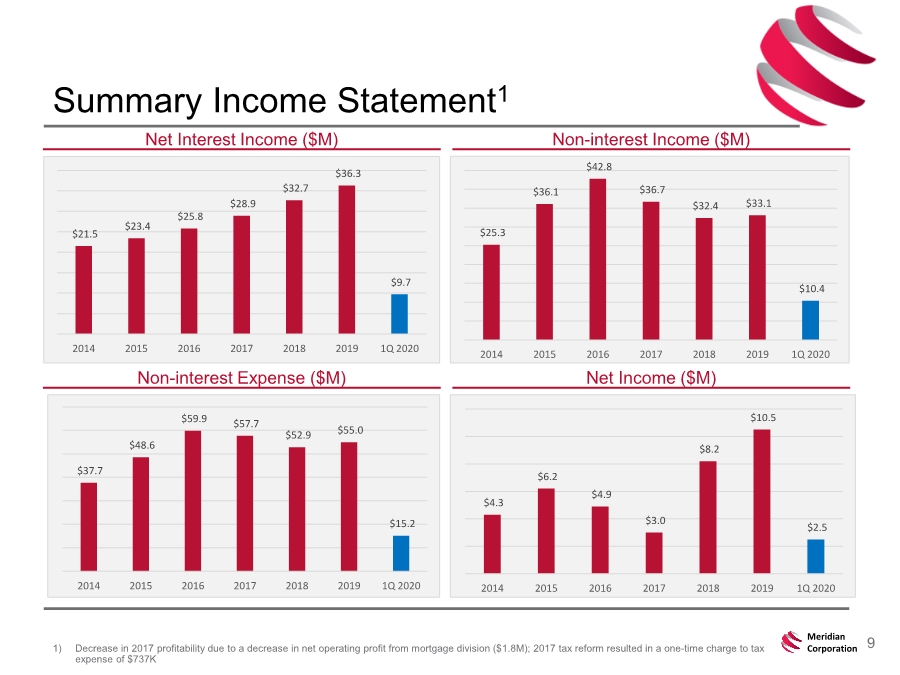
| 9 Meridian Corporation Summary Income Statement1 1) Decrease in 2017 profitability due to a decrease in net operating profit from mortgage division ($1.8M); 2017 tax reform resulted in a one-time charge to tax expense of $737K Net Interest Income ($M) Non-interest Income ($M) Non-interest Expense ($M) Net Income ($M) $21.5 $23.4 $25.8 $28.9 $32.7 $36.3 $9.7 2014 2015 2016 2017 2018 2019 1Q 2020 $25.3 $36.1 $42.8 $36.7 $32.4 $33.1 $10.4 2014 2015 2016 2017 2018 2019 1Q 2020 $37.7 $48.6 $59.9 $57.7 $52.9 $55.0 $15.2 2014 2015 2016 2017 2018 2019 1Q 2020 $4.3 $6.2 $4.9 $3.0 $8.2 $10.5 $2.5 2014 2015 2016 2017 2018 2019 1Q 2020 |
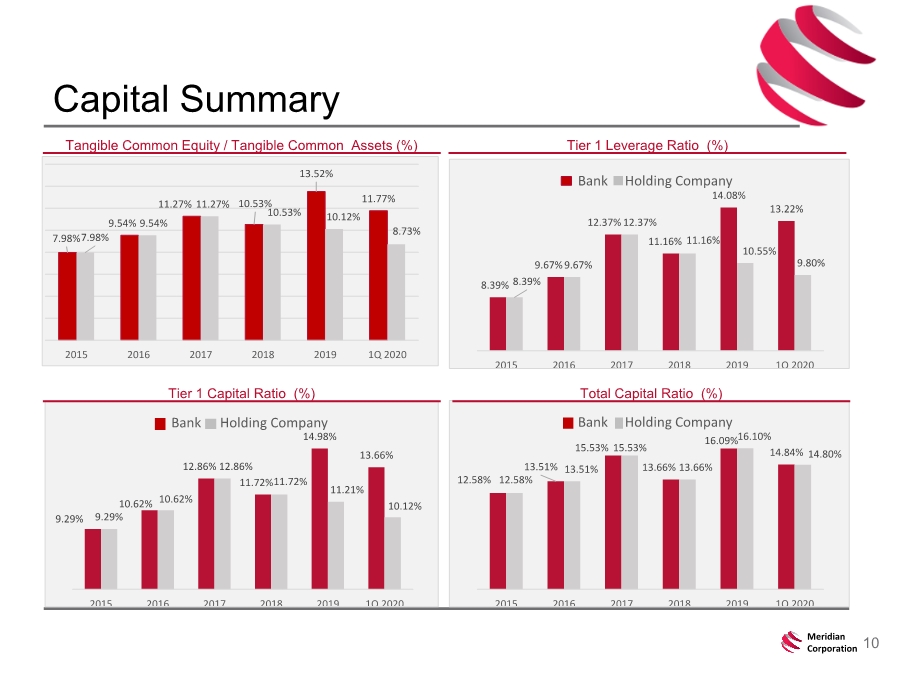
| 10 Meridian Corporation Capital Summary Tangible Common Equity / Tangible Common Assets (%) 7.98% 9.54% 11.27% 10.53% 13.52% 11.77% 7.98% 9.54% 11.27% 10.53% 10.12% 8.73% 2015 2016 2017 2018 2019 1Q 2020 8.39% 9.67% 12.37% 11.16% 14.08% 13.22% 8.39% 9.67% 12.37% 11.16% 10.55% 9.80% 2015 2016 2017 2018 2019 1Q 2020 Bank Holding Company Tier 1 Leverage Ratio (%) 9.29% 10.62% 12.86% 11.72% 14.98% 13.66% 9.29% 10.62% 12.86% 11.72% 11.21% 10.12% 2015 2016 2017 2018 2019 1Q 2020 Bank Holding Company 12.58% 13.51% 15.53% 13.66% 16.09% 14.84% 12.58% 13.51% 15.53% 13.66% 16.10% 14.80% 2015 2016 2017 2018 2019 1Q 2020 Bank Holding Company Tier 1 Capital Ratio (%) Total Capital Ratio (%) |
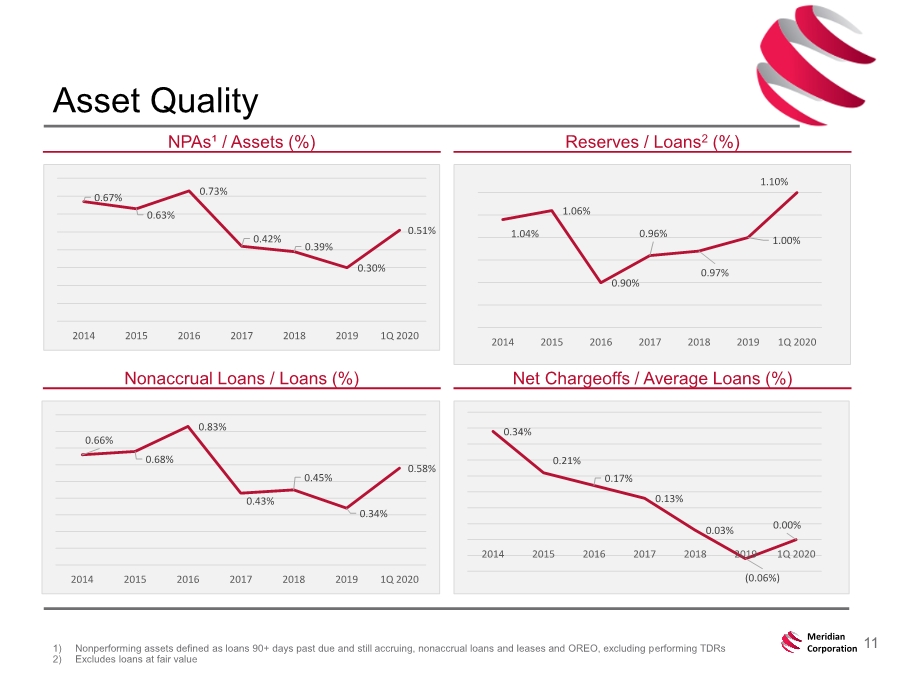
| 11 Meridian Corporation Asset Quality 1) Nonperforming assets defined as loans 90+ days past due and still accruing, nonaccrual loans and leases and OREO, excluding performing TDRs 2) Excludes loans at fair value NPAs¹ / Assets (%) Reserves / Loans2 (%) Nonaccrual Loans / Loans (%) Net Chargeoffs / Average Loans (%) 1.04% 1.06% 0.90% 0.96% 0.97% 1.00% 1.10% 2014 2015 2016 2017 2018 2019 1Q 2020 0.66% 0.68% 0.83% 0.43% 0.45% 0.34% 0.58% 2014 2015 2016 2017 2018 2019 1Q 2020 0.34% 0.21% 0.17% 0.13% 0.03% (0.06%) 0.00% 2014 2015 2016 2017 2018 2019 1Q 2020 0.67% 0.63% 0.73% 0.42% 0.39% 0.30% 0.51% 2014 2015 2016 2017 2018 2019 1Q 2020 |
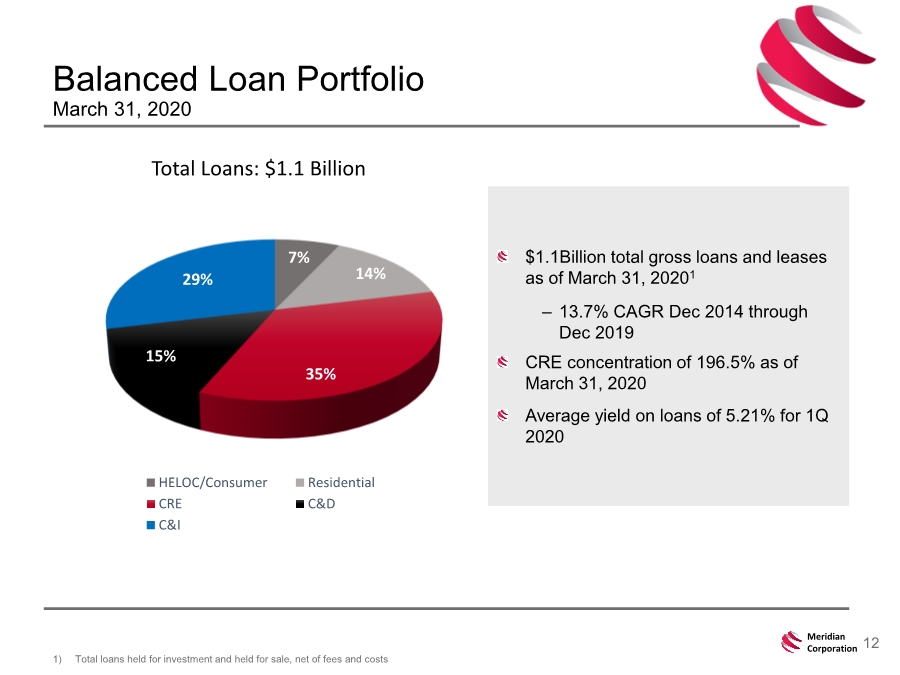
| 12 Meridian Corporation $1.1Billion total gross loans and leases as of March 31, 20201 – 13.7% CAGR Dec 2014 through Dec 2019 CRE concentration of 196.5% as of March 31, 2020 Average yield on loans of 5.21% for 1Q 2020 Balanced Loan Portfolio March 31, 2020 1) Total loans held for investment and held for sale, net of fees and costs Total Loans: $1.1 Billion 7% 14% 35% 15% 29% HELOC/Consumer Residential CRE C&D C&I |
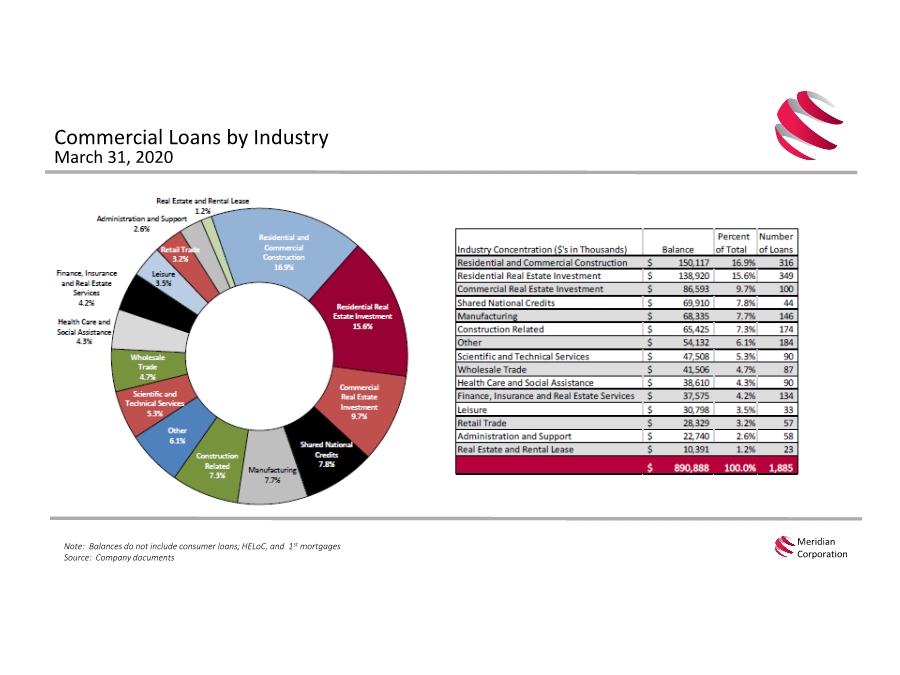
| Commercial Loans by Industry March 31, 2020 Meridian Corporation Note: Balances do not include consumer loans; HELoC, and 1st mortgages Source: Company documents |
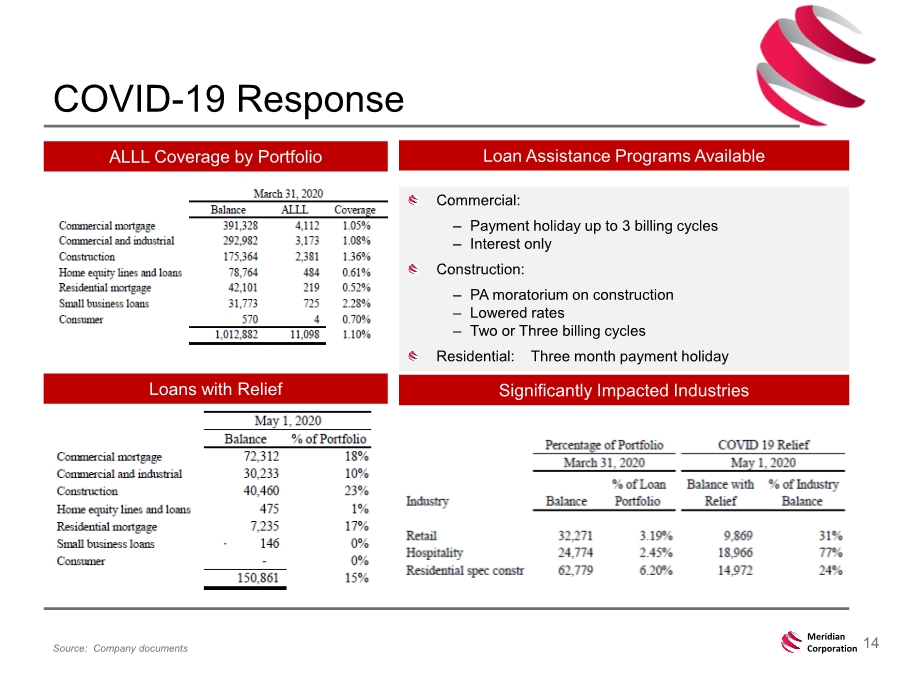
| 14 Meridian Corporation COVID-19 Response Source: Company documents Commercial: – Payment holiday up to 3 billing cycles – Interest only Construction: – PA moratorium on construction – Lowered rates – Two or Three billing cycles Residential: Three month payment holiday Loan Assistance Programs Available Significantly Impacted Industries ALLL Coverage by Portfolio Loans with Relief |
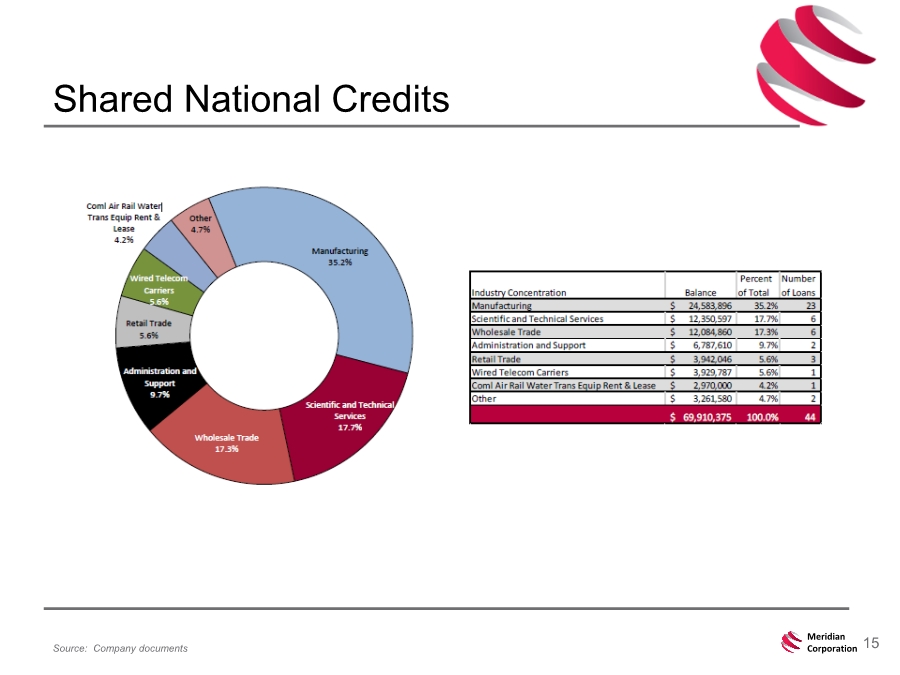
| 15 Meridian Corporation Shared National Credits Source: Company documents |
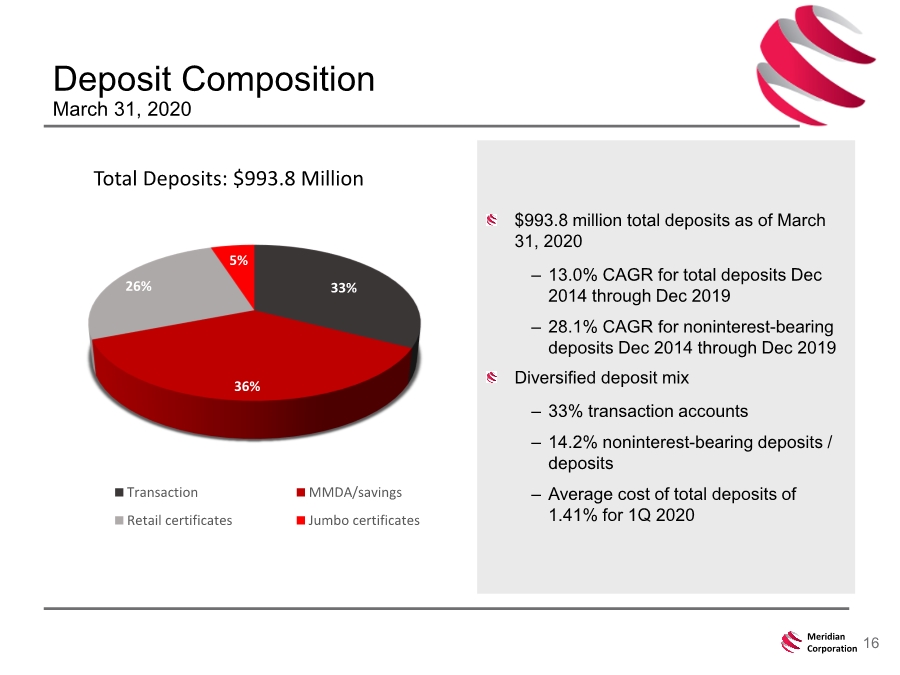
| 16 Meridian Corporation $993.8 million total deposits as of March 31, 2020 – 13.0% CAGR for total deposits Dec 2014 through Dec 2019 – 28.1% CAGR for noninterest-bearing deposits Dec 2014 through Dec 2019 Diversified deposit mix – 33% transaction accounts – 14.2% noninterest-bearing deposits / deposits – Average cost of total deposits of 1.41% for 1Q 2020 Deposit Composition March 31, 2020 Total Deposits: $993.8 Million 33% 36% 26% 5% Transaction MMDA/savings Retail certificates Jumbo certificates |
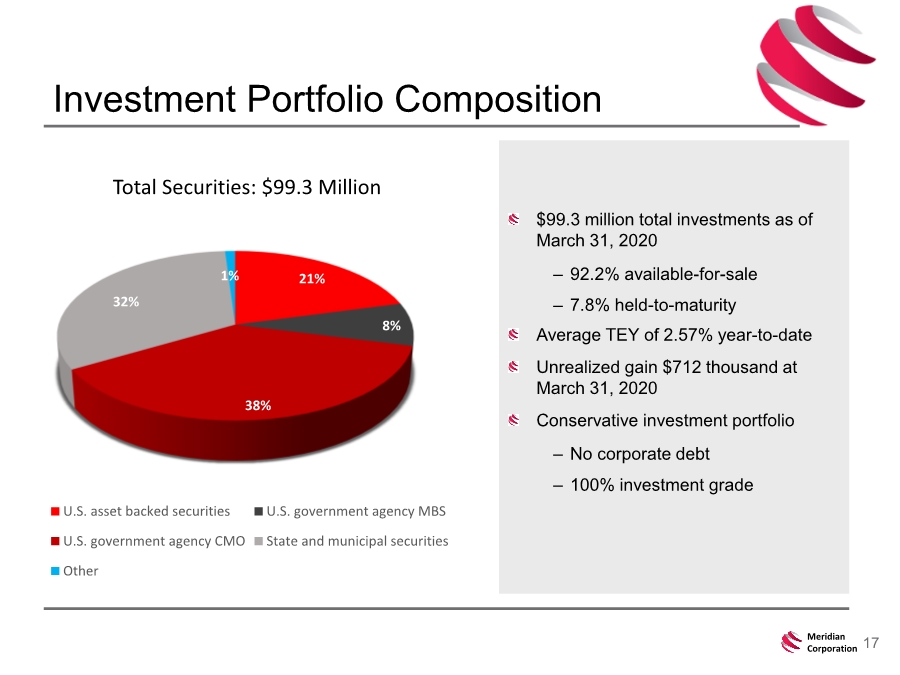
| 17 Meridian Corporation Investment Portfolio Composition $99.3 million total investments as of March 31, 2020 – 92.2% available-for-sale – 7.8% held-to-maturity Average TEY of 2.57% year-to-date Unrealized gain $712 thousand at March 31, 2020 Conservative investment portfolio – No corporate debt – 100% investment grade Total Securities: $99.3 Million 21% 8% 38% 32% 1% U.S. asset backed securities U.S. government agency MBS U.S. government agency CMO State and municipal securities Other |
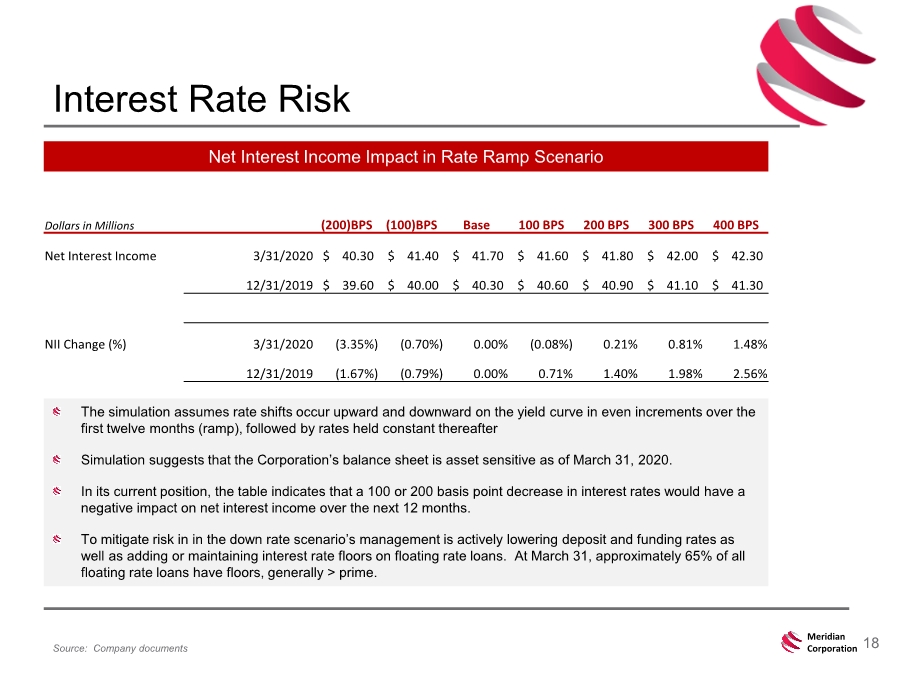
| 18 Meridian Corporation Interest Rate Risk Source: Company documents Dollars in Millions (200)BPS (100)BPS Base 100 BPS 200 BPS 300 BPS 400 BPS Net Interest Income 3/31/2020 $ 40.30 $ 41.40 $ 41.70 $ 41.60 $ 41.80 $ 42.00 $ 42.30 12/31/2019 $ 39.60 $ 40.00 $ 40.30 $ 40.60 $ 40.90 $ 41.10 $ 41.30 NII Change (%) 3/31/2020 (3.35%) (0.70%) 0.00% (0.08%) 0.21% 0.81% 1.48% 12/31/2019 (1.67%) (0.79%) 0.00% 0.71% 1.40% 1.98% 2.56% Net Interest Income Impact in Rate Ramp Scenario The simulation assumes rate shifts occur upward and downward on the yield curve in even increments over the first twelve months (ramp), followed by rates held constant thereafter Simulation suggests that the Corporation’s balance sheet is asset sensitive as of March 31, 2020. In its current position, the table indicates that a 100 or 200 basis point decrease in interest rates would have a negative impact on net interest income over the next 12 months. To mitigate risk in in the down rate scenario’s management is actively lowering deposit and funding rates as well as adding or maintaining interest rate floors on floating rate loans. At March 31, approximately 65% of all floating rate loans have floors, generally > prime. |
| 19 Meridian Corporation Appendix |
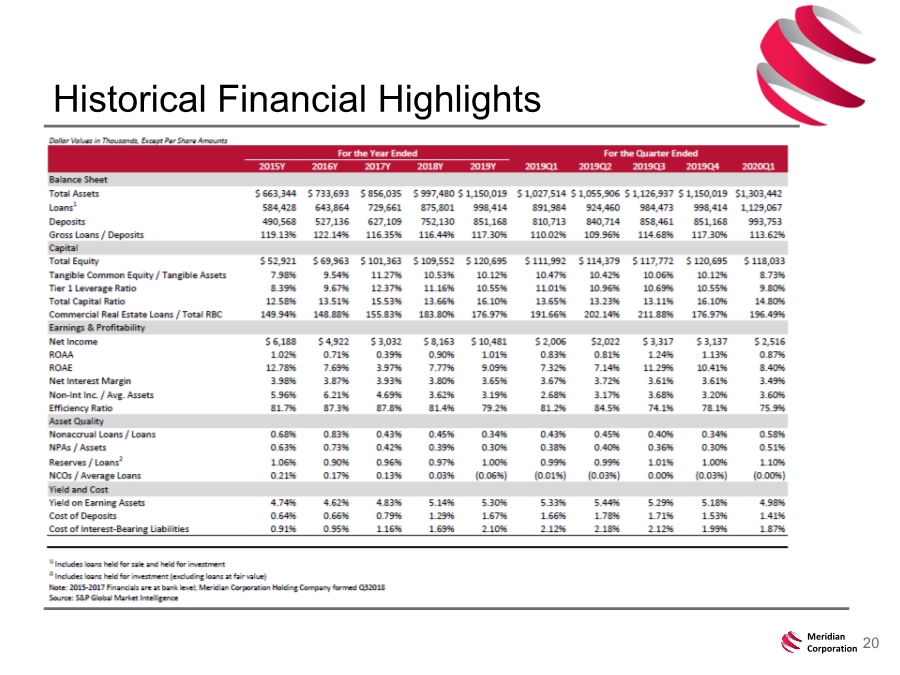
| 20 Meridian Corporation Historical Financial Highlights |
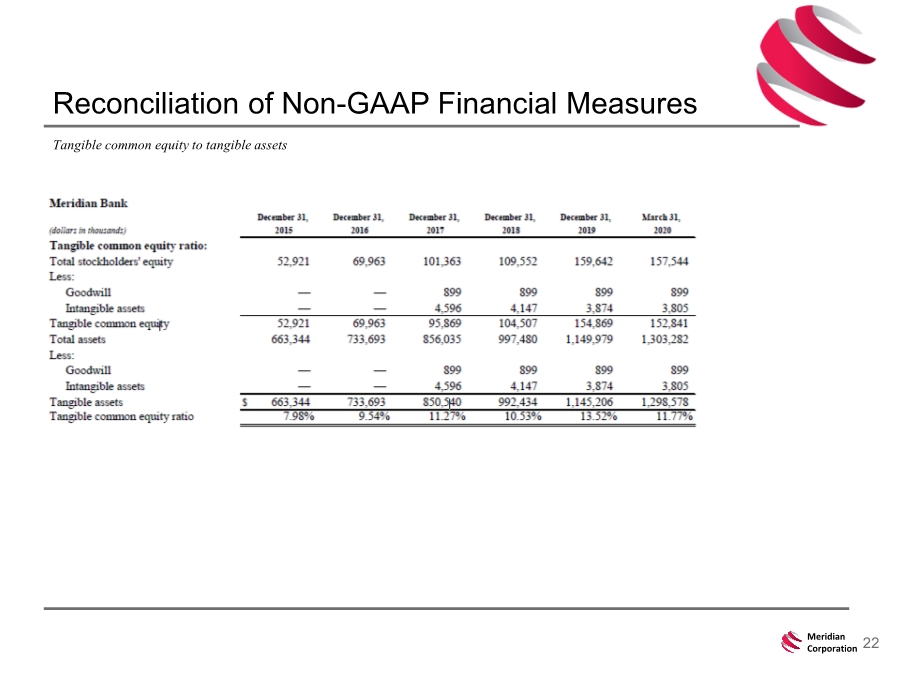
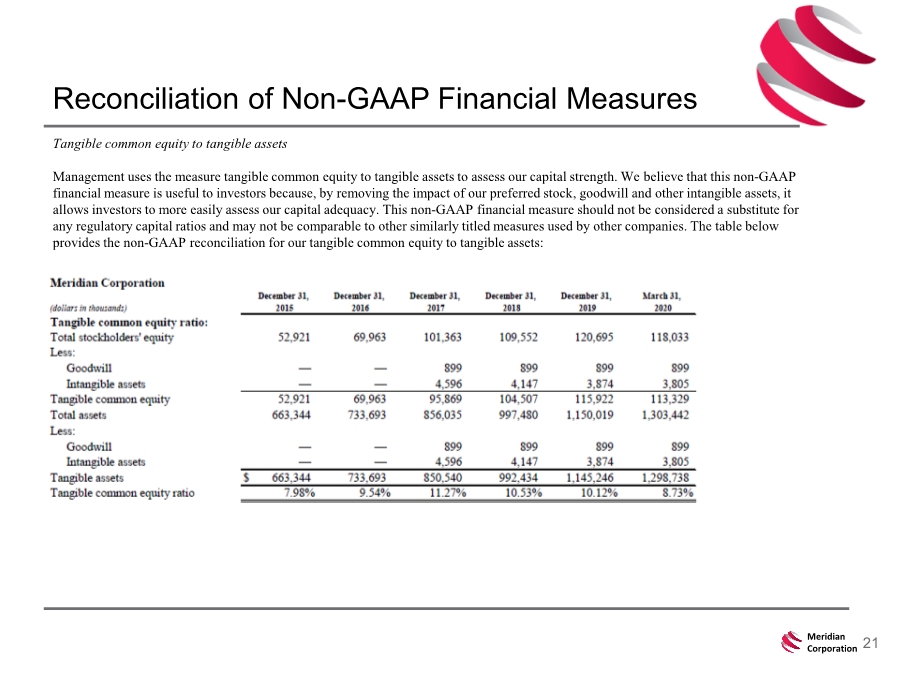
| 21 Meridian Corporation Reconciliation of Non-GAAP Financial Measures Tangible common equity to tangible assets Management uses the measure tangible common equity to tangible assets to assess our capital strength. We believe that this non-GAAP financial measure is useful to investors because, by removing the impact of our preferred stock, goodwill and other intangible assets, it allows investors to more easily assess our capital adequacy. This non-GAAP financial measure should not be considered a substitute for any regulatory capital ratios and may not be comparable to other similarly titled measures used by other companies. The table below provides the non-GAAP reconciliation for our tangible common equity to tangible assets: |
| 22 Meridian Corporation Reconciliation of Non-GAAP Financial Measures Tangible common equity to tangible assets |